
Detection of Fittings Based on the Dynamic Graph CNN and U-Net Embedded with Bi-Level Routing Attention
Abstract
:1. Introduction
- A fittings inspection image dataset is constructed: The fittings dataset comprises 2563 inspection images that have been meticulously annotated using the LabelImg tool, encompassing seven distinct fittings component types. This comprehensive dataset, characterized by its diverse scenarios, ensures robust model training;
- The UD-Net detection network is proposed: First, an improved U-Net serves as the backbone for initial extraction of fittings features. Then, incorporating the Lite Mono algorithm and employing the dynamic graph CNN (DGCNN), we aim to detect and extract obscured fittings feature information;
- Enhanced U-Net: First, to improve the computational efficiency, the width of the U-Net is narrowed to reduce the parameter volume. Then, four attention modules are embedded to bolster the model’s feature extraction capability in complex backgrounds, addressing the issue of diminished target salience resulting from mutual occlusion among objects;
- Introduction of 3D-detection-driven 2D detection methods into the fittings detection field: First, the Lite mono algorithm is used to generate a depth image of the fittings, and then this depth map is combined with the corresponding RGB images to create a point cloud dataset. Finally, a 3D detection network is employed to capture features that may elude 2D detection algorithms, contributing to the final refinement of the results.
2. Related Works
2.1. U-Net
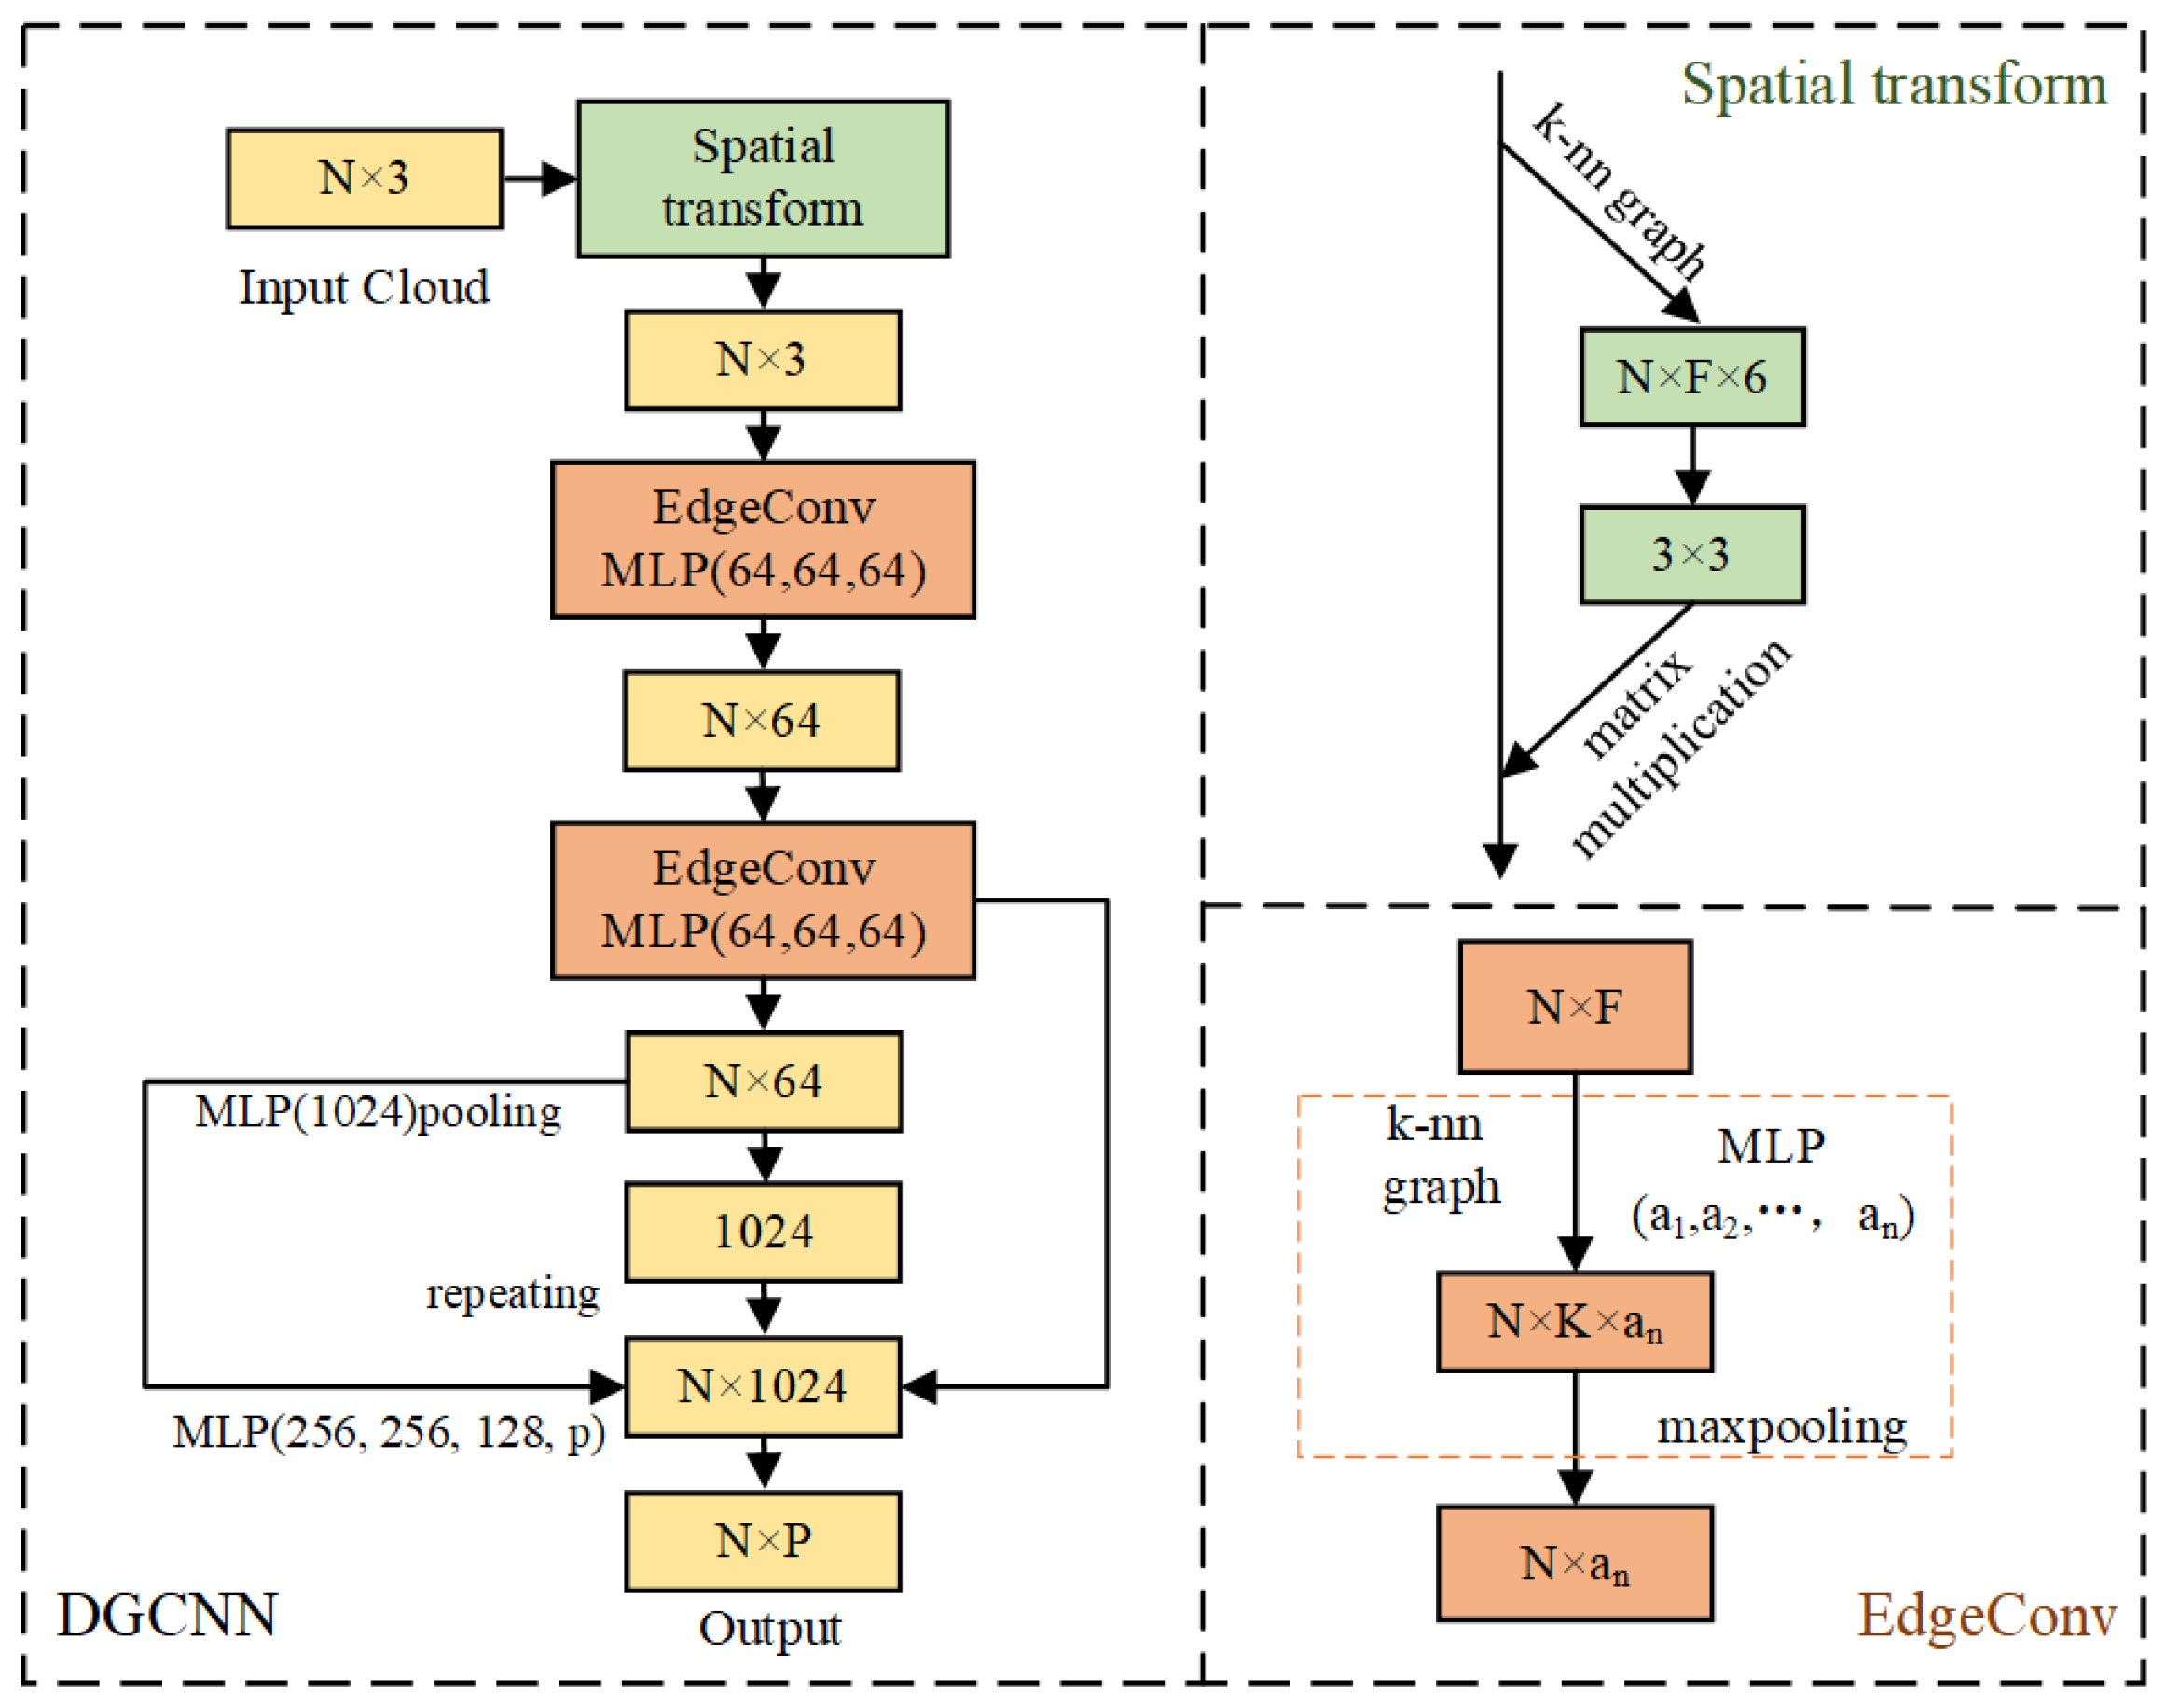
2.2. DGCNN
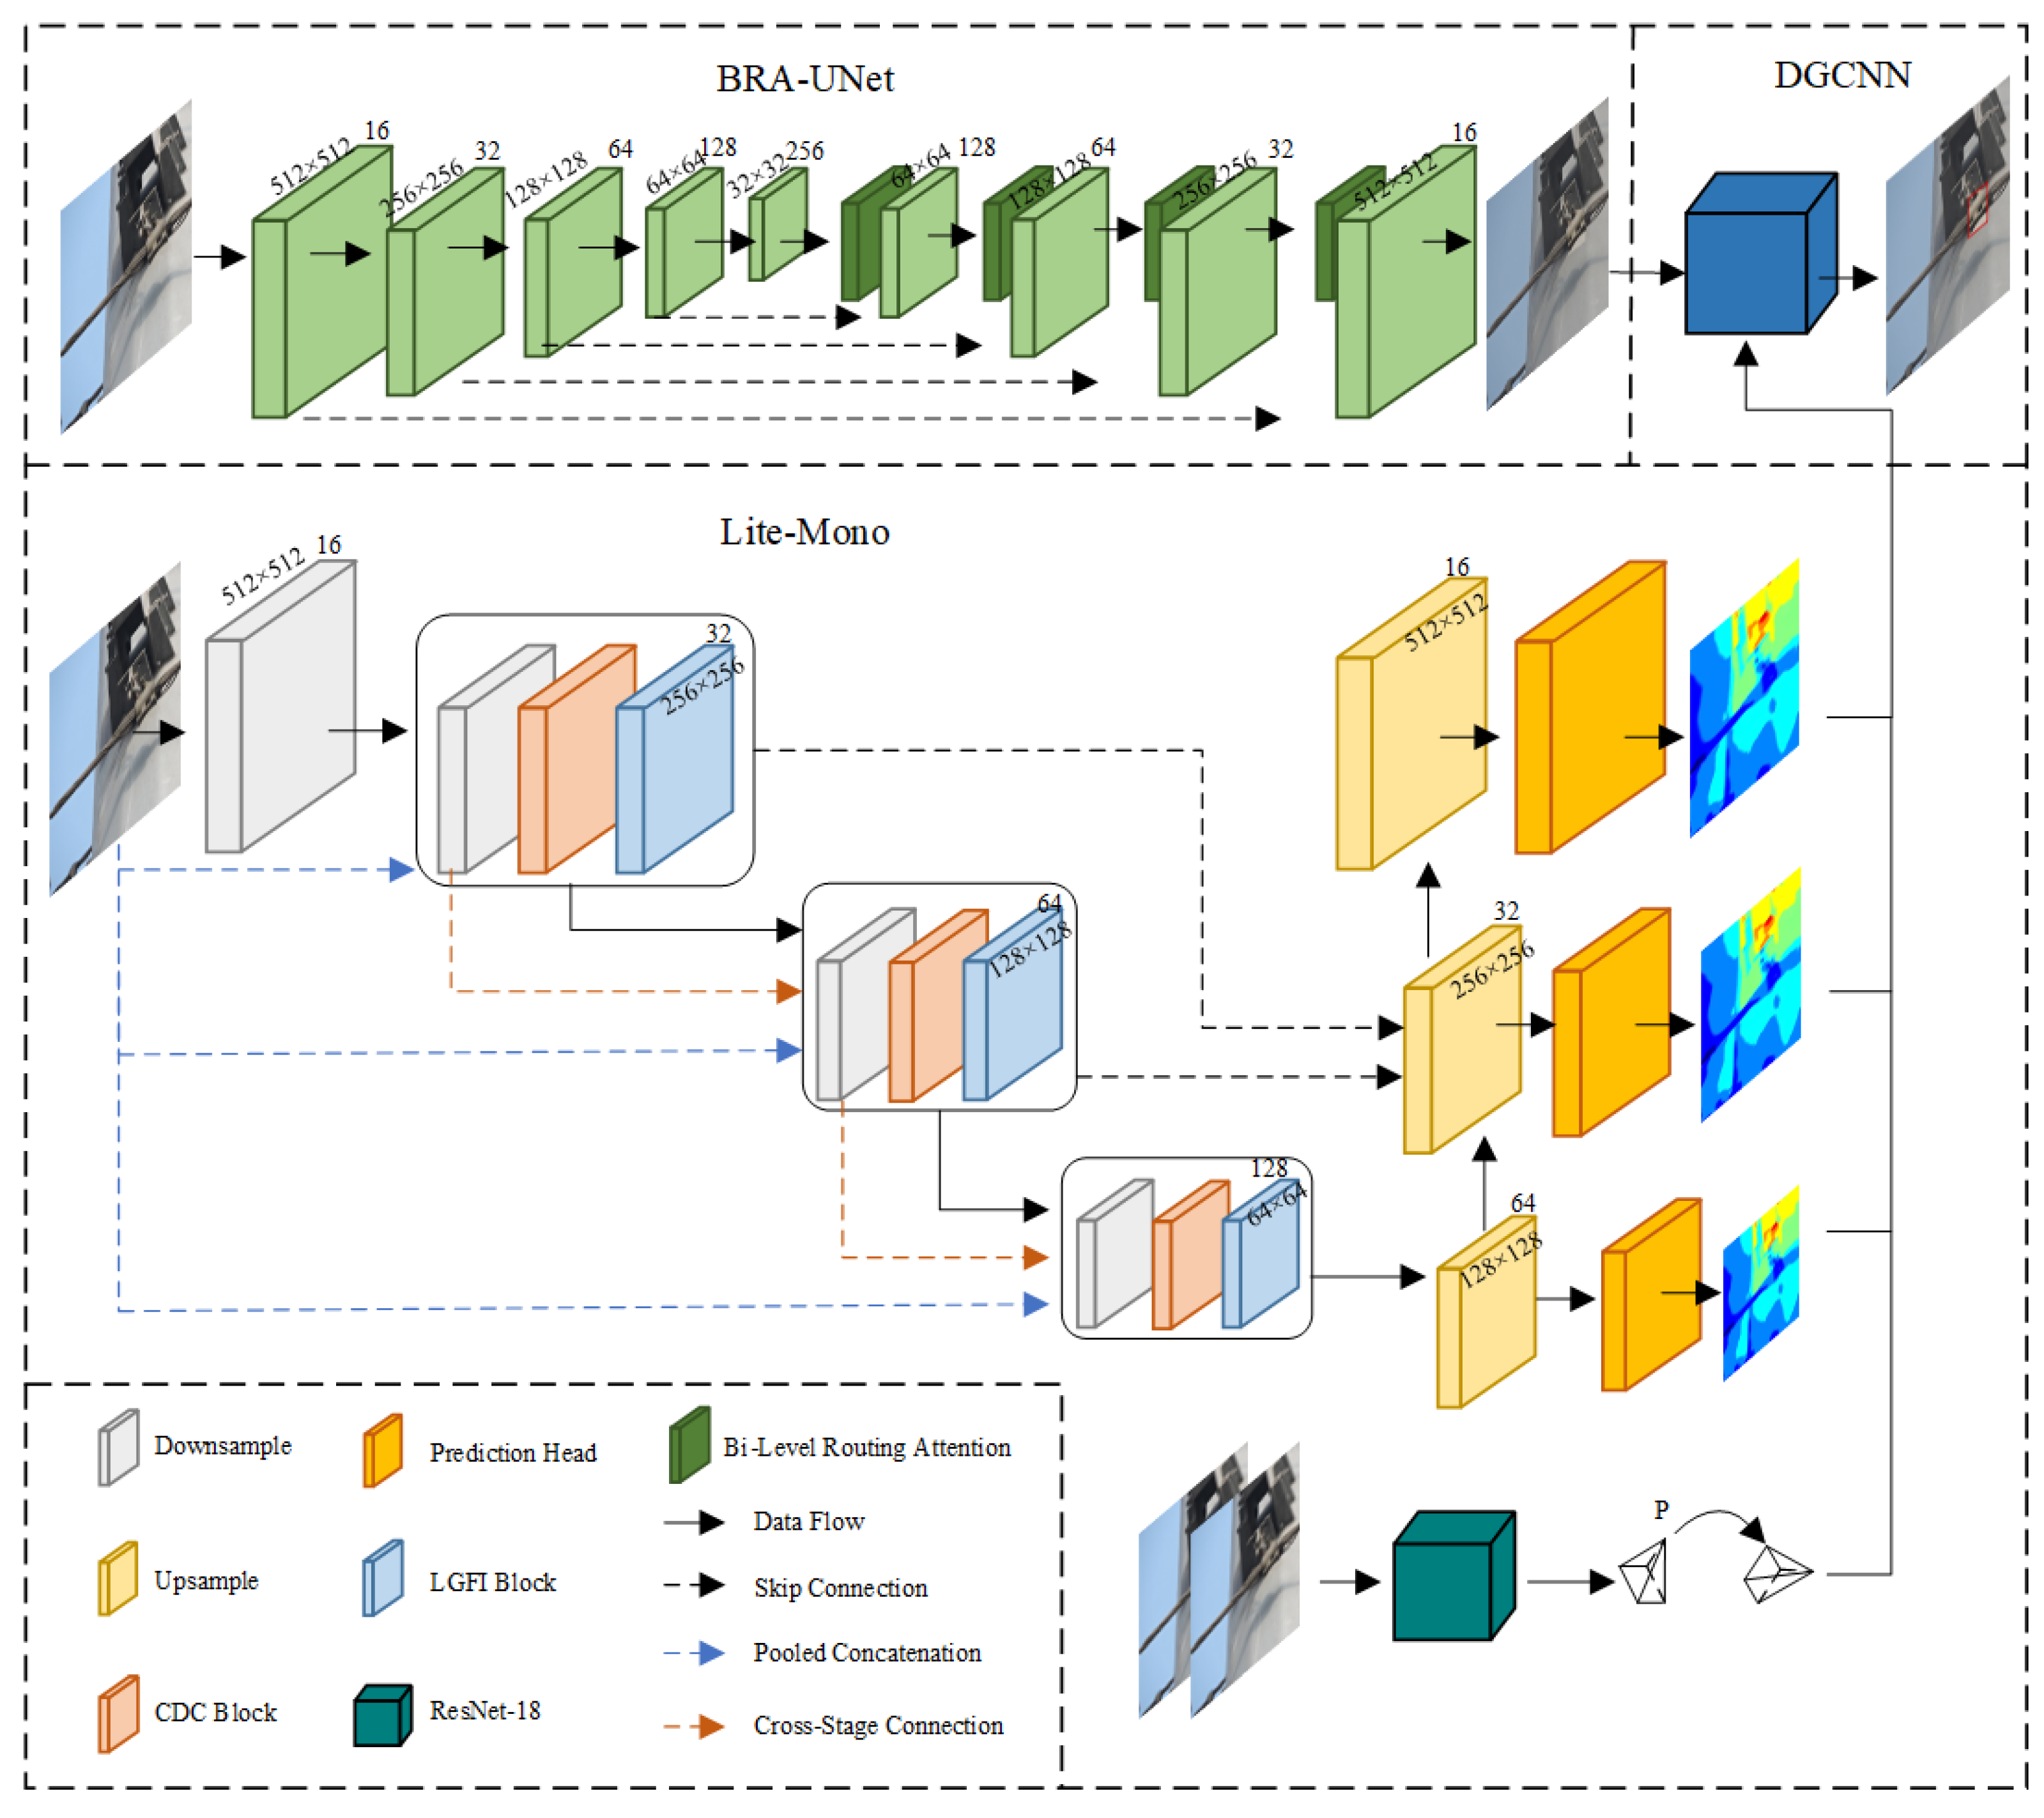
3. UD-Net
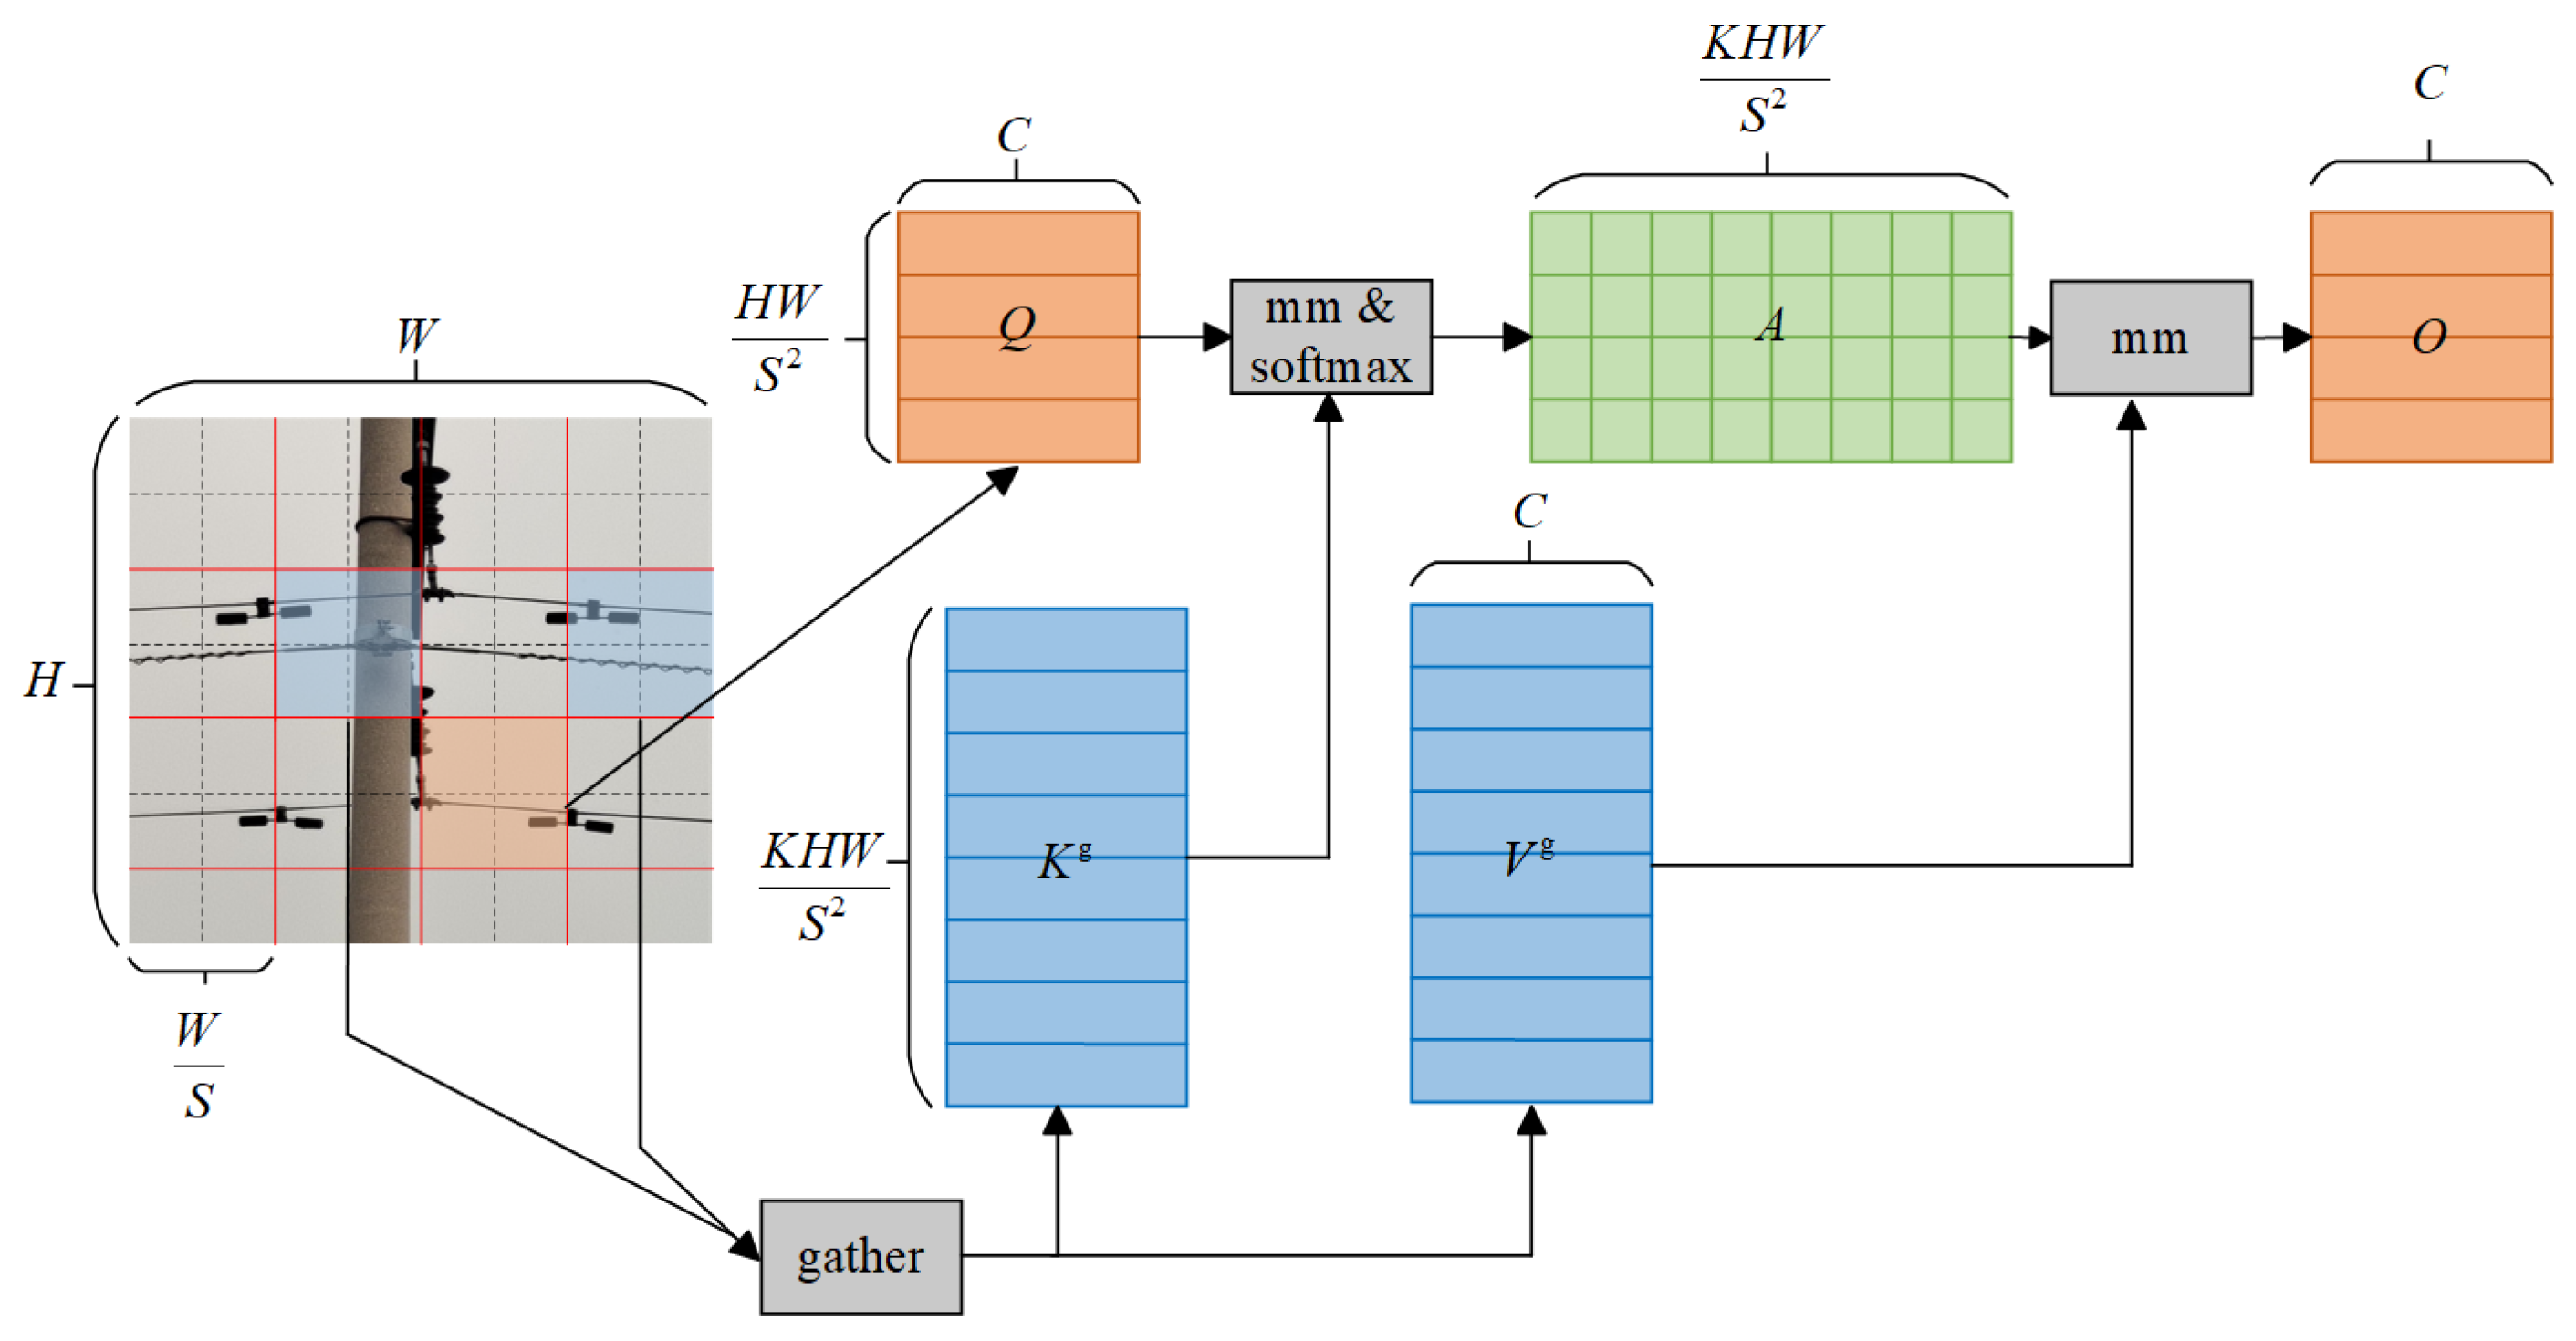
3.1. BRA-UNet
3.2. Depth Map Generation
3.3. 3D Object Bounding Box Prediction
3.4. Three-Dimensional-Detection-Driven 2D Detection
4. Results and Discussion
4.1. Implementation Details
4.2. Experimental Results
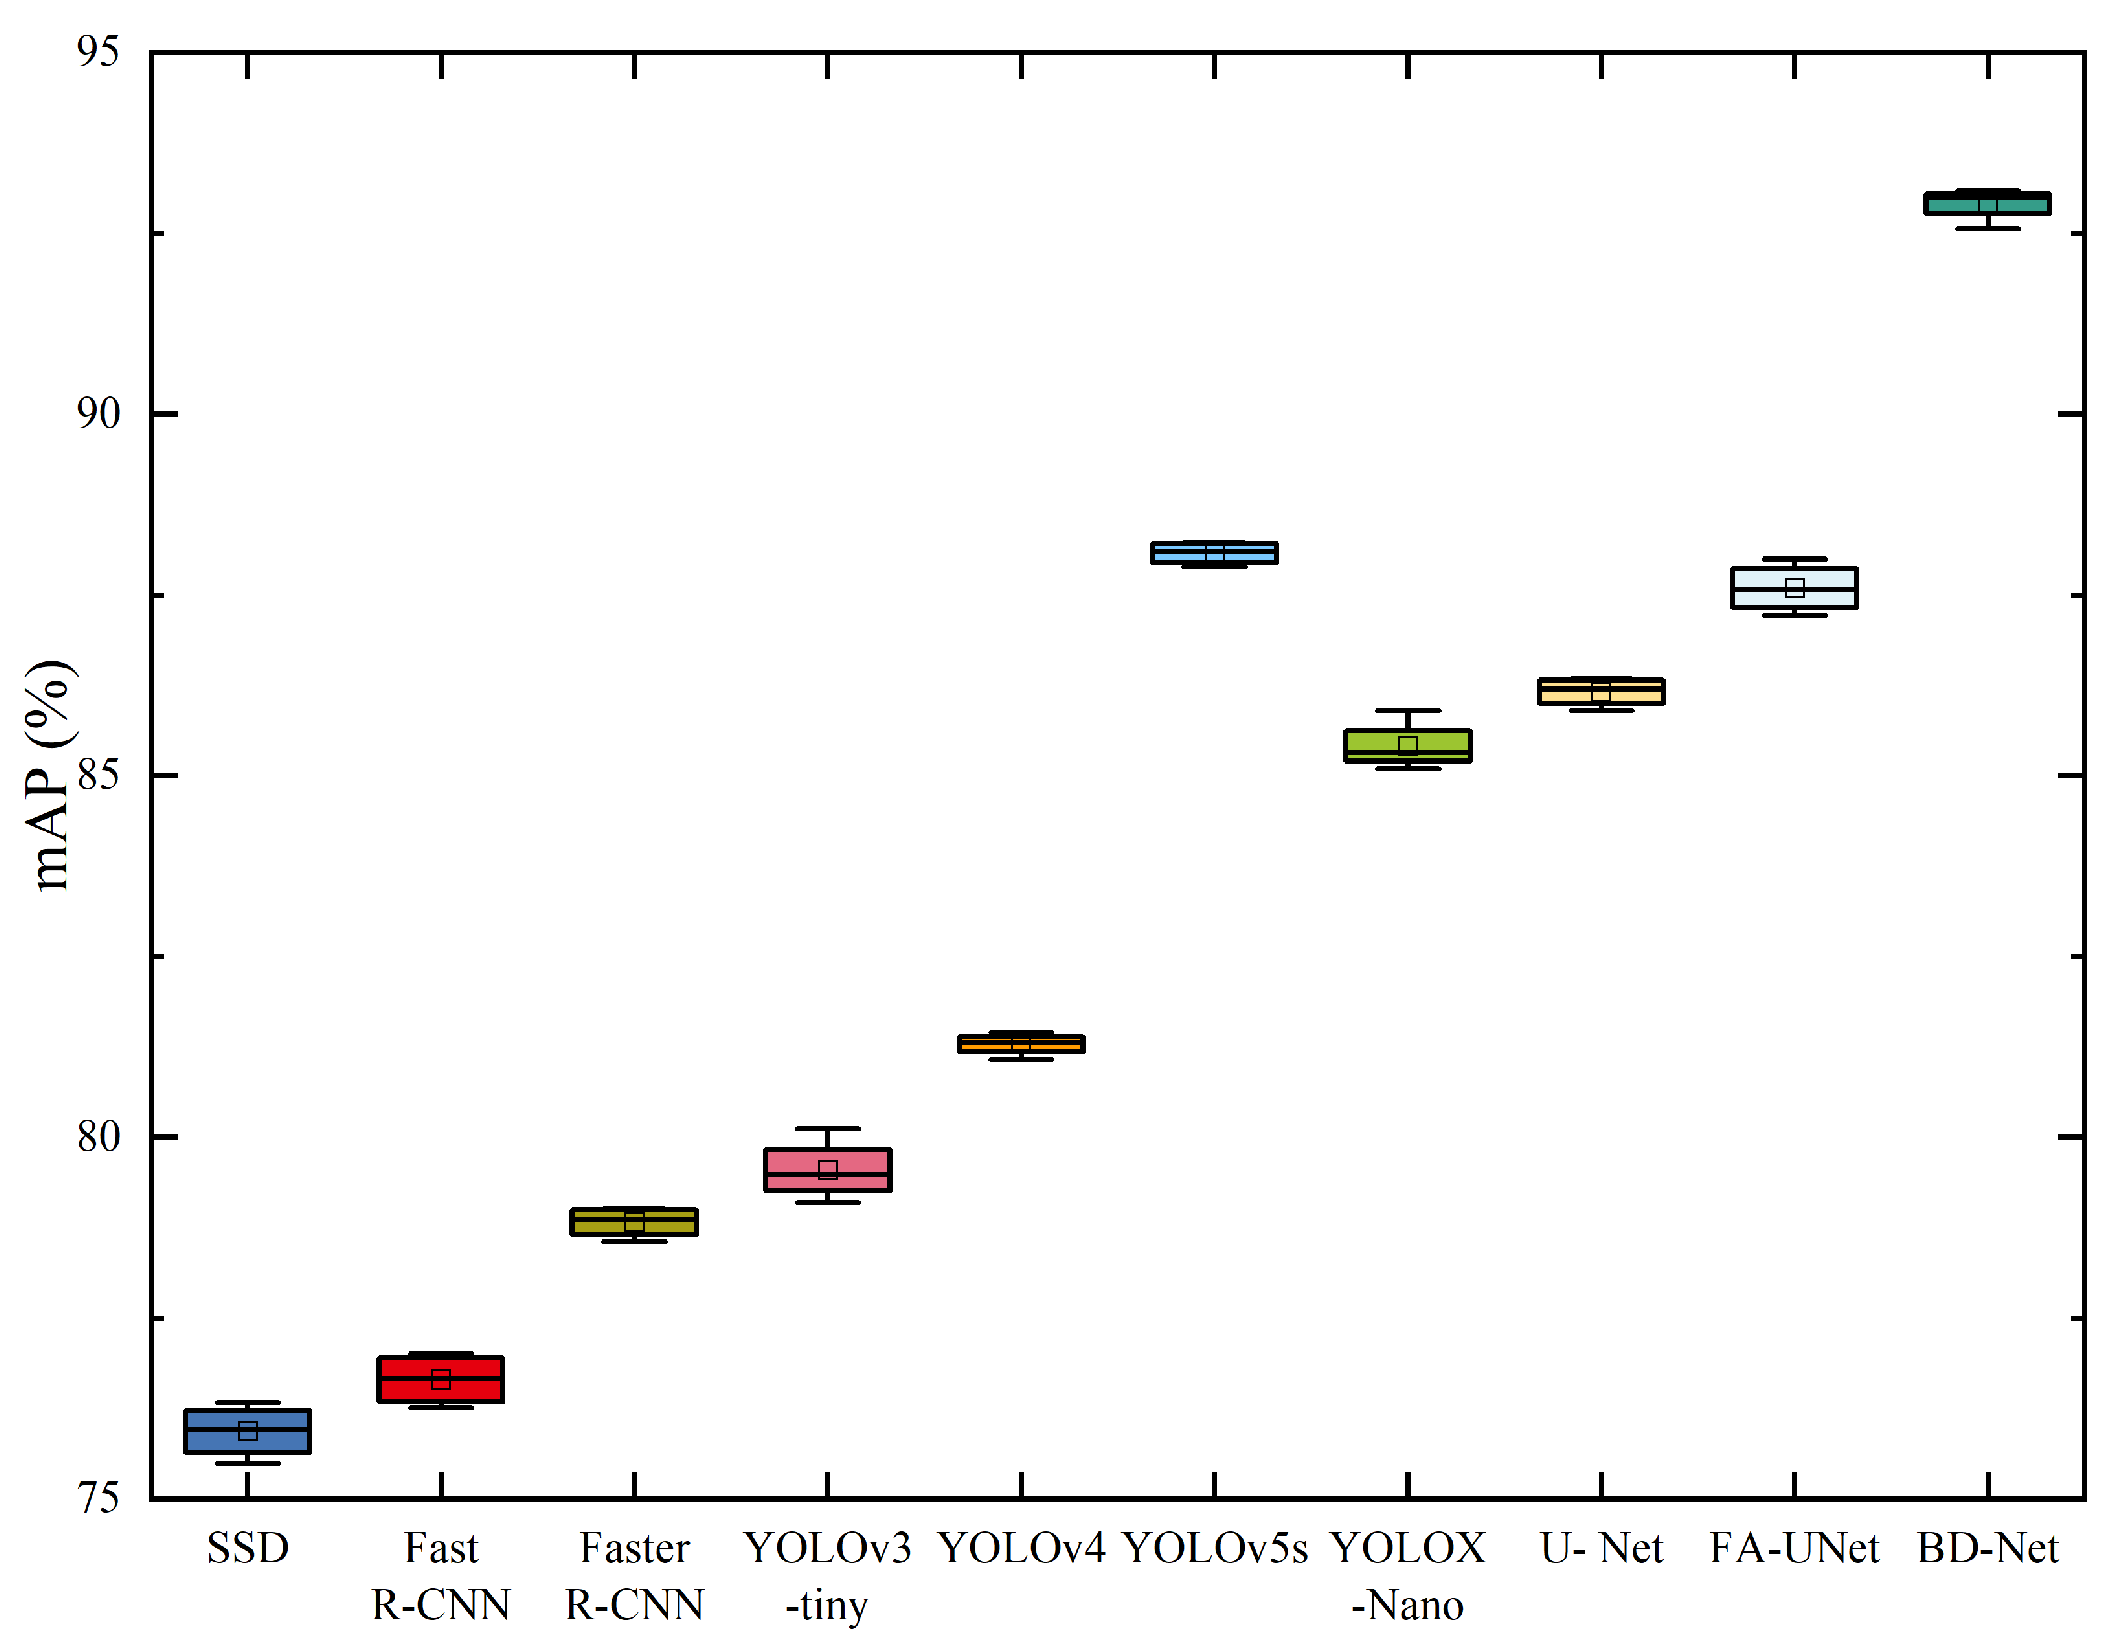
4.2.1. Comparison with State-of-the-Art Models
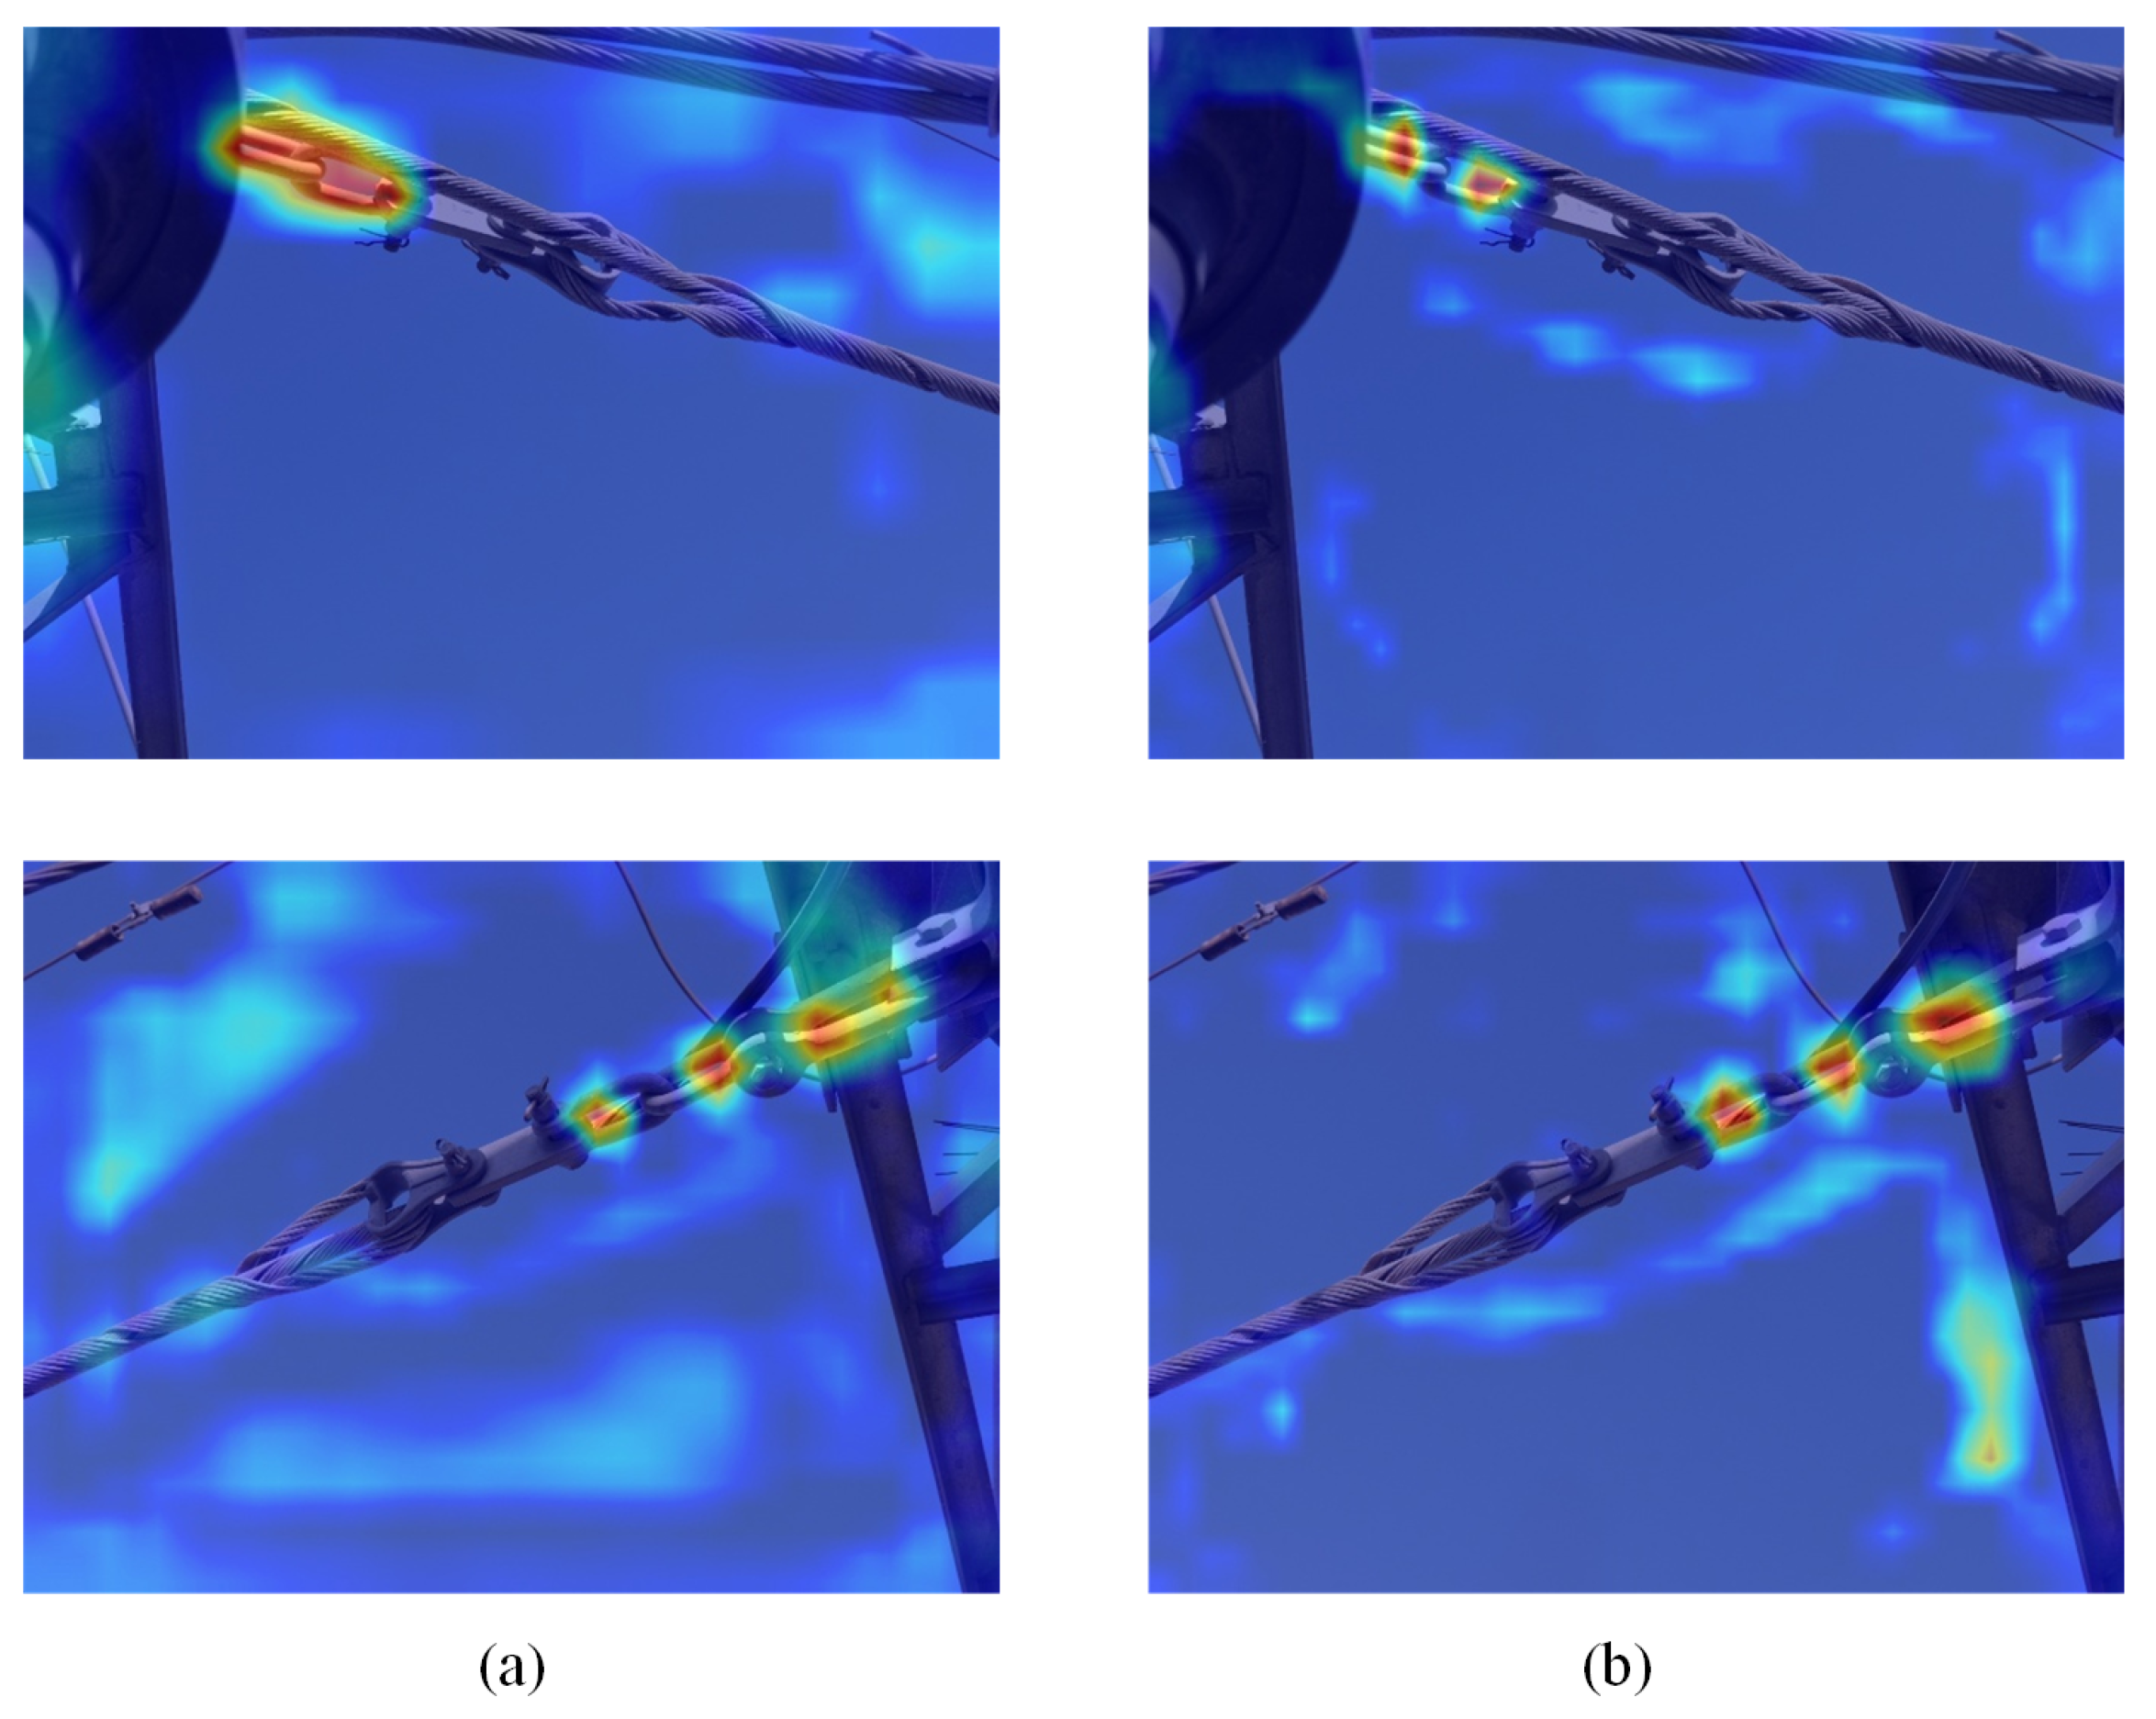
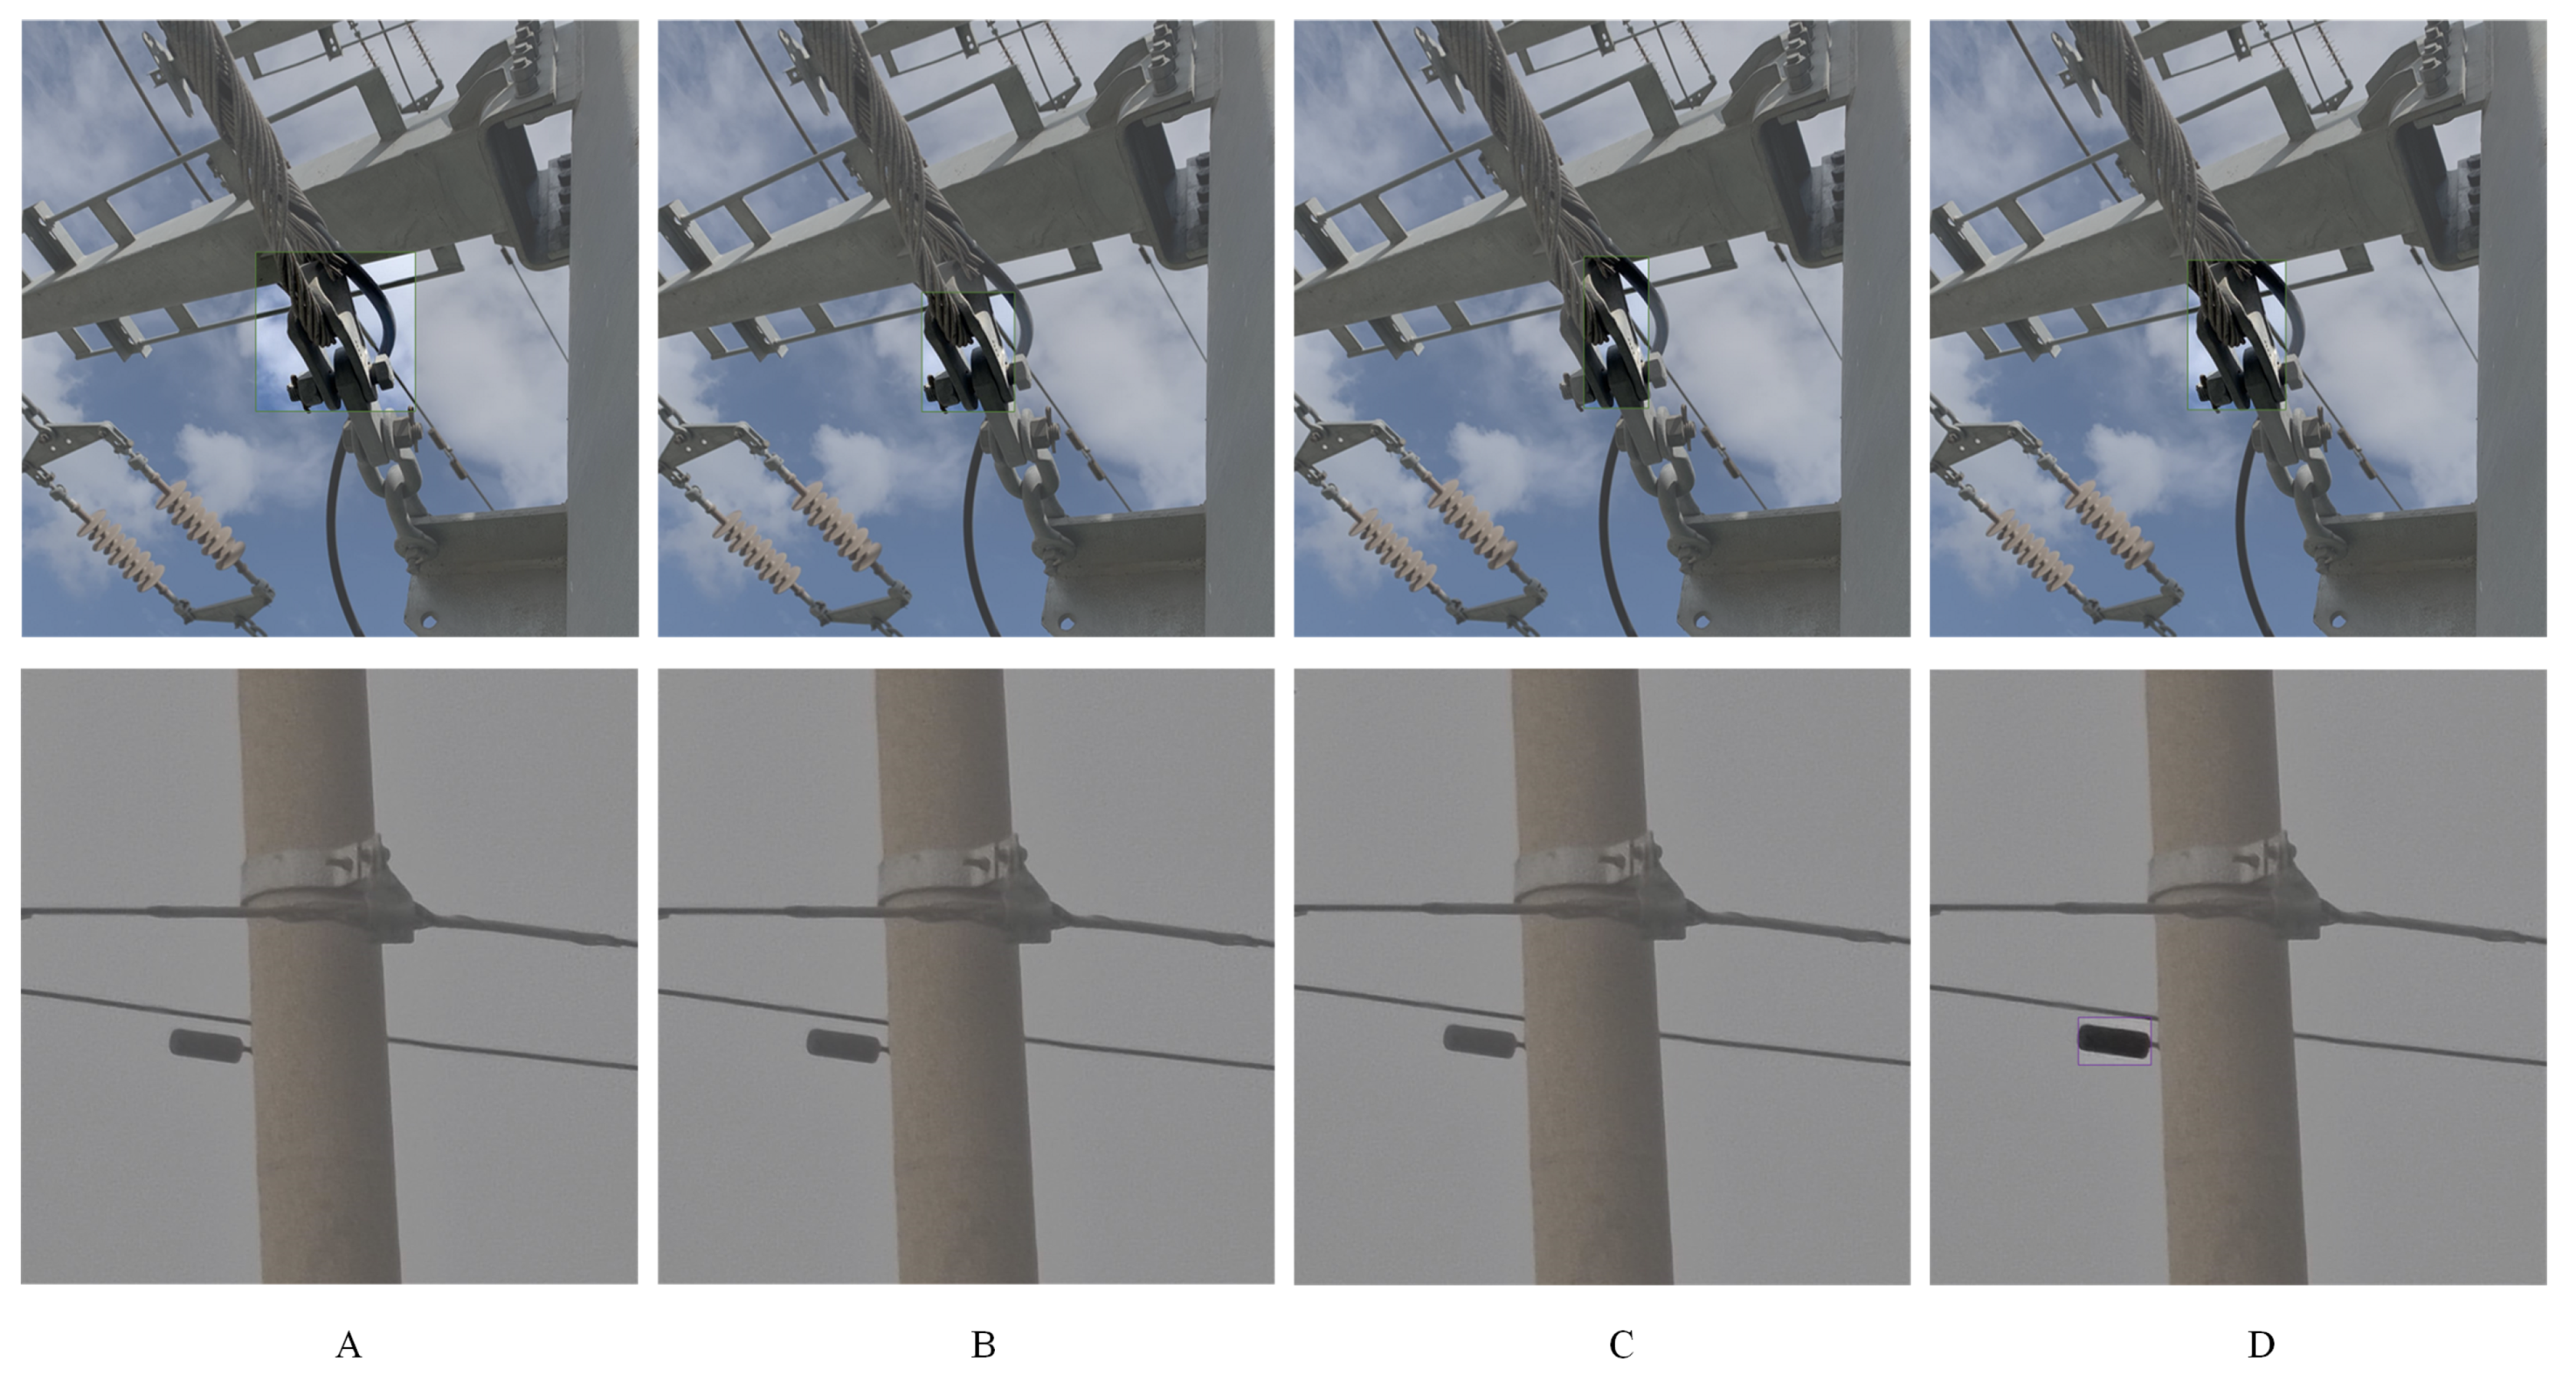
4.2.2. Impact of BRA-UNet
4.2.3. Ablation Analysis
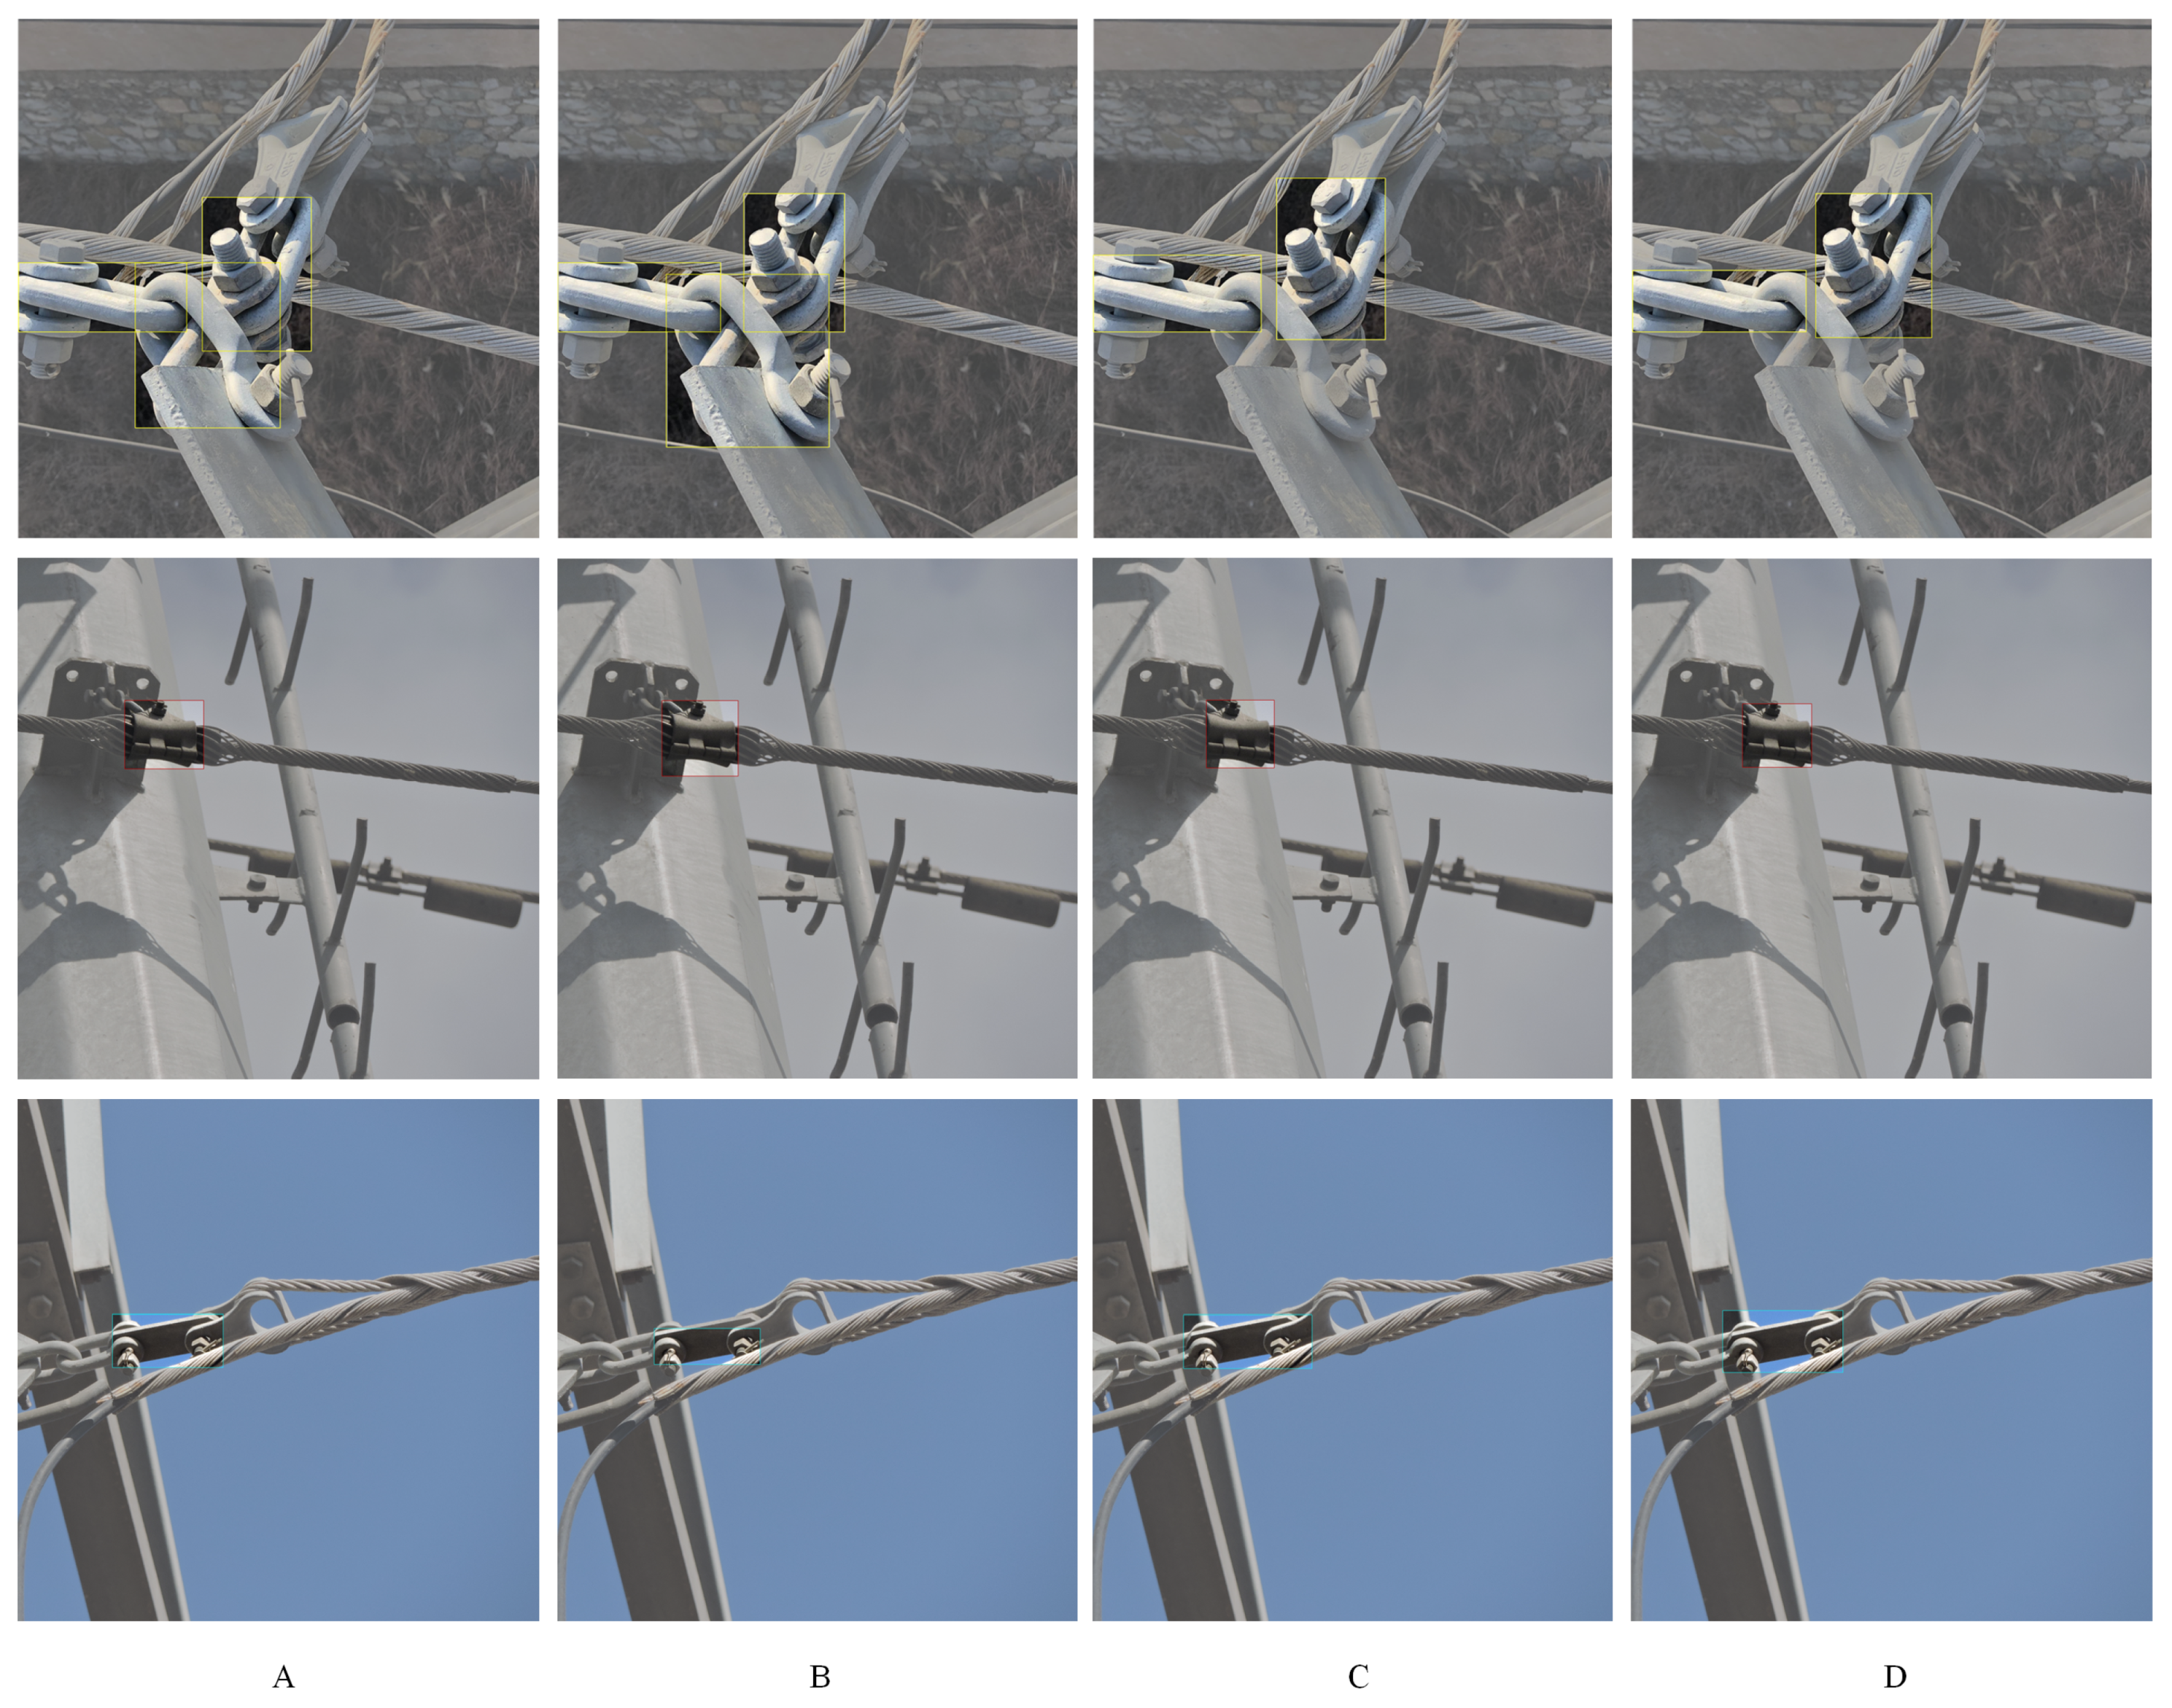
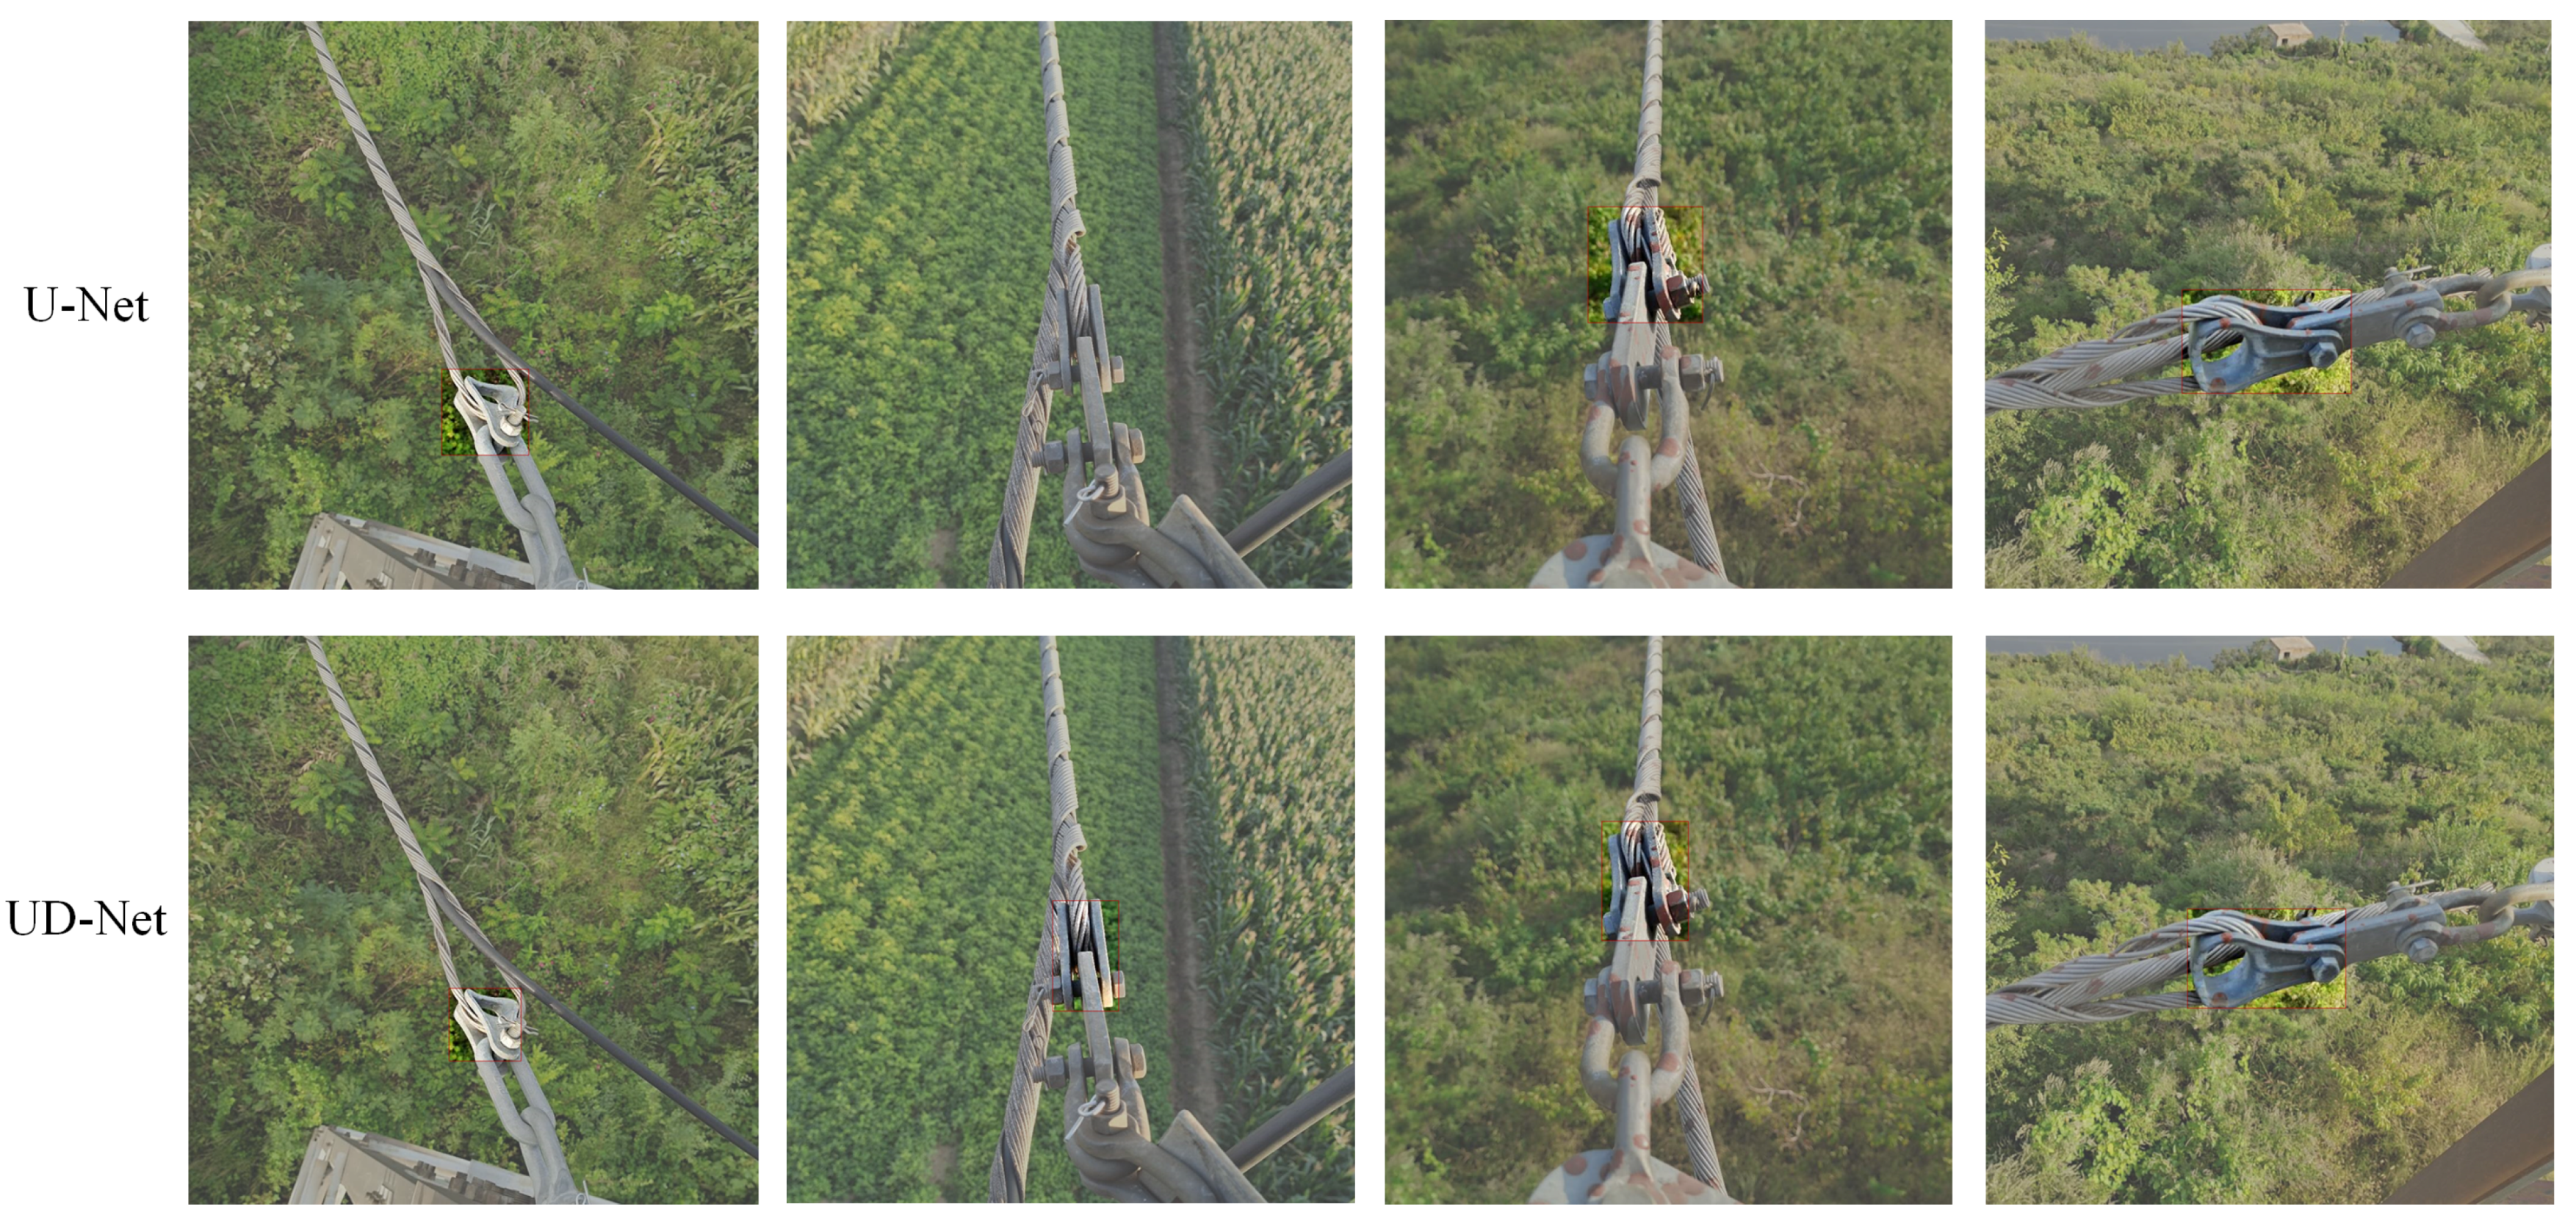
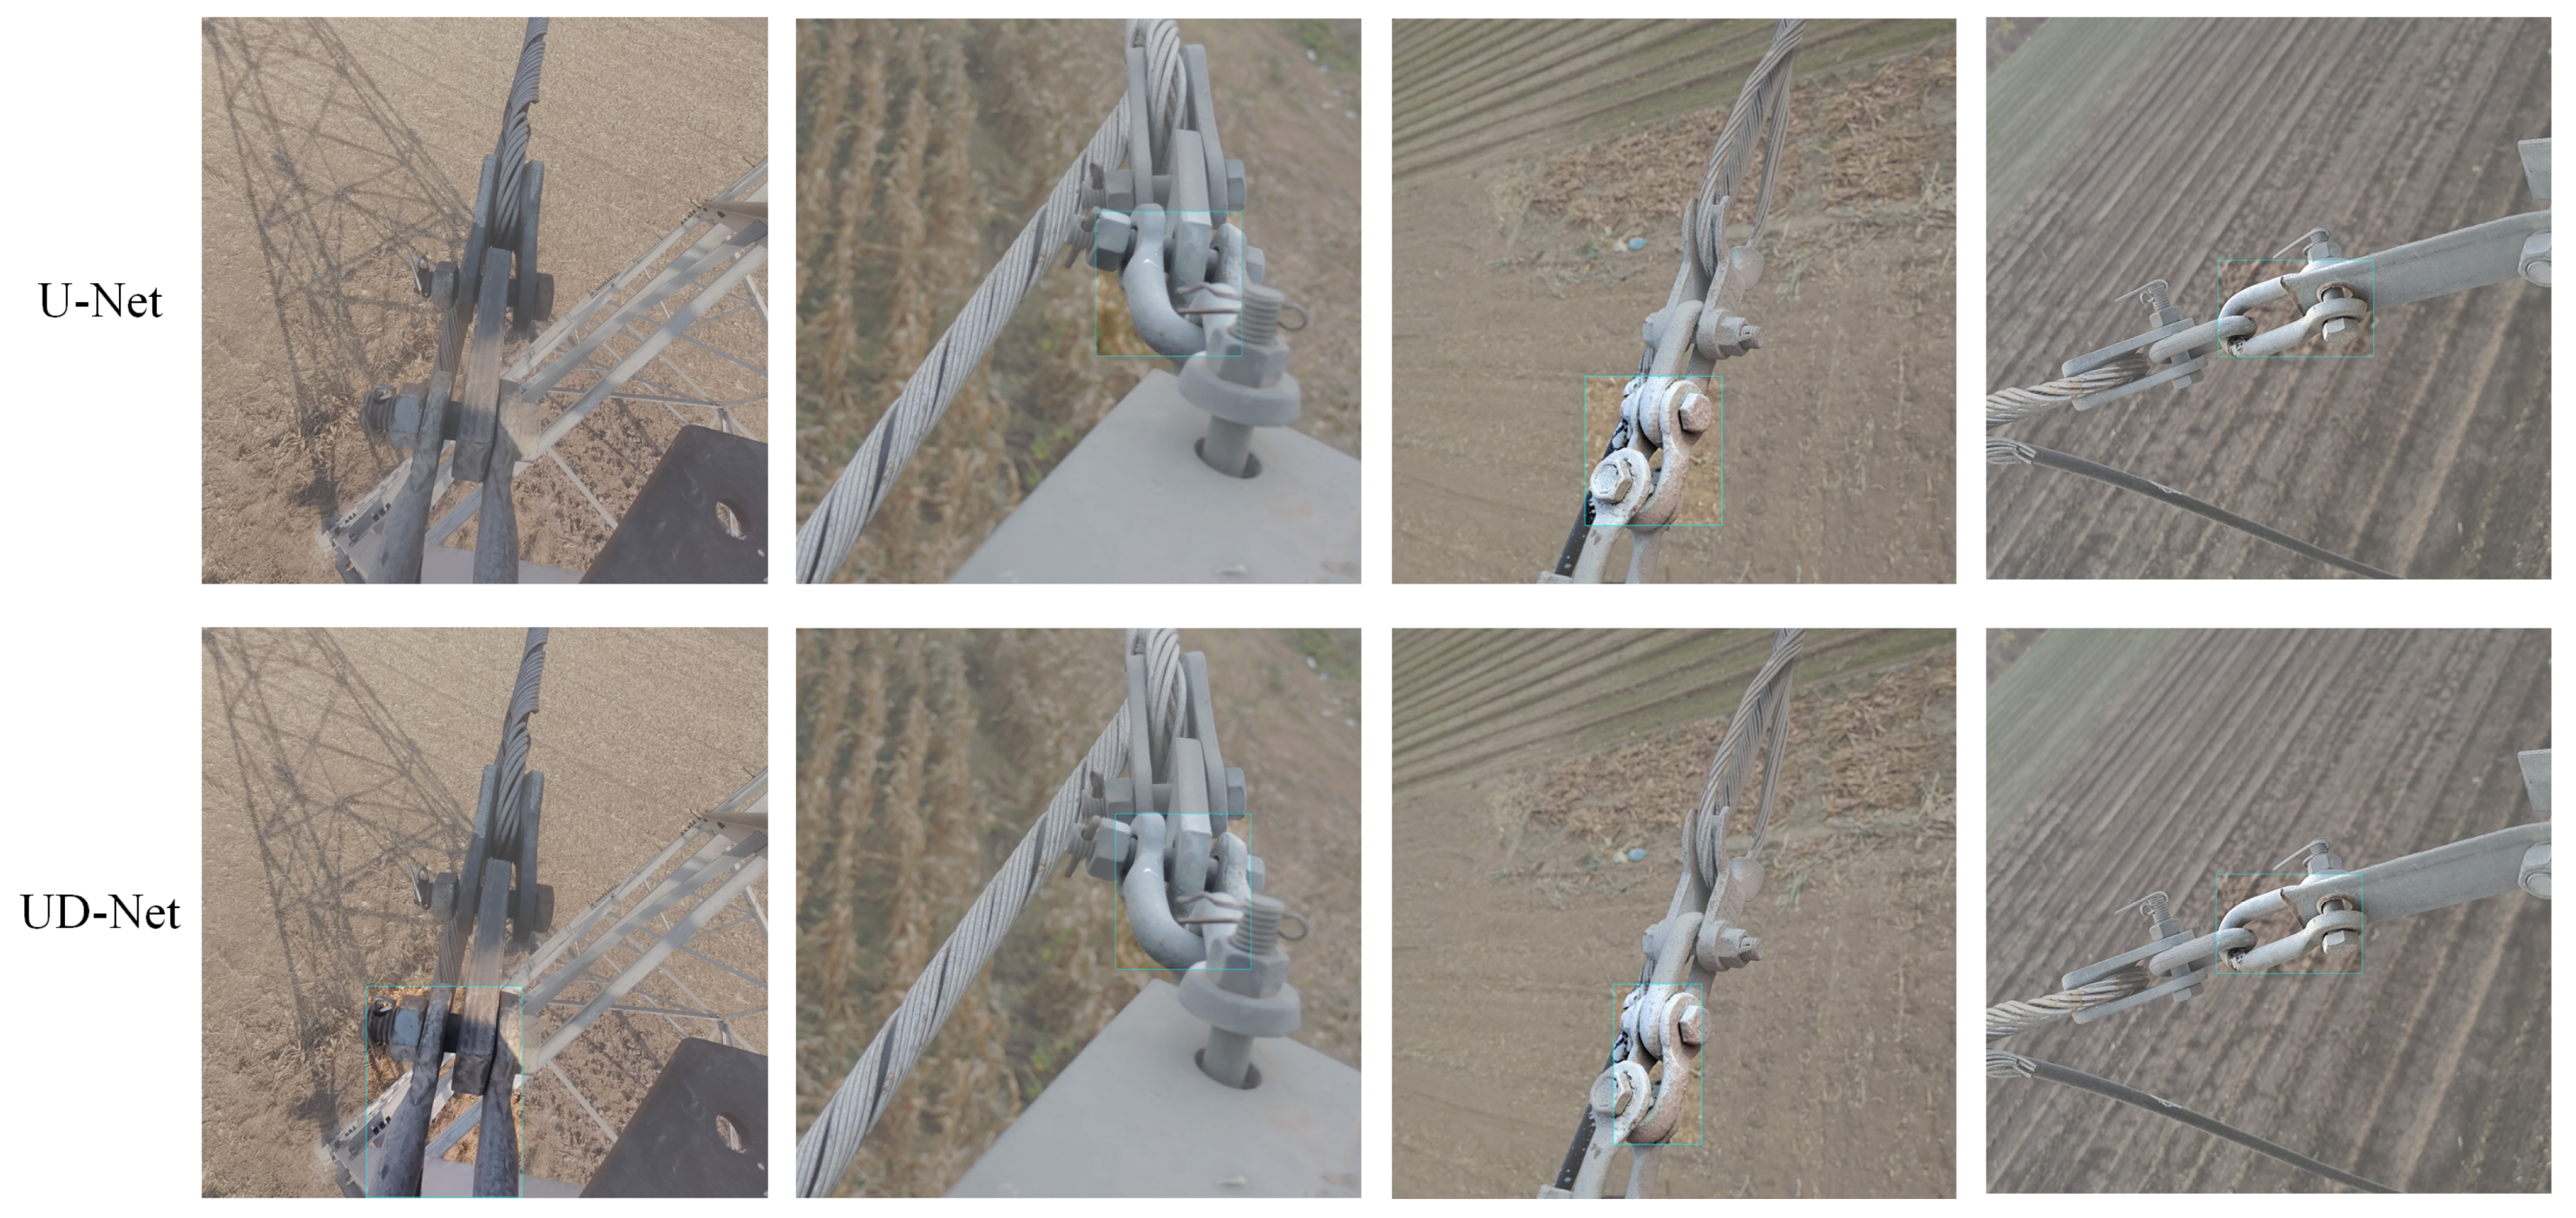
4.2.4. Fittings Detection in Different Scenes
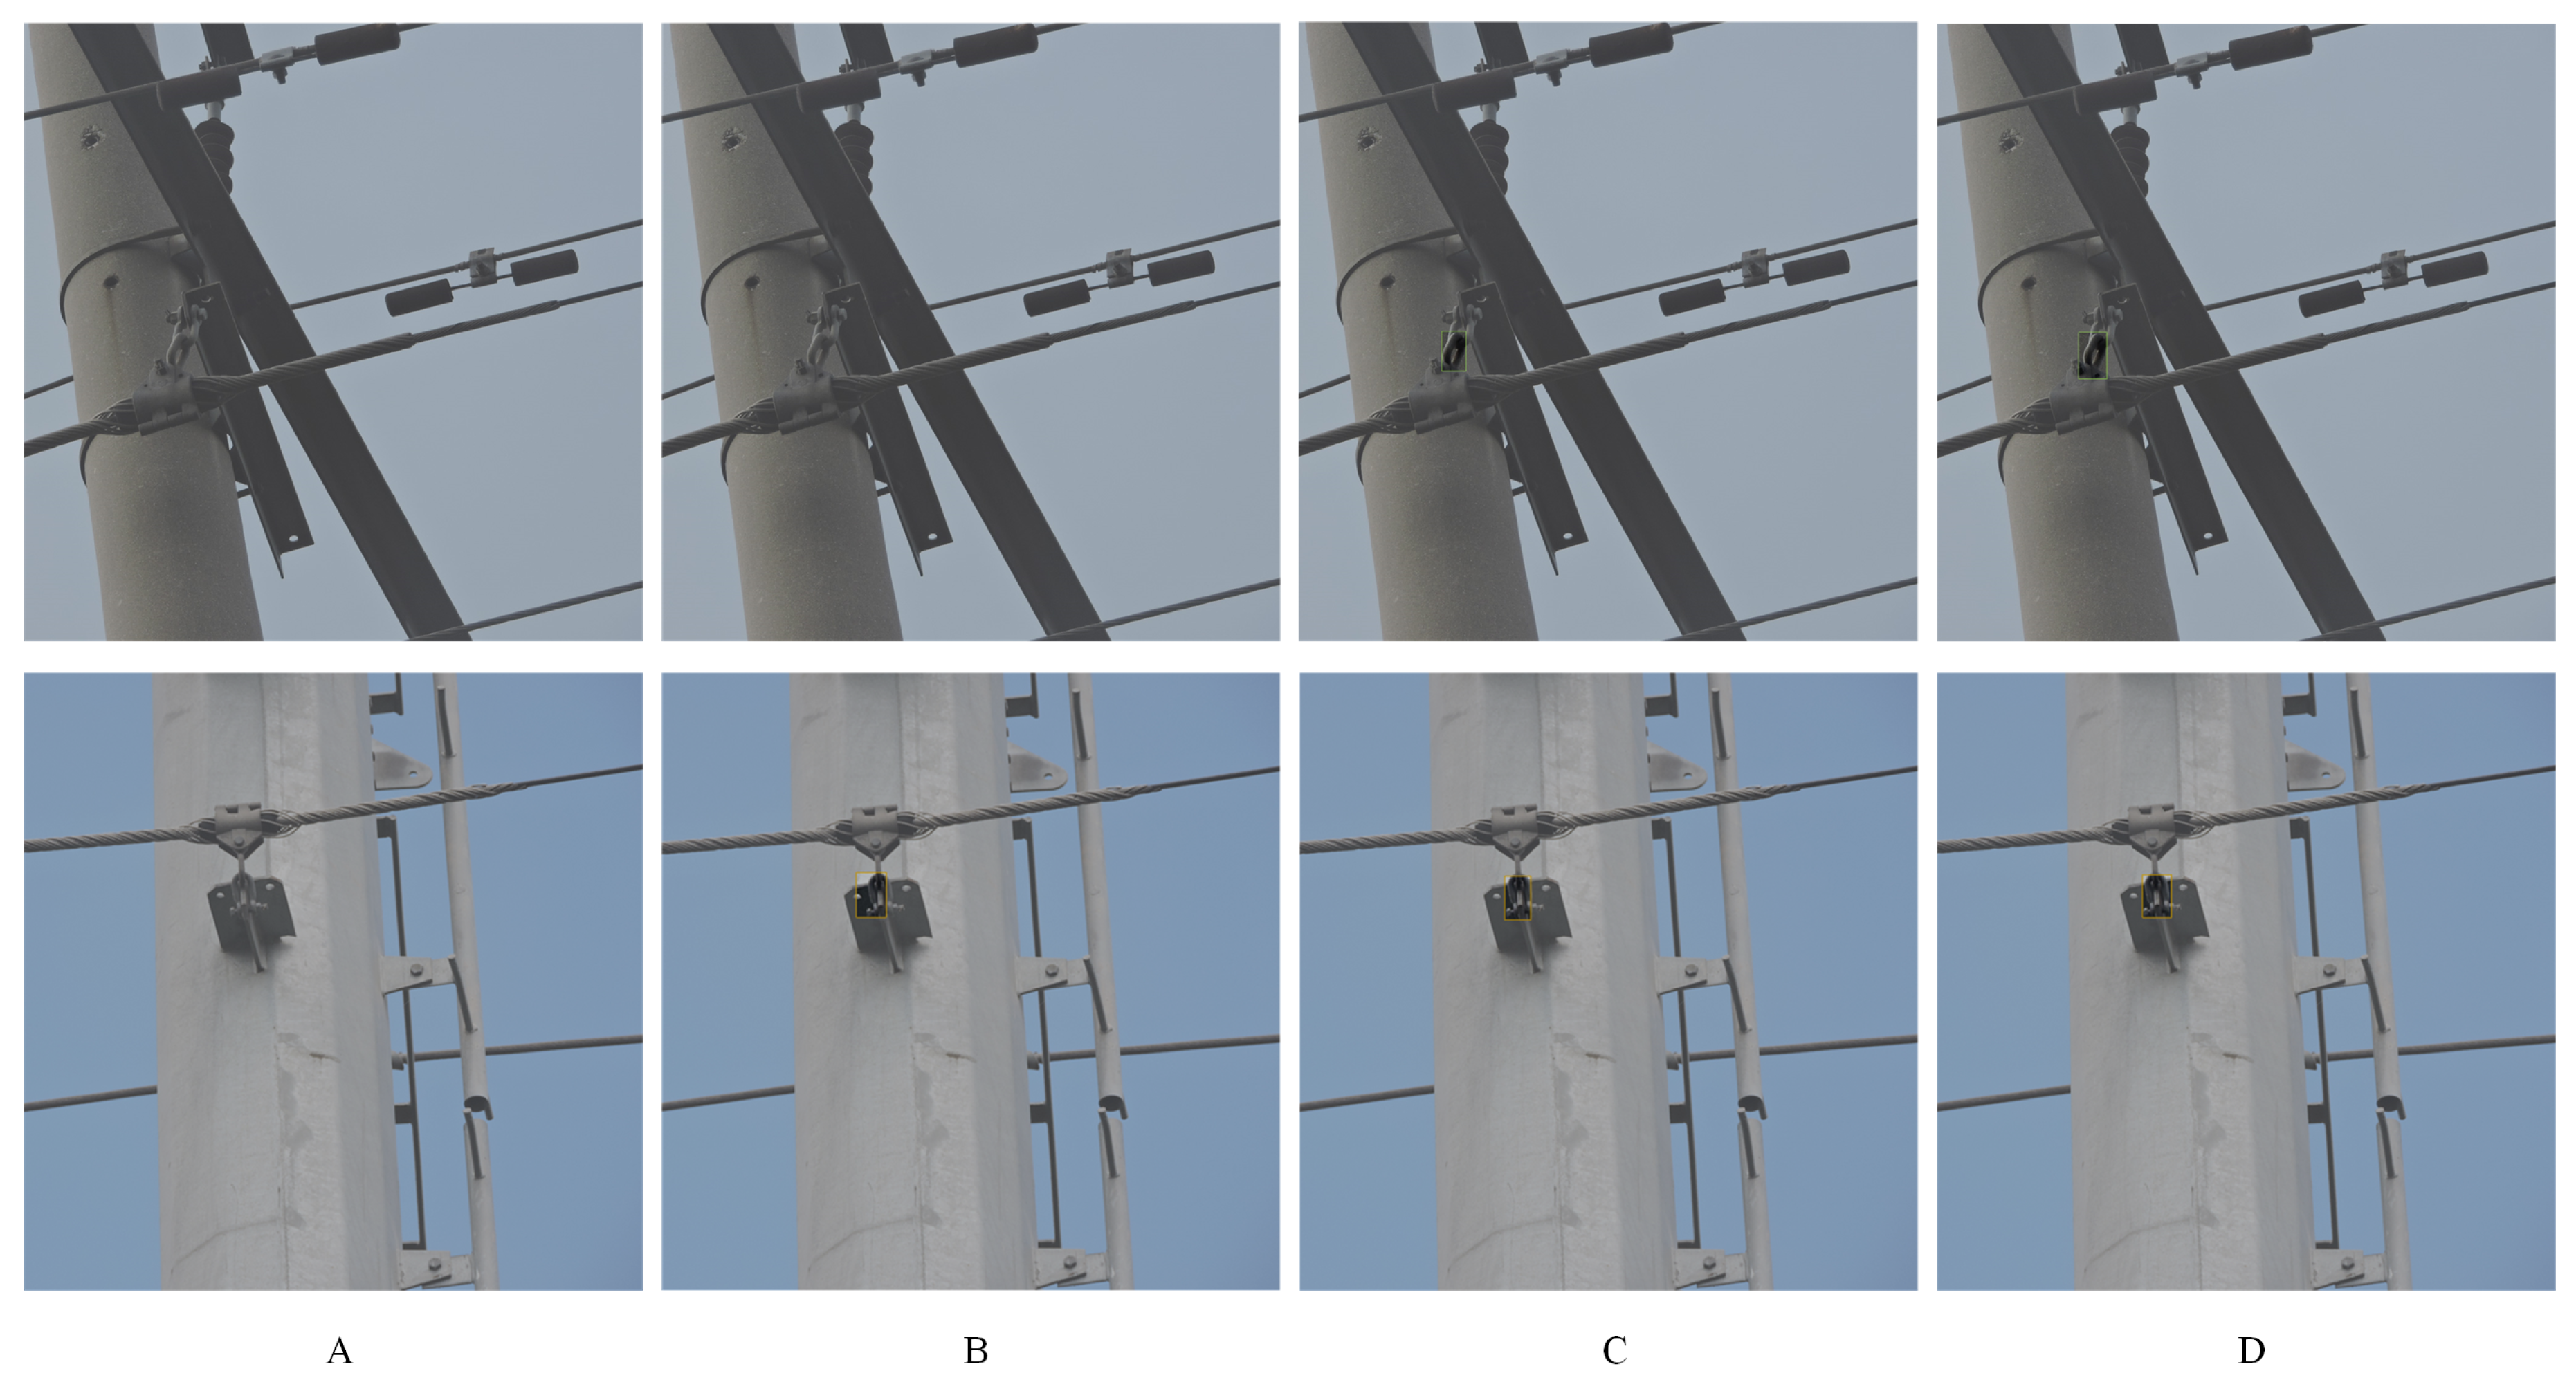
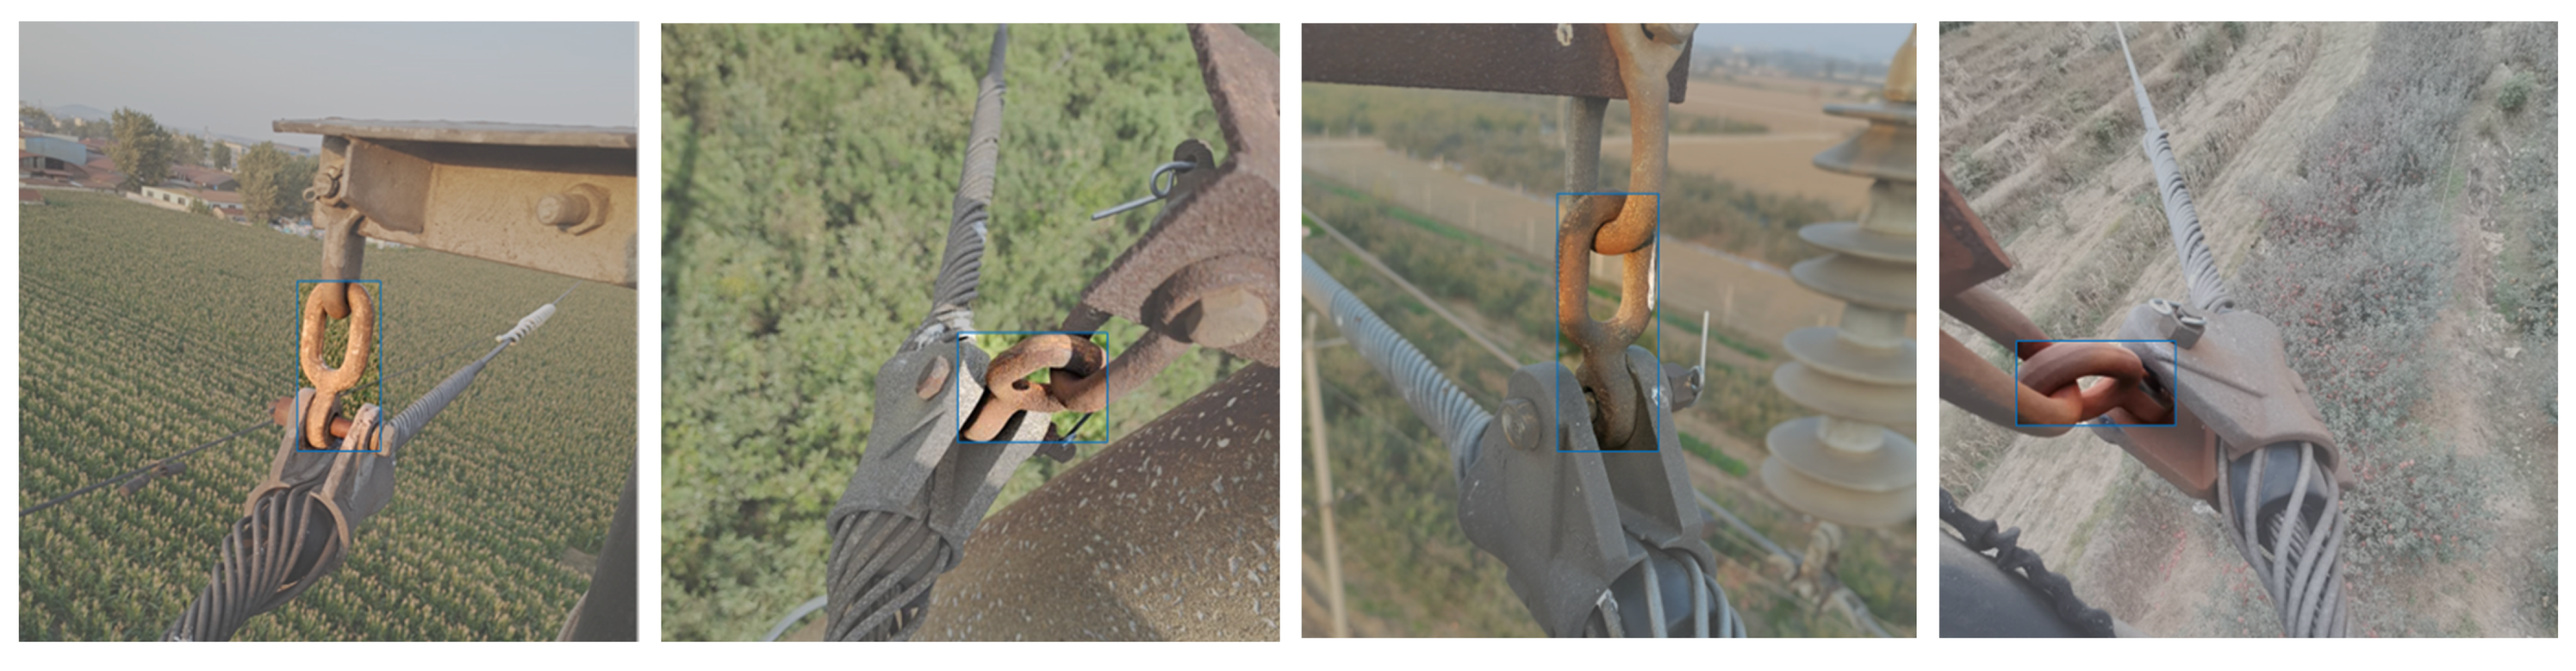
4.2.5. The Detection of Rusted Fittings
5. Conclusions
Author Contributions
Funding
Data Availability Statement
Acknowledgments
Conflicts of Interest
References
- Luo, Y.; Yu, X.; Yang, D.; Zhou, B. A survey of intelligent transmission line inspection based on unmanned aerial vehicle. Artif. Intell. Rev. 2023, 56, 173–201. [Google Scholar] [CrossRef]
- Ghobakhloo, M. Industry 4.0, digitization, and opportunities for sustainability. J. Clean. Prod. 2020, 252, 119869. [Google Scholar] [CrossRef]
- Yang, L.; Fan, J.; Liu, Y.; Li, E.; Peng, J.; Liang, Z. A review on state-of-the-art power line inspection techniques. IEEE Trans. Instrum. Meas. 2020, 69, 9350–9365. [Google Scholar] [CrossRef]
- Liu, Z.; Wu, G.; He, W.; Fan, F.; Ye, X. Key target and defect detection of high-voltage power transmission lines with deep learning. Int. J. Electr. Power Energy Syst. 2022, 142, 108277. [Google Scholar] [CrossRef]
- Zoph, B.; Le, Q.V. Neural architecture search with reinforcement learning. arXiv 2016, arXiv:1611.01578. [Google Scholar]
- Zhu, L.; Ji, D.; Zhu, S.; Gan, W.; Wu, W.; Yan, J. Learning statistical texture for semantic segmentation. In Proceedings of the IEEE/CVF Conference on Computer Vision and Pattern Recognition, Virtual, 19–25 June 2021; pp. 12537–12546. [Google Scholar]
- Sharma, K.U.; Thakur, N.V. A review and an approach for object detection in images. Int. J. Comput. Vis. Robot. 2017, 7, 196–237. [Google Scholar] [CrossRef]
- Luo, P.; Wang, B.; Wang, H.; Ma, F.; Ma, H.; Wang, L. An ultrasmall bolt defect detection method for transmission line inspection. IEEE Trans. Instrum. Meas. 2023, 72, 1–12. [Google Scholar] [CrossRef]
- Wan, N.; Tang, X.; Liu, S.; Chen, J.; Guo, K.; Li, L.; Liu, S. Transmission line image object detection method considering fine-grained contexts. In Proceedings of the 2020 IEEE 4th Information Technology, Networking, Electronic and Automation Control Conference (ITNEC), Chongqing, China, 12–14 June 2020; IEEE: Piscataway, NJ, USA, 2020; Volume 1, pp. 499–502. [Google Scholar]
- Lian, Q.; Li, P.; Chen, X. Monojsg: Joint semantic and geometric cost volume for monocular 3d object detection. In Proceedings of the IEEE/CVF Conference on Computer Vision and Pattern Recognition, New Orleans, LA, USA, 18–24 June 2022; pp. 1070–1079. [Google Scholar]
- Wu, H.; Han, W.; Wen, C.; Li, X.; Wang, C. 3D multi-object tracking in point clouds based on prediction confidence-guided data association. IEEE Trans. Intell. Transp. Syst. 2021, 23, 5668–5677. [Google Scholar] [CrossRef]
- Chen, Y.; Tai, L.; Sun, K.; Li, M. Monopair: Monocular 3d object detection using pairwise spatial relationships. In Proceedings of the IEEE/CVF Conference on Computer Vision and Pattern Recognition, Seattle, WA, USA, 14–19 June 2020; pp. 12093–12102. [Google Scholar]
- Wang, X.; Fu, C.; Li, Z.; Lai, Y.; He, J. DeepFusionMOT: A 3D multi-object tracking framework based on camera-LiDAR fusion with deep association. IEEE Robot. Autom. Lett. 2022, 7, 8260–8267. [Google Scholar] [CrossRef]
- Shi, S.; Wang, X.; Li, H. Pointrcnn: 3d object proposal generation and detection from point cloud. In Proceedings of the IEEE/CVF Conference on Computer Vision and Pattern Recognition, Long Beach, CA, USA, 15–20 June 2019; pp. 770–779. [Google Scholar]
- Ren, J.; Chen, X.; Liu, J.; Sun, W.; Pang, J.; Yan, Q.; Tai, Y.W.; Xu, L. Accurate single stage detector using recurrent rolling convolution. In Proceedings of the IEEE Conference on Computer Vision and Pattern Recognition, Honolulu, HI, USA, 21–26 July 2017; pp. 5420–5428. [Google Scholar]
- Liu, Z.; Cao, Y.; Wang, Y.; Wang, W. Computer vision-based concrete crack detection using U-net fully convolutional networks. Autom. Constr. 2019, 104, 129–139. [Google Scholar] [CrossRef]
- Wu, X.; Hong, D.; Chanussot, J. UIU-Net: U-Net in U-Net for infrared small object detection. IEEE Trans. Image Process. 2022, 32, 364–376. [Google Scholar] [CrossRef]
- Yang, X.; Li, X.; Ye, Y.; Lau, R.Y.; Zhang, X.; Huang, X. Road detection and centerline extraction via deep recurrent convolutional neural network U-Net. IEEE Trans. Geosci. Remote Sens. 2019, 57, 7209–7220. [Google Scholar] [CrossRef]
- Ronneberger, O.; Fischer, P.; Brox, T. U-net: Convolutional networks for biomedical image segmentation. In Medical Image Computing and Computer-Assisted Intervention, Proceedings of the MICCAI 2015: 18th International Conference, Munich, Germany, 5–9 October 2015; Proceedings, Part III 18; Springer: Berlin/Heidelberg, Germany, 2015; pp. 234–241. [Google Scholar]
- He, M.; Qin, L.; Deng, X.; Zhou, S.; Liu, H.; Liu, K. Transmission Line Segmentation Solutions for UAV Aerial Photography Based on Improved UNet. Drones 2023, 7, 274. [Google Scholar] [CrossRef]
- Han, G.; Zhang, M.; Li, Q.; Liu, X.; Li, T.; Zhao, L.; Liu, K.; Qin, L. A Lightweight Aerial Power Line Segmentation Algorithm Based on Attention Mechanism. Machines 2022, 10, 881. [Google Scholar] [CrossRef]
- Cao, M.; Fu, H.; Zhu, J.; Cai, C. Lightweight tea bud recognition network integrating GhostNet and YOLOv5. Math. Biosci. Eng. MBE 2022, 19, 12897–12914. [Google Scholar] [CrossRef] [PubMed]
- Choi, H.; Yun, J.P.; Kim, B.J.; Jang, H.; Kim, S.W. Attention-based multimodal image feature fusion module for transmission line detection. IEEE Trans. Ind. Inform. 2022, 18, 7686–7695. [Google Scholar] [CrossRef]
- Shi, W.; Rajkumar, R. Point-gnn: Graph neural network for 3d object detection in a point cloud. In Proceedings of the IEEE/CVF Conference on Computer Vision and Pattern Recognition, Seattle, WA, USA, 14–19 June 2020; pp. 1711–1719. [Google Scholar]
- He, Q.; Wang, Z.; Zeng, H.; Zeng, Y.; Liu, Y. Svga-net: Sparse voxel-graph attention network for 3d object detection from point clouds. In Proceedings of the AAAI Conference on Artificial Intelligence, Virtual, 22 February–1 March 2022; Volume 36, pp. 870–878. [Google Scholar]
- Xie, S.; Liu, S.; Chen, Z.; Tu, Z. Attentional shapecontextnet for point cloud recognition. In Proceedings of the IEEE Conference on Computer Vision and Pattern Recognition, Salt Lake City, UT, USA, 18–22 June 2018; pp. 4606–4615. [Google Scholar]
- Zhou, Y.; Tuzel, O. Voxelnet: End-to-end learning for point cloud based 3d object detection. In Proceedings of the IEEE Conference on Computer Vision and Pattern Recognition, Salt Lake City, UT, USA, 18–22 June 2018; pp. 4490–4499. [Google Scholar]
- Qi, C.R.; Yi, L.; Su, H.; Guibas, L.J. Pointnet++: Deep hierarchical feature learning on point sets in a metric space. Adv. Neural Inf. Process. Syst. 2017, 30, 5105–5114. [Google Scholar]
- Yue, W.; Yongbin, S.; Ziwei, L.; Sarma, S.E.; Bronstein, M.M.; Solomon, J.M. Dynamic graph cnn for learning on point clouds. ACM Trans. Graph. (TOG) 2019, 38, 1–12. [Google Scholar]
- Wang, Y.; Solomon, J.M. Object dgcnn: 3d object detection using dynamic graphs. Adv. Neural Inf. Process. Syst. 2021, 34, 20745–20758. [Google Scholar]
- Gamal, A.; Wibisono, A.; Wicaksono, S.B.; Abyan, M.A.; Hamid, N.; Wisesa, H.A.; Jatmiko, W.; Ardhianto, R. Automatic LIDAR building segmentation based on DGCNN and euclidean clustering. J. Big Data 2020, 7, 102. [Google Scholar] [CrossRef]
- Xing, Z.; Zhao, S.; Guo, W.; Guo, X.; Wang, Y. Processing laser point cloud in fully mechanized mining face based on DGCNN. ISPRS Int. J. Geo-Inf. 2021, 10, 482. [Google Scholar] [CrossRef]
- Liang, H.; Lv, J.; Wang, Z.; Xu, X. Medical image mis-segmentation region refinement framework based on dynamic graph convolution. Biomed. Signal Process. Control 2023, 86, 105064. [Google Scholar] [CrossRef]
- Peng, X.; Zhong, R.; Li, Z.; Li, Q. Optical remote sensing image change detection based on attention mechanism and image difference. IEEE Trans. Geosci. Remote Sens. 2020, 59, 7296–7307. [Google Scholar] [CrossRef]
- Chen, F.; Pan, S.; Jiang, J.; Huo, H.; Long, G. DAGCN: Dual attention graph convolutional networks. In Proceedings of the 2019 International Joint Conference on Neural Networks (IJCNN), Budapest, Hungary, 14–19 July 2019; IEEE: Piscataway, NJ, USA, 2019; pp. 1–8. [Google Scholar]
- Perreault, H.; Bilodeau, G.A.; Saunier, N.; Héritier, M. Spotnet: Self-attention multi-task network for object detection. In Proceedings of the 2020 17th Conference on Computer and Robot Vision (CRV), Ottawa, ON, Canada, 13–15 May 2020; IEEE: Piscataway, NJ, USA, 2020; pp. 230–237. [Google Scholar]
- Zhu, L.; Wang, X.; Ke, Z.; Zhang, W.; Lau, R.W. BiFormer: Vision Transformer with Bi-Level Routing Attention. In Proceedings of the IEEE/CVF Conference on Computer Vision and Pattern Recognition, Vancouver, BC, Canada, 18–22 June 2023; pp. 10323–10333. [Google Scholar]
- Zhang, N.; Nex, F.; Vosselman, G.; Kerle, N. Lite-mono: A lightweight cnn and transformer architecture for self-supervised monocular depth estimation. In Proceedings of the IEEE/CVF Conference on Computer Vision and Pattern Recognition, Vancouver, BC, Canada, 18–22 June 2023; pp. 18537–18546. [Google Scholar]
- Mousavian, A.; Anguelov, D.; Flynn, J.; Kosecka, J. 3d bounding box estimation using deep learning and geometry. In Proceedings of the IEEE Conference on Computer Vision and Pattern Recognition, Honolulu, HI, USA, 21–26 July 2017; pp. 7074–7082. [Google Scholar]
- Liu, W.; Anguelov, D.; Erhan, D.; Szegedy, C.; Reed, S.; Fu, C.Y.; Berg, A.C. Ssd: Single shot multibox detector. In Computer Vision, Proceedings of the ECCV 2016: 14th European Conference, Amsterdam, The Netherlands, 11–14 October 2016; Proceedings, Part I 14; Springer: Berlin/Heidelberg, Germany, 2016; pp. 21–37. [Google Scholar]
- Girshick, R. Fast r-cnn. In Proceedings of the IEEE International Conference on Computer Vision, Santiago, Chile, 7–13 December 2015; pp. 1440–1448. [Google Scholar]
- Bochkovskiy, A.; Wang, C.Y.; Liao, H.Y.M. Yolov4: Optimal speed and accuracy of object detection. arXiv 2020, arXiv:2004.10934. [Google Scholar]
- Ren, S.; He, K.; Girshick, R.; Sun, J. Faster r-cnn: Towards real-time object detection with region proposal networks. Adv. Neural Inf. Process. Syst. 2015, 28, 1137–1149. [Google Scholar] [CrossRef]
- Redmon, J.; Farhadi, A. Yolov3: An incremental improvement. arXiv 2018, arXiv:1804.02767. [Google Scholar]
- Ge, Z.; Liu, S.; Wang, F.; Li, Z.; Sun, J. Yolox: Exceeding yolo series in 2021. arXiv 2021, arXiv:2107.08430. [Google Scholar]
- Hu, J.; Shen, L.; Sun, G. Squeeze-and-excitation networks. In Proceedings of the IEEE Conference on Computer Vision and Pattern Recognition, Salt Lake City, UT, USA, 18–22 June 2018; pp. 7132–7141. [Google Scholar]
- Sagar, A. Dmsanet: Dual multi scale attention network. In Proceedings of the International Conference on Image Analysis and Processing, Lecce, Italy, 23–27 May 2022; Springer: Berlin/Heidelberg, Germany, 2022; pp. 633–645. [Google Scholar]
- Wang, Q.; Wu, B.; Zhu, P.; Li, P.; Zuo, W.; Hu, Q. ECA-Net: Efficient channel attention for deep convolutional neural networks. In Proceedings of the IEEE/CVF Conference on Computer Vision and Pattern Recognition, Seattle, WA, USA, 14–19 June 2020; pp. 11534–11542. [Google Scholar]
- Woo, S.; Park, J.; Lee, J.Y.; Kweon, I.S. Cbam: Convolutional block attention module. In Proceedings of the European Conference on Computer Vision (ECCV), Munich, Germany, 8–14 September 2018; pp. 3–19. [Google Scholar]


| Fittings | Training Dataset | Validating Dataset | Testing Dataset |
|---|---|---|---|
| Shackle | 2236 | 639 | 320 |
| Ball eyes | 1059 | 303 | 151 |
| Suspension clamp | 1260 | 360 | 180 |
| Thimble | 1047 | 299 | 150 |
| Clevis | 1199 | 342 | 171 |
| Eyelink | 1201 | 343 | 172 |
| Damper | 1845 | 338 | 169 |
| Computer Systems | Configurations |
|---|---|
| Hardware | Ubuntu 16.04 operating system |
| NVIDIA GTX2080Ti with 11 GB memory | |
| Software | Python 3.7, PyCharm 2020 |
| CUDA 10.1, PyTorch 1.7.0 |
| Models | Precision/% | Recall/% | mAP/% | Parameters/Million |
|---|---|---|---|---|
| SSD | 76.01 | 78.33 | 75.79 | - |
| Fast R-CNN | 78.68 | 72.77 | 76.26 | - |
| Faster R-CNN | 80.18 | 78.99 | 78.56 | - |
| YOLOv3-tiny | 72.83 | 75.69 | 79.55 | 8.8 |
| YOLOv4 | 81.62 | 82.15 | 81.08 | 52.5 |
| YOLOv5s | 88.15 | 89.37 | 88.26 | 7.0 |
| YOLOX-Nano | 86.59 | 84.85 | 85.22 | 1.8 |
| U-Net | 84.98 | 83.76 | 86.34 | 7.7 |
| FA-UNet | 90.09 | 87.81 | 87.73 | 19.9 |
| UD-Net | 93.25 | 90.18 | 89.99 | 7.2 |
| Models | Accuracy/% | Precision/% | Recall/% | mAP/% |
|---|---|---|---|---|
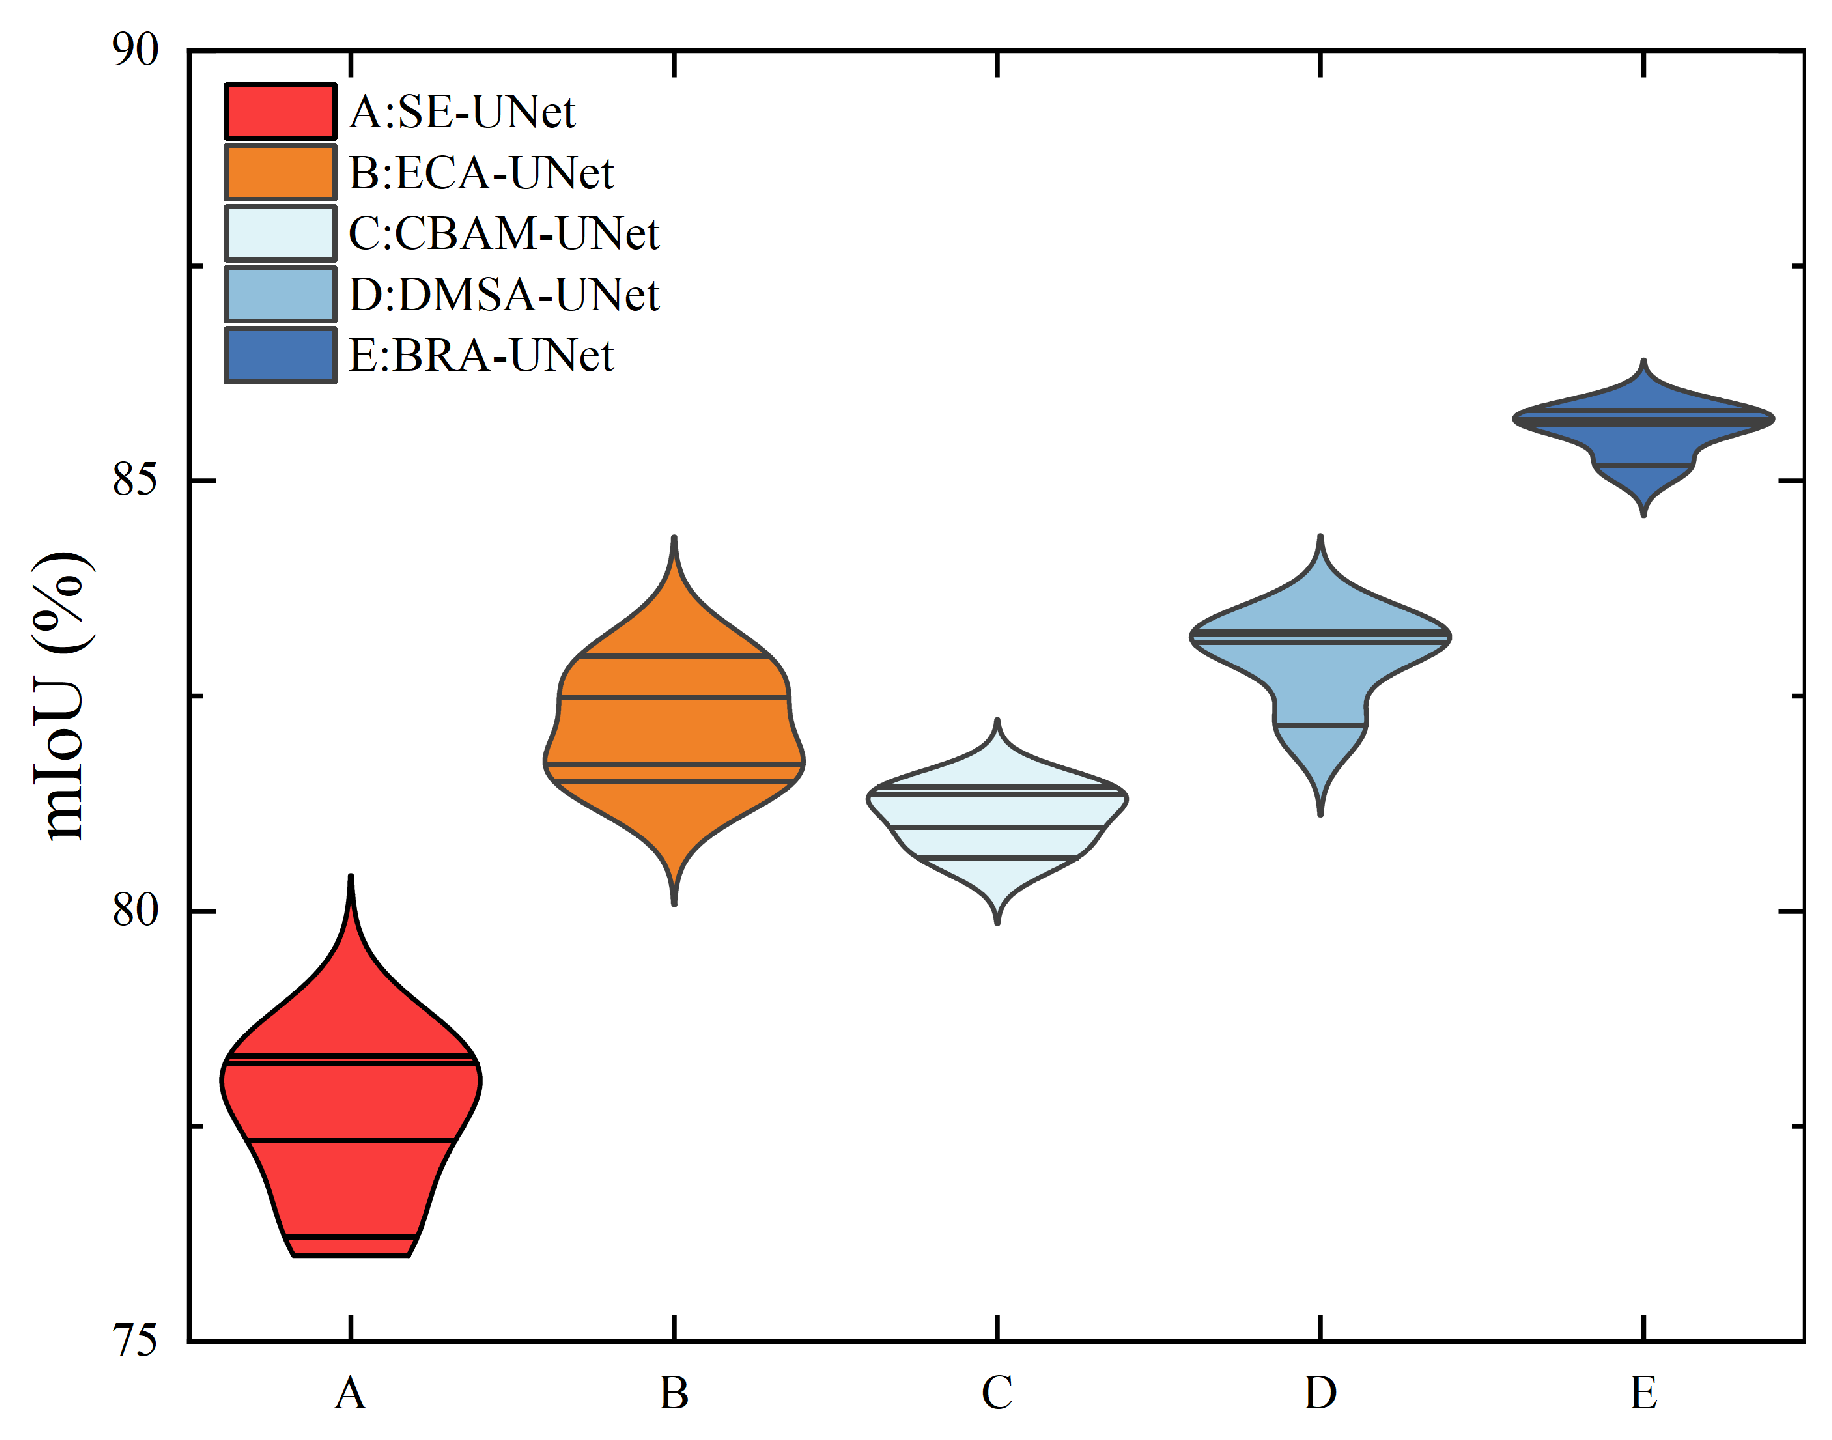
| A | 97.88 | 79.95 | 84.98 | 83.76 |
| B | 98.41 | 81.81 | 85.94 | 85.23 |
| C | 98.46 | 85.75 | 87.24 | 86.37 |
| D | 99.12 | 89.37 | 93.25 | 90.18 |
| Category | U-Net | UD-Net | ||||||||
|---|---|---|---|---|---|---|---|---|---|---|
| Accuracy | mIoU | Precision | Recall | Average Training Time | Accuracy | mIoU | Precision | Recall | Average Training Time | |
| Suspension clamp | 97.69 | 85.92 | 81.33 | 94.18 | 2.86 | 99.05 | 93.47 | 94.59 | 96.2 | 3.4 |
| Ball eye | 99.12 | 84.99 | 83.5 | 87.26 | 2.97 | 99.47 | 90.52 | 86.3 | 95.14 | 3.53 |
| Clevis | 99.02 | 61.83 | 57.24 | 72.95 | 2.9 | 99.22 | 83.77 | 85.17 | 94.39 | 3.47 |
| Shackle | 98.12 | 79.34 | 64.37 | 85.44 | 2.95 | 98.9 | 85.9 | 89.25 | 87.35 | 3.33 |
| Damper | 99.33 | 74.5 | 63.19 | 83.06 | 2.94 | 99.28 | 84.85 | 89.43 | 92.84 | 3.35 |
| Eyelink | 97.85 | 62.07 | 48.63 | 70.28 | 2.91 | 98.92 | 80.18 | 83.54 | 86.43 | 3.44 |
| Thimble | 98.16 | 70.76 | 57.26 | 83.57 | 3.00 | 98.46 | 79.29 | 78.18 | 88.92 | 3.52 |
Disclaimer/Publisher’s Note: The statements, opinions and data contained in all publications are solely those of the individual author(s) and contributor(s) and not of MDPI and/or the editor(s). MDPI and/or the editor(s) disclaim responsibility for any injury to people or property resulting from any ideas, methods, instructions or products referred to in the content. |
© 2023 by the authors. Licensee MDPI, Basel, Switzerland. This article is an open access article distributed under the terms and conditions of the Creative Commons Attribution (CC BY) license (https://creativecommons.org/licenses/by/4.0/).
Share and Cite
Xie, Z.; Fu, M.; Liu, X. Detection of Fittings Based on the Dynamic Graph CNN and U-Net Embedded with Bi-Level Routing Attention. Electronics 2023, 12, 4611. https://doi.org/10.3390/electronics12224611
Xie Z, Fu M, Liu X. Detection of Fittings Based on the Dynamic Graph CNN and U-Net Embedded with Bi-Level Routing Attention. Electronics. 2023; 12(22):4611. https://doi.org/10.3390/electronics12224611
Chicago/Turabian StyleXie, Zhihui, Min Fu, and Xuefeng Liu. 2023. "Detection of Fittings Based on the Dynamic Graph CNN and U-Net Embedded with Bi-Level Routing Attention" Electronics 12, no. 22: 4611. https://doi.org/10.3390/electronics12224611