Article

mICA-Based fMRI Analysis of Specific CO2-Level-Dependent BOLD Signal Changes in the Human Brainstem

1
Department of Information Engineering, University of Pisa, 56122 Pisa, Italy
2
Research Center “E. Piaggio”, School of Engineering, University of Pisa, 56122 Pisa, Italy
3
Stella Maris Foundation (IRCCS), 56128 Calambrone, Italy
4
Institute of Clinical Physiology, National Council of Research, 56124 Pisa, Italy
5
Fondazione Toscana Gabriele Monasterio, 56124 Pisa, Italy
6
Sant’Anna School of Advanced Studies, 56127 Pisa, Italy
*
Author to whom correspondence should be addressed.
Electronics 2023, 12(2), 290; https://doi.org/10.3390/electronics12020290
Submission received: 28 October 2022 / Revised: 21 December 2022 / Accepted: 4 January 2023 / Published: 6 January 2023
(This article belongs to the Special Issue Advanced Applications of Magnetic Resonance in Biomedical Imaging)

Abstract

:
Noninvasive studies of the central respiratory control are of key importance to understanding the physiopathology of central apneas and periodic breathing. The study of the brainstem and cortical-subcortical centers may be achieved by using functional magnetic resonance imaging (fMRI) during gas challenges (hypercapnia). Nonetheless, disentangling specific from non-specific effects of hypercapnia in fMRI is a major methodological challenge, as CO2 vasodilatory effects and physiological noise do strongly impact the BOLD signal. This is particularly true in deep brainstem regions where chemoreceptors and rhythm pattern generators are located. One possibility to detect the true neural-related activation is given by the presence of a supralinear relation between CO2 changes and BOLD signal related to neurovascular coupling in overactive neural areas. Here, we test this hypothesis of a supralinear relationship between CO2 and BOLD signal, as a marker of specificity. We employed a group-masked Independent Component Analysis (mICA) approach and we compared activation levels across different mixtures of inspired CO2 using polynomial regression. Our results highlight key nodes of the central breathing control network, also including dorsal pontine and medullary regions. The suggested methodology allows a voxel-wise parametrization of the response, targeting an issue that affects many fMRI studies employing hypercapnic challenges.

1. Introduction

The central control of breathing arises from a complex network of interconnected small subcortical nuclei, mainly located in the brainstem, and autonomic-related cortical areas. A primary role in generating the breathing pattern after integrating peripheral mechano, baro, and chemosensitive variations is played by groups of inter-inhibitory and inter-excitatory interneurons in the brainstem [1]. Unravelling the complex dynamics underlying central chemoreception and central breathing control is of great interest for targeting several complex pathologies of this system, such as central apneas in heart failure [2,3], sudden infant death syndrome and also sudden unexplained death in epilepsy [4,5,6]. Although the brainstem is a deep brain region involved in vital processes, it is noticeably overlooked and understudied with respect to the cortex [7,8]. This is due to several reasons, but physiological noise is among the detrimental effects having the highest impact on these deep regions surrounded by large pulsatile blood vessels, cerebrospinal fluid ventricles, and tissue boundaries exerting geometric distortions [9]. In addition, the study of breathing dynamics linked to physiological CO2 fluctuations is challenged by the vasodilatory effect of CO2, which further worsens the entanglement between the signal of interest and nonspecific effects [10]. To overcome this limitation in the specific context of functional magnetic resonance imaging (fMRI) studies of the central control of breathing, standard approaches to physiological noise correction have been questioned [11,12]. On the other hand, a supralinear relation between blood oxygenation level-dependent (BOLD) signal changes and CO2 levels in chemosensitive regions has been hypothesized as a possible solution to distinguish between specific and nonspecific effects of hypercapnia [13].
Here, the methodology that can be adopted to test this hypothesis is introduced and applied to fMRI data acquired from six healthy subjects during CO2 challenges. Specifically, we describe an analytic approach, merging both exploratory and confirmatory strategies, which aims at identifying the local supralinear changes in BOLD activity associated with a specific neural response to hypercapnia. The approach is based on masked independent component analysis (mICA, ICA, [14]), a data-driven technique that has been specifically designed for studying the activity of the brainstem. This technique is integrated with polynomial regression on the estimated percent signal change for each independent component across different levels of inspired CO2. Model evaluation scores are employed to detect areas expressing a supralinear relation between CO2 levels and activation of the CO2-related component.

2. Materials and Methods

Three runs of functional images were acquired for each subject on a cohort of 8 healthy volunteers (age: 31 ± 8 years, 2 female) using a GE Signa HDx 3 Tesla scanner. Images (TR = 2000 ms, TE = 30 ms, and 3 × 3 × 3 mm3 isotropic voxel size) allowed for a partial head coverage centered on the brainstem, subcortical nuclei, and cortical regions above them, with 20 coronal slices acquired on an oblique plane parallel to the dorsal edge of the brainstem to minimize distortion and motion artifacts [15]. For the whole length of the experiment, subjects had to breathe through a face mask connected to a unidirectional T-valve. The three runs consisted of three different protocols, applied in a randomized order: one run of free breathing (FB) with standard air composition, and two runs of gas administration, one with a mixture of 3% CO2 and 21% O2 (CO2_3%), and one with a mixture of 7% CO2 and 21% O2 (CO2_7%), both inducing hypercapnia in normoxic conditions. Gas administration was performed in 12 cycles of 30 s of room air alternated with 30 s of a hypercapnic mixture, for a total run length of 12 min. An additional T1-weighted anatomical 3D FSPGR image was acquired for each subject to allow the registration of functional images to a standard template. All subjects had to sign an informed consent. The experimental protocol was approved by the Institutional Ethical Committee and carried out in accordance with The Code of Ethics of the World Medical Association. One subject was excluded from the analysis due to excessive movement, probably caused by high sensitivity to CO2 that caused discomfort. Another subject was excluded due to excessive distortions that impaired the co-registration process. The final sample size amounts to 6 subjects.
All runs were preprocessed independently in AFNI (Analysis of Functional NeuroImages, [16]). Function Magnetic Resonance Imagining runs were truncated to 300 time points since preliminary analyses evidenced a general increase in motion artifacts at the end of each acquisition, possibly caused by conscious or unconscious complaints of CO2 challenges. Images underwent slices of temporal alignment (AFNI version 21.2, program 3dTshift), inter-volume rigid-body alignment (AFNI program 3dvolreg), a two-steps affine, and nonlinear warp to register the functional images to the anatomy (AFNI version 21.2, programs 3dAllineate and 3dQWarp), a registration to the OASIS template using ANTs (Advanced Normalization Tools) to compute the affine matrix defining the transformation, and finally, images were spatially blurred by convolution with a gaussian kernel having a 3 mm full-width half-maximum.
Group ICA: Independent component analysis (ICA) was performed at the group level separately for each one of the three tasks (FB, CO2_3%, CO2_7%) using the Matlab Toolbox GIFT (Group ICA Of fMRI Toolbox, [17]). We employed subject-specific principal component analysis (PCA) and GICA3 (group ICA 3) back-reconstruction. In this way, we obtained group spatial maps and their projection to the subject level. Before entering ICA decomposition, each dataset was scaled using the option “intensity normalization”, which removes the mean from every voxel’s time series. The model order was estimated with the built-in Maximum Description Length (MDL) criterion but limited to a maximum number of allowed components to 20, in order to avoid component splitting [18]. The algorithm fastICA [19] was used to implement the decomposition, with the hyperbolic tangent as a nonlinear function used to approximate negentropy. The reliability of components was assessed with the ICASSO method [20], for which the number of repetitions was set to 100.
Spatial masks: The analysis was repeated using two different masks, one, labelled “global” and including the whole field of view (Figure 1B), and one labelled “subcortical”, including only the brainstem and subcortical nuclei, and excluding the cortex, cerebellum and all ventricles (Figure 1A). Both masks were further customized to exclude from the analysis the voxels at the border of the field of view and those at the anterior edge of the pons since residual distortions and motion artifacts have a particular impact on these regions. Among the other options provided by the GIFT toolbox, we selected “no scaling” for the postprocessing of results.
The component selection was performed first on the spatial domain, discarding components related to noise by gold-standard visual inspection, following criteria exposed by Griffanti et al. [21]. Then, for CO2_3% CO2_7% data, we evaluated the CO2-relatedness of the components surviving the first selection step, by visualizing their associated time course and their power spectral density. We discarded components that present high-frequency peaks (frequency above 0.10 Hz), and we included in the final selection the components that exhibited temporal periodicity similar to that of the task, i.e., components that present a maximum for the power spectral density function in a neighborhood of 1/60 Hz, i.e., the characteristic frequency of the task.
After component selection, we implemented a qualitative procedure to define triads of similar components from each condition (FB, CO2_3%, CO2_7%), with the goal of identifying the same component across different levels of inspired CO2 and characterize differences in activation levels. A triplet was defined if it included a FB component, a CO2_3% component, and a CO2_7% component, mutually correlated with a spatial Pearson correlation coefficient ρ ≥ 0.5.
At the subject level, the spatial maps were multiplied by the maximum of the associated time series: thanks to the applied scaling, back-projected spatial maps of selected triplets are expressed in terms of percent signal change. We assume that a high level of spatial similarity across components is an indication that the same component has been found across the three tasks. Under this assumption, at each voxel, our approach provides for each triplet and for each subject the percentage of signal explained by the considered component.
The relationship between the three activation values (dependent variable y = [yCO2_FB yCO2_3% yCO2_7%]) and the associated three levels of administered CO2 (independent variable x = [0%, 3%, and 7%]), was tested by fitting voxel-by-voxel two different polynomial models, i.e., a first-order one and a second-order one, using linear regression. Thus, for each voxel two coefficients a0 and a1 for the linear model, and three coefficients b0, b1, and b2 for the quadratic one, are obtained (1):
y = a 0 + x × a 1 + w , y = b 0 + x × b 1 + x 2 × b 2 + w .
Coefficients in Equation (1) are derived using iteratively reweighted least-squares estimation. The algorithm iteratively performs weighted least-square fitting, updating the weights at each iteration on the base of the distance of points from model predictions in the previous iteration [22]. For both models, the adjusted R2 statistic was extracted for each voxel as a measure of fit quality, which is independent of the number of model coefficients. Finally, we evaluated the difference between the two adjusted R2 values (i.e., adjR2quadratic–adjR2linear) to identify the voxels for which the quadratic model fits better than the linear one. Since in this work we are focused on finding supralinear relations between CO2 and BOLD activity, we imposed a set of conditions on the values of regression coefficients. Specifically, we wanted the BOLD activity to increase with CO2, and the concavity of the quadratic relationship to be positive. The conditions imposed on regression coefficients are thus:
(1)
b2 > 0 as tested with a t-test with alpha = 5%
(2)
a1 > 0 as tested with a t-test with alpha = 5%
(3)
y (x = 3%) > y (x = 0%)
We generated maps of the difference between the adjusted R2 of the nonlinear model and the adjusted R2 of the linear one. Maps are thresholded with a mask defined by voxels satisfying all the conditions on regression coefficients and showing a positive difference, i.e., a higher R2 for the nonlinear model. On these maps, we also applied a threshold of 2 for the cluster size. A summary of the whole analysis pipeline is reported with a flowchart in Figure 2.

3. Results

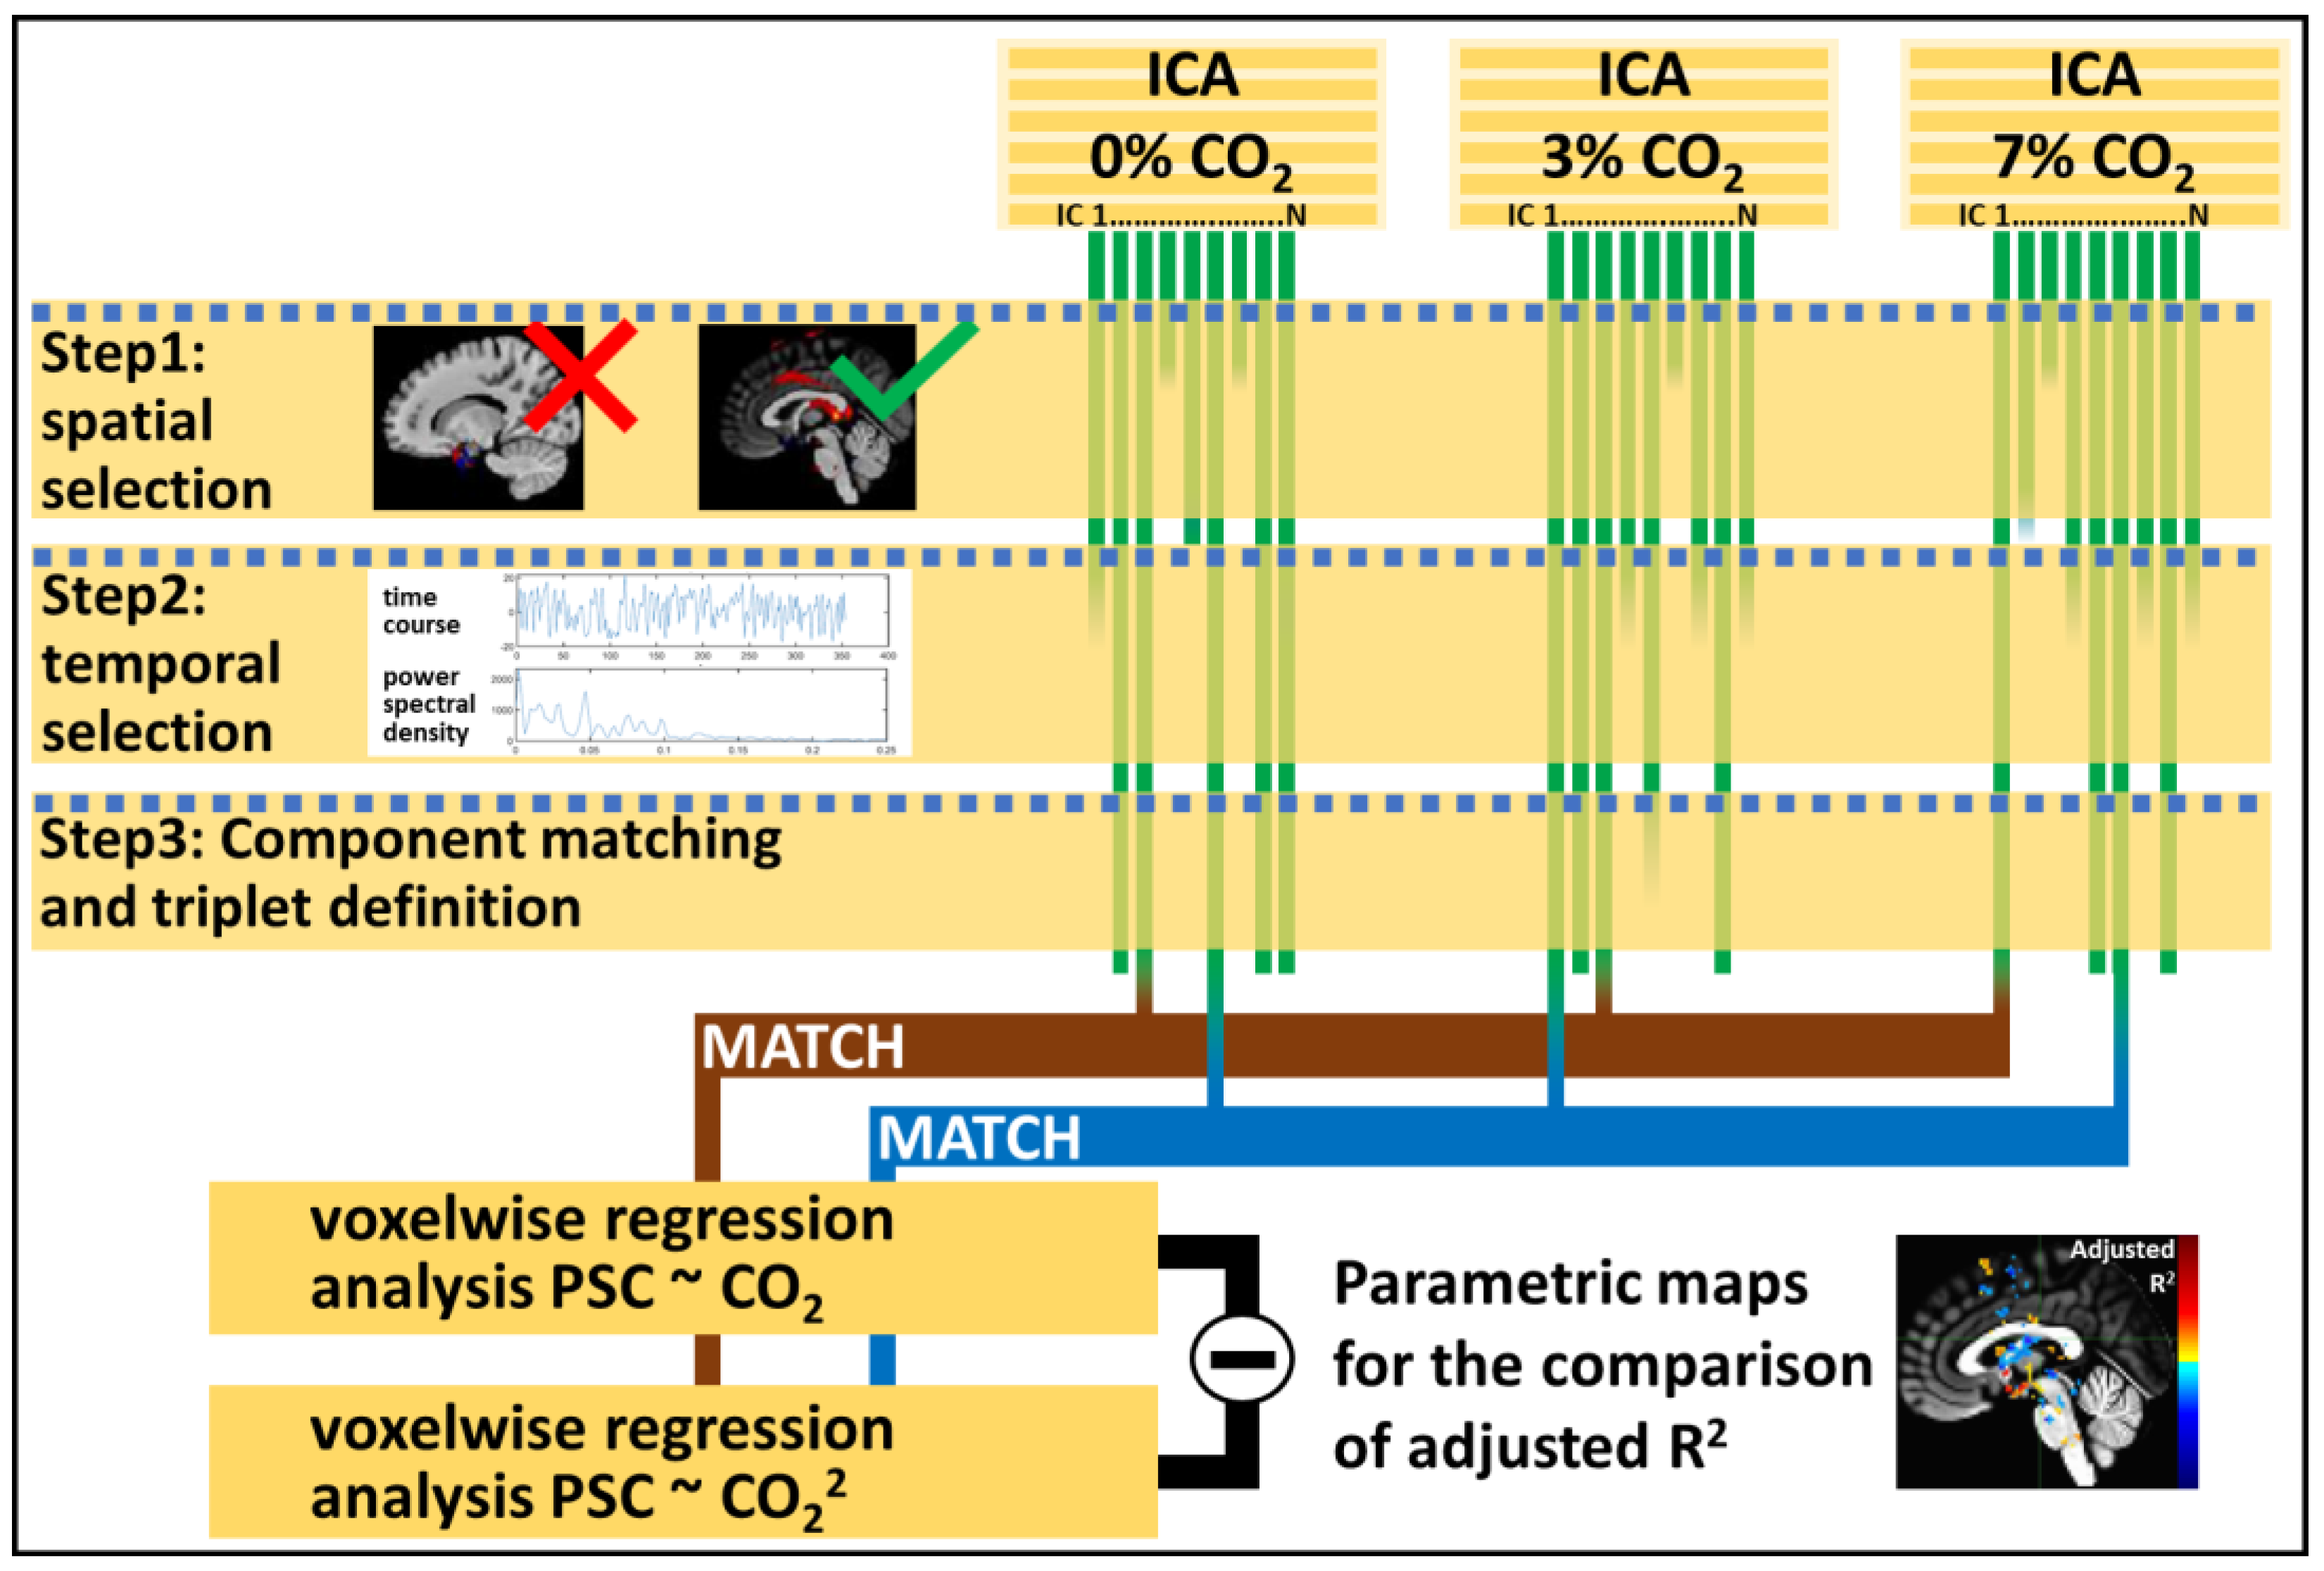
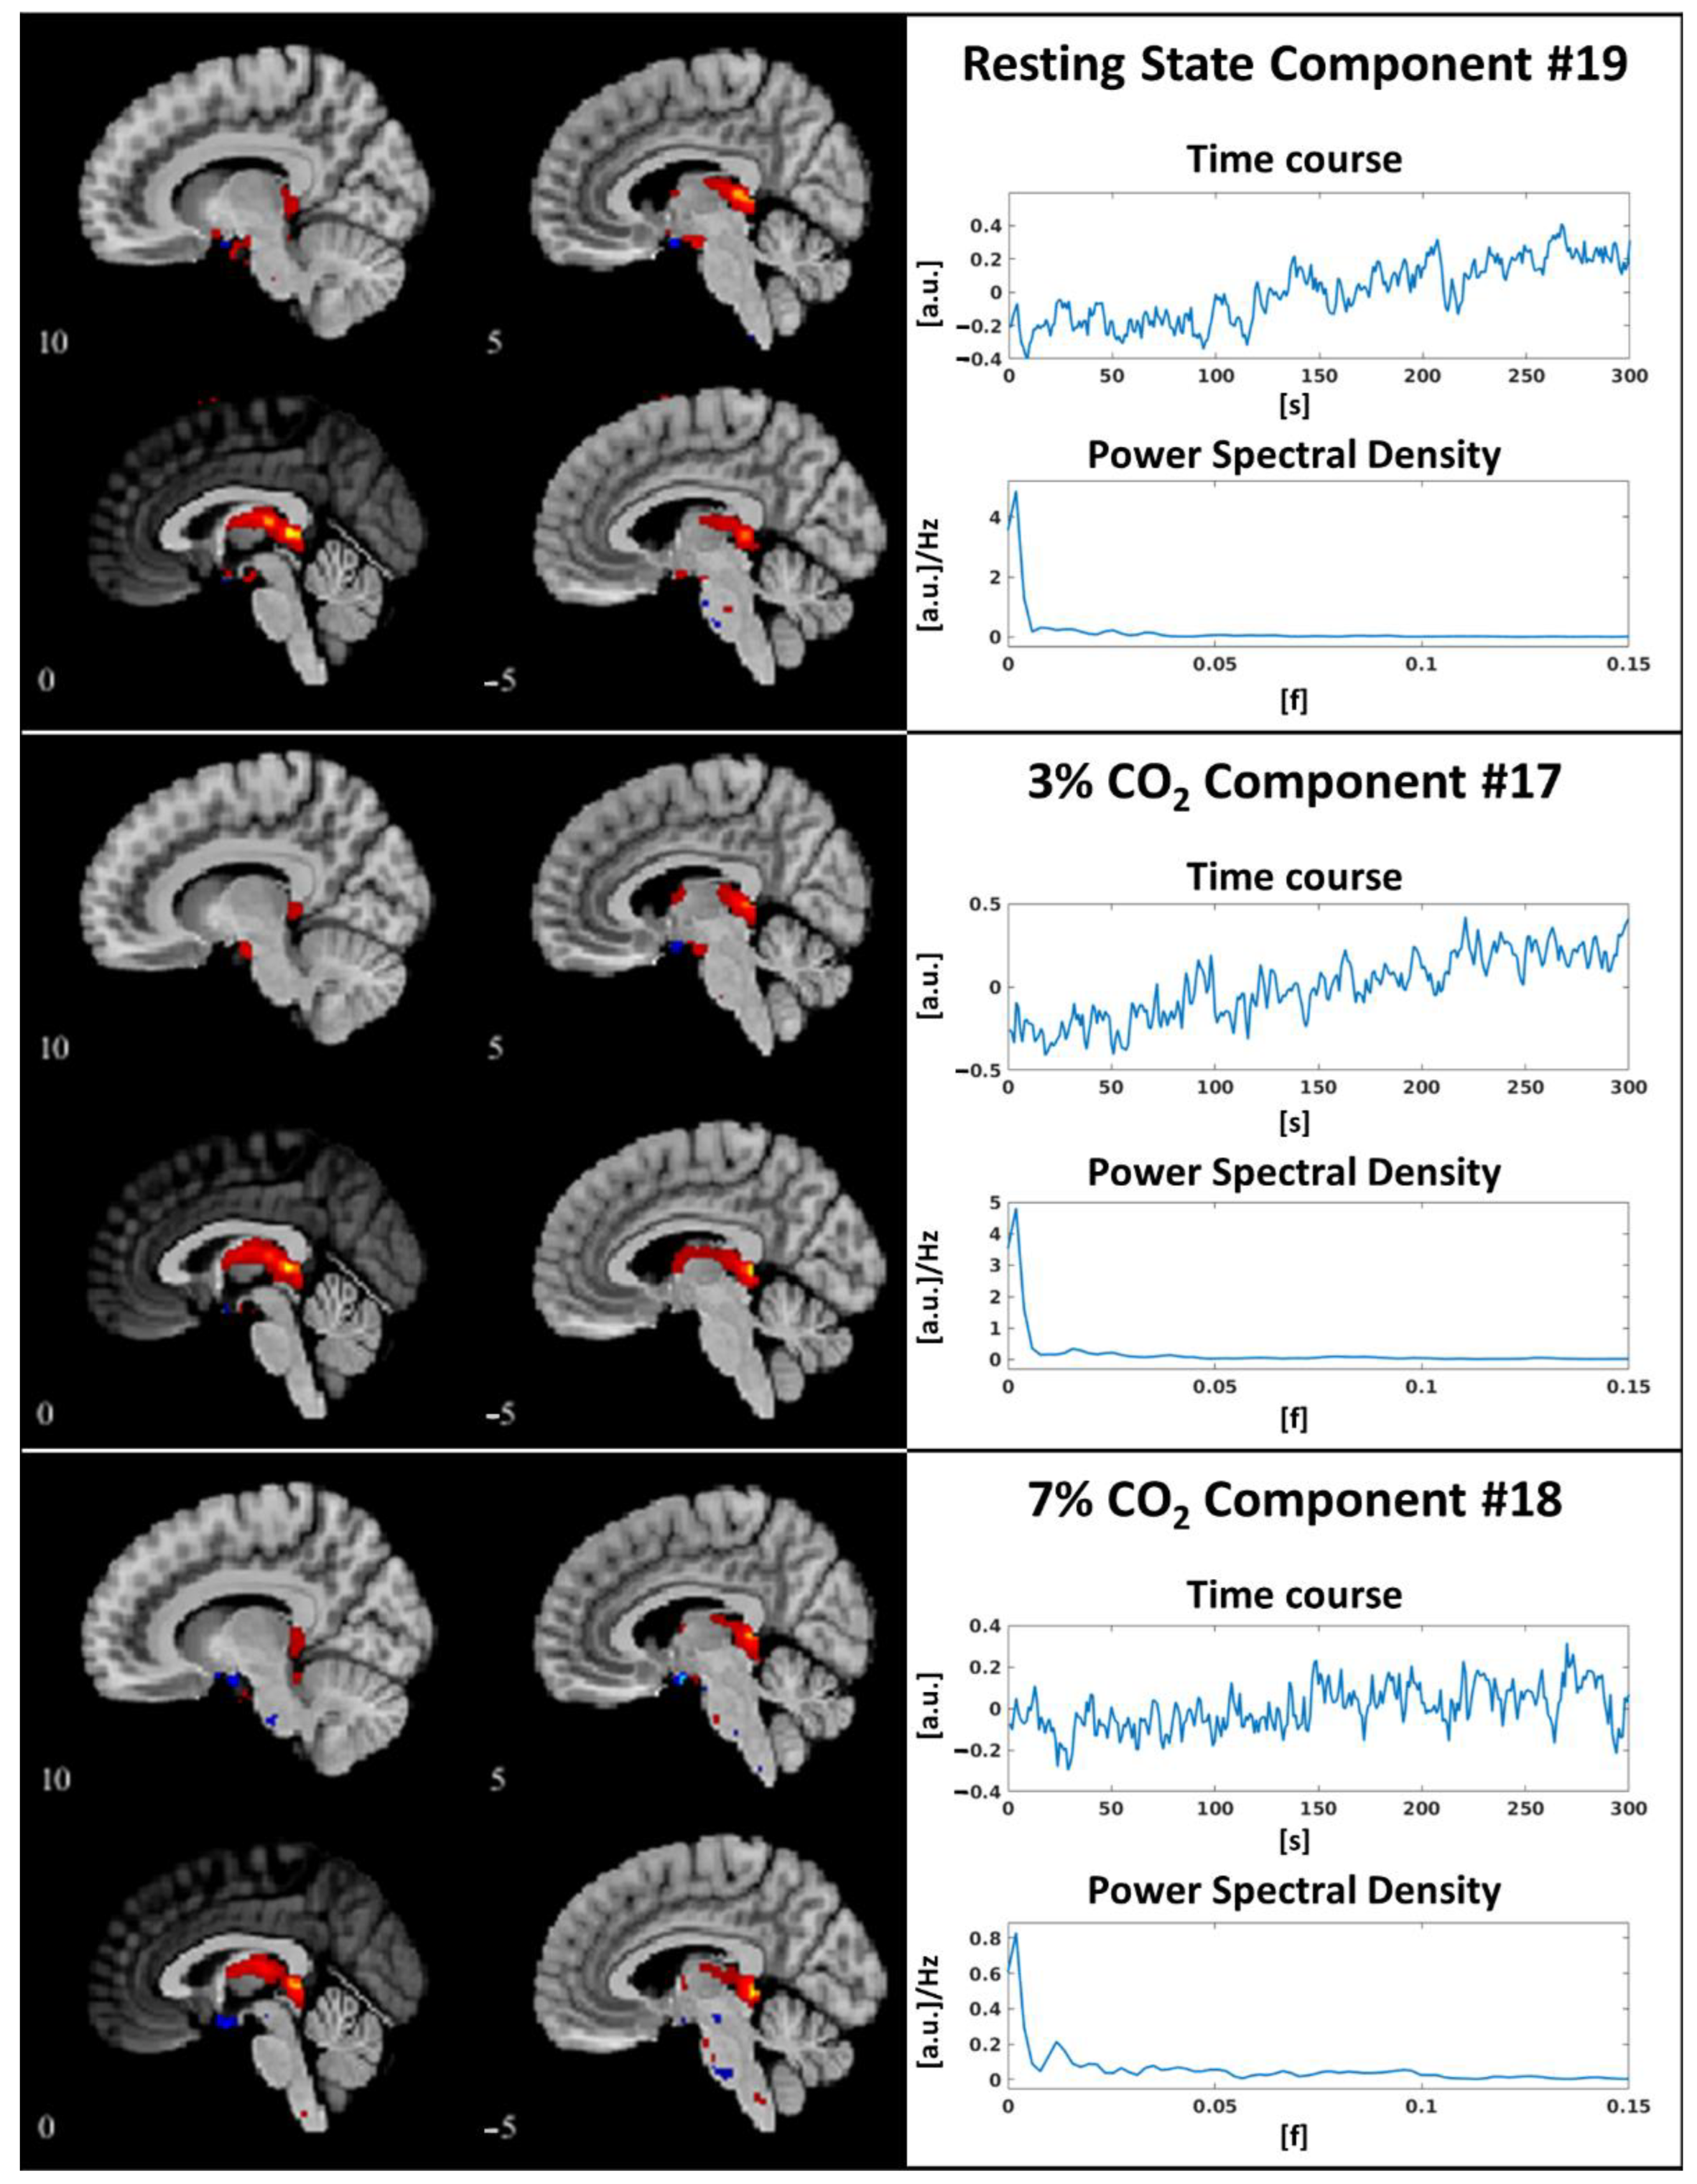
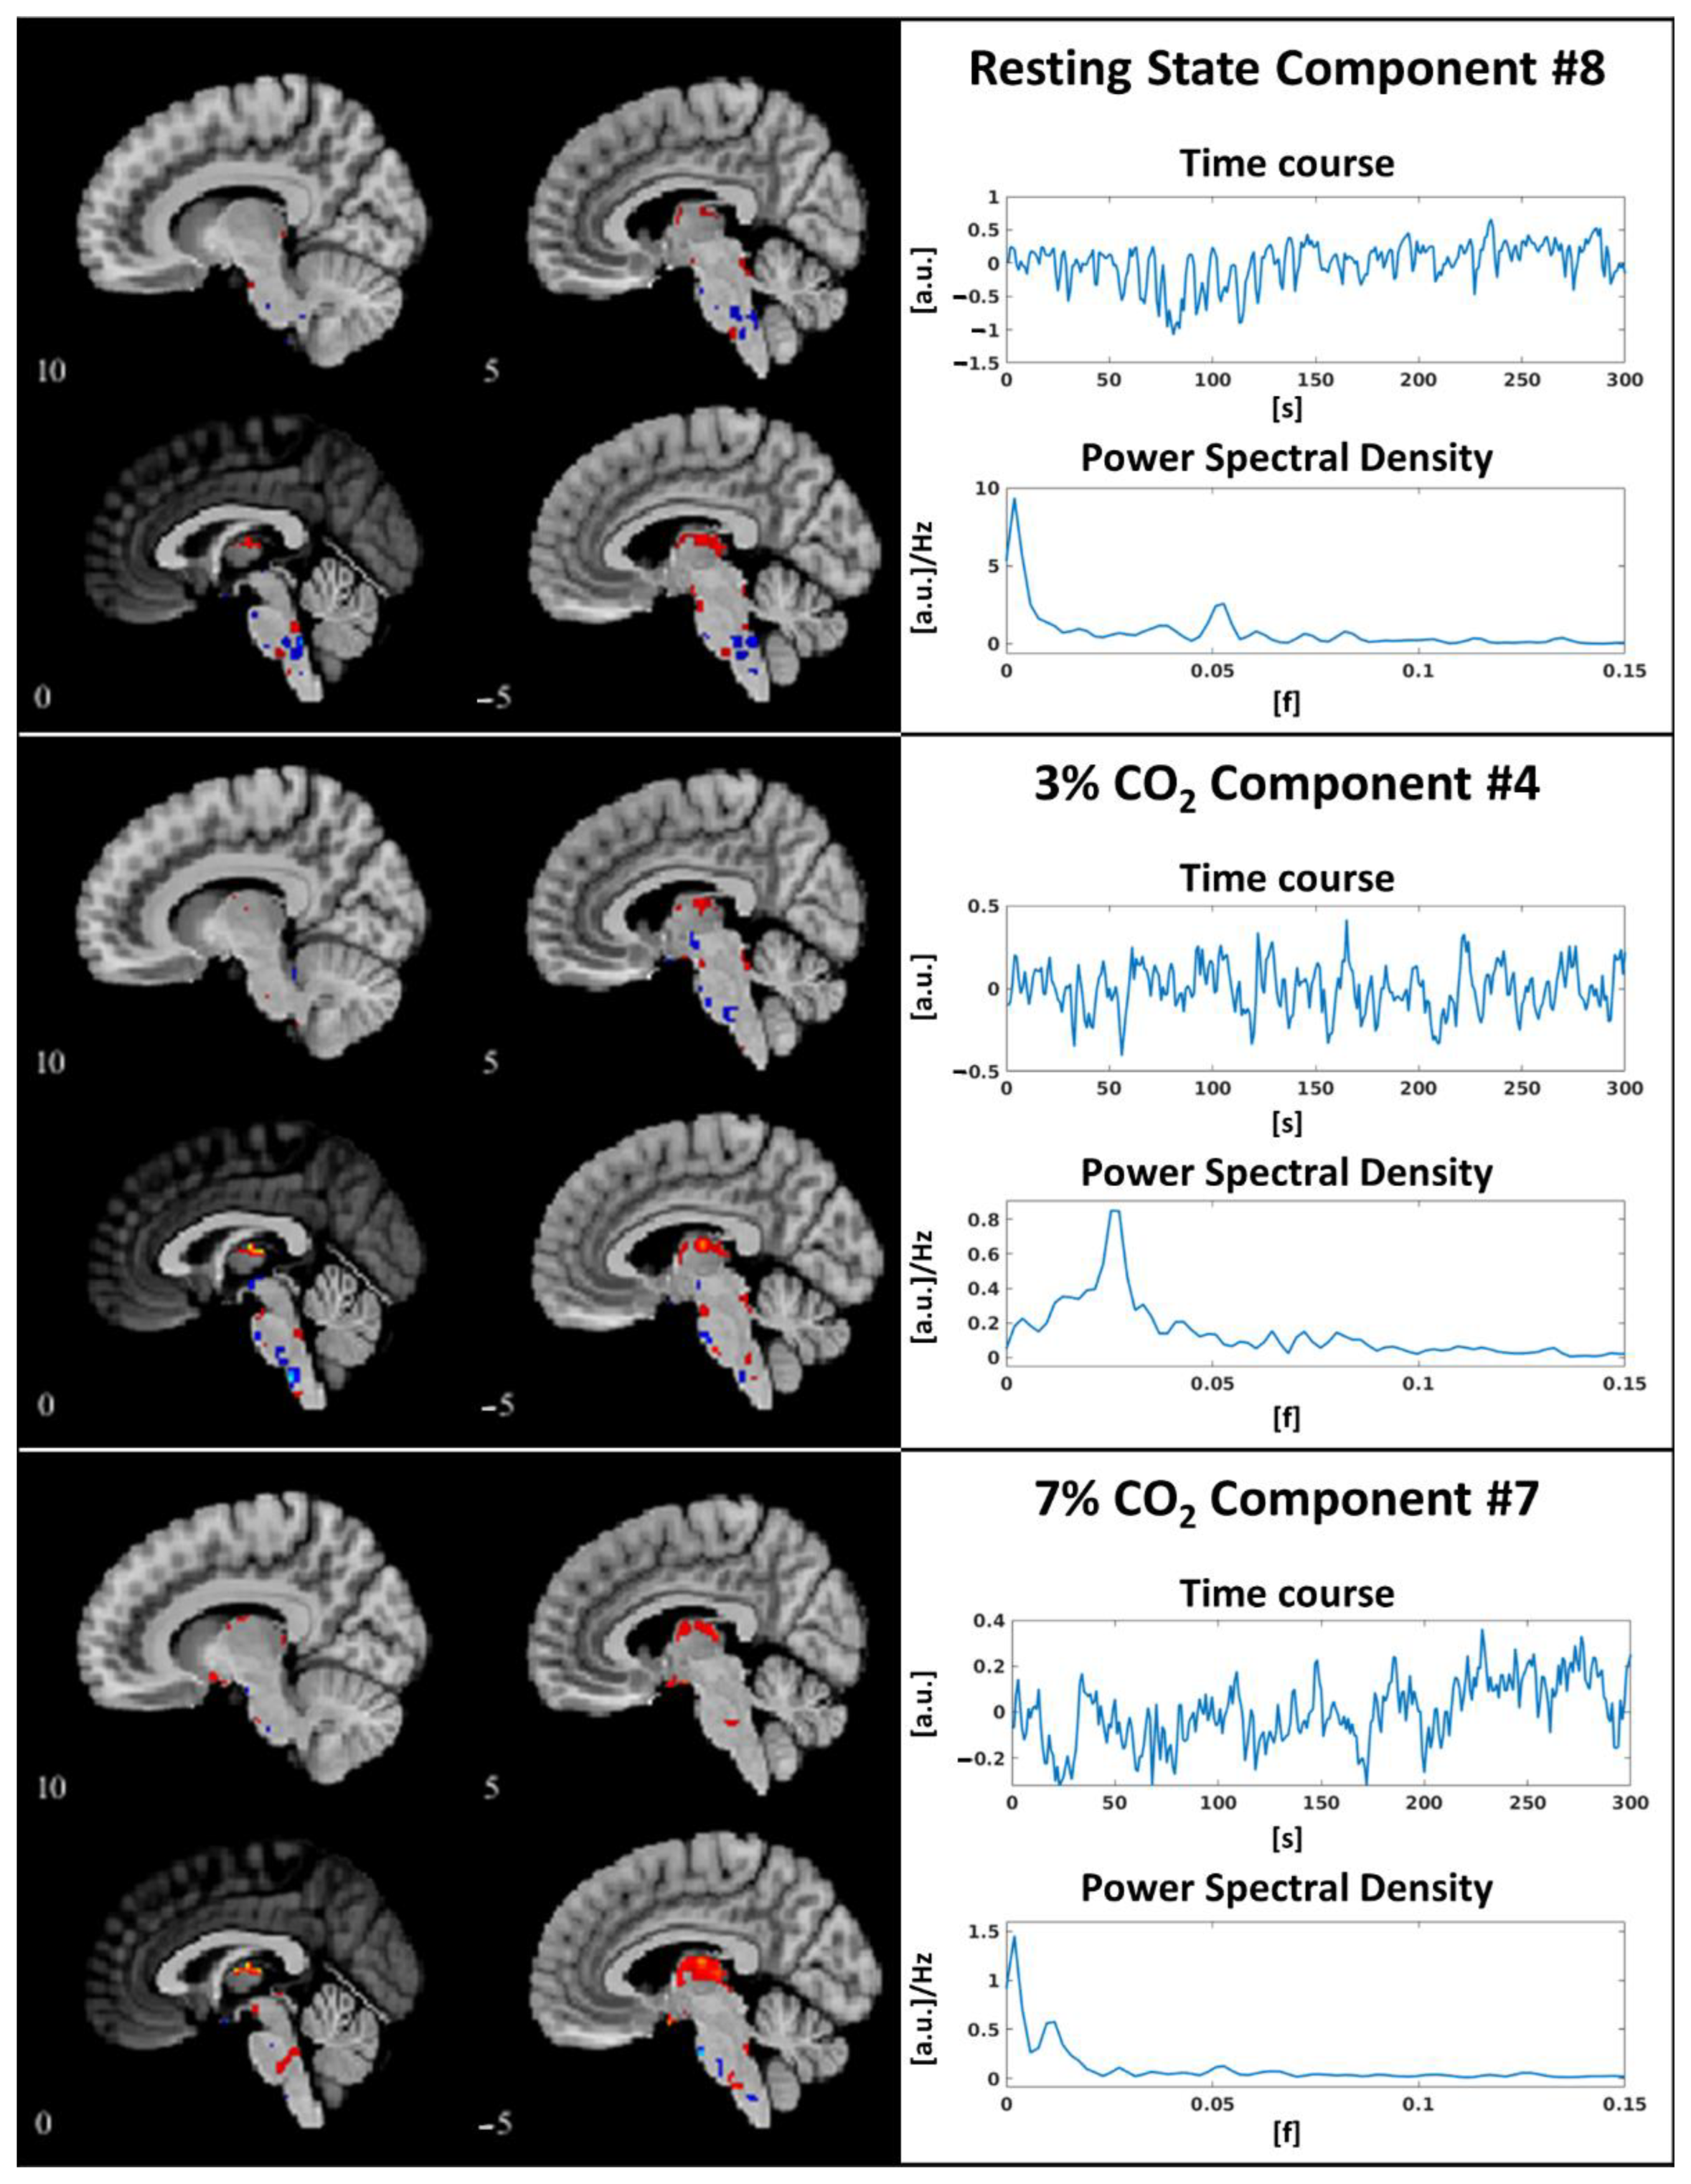
3.1. Independent Component Selection and Triad Identification

For what regards component selection, we reported for the global mask two components selected at 3% CO2 (#17 and #20) and two components selected at 7% (#18 and #20). For the subcortical mask, we reported two components selected at 3% CO2 (#4 and #9) and two components selected at 7% (#7 and #9). The model order estimated with the MDL criterion on the global mask was 40 and 41 respectively for 3% and 7% CO2. Therefore, we limited the number of components to 20. For the subcortical mask, the estimated number of components was 9 for both 3% and 7% CO2, therefore this value was kept.
We related component maps with each other using Pearson correlation to define tuples of similar components. In Table 1 we reported for the global mask and the subcortical mask the couples of components extracted from different analyses associated with a spatial Pearson correlation coefficient ρ ≥ 0.5. Only two triplets of similar components satisfied the employed criteria: 19 (0%)–17 (3%)–18 (7%) (marked with 1 in Table 1) for the global mask and 8 (0%)–7 (3%)–4 (7%) (marked with 2 in Table 1) for the subcortical mask. For the two triplets, we showed the spatial maps and the temporal characterization in Figure 3 and Figure 4.
The two triplets of inter-task similar components 19 (0%)–17 (3%)–18 (7%) and 8 (0%)–4 (3%)–7 (7%) were compared in terms of spatial Pearson correlation, showing correlation coefficients ρ = 0.61 for CO2 at 0% ρ = 0.85 for CO2 at 3%, and ρ = 0.58 for CO2 at 7%.

3.2. Quadratic Model

For the two highlighted triplets of independent components, both the linear and the quadratic models were tested, then the parametric maps of the difference between adjusted R2 were thresholded as detailed in the methods section. Clusters of supralinear dependency between CO2 levels and selected component activations were isolated and their maps are displayed in Figure 5 for the 7 clusters associated with the 19 (0%)–17 (3%)–18 (7%) tuple and in Figure 6 for the 9 clusters associated to the 8 (0%)–4 (3%)–7 (7%) tuple.

4. Discussion

In fMRI, the brainstem is still way understudied with respect to the cortex. The investigation of these deep regions demands tailored approaches that account for the higher levels of noise and non-specific effects, and the smaller size of structures. In this study, we explored a novel brainstem-specific analysis pipeline for the detection of supralinear dynamics in CO2-dependent BOLD signal changes isolated with independent component analysis.
The use of a data-driven approach fits with our need to highlight components of interest without a strong a priori hypothesis about temporal dynamics of the central response to hypercapnic events, within each task, e.g., gas challenge, as well as across different breathing tasks. Specifically, it allowed the highlighting of possible neural as well as vascular-related signal changes after hypercapnic stimuli, with a common distribution across different gas challenges and breathing of standard air. The successive exploratory modelling steps using linear and supralinear functions of CO2 concentration changes at the group level might be used to explore possible evidence for the hypothesis of brain activation having supralinear dependencies on CO2 changes. The selected components cover key subcortical candidates for central chemoreception in the hypothalamus and the brainstem, relay centers in the thalamus and basal ganglia, and key autonomic-regulating cortical nodes such as the cingulate and frontal cortex. Here, we focused on dynamics that are robustly linked to CO2 fluctuations across different levels of inspired CO2. The two extracted triplets express maps showing maxima over thalamic regions, but they also covered part of the ventricles as well as highly perfused regions. This confirms the strong entanglement between specific CO2-related BOLD signal changes, related to neural activity, and non-specific effects linked to the CO2 vasodilatory effect [23]. Notably, by isolating regions in which the percent signal change is mostly explained by the quadratic model, we observe an exclusion of non-specific activations. Particularly, most of the clusters reported in Figure 5 and Figure 6 are easily interpretable in the context of the central control of breathing as they cover the thalamus, putamen, or hypothalamus. CO2-dependent neural activation in the hypothalamus is in line with the presence of orexin neurons, which are believed to exert vigilance-dependent modulation on the activity of primary chemoreceptors in the medullary raphe [24]. Activation in the putamen, which is highly targeted by cortical autonomic hubs [25], had already been observed in [13] and associated with top-down non-sensory feedback to autonomic control. In the brainstem, a cluster is located along the lower dorsal median line of the pons, possibly activating structures of the ascending arousal network [26] such as locus coeruleus, parabrachial nuclei, and laterodorsal tegmentum, and involved in alarm-triggering responses to autonomic processes [27]. In close proximity to the pontomedullary junction, we expect to find key primary and secondary chemoreceptive sites such as the medullary raphe and the retrotrapezoid nuclei [28,29]. The presence of activity in the ventral pontine and periaqueductal regions is of less straight-forward interpretation, nonetheless, we observe that the brainstem networks regulating arousal and the switch between voluntary and autonomic motion are highly interconnected and in close proximity with the central autonomic control network.
It is worth noting that the component selection step performed on group maps and time series provided eight components among which four end up being included in the triplets of inter-task similar components, i.e., end up being recognized as robust across tasks. For the two components, nine (3%) and nine (7%) were extracted with the brainstem mask, and for the two components 20 (3%) and 20 (7%) were extracted with the global mask, no complete triplet could be defined. Although we might discard breathing control centers being activated only at high levels of CO2, here we propose inter-task robustness as a criterion for component selection which, at least in this specific case, seems to work in confirming the presence of the same components of interest indicated by more standard approaches (i.e., the gold-standard visual inspection and the analysis of the time course in the frequency domain). The use of a lower threshold to assess spatial similarity could impact the number of detected triplets. Nevertheless, we reported the two triplets characterized by the highest stability across conditions, and this selection choice allowed to obtain physiologically plausible, albeit conservative, results. Future studies investigating the proper methodology to assess component similarity might reveal a richer network, which would be discussed in an additive fashion in light of the present literature but considering the lower performance in terms of stability.
Masked ICA has been introduced in 2014 exactly for fMRI studies of the brainstem. In fact, deep brainstem regions present lower temporal and spatial SNR [9]. This, as well as the smaller size of brainstem structures with respect to larger cortical processing units, impairs the detection of subcortical dynamics with blind source separation techniques, in favor of cortical ones [12]. Nonetheless, in this work, we obtain an indication of the robustness of our selected components across analyses performed on both subcortical and global masks. This is a supportive finding, as the breathing control network is known to extend to subcortical rhythm-pattern-generating and chemoreceptive nuclei, as well as to cortical autonomic-regulating centers [30]. Nonetheless, local variability is expected in independent component maps extracted with such different masks [23,31,32], therefore we present in this work a regression analysis performed on both triplets.
A limitation of the current study is the reduced sample size, as only six subjects entered the final analysis. In this light, despite the physiological plausibility of the brain network responding supralinearly to increasing levels of administered CO2, we cannot generalize such results to a broader population. In our case, the main limitation is given by the external delivery of CO2 mixtures, possibly causing a sense of discomfort [33]. Specifically, at higher CO2 concentrations we observed a reduced tolerability by some subjects, which caused large head movements and also distress: one subject was excluded due to excess motion, while the remaining time series was shortened to limit the increased movement observed at the end of some acquisitions, as exposed in the Materials section. Crucially, we point out that the goal of this paper is to propose a methodology for the analysis of hypercapnic stimulation, as we underlined in the introduction. The results and the validity of our methodology are supported by (1) the presence of couples of independently-estimated group-level independent components that highly correlate with each other across tasks; (2) the physiological plausibility of brain regions responding to increasing levels of CO2.
The focus on the brainstem is challenged by the limited spatial and temporal resolution of our images. Together with the low tissue contrast and low SNR typical of these regions [10], these factors impair the precision of the co-registration process and the amount and quality of data available for the estimation of components.
The estimation of the model order is performed by imposing an empirical upper threshold. Model order estimation in ICA is a tricky task, around which no clear consensus has been achieved yet [34,35,36]. Consequently, subjective, arbitrary choices are still commonly used [37,38].

5. Conclusions

The goal of this work is to propose a methodological approach to BOLD fMRI studies involving hypercapnic stimulation, by means of CO2 gas challenge. We offer a strategy to characterize independent components on the basis of their temporal relationship with the task, in order to tackle the challenge of results interpretability with data-driven approaches. The physiological plausibility of our results suggests the validity of the proposed approach. Among these, we successfully highlighted subcortical networks showing activation levels that are modulated by the concentration of inhaled CO2 in a supra-linear fashion, namely, the thalamus, the hypothalamus, the putamen, and the brainstem. This last result is particularly interesting as the clusters in which we observed the differences were located along the medial dorsal line, where the ascending arousal network is expected to respond to alarm-triggering sensations exerted by CO2 inhalation, and in the proximity of the pontomedullary junction, where the medullary raphe nuclei, i.e., the main candidates for primary chemoreception. Overall, our results speak in favor of the hypothesis of a supra-linear relation between CO2 and BOLD signal changes in brain regions involved in breathing control and CO2 sensing. Although the small sample size limits the generalizability of our results, the proposed approach is promising for further studying the central response to hypercapnia.

Author Contributions

Conceptualization, A.L.C. and N.V.; Data curation, A.L.C. and M.S.M.; Formal analysis, M.B.; Funding acquisition, C.P., M.E. and N.V.; Investigation, A.L.C., D.M., V.H., M.S.M., F.F., A.G. and N.V.; Methodology, M.B. and S.C.; Project administration, C.P., M.E. and N.V.; Resources, C.P., M.E. and N.V.; Software, M.B. and S.C.; Supervision, C.P., M.E. and N.V.; Validation, S.C., A.L.C. and N.V.; Visualization, M.B. and S.C.; Writing—original draft, M.B., S.C. and A.L.C.; Writing—review & editing, D.M., V.H., M.S.M., F.F., A.G. and N.V. All authors have read and agreed to the published version of the manuscript.

Funding

This research received no external funding.

Data Availability Statement

The data presented in this study are available on request from the corresponding author. The data are not publicly available due to privacy restrictions.

Conflicts of Interest

The authors declare no conflict of interest.

References

  1. Smith, J.C.; Abdala, A.P.L.; Borgmann, A.; Rybak, I.A.; Paton, J.F.R. Brainstem respiratory networks: Building blocks and microcircuits. Trends Neurosci. 2013, 36, 152–162. [Google Scholar] [CrossRef] [Green Version]
  2. Giannoni, A.; Gentile, F.; Navari, A.; Borrelli, C.; Mirizzi, G.; Catapano, G.; Vergaro, G.; Grotti, F.; Betta, M.; Piepoli, M.F.; et al. Contribution of the Lung to the Genesis of Cheyne-Stokes Respiration in Heart Failure: Plant Gain Beyond Chemoreflex Gain and Circulation Time. J. Am. Heart Assoc. 2019, 8, e012419. [Google Scholar] [CrossRef] [PubMed] [Green Version]
  3. Giannoni, A.; Gentile, F.; Buoncristiani, F.; Borrelli, C.; Sciarrone, P.; Spiesshoefer, J.; Bramanti, F.; Iudice, G.; Javaheri, S.; Emdin, M.; et al. Chemoreflex and Baroreflex Sensitivity Hold a Strong Prognostic Value in Chronic Heart Failure. JACC Heart Fail. 2022, 10, 662–676. [Google Scholar] [CrossRef] [PubMed]
  4. Giannoni, A.; Morelli, M.S.; Francis, D. Pathophysiology of Central Apneas in Heart Failure. In The Breathless Heart; Springer International Publishing: Cham, Switzerland, 2017; pp. 91–123. [Google Scholar]
  5. Devinsky, O.; Hesdorffer, D.C.; Thurman, D.J.; Lhatoo, S.; Richerson, G. Sudden unexpected death in epilepsy: Epidemiology, mechanisms, and prevention. Lancet Neurol. 2016, 15, 1075–1088. [Google Scholar] [CrossRef] [PubMed]
  6. Kinney, H.C.; Richerson, G.B.; Dymecki, S.M.; Darnall, R.A.; Nattie, E.E. The Brainstem and Serotonin in the Sudden Infant Death Syndrome. Annu. Rev. Pathol. Mech. Dis. 2009, 4, 517–550. [Google Scholar] [CrossRef] [PubMed] [Green Version]
  7. Bianciardi, M.; Toschi, N.; Edlow, B.L.; Eichner, C.; Setsompop, K.; Polimeni, J.R.; Brown, E.N.; Kinney, H.C.; Rosen, B.R.; Wald, L.L. Toward an In Vivo Neuroimaging Template of Human Brainstem Nuclei of the Ascending Arousal, Autonomic, and Motor Systems. Brain Connect. 2015, 5, 597–607. [Google Scholar] [CrossRef] [PubMed] [Green Version]
  8. Singh, K.; Cauzzo, S.; Garcia Gomar, M.G.; Stauder, M.; Vanello, N.; Passino, C.; Bianciardi, M.; García-Gomar, M.G.; Stauder, M.; Vanello, N.; et al. Functional connectome of arousal and motor brainstem nuclei in living humans by 7 Tesla resting-state fMRI. Neuroimage 2022, 249, 118865. [Google Scholar] [CrossRef]
  9. Brooks, J.C.W.; Faull, O.K.; Pattinson, K.T.S.; Jenkinson, M. Physiological Noise in Brainstem fMRI. Front. Hum. Neurosci. 2013, 7, 623. [Google Scholar] [CrossRef] [Green Version]
  10. Beissner, F. Functional MRI of the Brainstem: Common Problems and their Solutions. Clin. Neuroradiol. 2015, 25, 251–257. [Google Scholar] [CrossRef]
  11. Cauzzo, S.; Callara, A.L.; Morelli, M.S.; Hartwig, V.; Esposito, F.; Montanaro, D.; Passino, C.; Emdin, M.; Giannoni, A.; Vanello, N. Mapping dependencies of BOLD signal change to end-tidal CO2: Linear and nonlinear modeling, and effect of physiological noise correction. J. Neurosci. Methods 2021, 362, 109317. [Google Scholar] [CrossRef]
  12. Ciumas, C.; Rheims, S.; Ryvlin, P. fMRI studies evaluating central respiratory control in humans. Front. Neural Circuits 2022, 16, 982963. [Google Scholar] [CrossRef] [PubMed]
  13. Pattinson, K.T.S.; Mitsis, G.D.; Harvey, A.K.; Jbabdi, S.; Dirckx, S.; Mayhew, S.D.; Rogers, R.; Tracey, I.; Wise, R.G. Determination of the human brainstem respiratory control network and its cortical connections in vivo using functional and structural imaging. Neuroimage 2009, 44, 295–305. [Google Scholar] [CrossRef] [PubMed]
  14. Beissner, F.; Schumann, A.; Brunn, F.; Eisenträger, D.; Bär, K.-J. Advances in functional magnetic resonance imaging of the human brainstem. Neuroimage 2014, 86, 91–98. [Google Scholar] [CrossRef] [PubMed] [Green Version]
  15. Napadow, V.; Dhond, R.; Park, K.; Kim, J.; Makris, N.; Kwong, K.K.; Harris, R.E.; Purdon, P.L.; Kettner, N.; Hui, K.K.S. Time-variant fMRI activity in the brainstem and higher structures in response to acupuncture. Neuroimage 2009, 47, 289–301. [Google Scholar] [CrossRef] [PubMed] [Green Version]
  16. Cox, R.W. AFNI: Software for analysis and visualization of functional magnetic resonance neuroimages. Comput. Biomed. Res. 1996, 29, 162–173. [Google Scholar] [CrossRef] [PubMed]
  17. Calhoun, V.D.; Adali, T.; Pearlson, G.D.; Pekar, J.J. A method for making group inferences from functional MRI data using independent component analysis. Hum. Brain Mapp. 2001, 14, 140–151. [Google Scholar] [CrossRef]
  18. Vanello, N.; Ricciardi, E.; Landini, L. Analysis of Residual Dependencies of Independent Components Extracted from fMRI Data. Comput. Intell. Neurosci. 2016, 2016, 2961727. [Google Scholar] [CrossRef] [Green Version]
  19. Hyvärinen, A.; Oja, E. A Fast Fixed-Point Algorithm for Independent Component Analysis. Neural Comput. 1997, 9, 1483–1492. [Google Scholar] [CrossRef]
  20. Himberg, J.; Hyvärinen, A.; Esposito, F. Validating the independent components of neuroimaging time series via clustering and visualization. Neuroimage 2004, 22, 1214–1222. [Google Scholar] [CrossRef]
  21. Griffanti, L.; Douaud, G.; Bijsterbosch, J.; Evangelisti, S.; Alfaro-Almagro, F.; Glasser, M.F.; Duff, E.P.; Fitzgibbon, S.; Westphal, R.; Carone, D.; et al. Hand classification of fMRI ICA noise components. Neuroimage 2017, 154, 188–205. [Google Scholar] [CrossRef]
  22. Holland, P.W.; Welsch, R.E. Robust regression using iteratively reweighted least-squares. Commun. Stat. Theory Methods 1977, 6, 813–827. [Google Scholar] [CrossRef]
  23. Prokopiou, P.C.; Pattinson, K.T.S.; Wise, R.G.; Mitsis, G.D. Modeling of dynamic cerebrovascular reactivity to spontaneous and externally induced CO2 fluctuations in the human brain using BOLD-fMRI. Neuroimage 2019, 186, 533–548. [Google Scholar] [CrossRef] [PubMed]
  24. Nattie, E.; Li, A. Central Chemoreceptors: Locations and Functions. In Comprehensive Physiology; John Wiley & Sons, Inc.: Hoboken, NJ, USA, 2012; Volume 2, pp. 221–254. ISBN 9788578110796. [Google Scholar]
  25. Saper, C.B. Convergence of autonomic and limbic connections in the insular cortex of the rat. J. Comp. Neurol. 1982, 210, 163–173. [Google Scholar] [CrossRef]
  26. Edlow, B.L.; Takahashi, E.; Wu, O.; Benner, T.; Dai, G.; Bu, L.; Grant, P.E.; Greer, D.M.; Greenberg, S.M.; Kinney, H.C.; et al. Neuroanatomic Connectivity of the Human Ascending Arousal System Critical to Consciousness and Its Disorders. J. Neuropathol. Exp. Neurol. 2012, 71, 531–546. [Google Scholar] [CrossRef] [PubMed]
  27. Mark, G.P.; Shabani, S.; Dobbs, L.K.; Hansen, S.T. Cholinergic modulation of mesolimbic dopamine function and reward. Physiol. Behav. 2011, 104, 76–81. [Google Scholar] [CrossRef] [PubMed] [Green Version]
  28. Wu, Y.; Proch, K.L.; Teran, F.A.; Lechtenberg, R.J.; Kothari, H.; Richerson, G.B. Chemosensitivity of Phox2b-expressing retrotrapezoid neurons is mediated in part by input from 5-HT neurons. J. Physiol. 2019, 597, 2741–2766. [Google Scholar] [CrossRef]
  29. Iceman, K.E.; Richerson, G.B.; Harris, M.B. Medullary serotonin neurons are CO2 sensitive in situ. J. Neurophysiol. 2013, 110, 2536–2544. [Google Scholar] [CrossRef] [Green Version]
  30. Morelli, M.S.; Greco, A.; Valenza, G.; Giannoni, A.; Emdin, M.; Scilingo, E.P.; Vanello, N. Analysis of generic coupling between EEG activity and PETCO2 in free breathing and breath-hold tasks using Maximal Information Coefficient (MIC). Sci. Rep. 2018, 8, 4492. [Google Scholar] [CrossRef]
  31. Stickland, R.C.; Zvolanek, K.M.; Moia, S.; Ayyagari, A.; Caballero-Gaudes, C.; Bright, M.G. A practical modification to a resting state fMRI protocol for improved characterization of cerebrovascular function. Neuroimage 2021, 239, 118306. [Google Scholar] [CrossRef]
  32. Liu, P.; Xu, C.; Lin, Z.; Sur, S.; Li, Y.; Yasar, S.; Rosenberg, P.; Albert, M.; Lu, H. Cerebrovascular reactivity mapping using intermittent breath modulation. Neuroimage 2020, 215, 116787. [Google Scholar] [CrossRef]
  33. Colasanti, A.; Salamon, E.; Schruers, K.; van Diest, R.; van Duinen, M.; Griez, E.J. Carbon Dioxide-Induced Emotion and Respiratory Symptoms in Healthy Volunteers. Neuropsychopharmacology 2008, 33, 3103–3110. [Google Scholar] [CrossRef] [PubMed] [Green Version]
  34. Hu, Y.; Yang, Z. Impact of inter-individual variability on the estimation of default mode network in temporal concatenation group ICA. Neuroimage 2021, 237, 118114. [Google Scholar] [CrossRef] [PubMed]
  35. Kairov, U.; Cantini, L.; Greco, A.; Molkenov, A.; Czerwinska, U.; Barillot, E.; Zinovyev, A. Determining the optimal number of independent components for reproducible transcriptomic data analysis. BMC Genom. 2017, 18, 712. [Google Scholar] [CrossRef] [Green Version]
  36. Majeed, W.; Avison, M.J. Robust Data Driven Model Order Estimation for Independent Component Analysis of fMRI Data with Low Contrast to Noise. PLoS ONE 2014, 9, e94943. [Google Scholar] [CrossRef] [PubMed] [Green Version]
  37. McKeown, M.J. Detection of Consistently Task-Related Activations in fMRI Data with Hybrid Independent Component Analysis. Neuroimage 2000, 11, 24–35. [Google Scholar] [CrossRef] [PubMed] [Green Version]
  38. Smith, S.M.; Miller, K.L.; Moeller, S.; Xu, J.; Auerbach, E.J.; Woolrich, M.W.; Beckmann, C.F.; Jenkinson, M.; Andersson, J.; Glasser, M.F.; et al. Temporally-independent functional modes of spontaneous brain activity. Proc. Natl. Acad. Sci. USA 2012, 109, 3131–3136. [Google Scholar] [CrossRef] [PubMed]
Figure 1. Spatial masks employed in the masked Independent Component Analyses. (A) Subcortical mask, including only the brainstem and subcortical nuclei; (B) Global mask, comprising the whole field of view.
Electronics 12 00290 g001
Figure 2. Proposed analysis pipeline: three separate masked Independent Component Analyses are performed on the three conditions. Extracted components (green lines) undergo three steps of selection. Step 1: Spatial selection, performed on maps by visual inspection according to criteria available in the literature [21]. Step 2: temporal selection, components whose temporal periodicity was similar to that of the task were accepted while components showing high-frequency peaks in the PSD were discarded. Step 3: Component matching and triplet definition: triplets were composed with components showing a mutual correlation above 0.5. Triplets of similar components express for each voxel and for each condition a percent signal change value. Two regression models (one linear and one quadratic) are fitted on the levels of inhaled CO2. The two models are compared in terms of adjusted R2. Positive differences are thresholded by imposing the three conditions reported in the Section 2.
Electronics 12 00290 g002
Figure 3. Triplet selected for the analysis performed using the global mask.
Electronics 12 00290 g003
Figure 4. Triplet selected for the analysis performed using the subcortical mask.
Electronics 12 00290 g004
Figure 5. Clusters of supralinear activation for the 19 (0%)–17 (3%)–18 (7%) triplet extracted from the analysis performed with the global mask. We report the voxels for which the adjusted R2 of the quadratic model was higher than the adjusted R2 of the linear one and that satisfied the conditions: (i) b2 > 0 (p-value < 0.05) (ii) a1 > 0 (p-value < 0.05) and (iii) y (x = 3%) > y (x = 0%).
Electronics 12 00290 g005
Figure 6. Clusters of supralinear activation for the 8 (0%)–4 (3%)–7 (7%) triplet extracted from the analysis performed with the subcortical mask. We report the voxels for which the adjusted R2 of the quadratic model was higher than the adjusted R2 of the linear one and that satisfied the conditions: (i) b2 > 0 (p-value < 0.05) (ii) a1 > 0 (p-value < 0.05) and (iii) y (x = 3%) > y(x = 0%).
Electronics 12 00290 g006
Table 1. Couples of components extracted from two different tasks exhibiting spatial Pearson correlation above 0.5.
Global MaskSubcortical Mask
3–7% (ρ)3–0% (ρ)7–0% (ρ)3–7% (ρ)3–0% (ρ)7–0% (ρ)
4–2 (0.73)1–1 (0.66)2–2 (0.76)1–3 (0.72)1–3 (0.65)3–3 (0.69)
11–5 (0.65)4–2 (0.69)5–10 (0.57)6–2 (0.60)2–1 (0.59)5–1 (0.61)
17–18 (0.64) 111–10 (0.60)18–19 (0.58) 12–5 (0.64)4–8 (0.58) 27–8 (0.60) 2
20–20 (0.54)17–19 (0.73) 120–20 (0.52)4–7 (0.75) 26–4 (0.59)2–4 (0.57)
9–9 (0.51)
1 Triplet for the global mask. 2 Triplet for the subcortical mask.
Disclaimer/Publisher’s Note: The statements, opinions and data contained in all publications are solely those of the individual author(s) and contributor(s) and not of MDPI and/or the editor(s). MDPI and/or the editor(s) disclaim responsibility for any injury to people or property resulting from any ideas, methods, instructions or products referred to in the content.

