1. Introduction
While venipuncture is widely performed for a wide range of clinical applications (e.g., peripheral intravenous catheters, cannulation), the process varies from smooth to complicated depending on a wide array of factors. A patient’s age, gender, skin colour, body mass index (BMI), and medical history have all been shown to influence venipuncture difficulty [
1,
2,
3,
4]. Along with this, the medical practitioner’s skill and experience also have a significant impact on the procedure [
5]. With the prevalence of venipuncture, the issues that stem from difficult intravenous access such as patient distress and diagnostic delays cannot be understated both in terms of the number of occurrences or severity of complications [
6,
7].
To address such cases, various solutions have been proposed and implemented. In some clinical settings, bed-side ultrasound is used by trained medical professionals to locate suitable veins [
8]. However, the technique suffers from a steep learning curve as users need to identify suitable veins by its cross-section in a 2D ultrasound image before mentally projecting the position of the slice back into 3D space [
9]. Furthermore, as some pressure needs to be applied in general to achieve good acoustic coupling between the transducer and the skin, superficial veins are prone to collapse, making their visibility susceptible to user variability. While advances in miniaturized pressure-sensing technologies can allow for the detection of such collapses as a form of vein detection [
10], we focus on non-contact optical based solutions to circumvent potential integration issues that may arise from clinical sterility concerns.
A popular family of alternative solutions exploit the interaction between veins and near-infrared light (NIR). Due to the presence of deoxidized hemoglobin, venous regions absorb much more infrared light in the 600–800 nm range compared to surrounding tissues or arteries which contain oxyhemoglobin [
11]. Many solutions have adopted this physiological principle to visualize the contrasted veins, ranging from hand-held projection devices to static projection stations and automatic cannulation machines [
12]. Such implementations suffer from limited field of view, mobility issues, close-up distance requirements, or hand-held requirements.
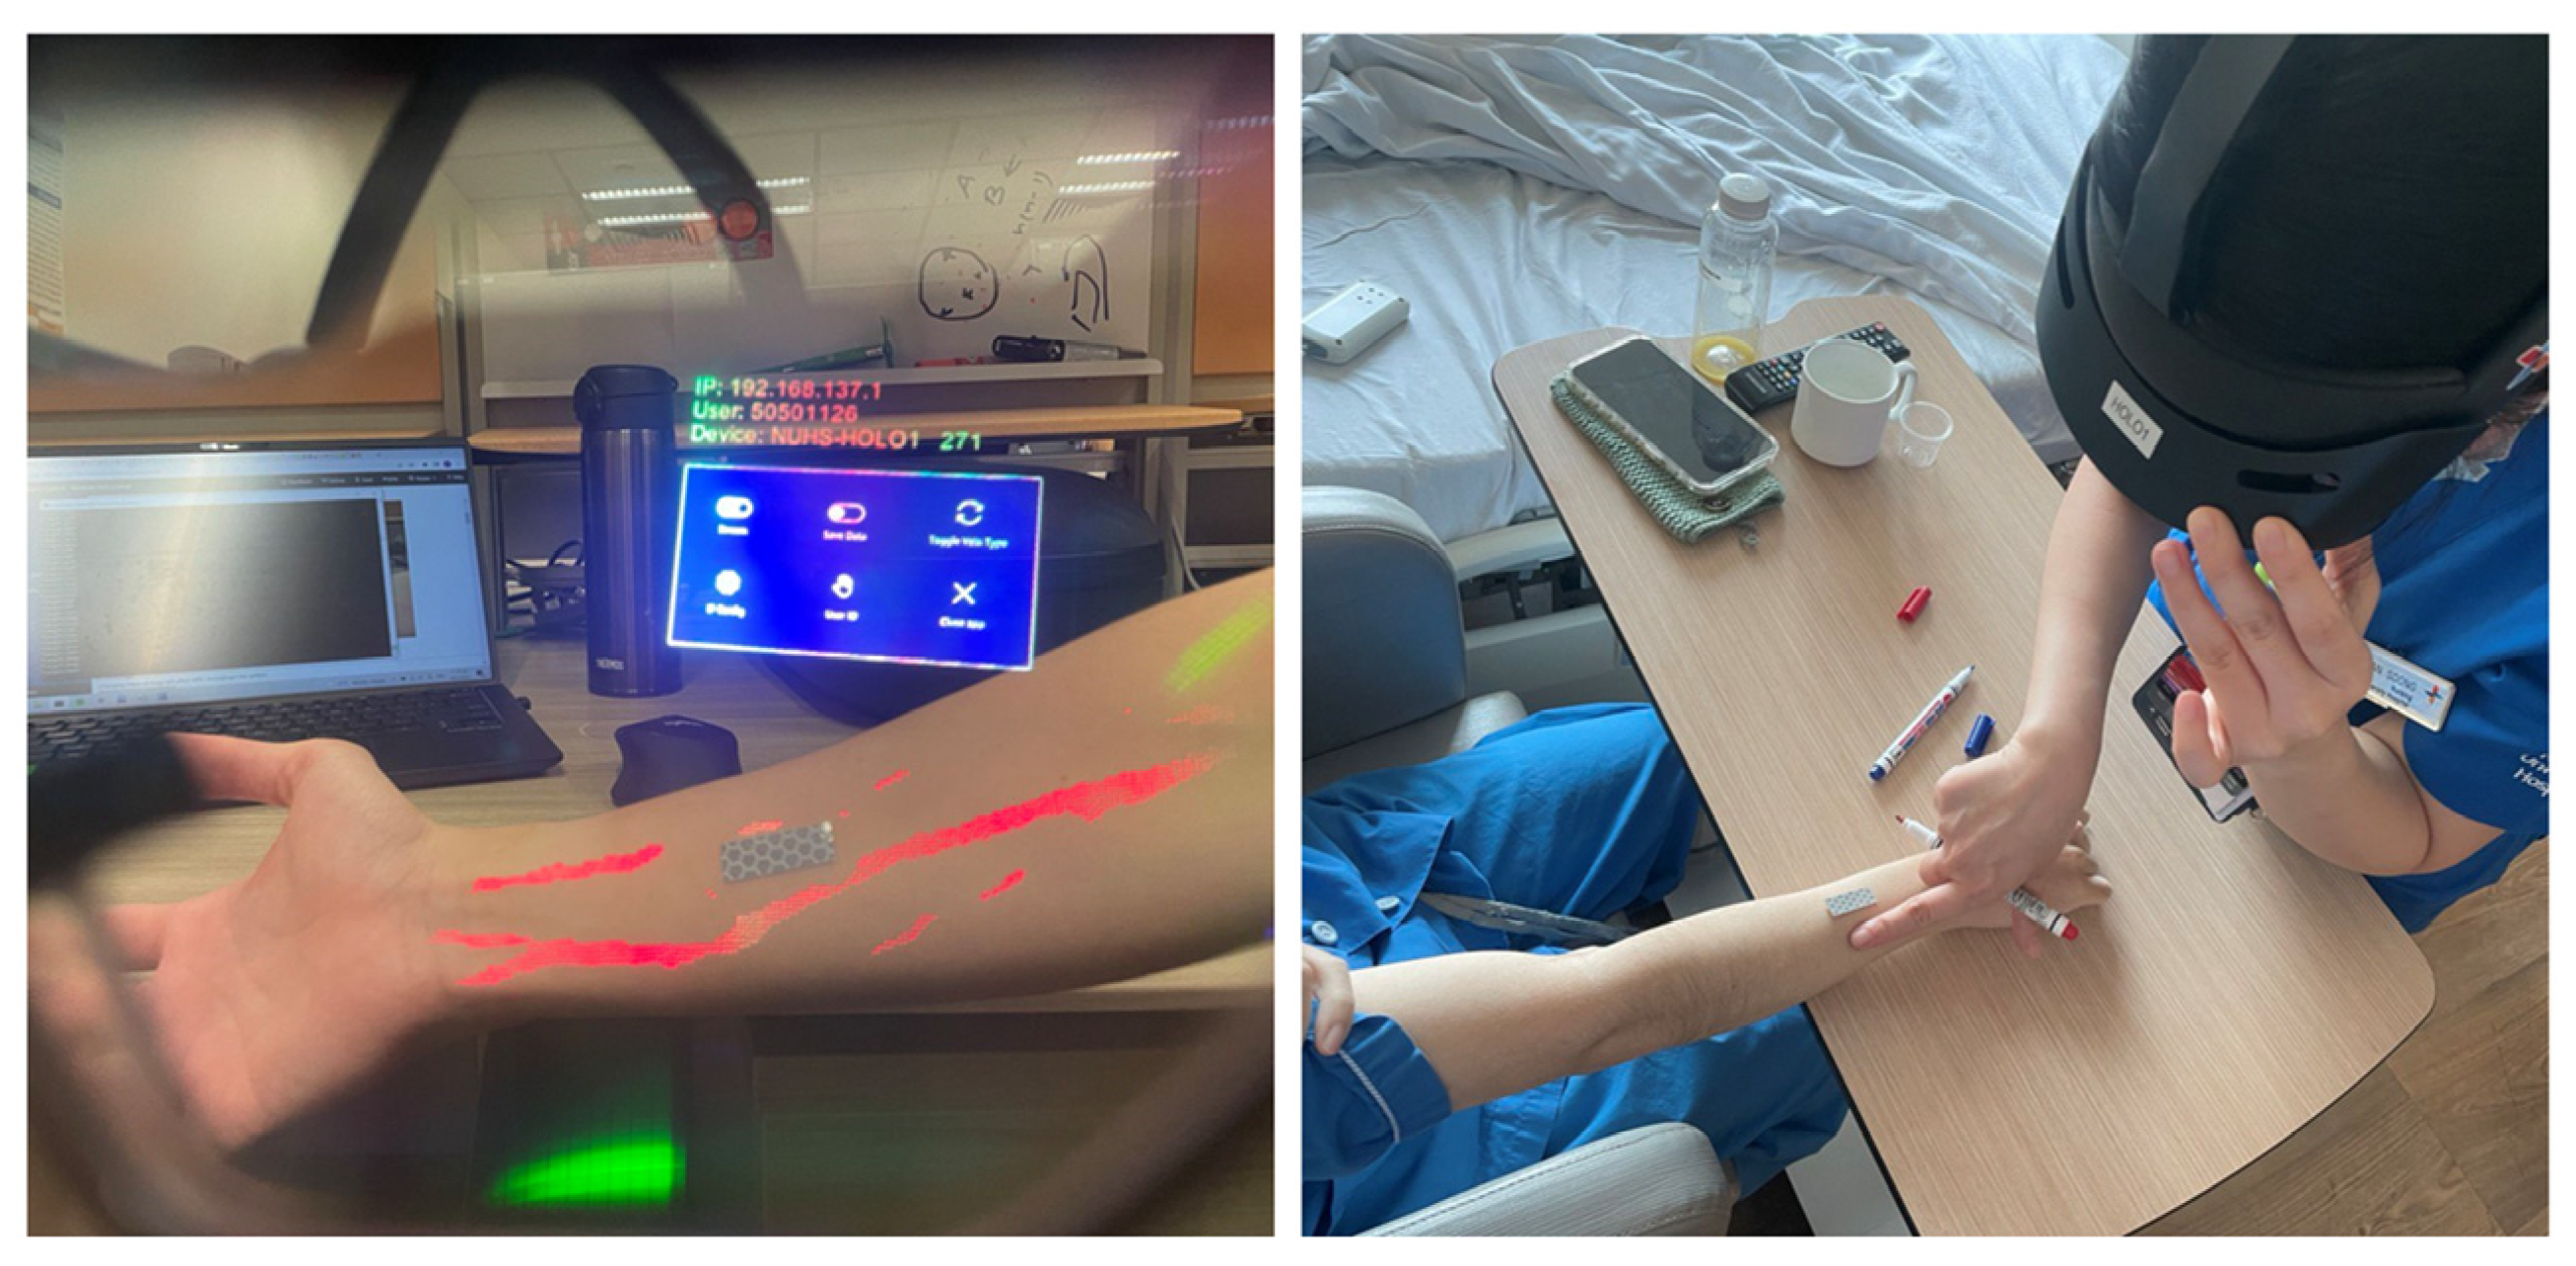
Our proposed solution exploits this physiological principle using a mixed-reality headset—HoloLens 2. HoloLens 2 uses a NIR time-of-flight depth sensor for hand tracking, which is repurposed in this paper for vein detection [
13]. The headset also allows for the vein overlay to be directly projected into the user’s vision, giving any potential assistant a clear, overlay-free view of the venipuncture site during the procedure (
Figure 1). By repurposing an integrated mixed-reality device for vein imaging, we circumvent calibration issues between the sensor and projectors, which was resolved via reinforcement learning by [
14].
Furthermore, this setup also allows for a wider field of view and hands-free usage at a typical arm’s-length distance. To provide users with more control over imaging the region of interest (ROI), we designed a low-cost, disposable marker that users can place within their ROI. This setup removes any risk of hospital-acquired infections (HAI) due to cross-patient equipment usage, in contrast to direct-contact vein finder devices [
15,
16].
Deep-learning-based solutions have been used widely and have demonstrated strong performance across multiple fields [
17,
18]. A deep-learning-based approach, via a Convolutional Neural Network (CNN), is used to identify veins within the ROI, which will subsequently be overlaid onto the user’s vision. Recent successes in deep learning models have leveraged on access to large datasets that are well annotated in order to learn robust data-label associations.
While NIR imaging helps to improve the contrast between veins and the surrounding tissue, gathering a large-enough high-quality dataset to train a robust and generalizable model is tedious and would require medical expertise and multi-annotator consensus to reduce inter-user subjectivity. Existing deep learning solutions for vein imaging and detection are fully reliant on traditional supervised learning techniques [
14], working with labeled datasets that are many orders of magnitude smaller compared to baseline datasets such as ImageNet [
19]. To this end, we initialize and train our base model using a small and partially annotated dataset. Utilizing the other sensors on-board the HoloLens 2 device, we designed a 2D–3D accumulation and re-projection pipeline to automatically annotate a larger unlabeled dataset that is then used to fine-tune the model.
This paper’s contributions include a system design for marker-assisted vein guidance in mixed reality. To the best of our knowledge, this is the first single-device, hands-free, mixed-reality vein imaging system and implementation. A two-stage detection algorithm, aimed to provide maximum user control, is also proposed. Finally, a 2D-to-3D semi-supervised framework (
Section 2.4) is also proposed and evaluated in terms of improvements in temporal stability as well as segmentation performance metrics.
Table 1 summarises the novelty of our HoloVein approach as compared to the state-of-the-art solutions. Our solution achieved higher precision/recall using semi-supervised deep learning, and it is portable and affords a larger field of view.
2. Materials and Methods
2.1. System Design
Vein finder devices largely rely on NIR-tissue interaction to operate, exploiting the fact that the higher concentration of deoxyhemoglobin in the veins leads to more NIR light absorption [
11,
12]. Within this group, solutions are further broken down into “reflected light” and “transillumination” types. In the former, NIR light is projected by a source, and the reflected light captured from a sensor, with both source and sensors placed in close proximity. On the other hand, “transillumination”-type devices have source and sensors placed on opposite ends of the tissue. In general, the “reflected light” method has gained popularity in usage due to the lower power requirements and compactness [
22]. Our solution hence follows the same operating principle but provides better flexibility and granularity of operation.
In the past, multiple fixed camera/projector solutions belonging to the “reflected light” classification have been proposed, which can be implemented as a wheeled venipuncture station in the ward [
20,
23]. These systems allow for a single-user operation, freeing up both hands for the procedure while keeping the overlay active. Due to the fixed operating distance, this class of devices is able to achieve accurate projections by leveraging on a fixed, pre-calibrated camera calibration and focus. However, these systems suffer from issues regarding ease of use and flexibility, owing to a larger and heavier footprint.
Another major class of “reflected light” operation solution revolves around a hand-held device being used to shine NIR, and detect and project visible light vein overlay onto the patient’s hand. One such solution is AccuVein’s AV500, which is the latest in a series of vein-finder solutions that has seen usage in clinical settings [
12]. The usage involves pointing a scanner-like device (275 g, 5 × 6 × 20 cm) close to the ROI, within a 15–25 cm operating range. Using an 830 nm sensor, veins are detected, and a green overlay will then be projected on the skin to demarcate venous regions. Depending on the distance away from the arm, the projection area and resolution could vary.
For a single user to operate the device and perform cannulation, switching from holding the device to a cannula would have to take place. Unless an optional hands-free accessory (e.g., wheeled or clamped arms) is used, image guidance would not be possible during the insertion itself for a single user.
To solve the aforementioned footprint and usage issues, we proposed a system that integrates all the required on-site hardware onto the 566 g HoloLens 2 device, with off-site processing done on a cloud computing platform. We also proposed the usage of inexpensive, disposable markers in the form of retroreflective infrared stickers for the purpose of ROI identification. As the ROI does not always coincide with the center of the user’s view, the marker-based solution is used to constrain detection and projection about a user-defined region. This provides flexibility for the user and removes the need for the user to look directly at the ROI for targeting. Due to the usage of the HoloLens 2’s hand-tracking NIR/Depth camera, the typical usage region (typical arm/hand positions) is well-covered.
The system architecture illustrated in
Figure 2 brings together two hardware stacks, with TCP communication protocol linking the two systems to run Arm Detection and Vein Segmentation on live camera data. We used the ResearchMode API to access data related to the HoloLens 2 infrared depth camera and used Unity/C++/C# together with the MRTK package for application development and rendering in mixed reality [
13].
In order to simulate on-demand cloud computing resources, we use a dedicated workstation to process the raw sensor data received from the HoloLens 2’s depth and infrared camera unit into a vein segmentation point cloud, which the headset uses for rendering onto the user’s vision. The full computational pipeline is implemented with the Python 3 wrapper for OpenCV and PyTorch, and optimized for deployment with TensorRT [
24,
25].
2.2. Arm Detection
As discussed above, arm detection is necessary for an all-in-one mixed-reality solution as the target arm region is not always in a fixed position relative to the camera, unlike hand-held solutions that can be directly pointed. Therefore, before the vein segmentation process can take place, a ROI on the arm should first be defined. The proposed implementation requires the user to place a sticker along the ROI. While existing deep-learning-based arm detection models exist, a marker-based approach was chosen over having an automatic arm detection model as this would give the user more granular control of what the ROI is, ensuring that there is no ambiguity even if the practitioner hand is in view [
26].
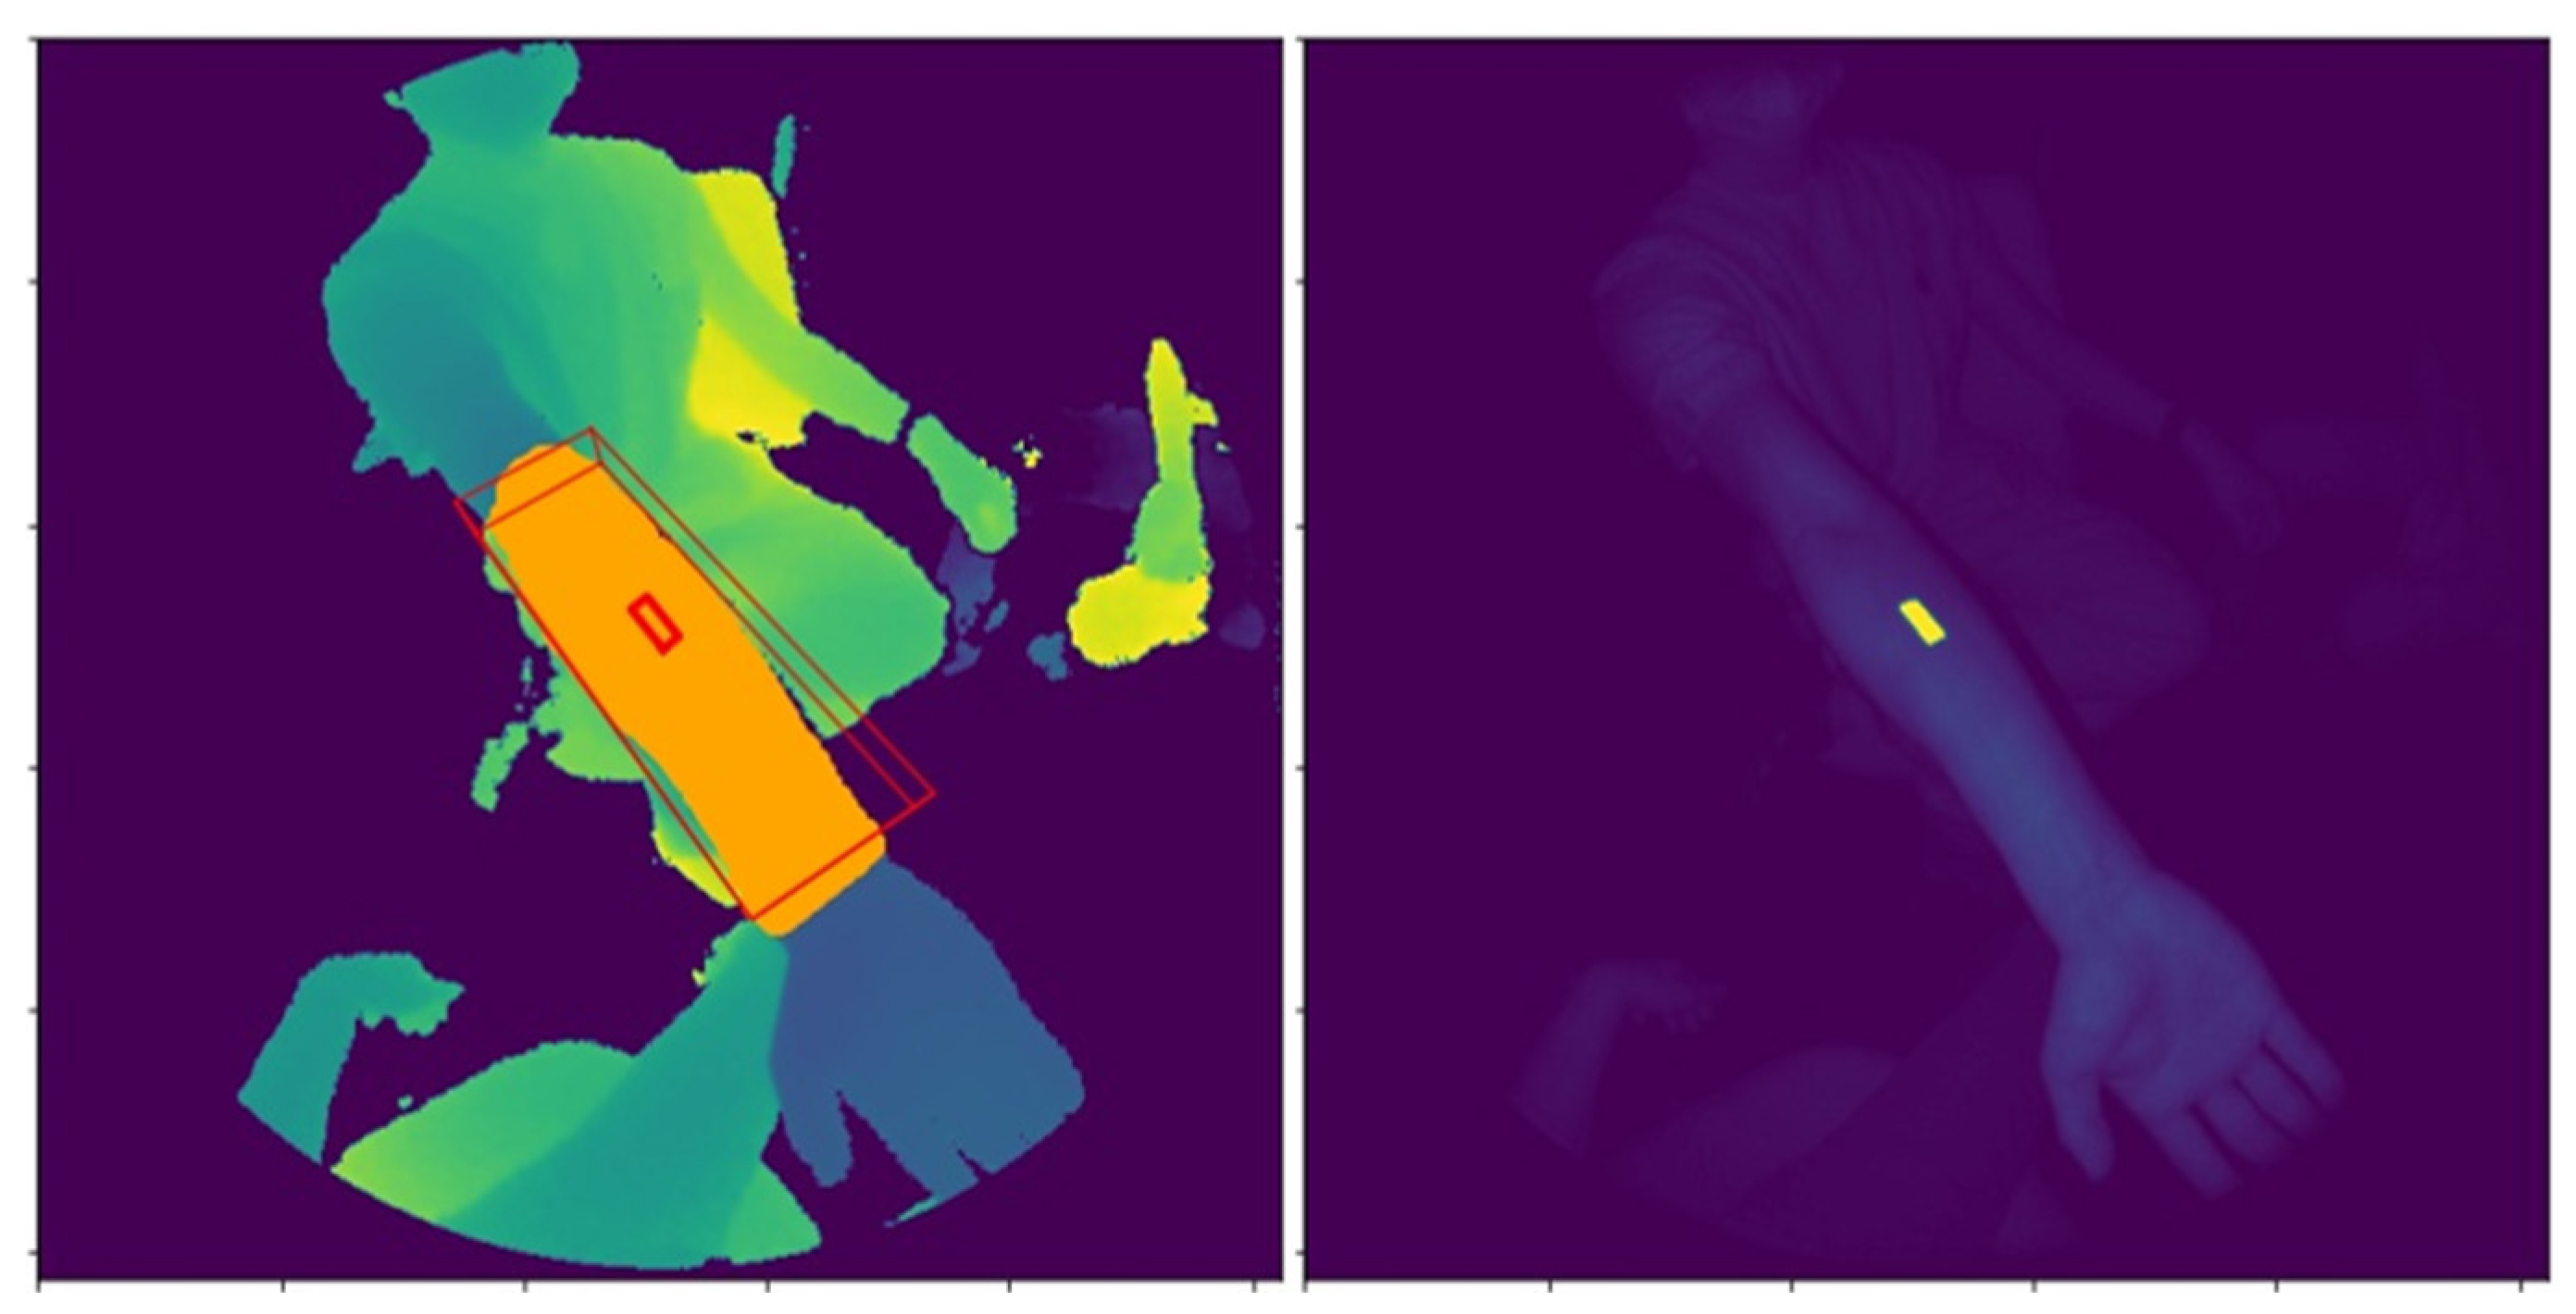
The image processing algorithm utilizes the 512 × 512 resolution NIR and Depth images (shown in
Figure 3), together with the camera calibration data to detect a retroreflective infrared sticker measuring 1 × 3 cm and define a ROI around it. The 1 × 3 cm marker was cut from a roll of reflective tape (TS-02/1M, ifm Electronics Accessories, Malvern, Pennsylvania).
First, a map for possible marker pixels is generated by using a combination of thresholds and edge filters. We exploit the property that retroreflective markers will reflect light back in the direction of the source. Because the HoloLens 2’s IR emitter and camera are placed adjacent to each other, the pixels corresponding to the retroreflective markers will show up as bright spots, visible in
Figure 3 (right), at distances well within a typical adult arm span. Hence, by referencing the Depth image, pixels that are further than a distance threshold
Td (empirically set at 0.20 m) is considered as a potential marker pixel (
PMP) if the brightness value exceeds a fixed threshold
Tb (empirically set at 1000 units).
Below the threshold Td, it becomes difficult to find a fixed threshold that clearly delineates marker from non-marker pixels. This is because the IR floodlight would be too close and would saturate any surface. As such, pixels that have a distance value within Td will be considered as a potential marker pixel if the corresponding gradient map’s pixel, generated from a Sobel-Dilate operation, is high enough, above a fixed threshold Tsd. This step is designed to detect the sharp drop in intensity from the marker to the skin.
Given the candidate marker pixel map from the preceding step, contour outlines are detected for each candidate patch, and small contours are discarded as noise. For each of the contours, a convex hull operation is applied, and a rectangle fit to the result. Rectangles that do not have a side ratio close to 3 is discarded to enforce geometric constraints. Lastly, each remaining contour is assessed in 3D for its exact dimensions, using the Depth image and camera intrinsic. Contours that are within tolerable margins of the 1 × 3 cm specification are considered as valid markers. As the use case focuses on one hand at a time, the assumption is that a maximum of one marker should be in view in any frame. This is enforced by taking the nearest marker candidate, if more than one marker is detected.
In order to extract an arm segmentation mask for downstream vein detection, given the 3D coordinates of the marker’s edges, a cuboid is defined around the marker, shown in red in
Figure 3 (left). This allows us to define the length, width, and depth for the region to be segmented. 3D points are computed for all pixels in the Depth image and all points that fall within the cuboid are returned as the arm segmentation mask M
i, denoted as the orange pixels in
Figure 3 (left).
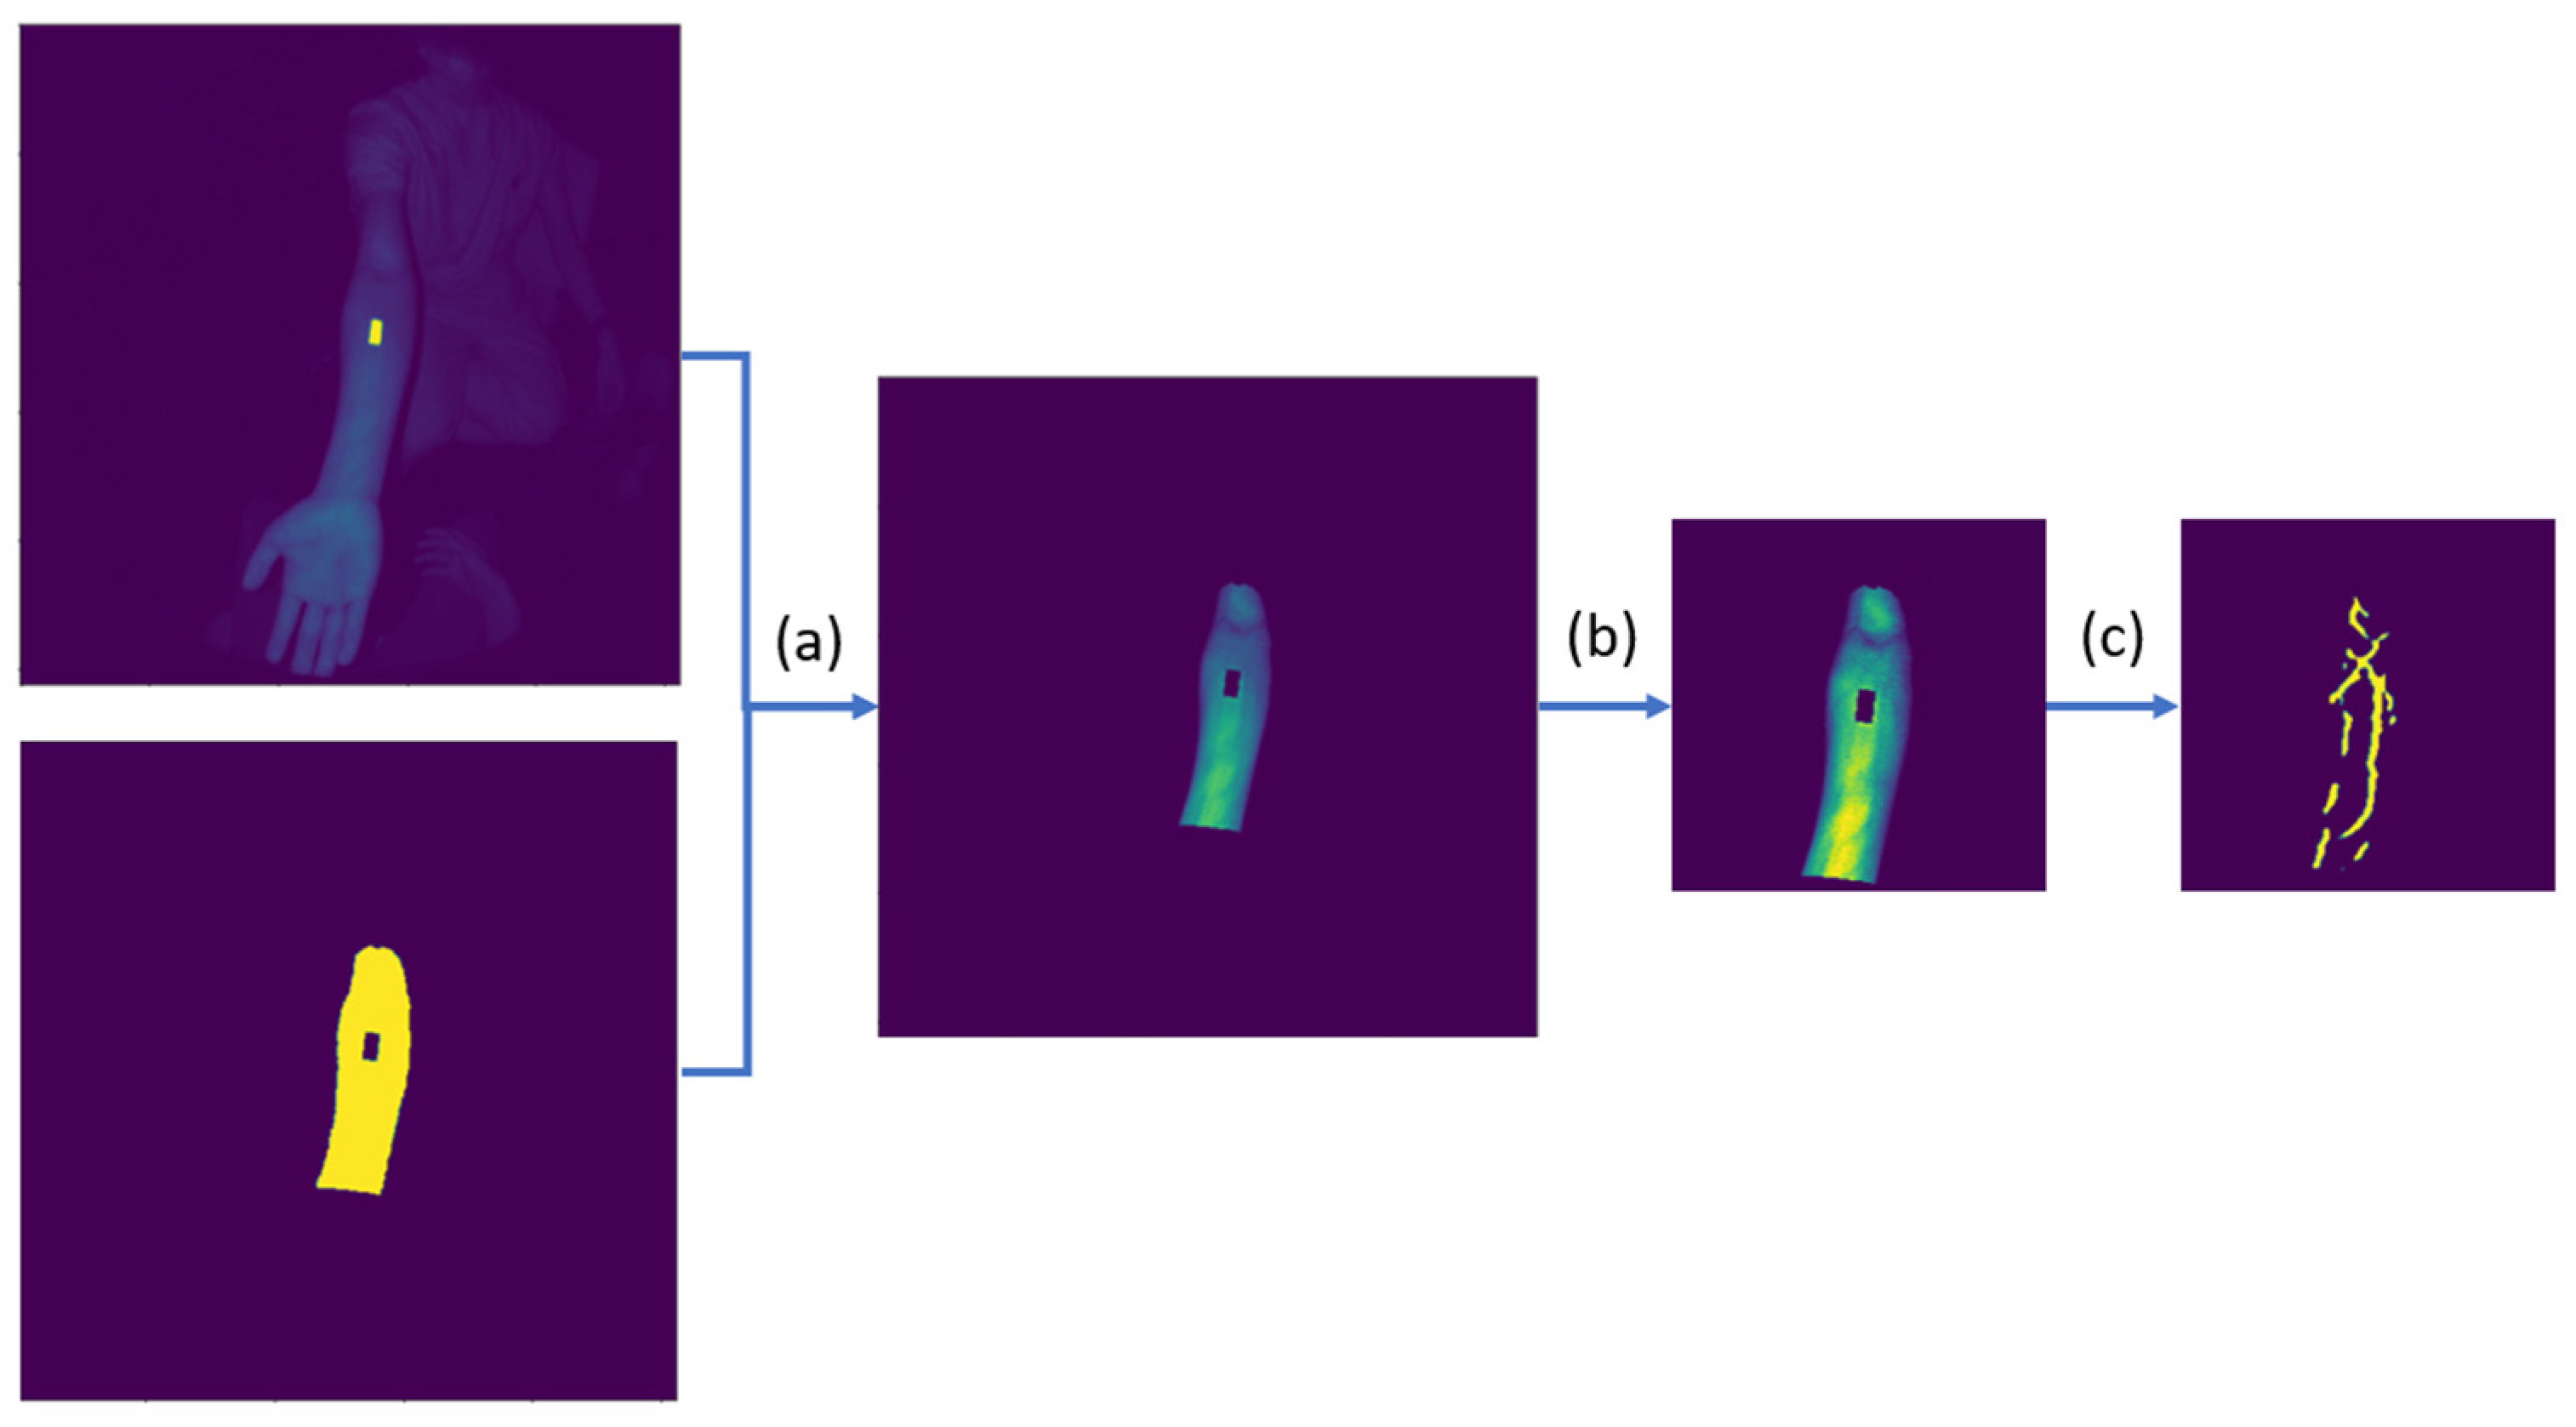
2.3. Vein Segmentation Pipeline
After arm segmentation/detection, the NIR image is processed together with the arm segmentation mask to produce a vein segmentation map, following the pipeline in
Figure 4.
Once we segment the arm as shown in
Figure 4a, the non-arm regions of the NIR image are set to zero. Additional preprocessing steps, shown as
Figure 4b, are done before the final vein segmentation. In [
27], a learned spectral decomposition filter was applied to preprocess the NIR image. However, by leveraging on the paired depth-infrared sensors, we can precisely segment out the arm’s ROI in 3D as described in
Section 2.2, making a simple contrast enhancer (e.g., normalization/CLAHE) effective when applied to the filtered pixel intensities. The full preprocessing steps involve the following:
To identify the venous regions, a convolutional neural network takes in the preprocessed image as shown in
Figure 4c to produce a prediction segmentation mask with pixel values ranging from 0 to 1. A U-Net CNN architecture with RegNet encoder, pretrained on ImageNet, was trained on a vein segmentation dataset [
29]. U-Net is a popular model architecture often used for medical image segmentation [
30]. By implementing skip connections between the encoder and decoder layers, the architecture allows for the direct usage of both high and low frequency spatial information in generating a segmentation mask. Running on an Intel Core i7-10510U CPU (1.8 GHz) with an NVIDIA GeForce MX250 GPU to simulate performance on a low–medium-end edge device, the implementation took an average of 25.5 and 32.9 ms for the arm and vein segmentation portions, respectively. This gave an effective processing rate of 17 Hz without multi-threading, which the ResearchMode API, accessed through Unity, could deliver consistently. Model hyperparameters, dataset, and training scheme will be discussed in the next subsection.
The CNN model returns a 256 × 256 map, which we insert back to the original 512 × 512 shape to match with the camera intrinsic look-up table, of values (
Vi) ranging from 0 to 1. This gives an assessment by the model of how likely the pixel is to be classified as a vein. To filter for pixels to render, a cut-off value is specified. A few threshold options are available for the user to choose from, with the default value
To being 0.5. The other thresholds are computed as follows:
This provides the user with the option to view less “certain” veins (), or to only show the most “certain” veins (). The five values, as well as the preferred default value, were determined after consulting with the end-user clinicians.
As the last post-processing step before rendering on the HoloLens 2 device, pixels that have crossed the specified threshold will be converted from pixel coordinates (u,v) to 3D coordinates relative to the camera (X
c, Y
c, Z
c) via the camera intrinsic look-up table provided by the ResearchMode API [
13]. For a more stable projection, the frame’s camera pose (4 × 4 transformation matrix) is used to convert the 3D points into a world coordinate system (X
w, Y
w, Z
w), specified by the application.
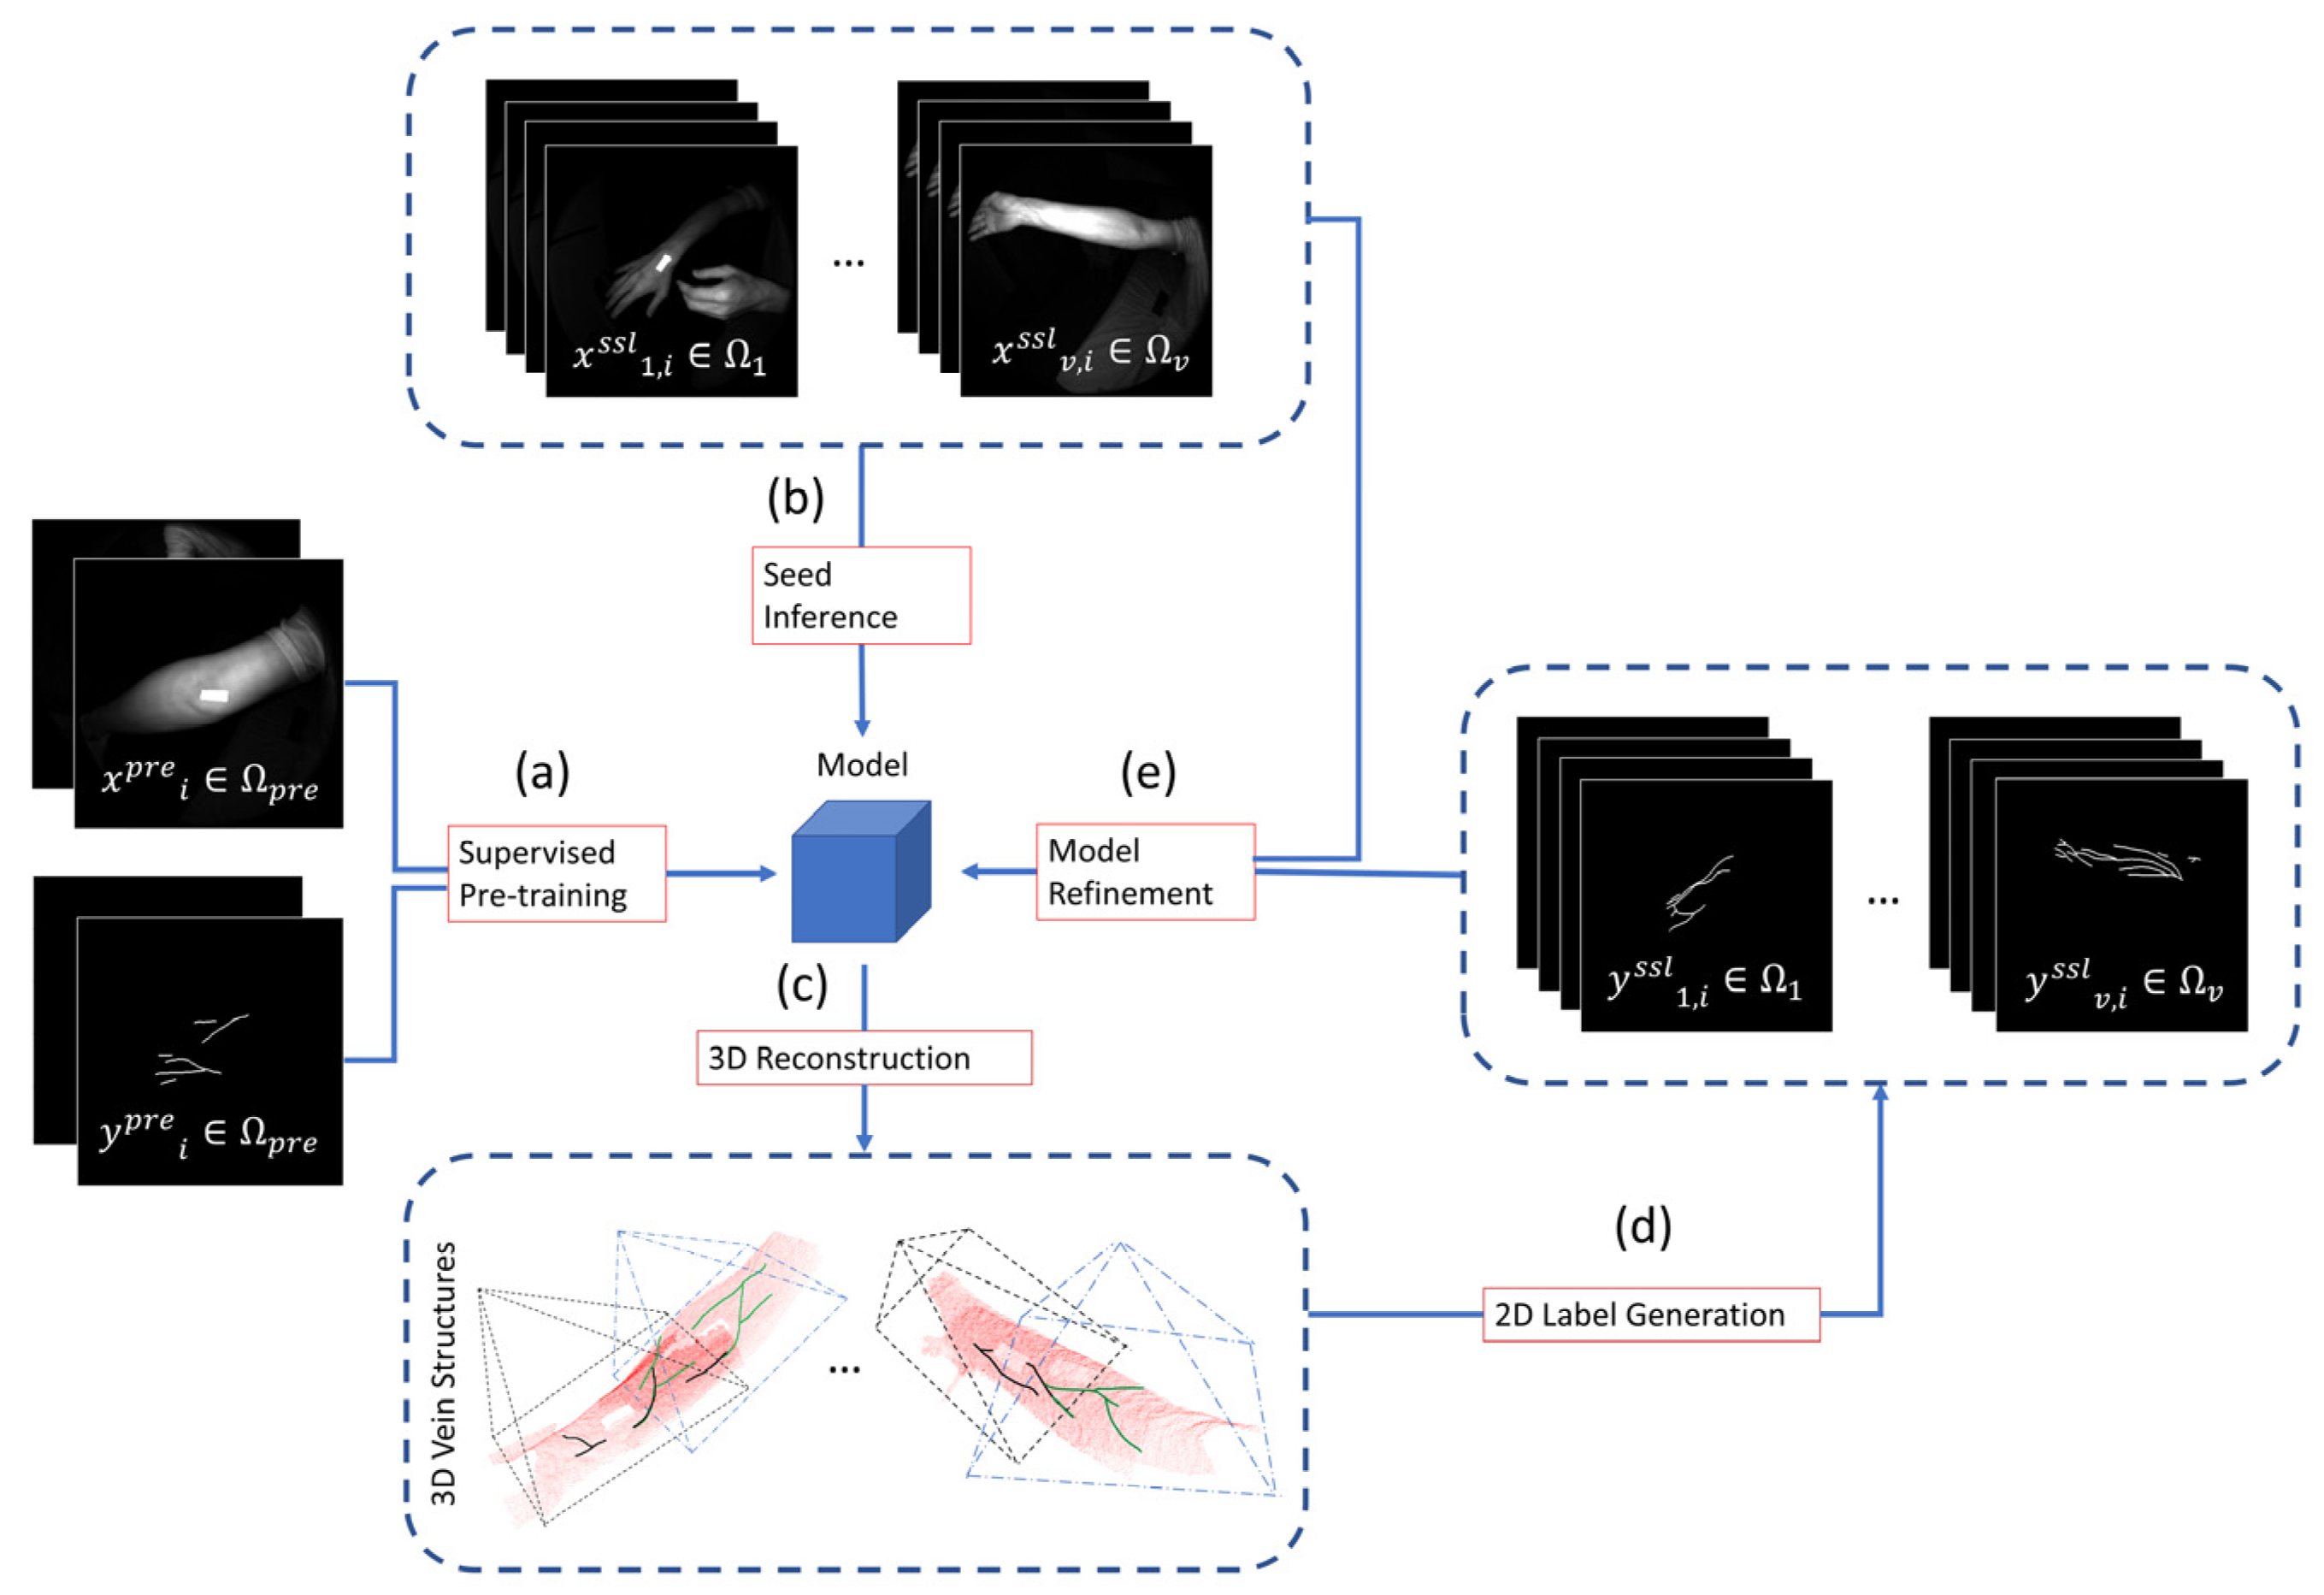
2.4. Semi-Supervised Learning via 3D Regularization
Image segmentation labeling, especially those from the medical domain which requires expert knowledge, is a resource-intensive step in supervised learning tasks. However, large datasets are generally required to train a robust and generalizable model [
31]. In this section, we describe a training pipeline that aims to reduce labeling costs while improving model results.
2.4.1. Supervised Pre-Training
13 unique arms from healthy volunteers were used to acquire 361 images in total with varying distances and angles. The volunteers had an equal gender mix, with an age range of 23–57 (mean: 34.9 years). Obvious vein segments were identified in the annotation process. This initial dataset
was used to train a base model (defined in
Section 2.3) as shown in
Figure 5a.
For data augmentation, we varied the scaling step (Equation (3)), using either (0.1, 99) or (0, 100) as a form of contrast variation. Standard vertical and horizontal flips were also applied, alongside gaussian noise with standard deviation within the range (3, 12). Lastly, the length of the cuboid segmentation zone was also varied randomly between 10, 15, and 20 cm, with the hypothesis that smaller-length segments, when chosen by users, would be harder for the vein segmentation model due to a smaller context region.
During model training, one validation and one test arm was chosen on the basis that the train, validation, and test datasets all have similar arm distance and angle distributions. The model was trained with Focal Tversky Loss (alpha = 0.3, beta = 0.7, gamma = 2) to account for the major class imbalance where only a small proportion of pixels belong to the positive vein class [
32]. The model parameters were iteratively optimized using the Adam optimizer (learning rate = 0.0004) with early stopping [
33].
2.4.2. Seed Inference on Unlabeled Videos
To increase model generalizability, an additional unlabeled video dataset was collected. 16 videos were collected from healthy volunteers, with lengths ranging from 542 to 1037 frames (mean: 717.13) for a total of 11,474 frames. Following the initial labeled dataset, each video contained images captured from different distances and angles, with additional variance in terms of marker placement. These videos are then passed through the initialized model to get a seed inference, shown in
Figure 5b.
As the downstream pipeline involves generating new labels from accumulating information across the entire video, label generation quality and consequentially pipeline stability would depend on a good initial inference. To do this, we adopted a static curriculum method, where videos are sorted by difficulty, with each subsequent semi-supervised loop iteration including more videos of increasing difficulty into both the training and validation datasets [
34]. To grade the video difficulty, we passed each video through the initial model, obtaining
. The confidence of prediction is used as a proxy for video difficulty and is computed as
. When using this curriculum method, we used an initial size and a per-iteration increment (starting with/adding
n videos each to training and validation set each iteration) of
n = 2.
2.4.3. 3D Reconstruction and Projection to 2D Labels
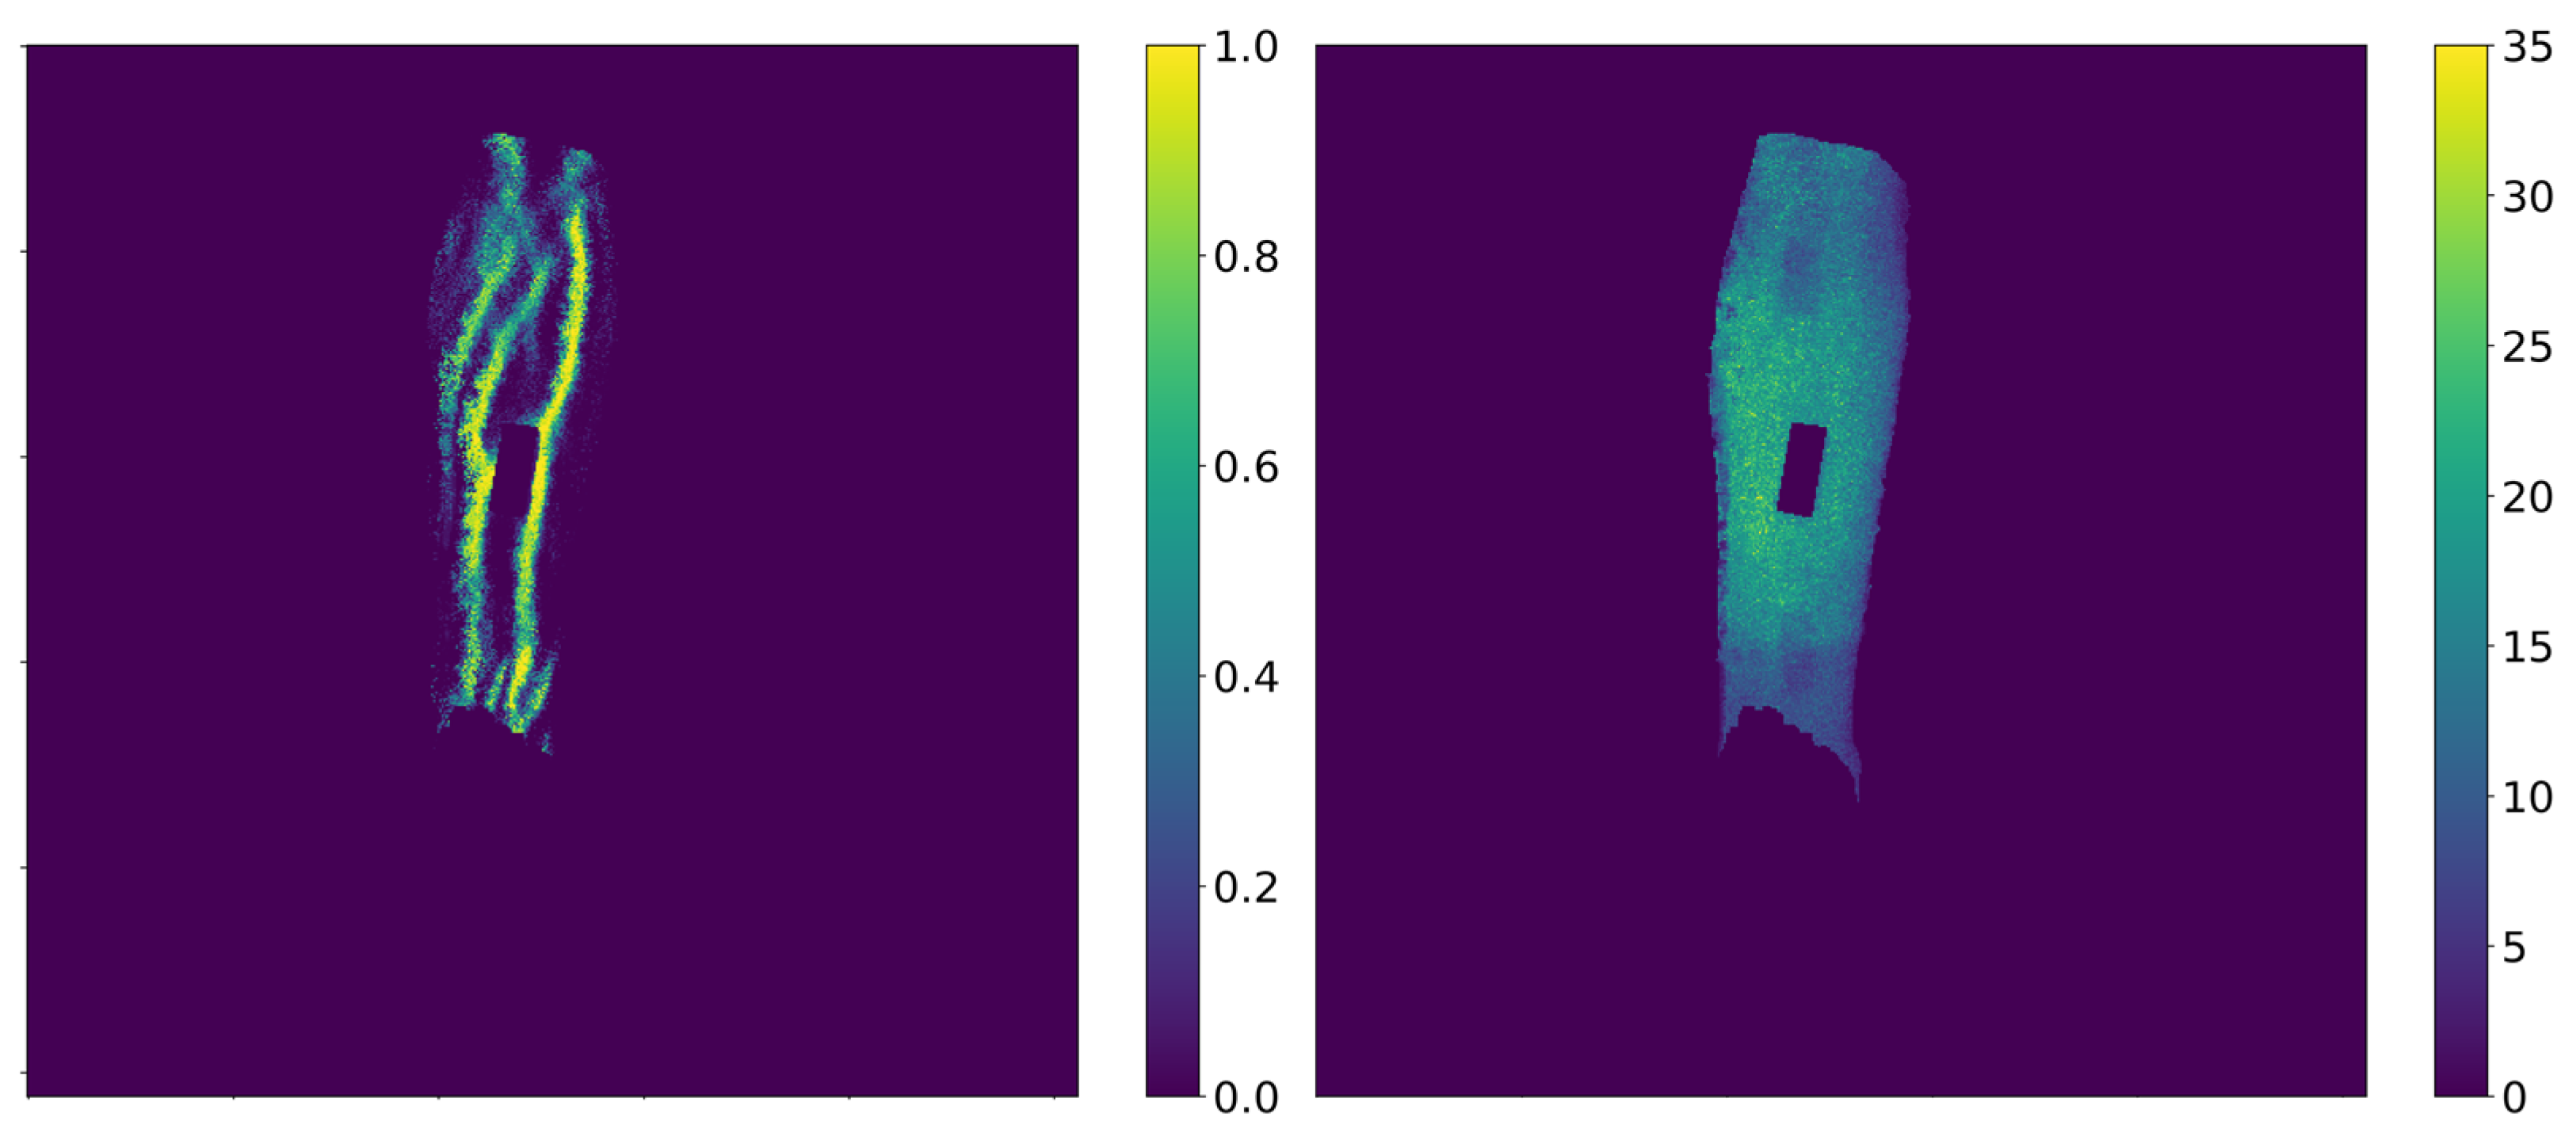
Since each video captures multiple views of a single arm region, we accumulated the predictions for each pixel across all frames. To do so, we used the camera intrinsic provided by the ResearchMode API to get one point cloud per frame. The camera pose for each frame, supplied by HoloLens’ internal Simultaneous Localization and Mapping (SLAM) algorithm, is then used to initialize and perform Iterative Closest Point (ICP) registration refinement across all frames.
This accumulated point cloud, which accumulates information about the model’s prediction across all frames, is re-projected into the individual images/frames, yielding a prediction density
and sample count
map for each frame as seen in
Figure 6. Subsequent operations will operate directly on these maps/images.
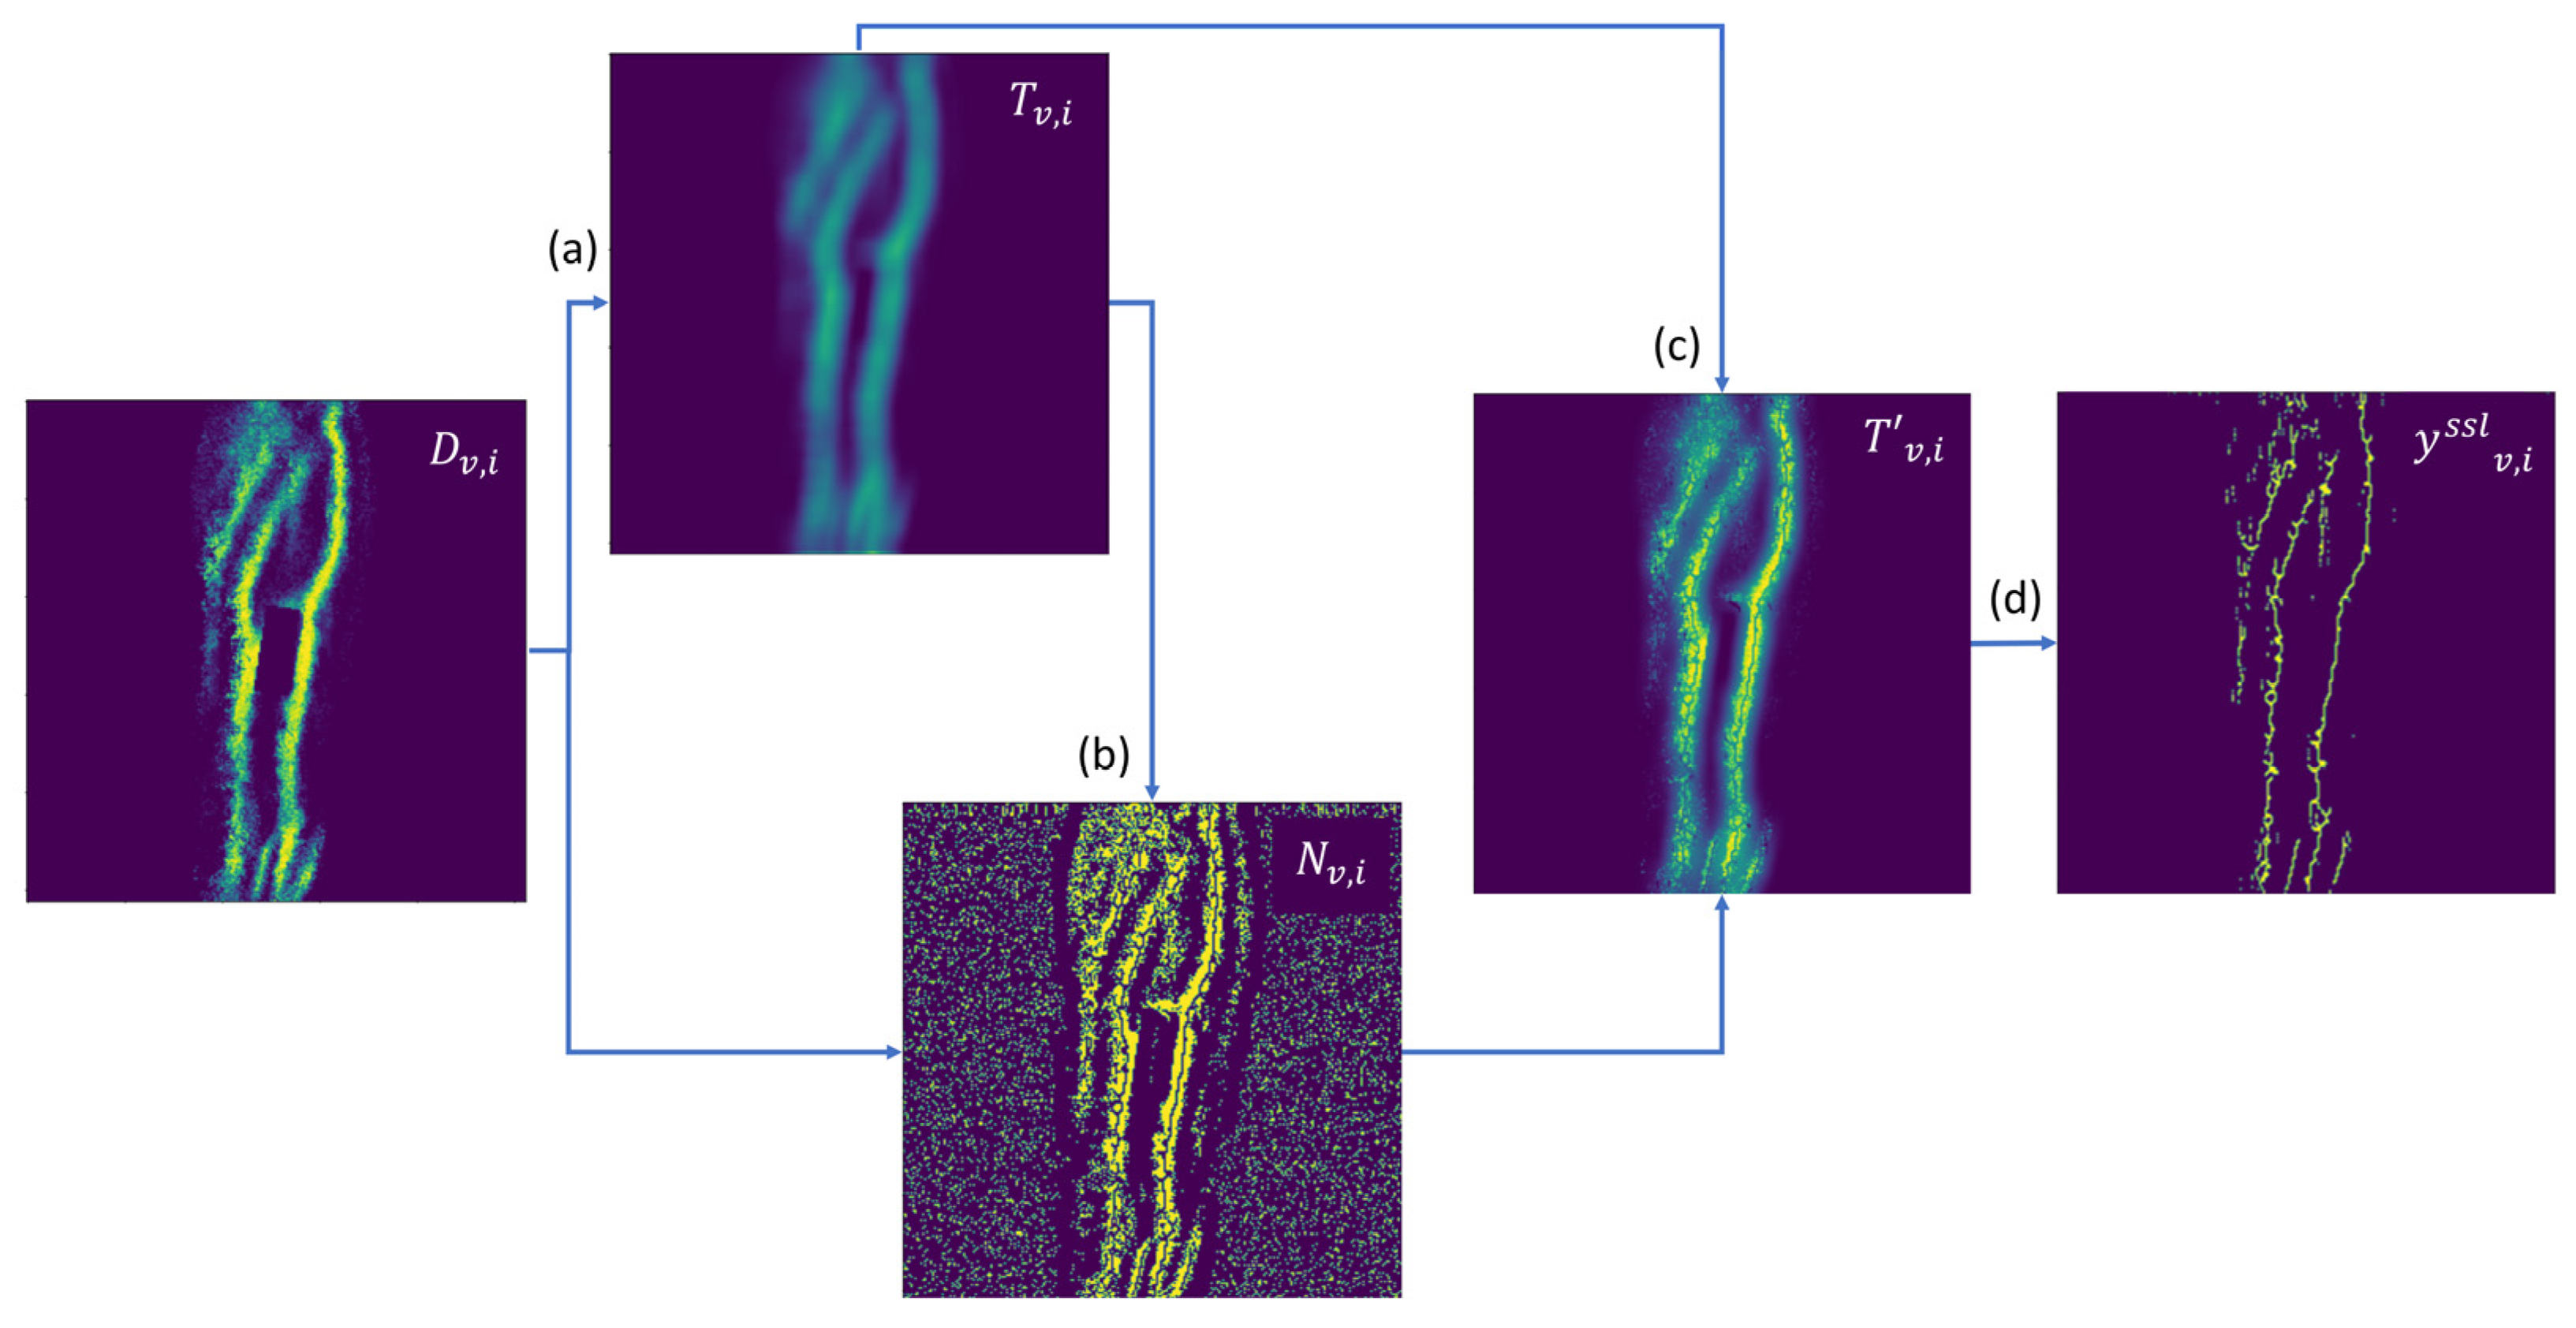
In order to generate a segmentation label for the model to be fine-tuned on, we proposed a series of noise rejection and simulated annealing steps. These steps are crucial in order to introduce variability into the otherwise closed-loop self-supervision. A naïve alternative where
D is directly used to produce a loss signal for model optimization would collapse the process into one where the model would learn to classify veins that have initial detection rates above 0.5 across the video as a vein, and conversely for veins with initial detection rates below 0.5. This majority voting system would enforce spatio-temporal consistency across the video but would be unable to consider and learn from uncertain regions.
In the first step of our proposed algorithm, per-pixel local threshold values are computed by applying the Niblack thresholding algorithm with a window of 15 × 15 and local standard deviation multiplier of
k = 0.04, giving a value equal to the local patch mean subtracted by
k-scaled local patch standard deviation [
35]. Simulated annealing was then applied to the local threshold values to attain
T, shown in
Figure 7a. Simulated annealing is often applied to escape local minima in iterative optimization processes, and is applied here to allow the rejection of erroneously detected as well as missed veins [
36]. In this case, the values are randomly shifted by a skewed-normal distribution, with the spread of the distribution (analogous to the temperature term in simulated annealing literature) decreasing over subsequent semi-supervised loop iterations (super-epochs). The sampled distribution has a positive skew for Niblack threshold values above 0.5, and a negative skew for threshold values below 0.5. This process biases the adjustment towards the midpoint 0.5, increasing the entropy in label generation. The bias decreases over super-epochs, together with the beforementioned reduction in the spread of the sampled distribution via the Superepoch Index (SI) term in Equation (4)’s denominator.
As illustrated in
Figure 8, the threshold map
T is then applied to the prediction density map
D to produce a binary image
M0. A morphological opening step is applied (erode–dilate cycle with 3 × 3 window for 2 iterations) to
M0 for noise removal, followed by a morphological thinning operation for width standardization [
37,
38], yielding
M1. The difference between
M1 and
M0 gives
N (
Figure 7b), which denotes uncertain regions (e.g., small segments removed by the erode–dilate cycle, or border pixels in thick line segments). To reflect this uncertainty, for every noise pixel found in N, the corresponding value in
T is set to
D, with results stored in
T′ (
Figure 7c), to be used to compute a loss-weighing factor
in the next section. As a final step before model training, a binary vein segmentation mask
is computed as
D >
T′ (
Figure 7d).
2.4.4. Model Refinement
The model is trained with the same scheme as the initial training phase, using
as the label instead of human annotations. While still using the Focal Tversky Loss, the per-pixel loss is scaled by two additional per-pixel penalty factors.
where
sgn(
) returns 0 for values below 0, and 1 otherwise.
The first per-pixel penalty (Equation (5)) is used to suppress the losses for pixels which had sampling uncertainties due to low neighbor counts in the point cloud. It is a simple linear function, clamped between and 1. is initialized as 0.1, and increases by 0.15 with each super-epoch, which causes a relaxation of this sampling penalty as training progresses.
While the 2D label generation algorithm includes noise suppression steps in the generation of the binary segmentation mask
, we further extract non-binary information from the intermediate values in order to augment and stabilize the refinement process across super-epochs. Comparing between the 3D-to-2D prediction density
D and the adjusted local thresholds
T′, we can compute per-pixel
(Equation (6)), which is another penalty factor that is clamped to between
and 1.
values peaks when
D approaches 0 or 1, while decreasing linearly towards the local thresholds
T′. This measures the degree of confidence in the extraction of the segmentation mask from the continuous prediction density map
D.
These penalty terms are jointly utilized in the computation of the final weighted loss , by applying them pixel-wise on the Focal Tversky Loss outputs before the mean aggregation across pixels. As the number of super-epochs increase, tends towards an unweighted average loss across all pixels, regardless of local threshold values or sampling counts.
3. Results
3.1. Arm Detection Rates
The arm segmentation module is evaluated primarily on the detection rates within the designed operating distances (20 to 55 cm), based off a typical user’s arm span and clinical usage requirements (
Figure 9). We do not evaluate the arm segmentation based on the accuracy of marker localization as the potential order of inaccuracy (1–2 cm) is insignificant compared to the arm segmentation region (10–20 cm). Furthermore, slight arm segmentation errors will not accumulate into vein segmentation errors.
From 5 sample recordings totaling 25 min, 6501 frames where the marker was physically visible were analyzed (
Table 2). These recordings were done with an experienced nurse, at various patient arm positions (e.g., on bed, pillow, table), covering most clinical usage environments to assess real-world detection rates. Markers were detected correctly at rates consistently at or above 98%. Baseline false detection averaged 0.3%. In recordings 3 and 5, most false detection cases were of the user’s metallic name tag and staff pass. These results were deemed to be sufficient, with a rolling window filter being one of several options to smooth detection results and enforce consistency if necessary.
3.2. Segmentation Consistency
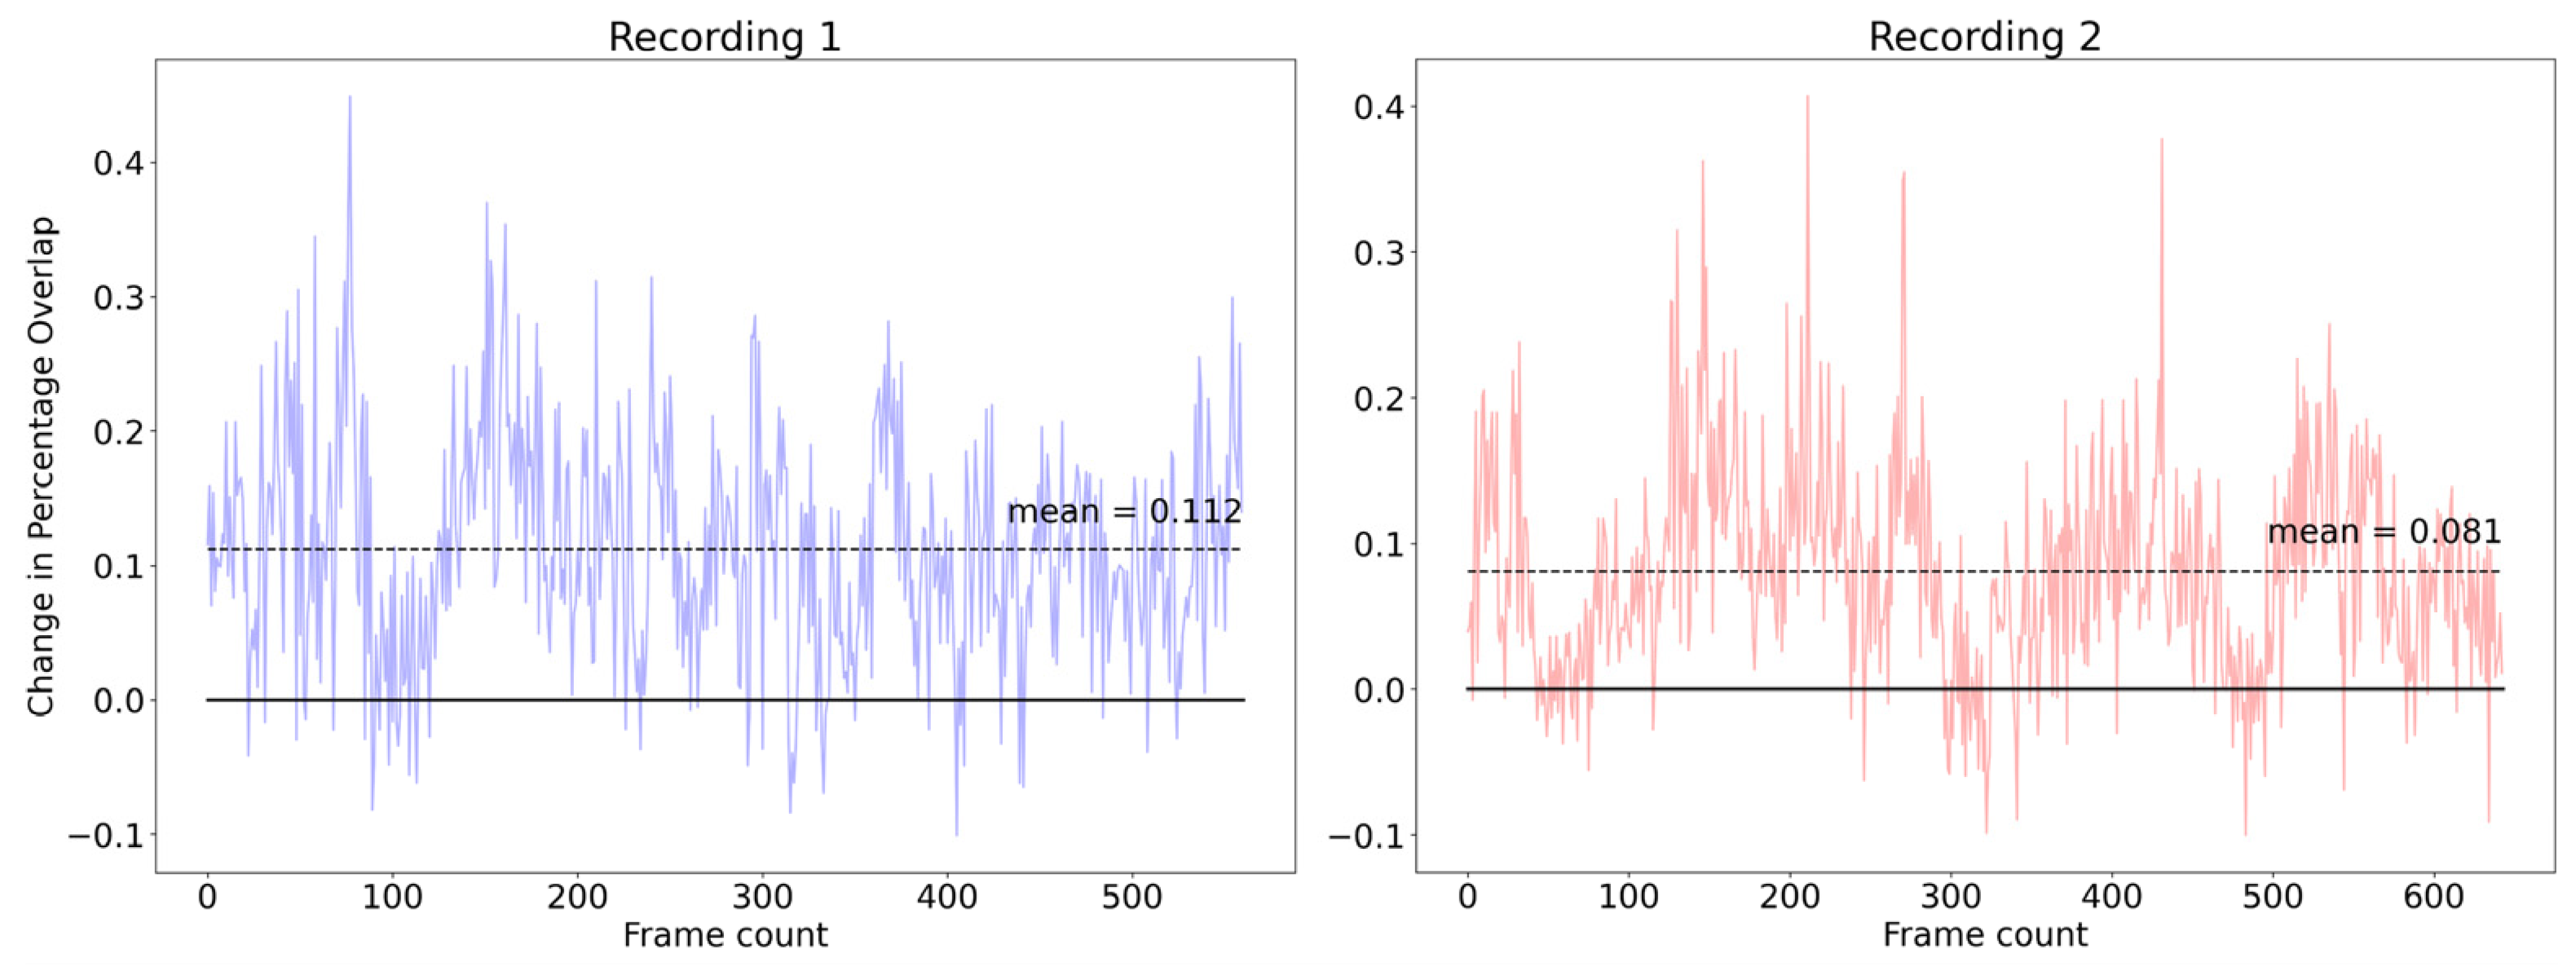
Vein detection stability not only affects the end user’s experience, but also reflects a model’s stability to small perturbations. As our auto-annotation and refinement pipeline computes 2D projected masks from a consistent 3D point cloud every super-epoch, we expect the resultant model to perform better in terms of spatial-temporal consistency. Furthermore, the lack of annotation effort allowed us to fine-tune the model on a much larger dataset (31.7×) compared to the initial fully supervised process. We evaluate segmentation consistency using two measures, on a separate video dataset (two videos, 1203 frames total).
For each of the two models (baseline and final model fine-tuned over five super-epochs), we performed inference and compared the segmentation results across temporally adjacent frames. For a given frame n, a point cloud is generated and compared with the point cloud from the previous frame
n − 1. Percentage overlap is computed as the number of points in frame
n that are within 2.5 mm of any points in the previous frame, divided by the total number of points in frame n.
Figure 10 shows a consistent improvement in segmentation temporal stability after the semi-supervision process, with an average improvement of 0.0965 in frame-to-frame overlap.
3.3. Quantitative Evaluation
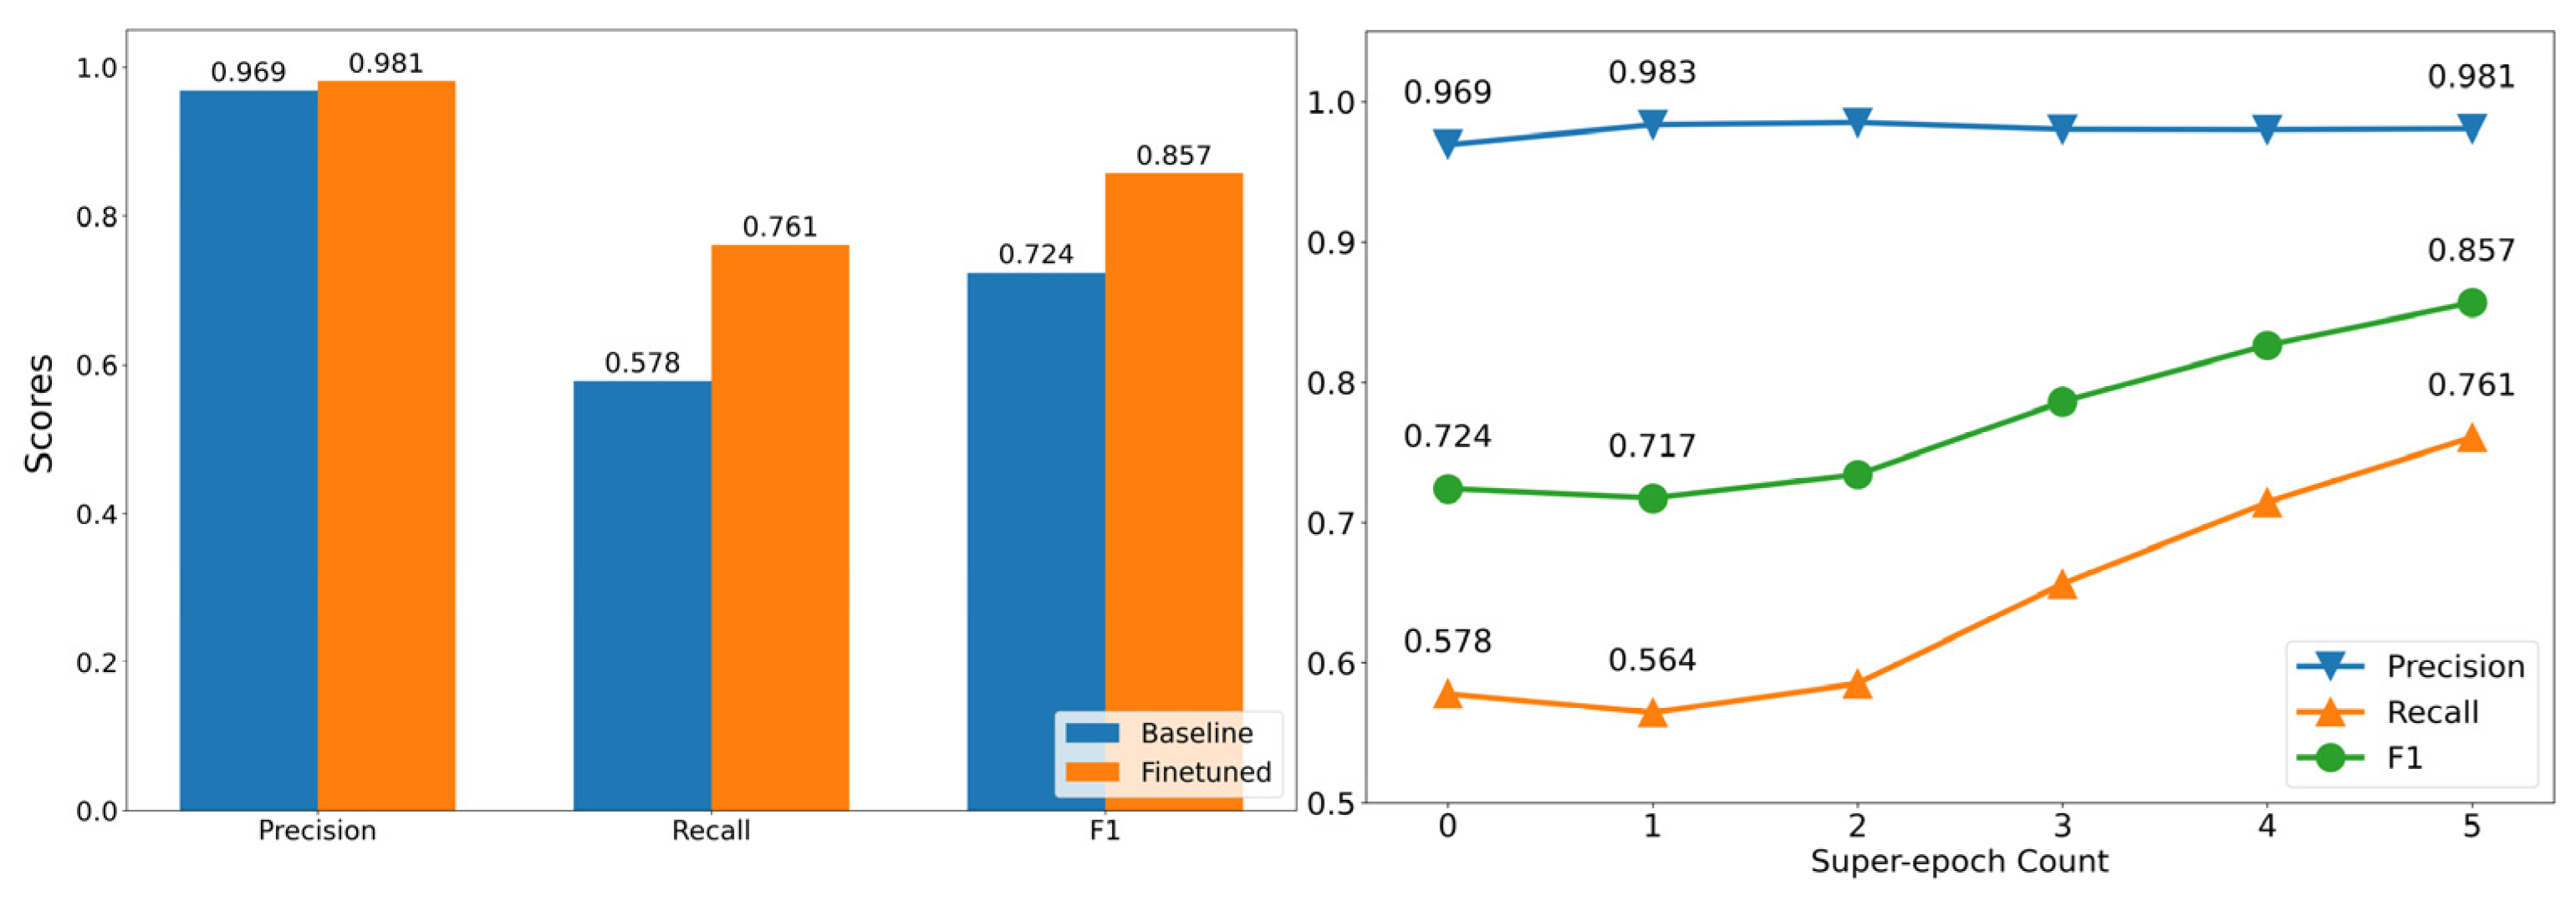
Model performance was assessed using a test dataset (n = 111), which was annotated with the aid of a hand-held ultrasound and a commercial vein-finder device as verification [
39]. Precision and recall values were selected to evaluate model performance, as much of the image consists of non-arm and non-vein regions, leading to a large class imbalance and oversized true negative classification.
For both the baseline and fine-tuned models, precision remained high at above 0.96, with a slight improvement (0.012) after finetuning. Recall for the baseline model was low at 0.578 and increased significantly to 0.761 after finetuning. The low initial recall can be attributed to the fact that the initial “noisy” dataset contained only annotations for prominent veins that could be easily identified, leading to the model converging towards a more conservative vein discrimination process that results in higher false negative counts.
We further investigated the model’s performance on the test set across super-epochs. From
Figure 11 (right), we can see that the curriculum-based refinement process results in stable and consistent improvements in precision and recall, respectively. This shows that the process gradually increases the confidence and predicted veins are largely correctly attributed, and hence does not adversely affect precision even while drastically improving recall. In the medical context, a high precision is of the highest importance, due to the implications of false positives in terms of patient safety.
Compared to [
14], the semi-supervised HoloVein model outperforms in both precision and recall by a significant margin (
Table 3). Precision for HoloVein was competitive with [
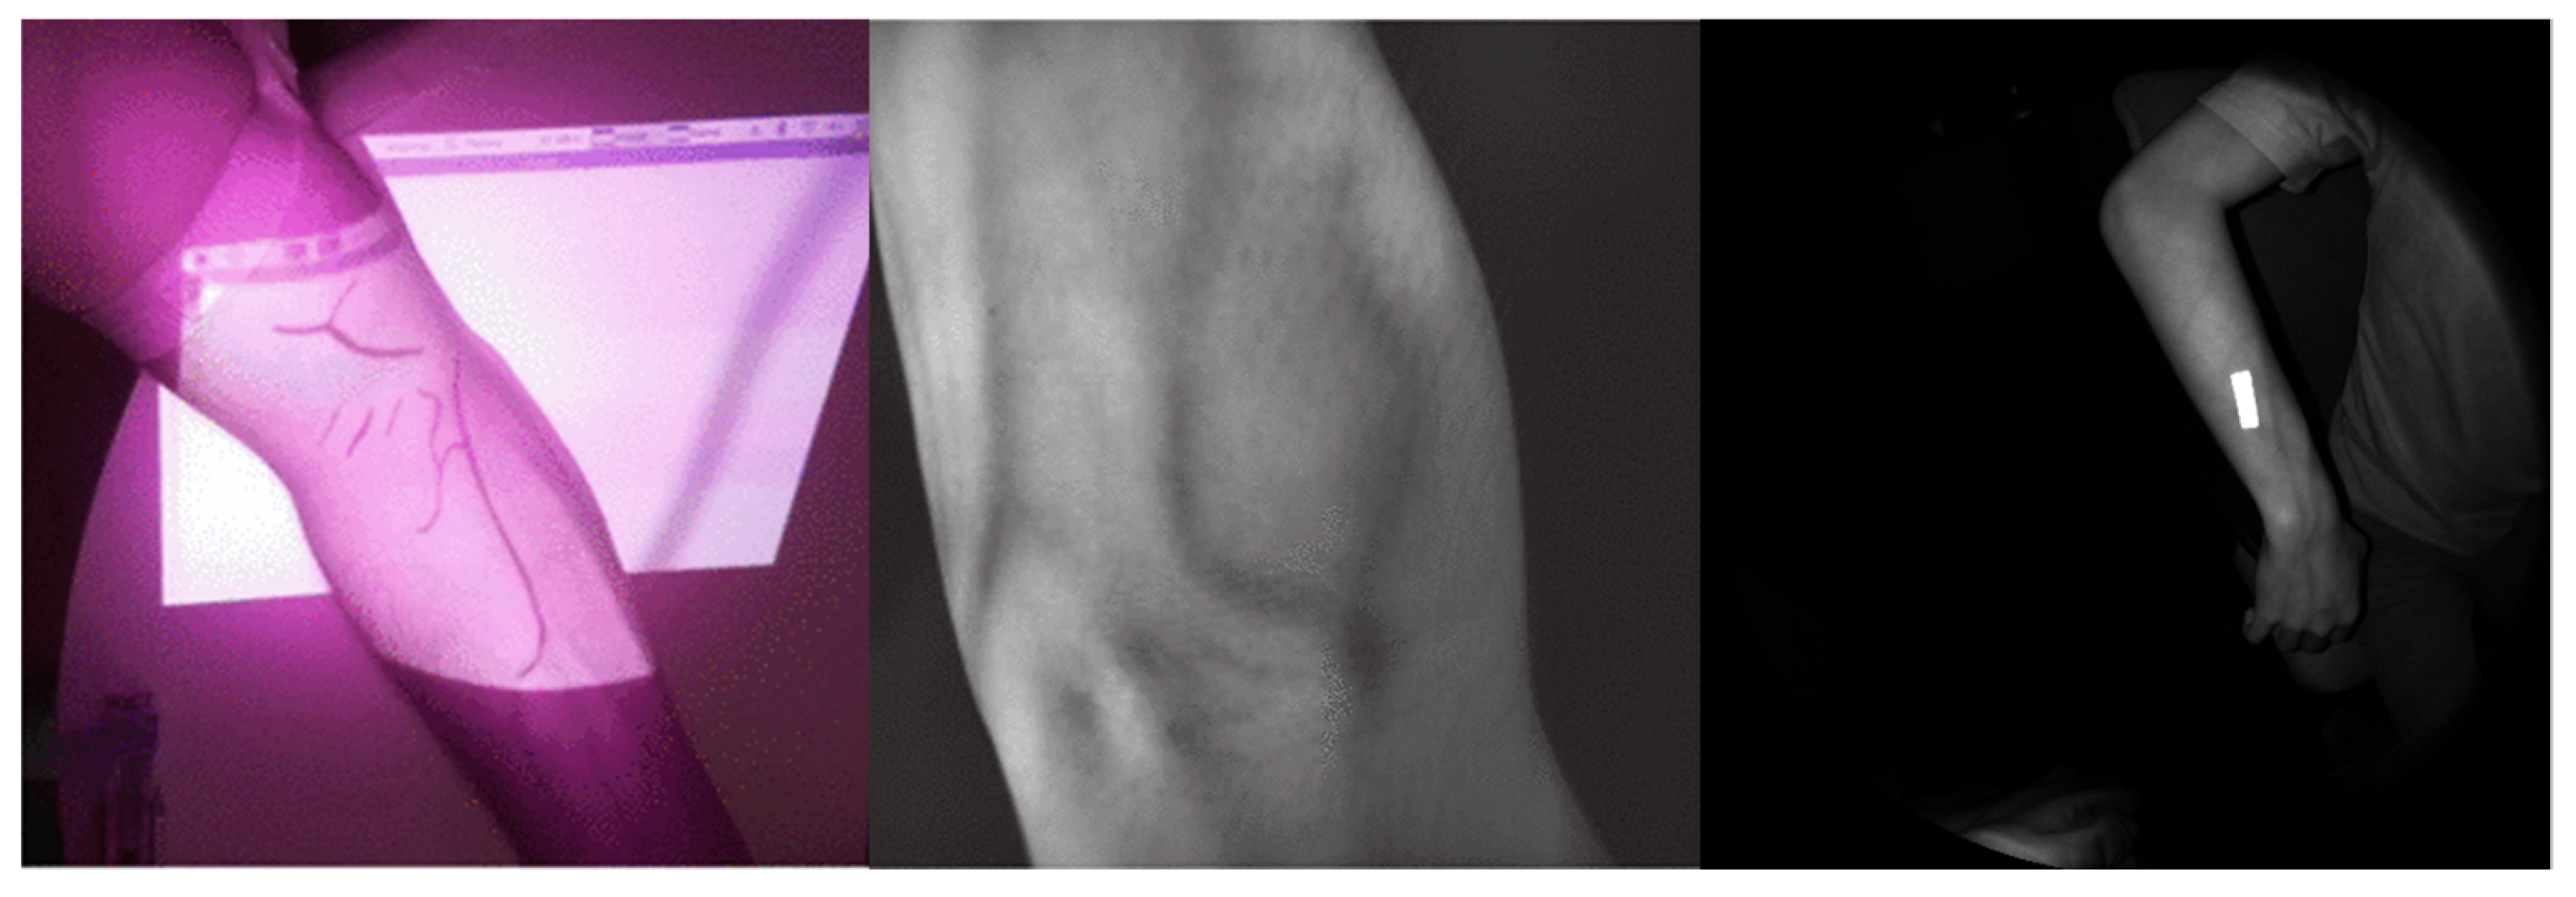
21], but still underperformed in terms of recall, even with the 0.18 increase over baseline. We hypothesize that this could be due to a difference in dataset quality. As seen from
Figure 12, [
21]’s dataset contained higher-quality and -resolution images of the arms/veins and was labeled explicitly by an expert, compared to [
14] and our work. Our approach strikes a balance between freedom of movement, i.e., user does not need to position the camera relative to the arm/veins, due to the wide field of view illustrated in
Figure 12 (right), the and detection performance.
3.4. Preliminary User Perception Study
While the above section provides quantitative results on detection and segmentation performance, a small-scale user study was also performed in a transplant ward at a tertiary healthcare institution to ascertain real-world performance and usability. An experienced medical professional simulated a venipuncture procedure and searched for candidate veins via visual inspection and palpation. The search process stops after 3 min, or when three veins that could be used for venipuncture are identified. In total, three patients were assessed for a total of eight candidate veins. The medical professional then donned the headset and assesses HoloVein’s identification of the previously identified veins based off a four-point scale (0—Not Visible, 1—Barely Visible, 2—Mostly Visible, 3—Consistently Visible). Both the baseline and fine-tuned models were provided in a randomized order, with the medical professional being blinded to which model was currently active.
The fine-tuned model consistently received on par or higher scores than the baseline model for all veins, with an average score of 2.75 against 1.5. The regions covered include common venipuncture sites (e.g., antecubital fossa, forearm, foot). Common factors that increase the difficulty of venipuncture, such as age, skin tone, and kidney, liver, or heart disease, are well captured in the sample group (see
Appendix A for detailed breakdown) [
40].
4. Discussion and Conclusions
In this paper, we sought to address the clinical challenge of locating viable veins for venipuncture access in DIVA patients. While there have been many proposed solutions involving hand-held vein finders [
12], station-based setups, and automatic venipuncture machines [
14,
21], none fulfill the requirements of a hands-free, portable solution that allows for quick screening of large areas without compromising on sterility or user dexterity.
Our study proposed a mixed-reality vein finder solution that addresses many of the shortcomings that existing commercial solutions face. A marker-based solution was used to increase user flexibility, while the head-mounted integrated device allows for greater portability coupled with a wider field of assessment and operating range. Furthermore, our solution does not require any dedicated hardware that is designed for vein-finding, allowing HoloVein to be adopted as one of a suite of many healthcare solutions integrated into a single device, reducing the effective cost of use as compared to dedicated vein finder solutions.
While traditional image processing and adaptive thresholding techniques have been used for vein extraction [
4,
20,
23], recent segmentation techniques, spurred by impressive results in other computer vision tasks, rely on supervised deep-learning-based solutions [
14,
21]. However, due to the nature of medical/patient data, none of the prior work utilized a large dataset, with [
14] using 90 images and [
21] using 140 images in total. Both works used U-Net-based architectures to train and perform segmentation. In this paper, we similarly utilized a U-Net setup, but demonstrate that by incorporating unlabeled data into the training scheme via a semi-supervised loop, we were able to boost performance with no additional annotation effort required. By leveraging on a 3D accumulation and back-projection strategy, coupled with a simulated annealing process, labels could be generated and updated on the fly, allowing the model to be exposed to a larger, more diverse dataset (>100× larger than previous works).
We showed in the quantitative results that this semi-supervised pipeline produced better metrics compared to previous work of similar setup/quality [
14], better precision and recall by 0.469 and 0.227, respectively. By analyzing segmentation results temporally, we also see that our approach resulted in improved segmentation robustness. The temporal stability of segmentation, which was not explored in previous works, indicates that slight changes in viewpoint or distance does not affect results significantly, allowing for greater real-world user flexibility.
The improved performance was further validated via a small-scale user study. Although preliminary, the study results showed a potential for HoloVein to replace manual searching for patients with difficult veins, allowing for a potential decrease in procedure time. Along with this, the usage of HoloVein could potentially lead to better success rates as a more comprehensive screening via HoloVein could reveal more suitable veins that could have been missed out during manual inspection.

 ,
, 


