

Fat-Corrected Pancreatic R2* Relaxometry from Multi-Echo Gradient-Recalled Echo Sequence Using Convolutional Neural Network
 , ,
, , 

Abstract
:1. Introduction
2. Materials and Methods
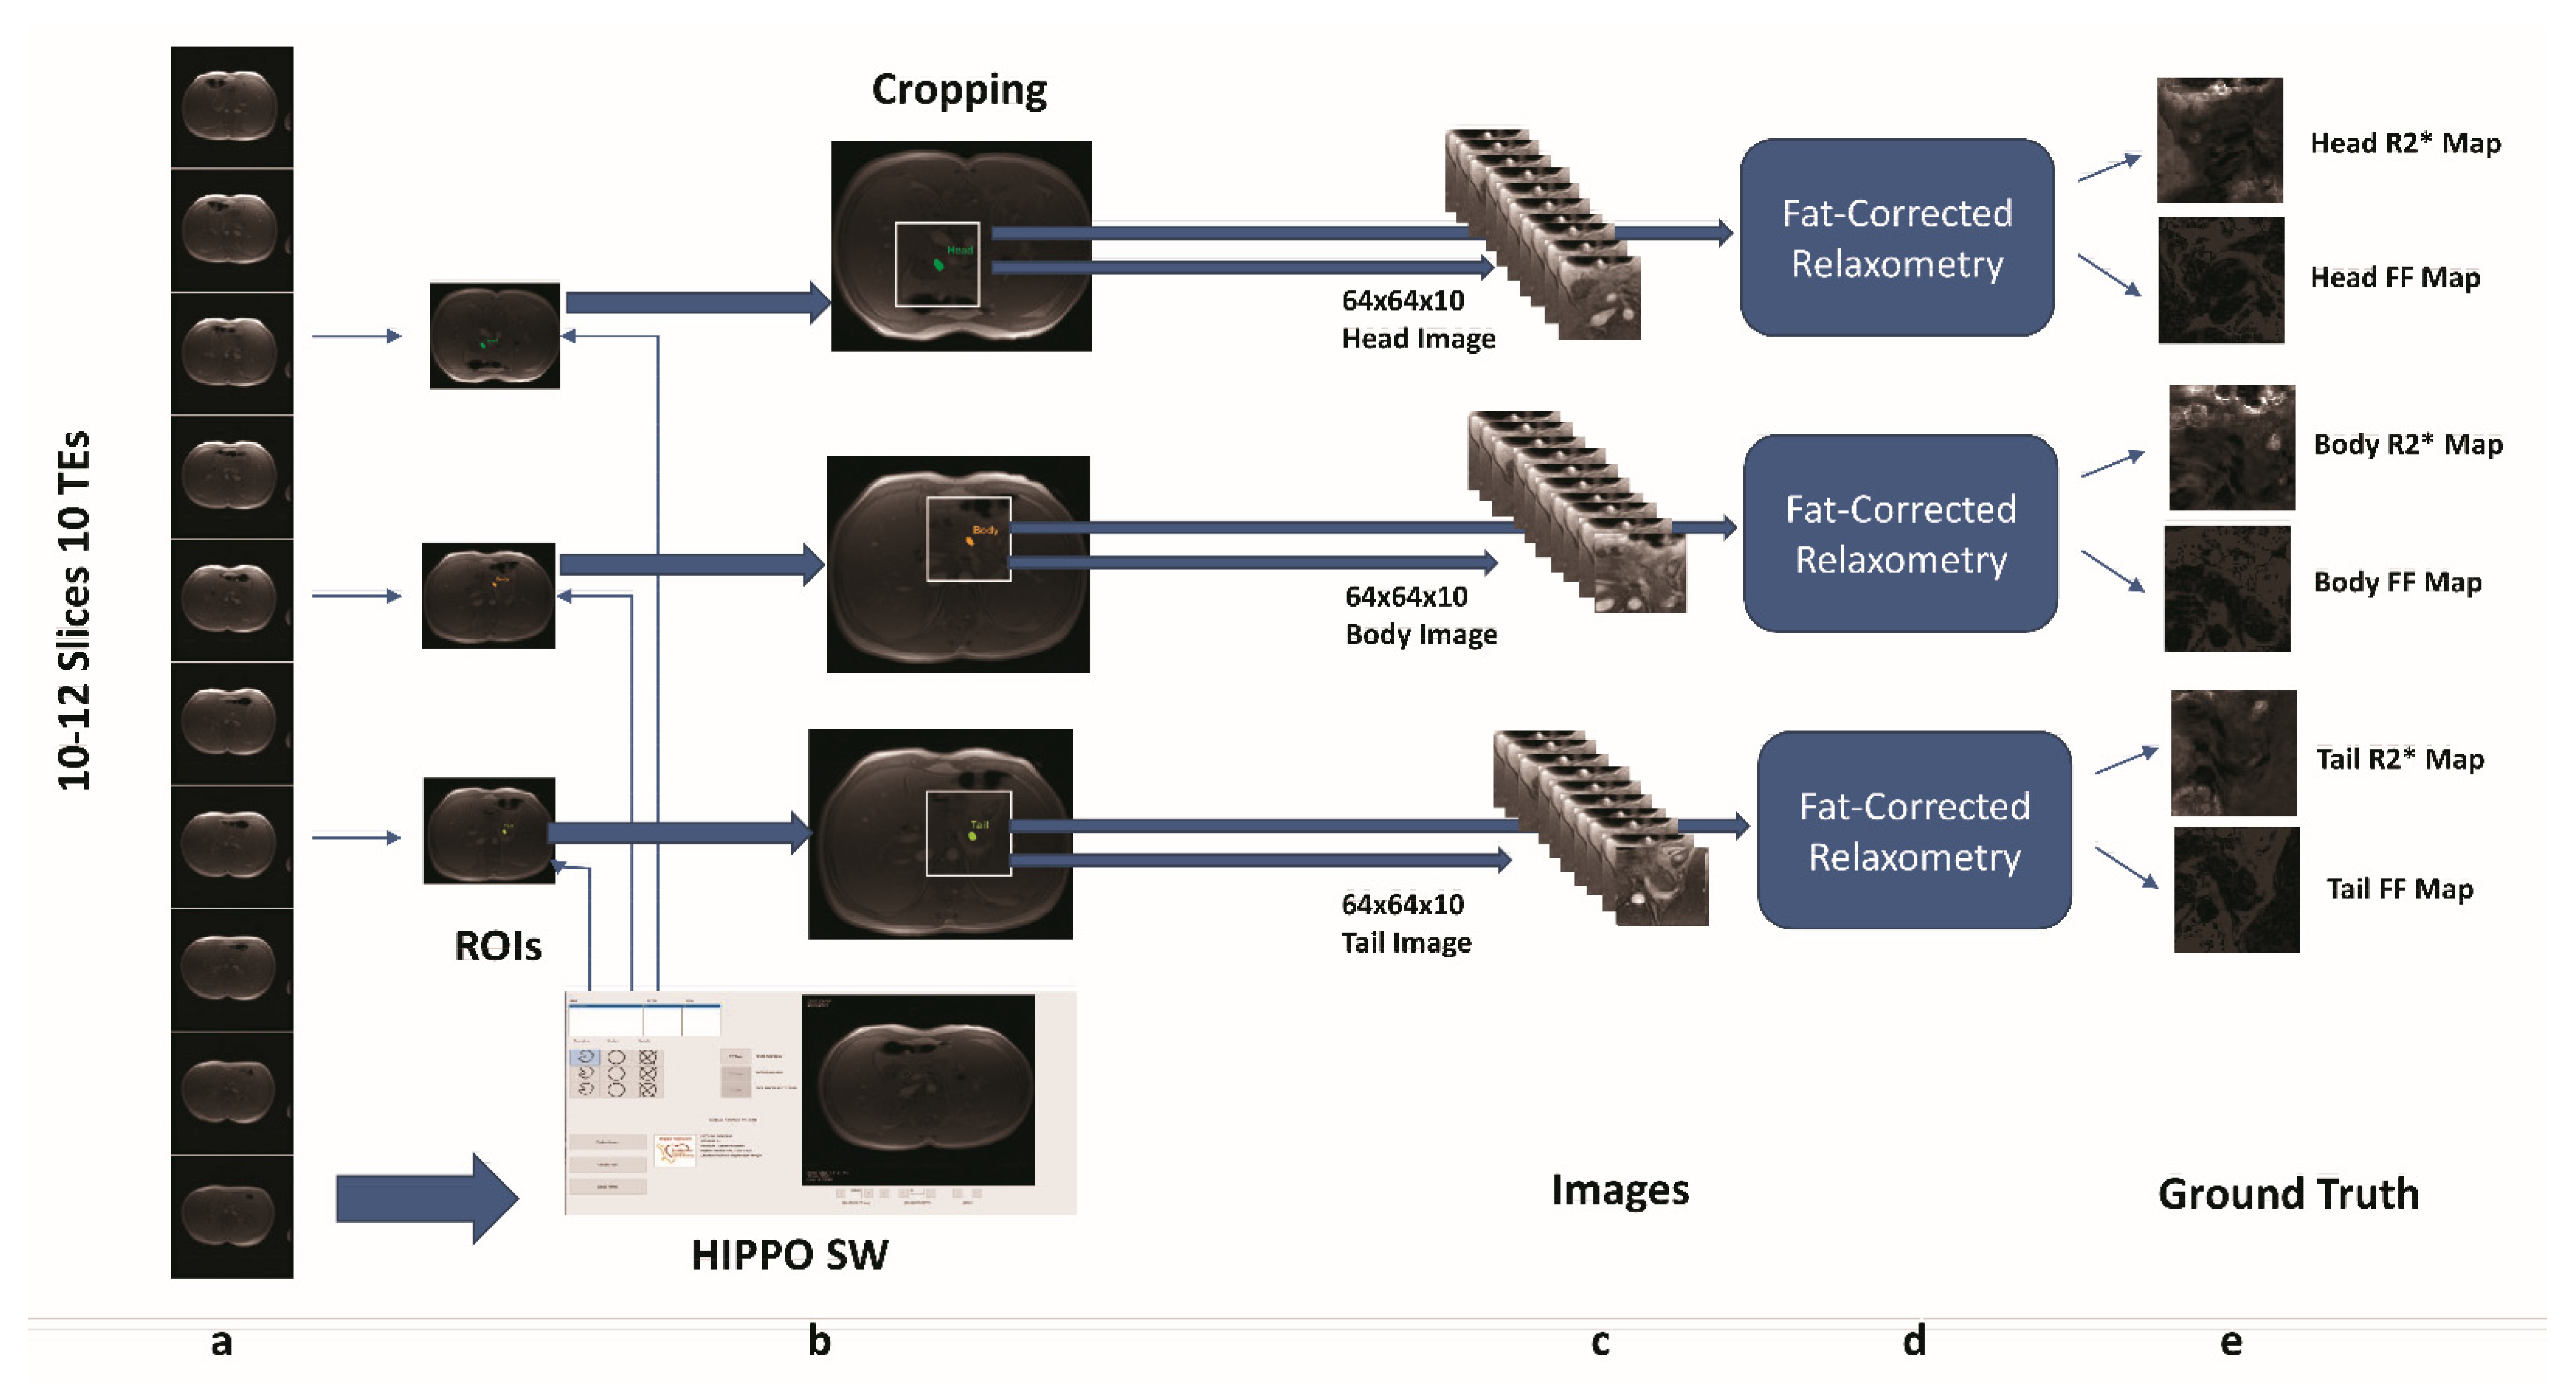
2.1. Fat-Corrected Relaxometry
2.2. Ground Truth
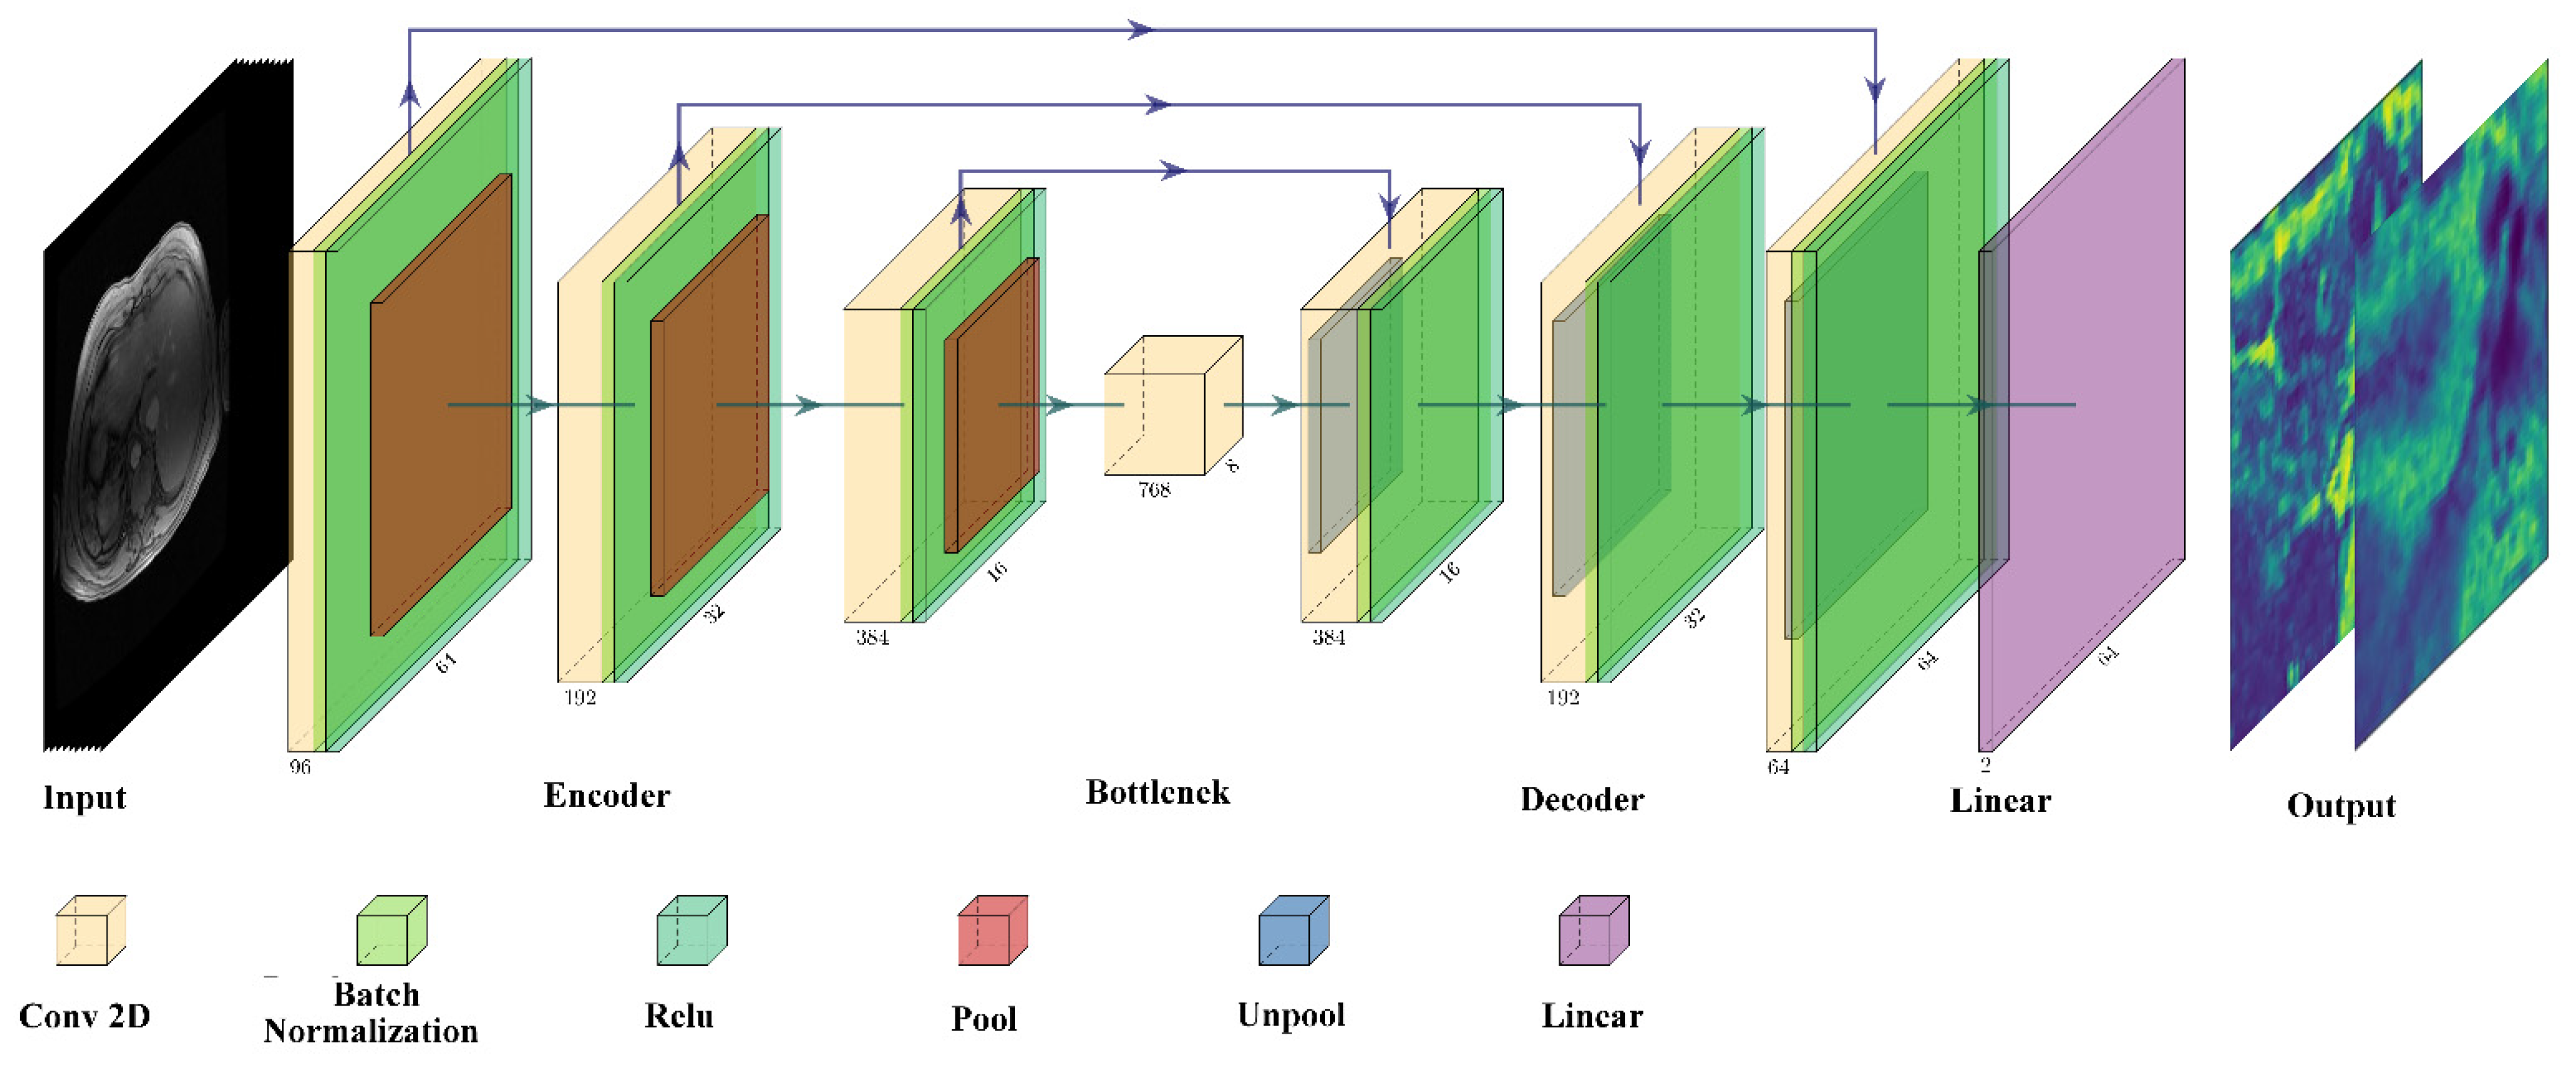
2.3. U-Net Model
2.4. U-Net Implementation, Training, and Testing
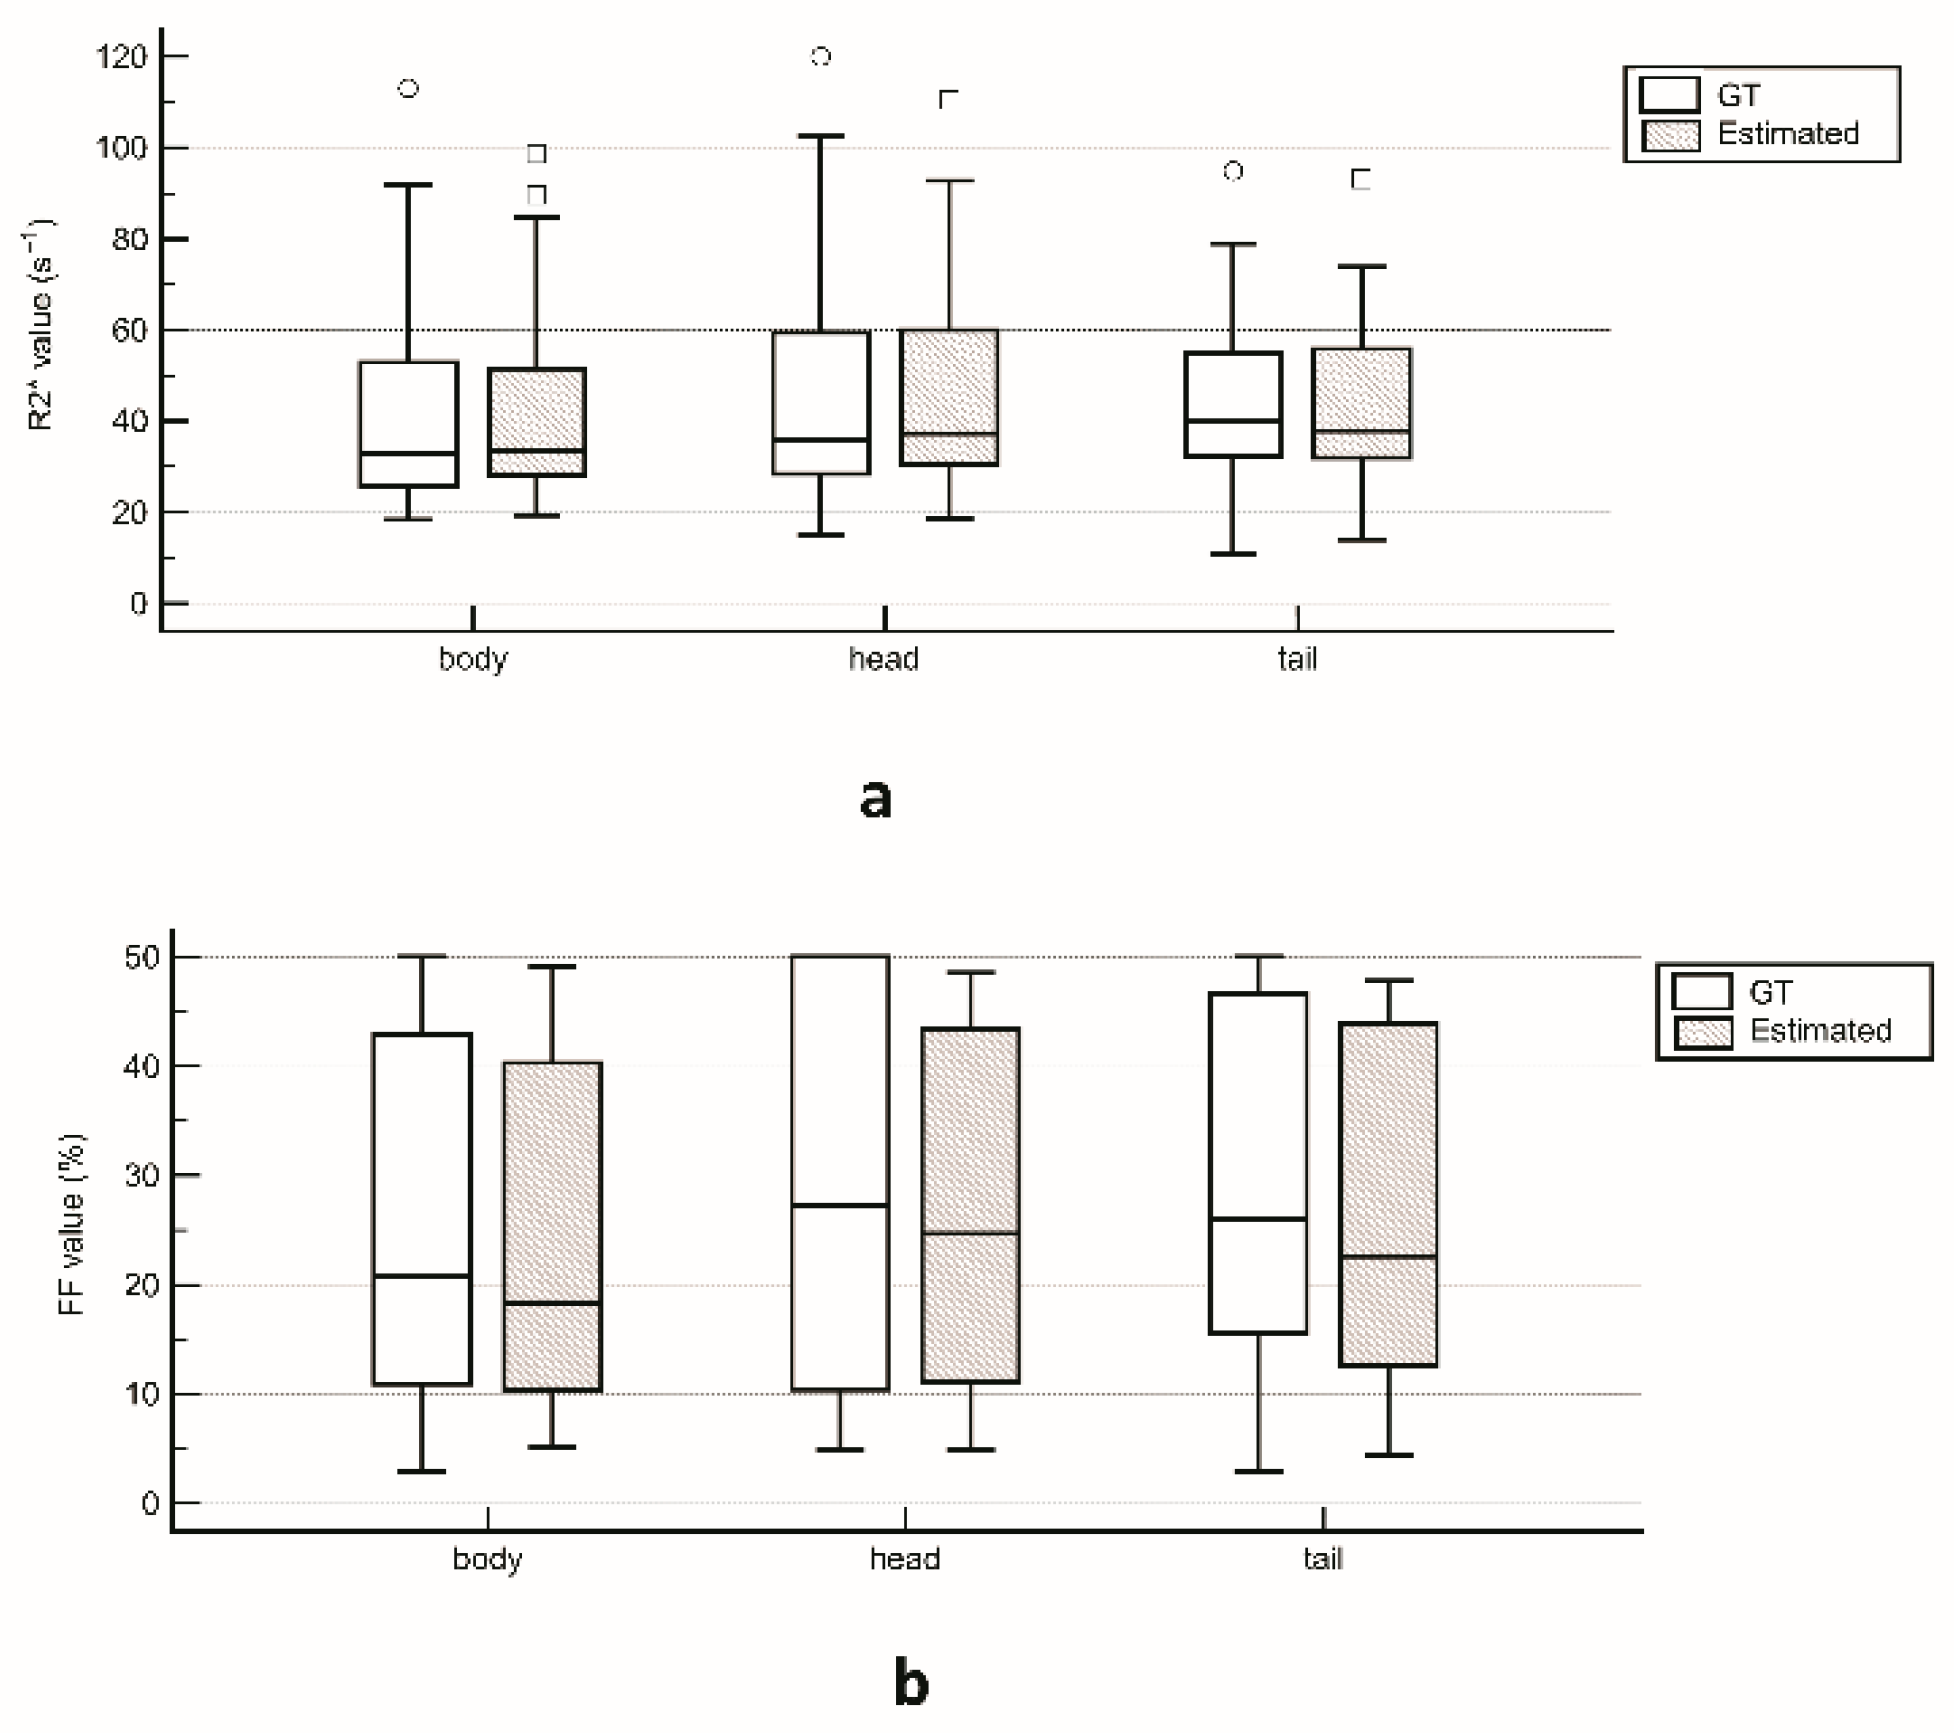
2.5. Statistical Analysis
3. Results
3.1. Ground Truth
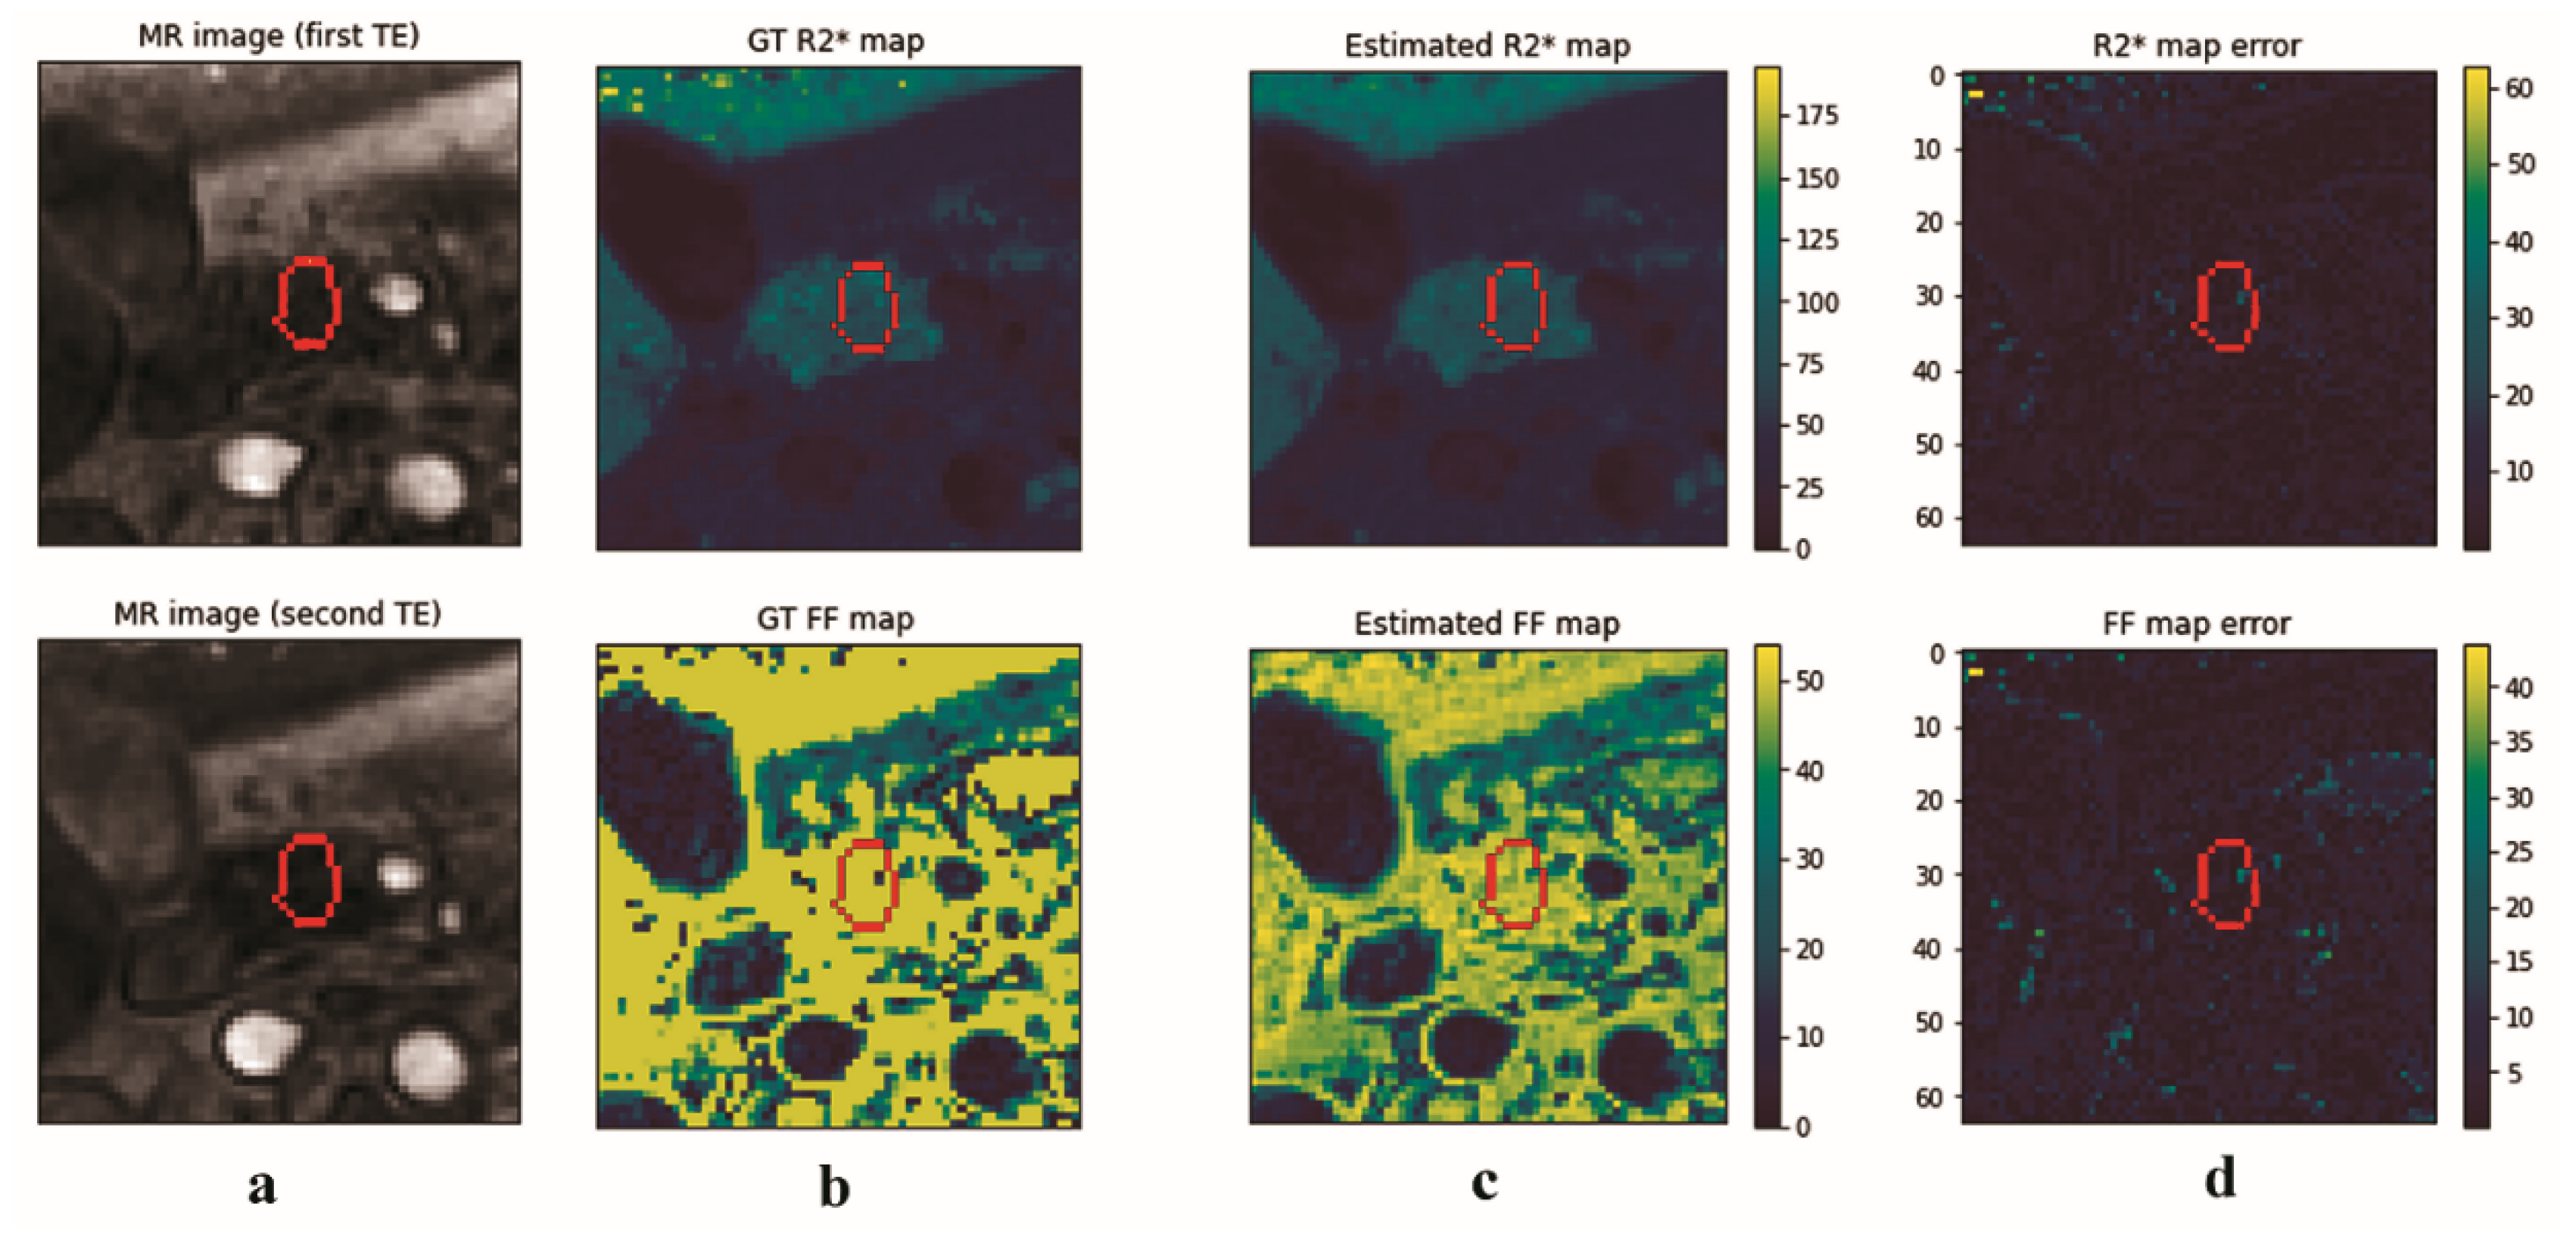
3.2. U-Net Results
4. Discussion
Author Contributions
Funding
Data Availability Statement
Acknowledgments
Conflicts of Interest
References
- Shander, A.; Cappellini, M.D.; Goodnough, L.T. Iron overload and toxicity: The hidden risk of multiple blood transfusions. Vox Sang. 2009, 97, 185–197. [Google Scholar] [CrossRef] [PubMed]
- Borgna-Pignatti, C.; Cappellini, M.D.; De Stefano, P.; Del Vecchio, G.C.; Forni, G.L.; Gamberini, M.R.; Ghilardi, R.; Origa, R.; Piga, A.; Romeo, M.A.; et al. Survival and complications in thalassemia. Ann. N. Y. Acad. Sci. 2005, 1054, 40–47. [Google Scholar] [CrossRef]
- Weatherall, D.J.; Clegg, J.B. Thalassemia—A global public health problem. Nat. Med. 1996, 2, 847–849. [Google Scholar] [CrossRef]
- Aslan, E.; Luo, J.W.; Lesage, A.; Paquin, P.; Cerny, M.; Chin, A.S.-L.; Olivié, D.; Gilbert, G.; Soulières, D.; Tang, A. MRI-Based R2* Mapping in patients with suspected or known iron overload. Abdom. Radiol. 2021, 46, 2505–2515. [Google Scholar] [CrossRef] [PubMed]
- Positano, V.; Pepe, A.; Santarelli, M.F.; Scattini, B.; De Marchi, D.; Ramazzotti, A.; Forni, G.; Borgna-Pignatti, C.; Lai, M.E.; Midiri, M.; et al. Standardized T2* map of normal human heart in vivo to correct T2* segmental artefacts. NMR Biomed. 2007, 20, 578–590. [Google Scholar] [CrossRef]
- Meloni, A.; De Marchi, D.; Pistoia, L.; Grassedonio, E.; Peritore, G.; Preziosi, P.; Restaino, G.; Righi, R.; Riva, A.; Renne, S.; et al. Multicenter validation of the magnetic resonance t2* technique for quantification of pancreatic iron. Eur. Radiol. 2019, 29, 2246–2252. [Google Scholar] [CrossRef] [PubMed]
- Grassedonio, E.; Meloni, A.; Positano, V.; De Marchi, D.; Toia, P.; Midiri, M.; Pepe, A. Quantitative T2* magnetic resonance imaging for renal iron overload assessment: Normal values by age and sex. Abdom. Imaging 2015, 40, 1700–1704. [Google Scholar] [CrossRef]
- Bonny, J.-M.; Zanca, M.; Boire, J.-Y.; Veyre, A. T2 Maximum likelihood estimation from multiple spin-echo magnitude images. Magn. Reson. Med. 1996, 36, 287–293. [Google Scholar] [CrossRef]
- Wood, J.C.; Ghugre, N. Magnetic resonance imaging assessment of excess iron in thalassemia, sickle cell disease and other iron overload diseases. Hemoglobin 2008, 32, 85–96. [Google Scholar] [CrossRef]
- Feng, Y.; He, T.; Gatehouse, P.D.; Li, X.; Harith Alam, M.; Pennell, D.J.; Chen, W.; Firmin, D.N. Improved MRI R2* relaxometry of iron-loaded liver with noise correction. Magn. Reson. Med. 2013, 70, 1765–1774. [Google Scholar] [CrossRef]
- Hernando, D.; Liang, Z.-P.; Kellman, P. Chemical shift-based water/fat separation: A comparison of signal models. Magn. Reson. Med. 2010, 64, 811–822. [Google Scholar] [CrossRef] [PubMed]
- Ramazzotti, A.; Pepe, A.; Positano, V.; Rossi, G.; De Marchi, D.; Brizi, M.G.; Luciani, A.; Midiri, M.; Sallustio, G.; Valeri, G.; et al. Multicenter validation of the magnetic resonance T2* technique for segmental and global quantification of myocardial iron. J. Magn. Reson. Imaging 2009, 30, 62–68. [Google Scholar] [CrossRef] [PubMed]
- Westwood, M.A.; Firmin, D.N.; Gildo, M.; Renzo, G.; Stathis, G.; Markissia, K.; Vasili, B.; Pennell, D.J. Intercentre reproducibility of magnetic resonance T2* measurements of myocardial iron in thalassaemia. Int. J. Cardiovasc. Imaging 2005, 21, 531–538. [Google Scholar] [CrossRef] [PubMed]
- Lingvay, I.; Esser, V.; Legendre, J.L.; Price, A.L.; Wertz, K.M.; Adams-Huet, B.; Zhang, S.; Unger, R.H.; Szczepaniak, L.S. Noninvasive quantification of pancreatic fat in humans. J. Clin. Endocrinol. Metab. 2009, 94, 4070–4076. [Google Scholar] [CrossRef]
- Hernando, D.; Kramer, J.H.; Reeder, S.B. Multipeak fat-corrected complex R2* relaxometry: Theory, optimization, and clinical validation. Magn. Reson. Med. 2013, 70, 1319–1331. [Google Scholar] [CrossRef] [PubMed]
- Schwenzer, N.F.; Machann, J.; Martirosian, P.; Stefan, N.; Schraml, C.; Fritsche, A.; Claussen, C.D.; Schick, F. Quantification of pancreatic lipomatosis and liver steatosis by MRI: Comparison of in/opposed-phase and spectral-spatial excitation techniques. Investig. Radiol. 2008, 43, 330–337. [Google Scholar] [CrossRef] [PubMed]
- Meloni, A.; De Marchi, D.; Positano, V.; Neri, M.G.; Mangione, M.; Keilberg, P.; Lendini, M.; Cirotto, C.; Pepe, A. Accurate estimate of pancreatic T2* Values: How to deal with fat infiltration. Abdom. Imaging 2015, 40, 3129–3136. [Google Scholar] [CrossRef]
- Hernando, D.; Levin, Y.S.; Sirlin, C.B.; Reeder, S.B. Quantification of liver iron with MRI: State of the art and remaining challenges. J. Magn. Reson. Imaging 2014, 40, 1003–1021. [Google Scholar] [CrossRef] [PubMed]
- Santarelli, M.F.; Meloni, A.; De Marchi, D.; Pistoia, L.; Quarta, A.; Spasiano, A.; Landini, L.; Pepe, A.; Positano, V. Estimation of pancreatic R2* for iron overload assessment in the presence of fat: A comparison of different approaches. Magn. Reson. Mater. Phys. Biol. Med. 2018, 31, 757–769. [Google Scholar] [CrossRef]
- Pfeifer, C.D.; Schoennagel, B.P.; Grosse, R.; Wang, Z.J.; Graessner, J.; Nielsen, P.; Adam, G.; Fischer, R.; Yamamura, J. Pancreatic iron and fat assessment by MRI-R2* in Patients with Iron Overload Diseases. J. Magn. Reson. Imaging 2015, 42, 196–203. [Google Scholar] [CrossRef]
- Positano, V.; Meloni, A.; Santarelli, M.F.; Gerardi, C.; Bitti, P.P.; Cirotto, C.; De Marchi, D.; Salvatori, C.; Landini, L.; Pepe, A. Fast generation of T2* maps in the entire range of clinical interest: Application to thalassemia major patients. Comput. Biol. Med. 2015, 56, 200–210. [Google Scholar] [CrossRef]
- Meloni, A.; Zmyewski, H.; Rienhoff, H.Y., Jr.; Jones, A.; Pepe, A.; Lombardi, M.; Wood, J.C. Fast approximation to pixelwise relaxivity maps: Validation in iron overloaded subjects. Magn. Reson. Imaging 2013, 31, 1074–1080. [Google Scholar] [CrossRef] [PubMed]
- Ronneberger, O.; Fischer, P.; Brox, T. U-Net: Convolutional networks for biomedical image segmentation. arXiv 2015, arXiv:1505.04597. [Google Scholar]
- Isola, P.; Zhu, J.-Y.; Zhou, T.; Efros, A.A. Image-to-image translation with conditional adversarial networks. arXiv 2018, arXiv:1611.07004. [Google Scholar]
- Andersson, J.; Ahlström, H.; Kullberg, J. Separation of water and fat signal in whole-body gradient echo scans using convolutional neural networks. Magn. Reson. Med. 2019, 82, 1177–1186. [Google Scholar] [CrossRef] [PubMed]
- Cho, J.; Park, H. Robust water-fat separation for multi-echo gradient-recalled echo sequence using convolutional neural network. Magn. Reson. Med. 2019, 82, 476–484. [Google Scholar] [CrossRef]
- Liu, K.; Li, X.; Li, Z.; Chen, Y.; Xiong, H.; Chen, F.; Bao, Q.; Liu, C. Robust water-fat separation based on deep learning model exploring multi-echo nature of MGRE. Magn. Reson. Med. 2021, 85, 2828–2841. [Google Scholar] [CrossRef]
- Goldfarb, J.W.; Craft, J.; Cao, J.J. Water-fat separation and parameter mapping in cardiac mri via deep learning with a convolutional neural network. J. Magn. Reson. Imaging 2019, 50, 655–665. [Google Scholar] [CrossRef]
- Hamilton, G.; Yokoo, T.; Bydder, M.; Cruite, I.; Schroeder, M.E.; Sirlin, C.B.; Middleton, M.S. In vivo characterization of the liver fat 1H MR spectrum. NMR Biomed. 2011, 24, 784–790. [Google Scholar] [CrossRef]
- Hamilton, G.; Schlein, A.N.; Middleton, M.S.; Hooker, C.A.; Wolfson, T.; Gamst, A.C.; Loomba, R.; Sirlin, C.B. In vivo triglyceride composition of abdominal adipose tissue measured by 1 h mrs at 3T. J. Magn. Reson. Imaging 2017, 45, 1455–1463. [Google Scholar] [CrossRef]
- Hernando, D.; Kellman, P.; Haldar, J.P.; Liang, Z.-P. Robust water/fat separation in the presence of large field inhomogeneities using a graph cut algorithm. Magn. Reson. Med. 2010, 63, 79–90. [Google Scholar] [CrossRef]
- Bydder, M.; Yokoo, T.; Hamilton, G.; Middleton, M.S.; Chavez, A.D.; Schwimmer, J.B.; Lavine, J.E.; Sirlin, C.B. Relaxation effects in the quantification of fat using gradient echo imaging. Magn. Reson. Imaging 2008, 26, 347–359. [Google Scholar] [CrossRef] [PubMed] [Green Version]
- Meloni, A.; Ramazzotti, A.; Positano, V.; Salvatori, C.; Mangione, M.; Marcheschi, P.; Favilli, B.; De Marchi, D.; Prato, S.; Pepe, A.; et al. Evaluation of a web-based network for reproducible t2* mri assessment of iron overload in thalassemia. Int. J. Med. Inf. 2009, 78, 503–512. [Google Scholar] [CrossRef] [PubMed]
- Pepe, A.; Pistoia, L.; Gamberini, M.R.; Cuccia, L.; Lisi, R.; Cecinati, V.; Maggio, A.; Sorrentino, F.; Filosa, A.; Rosso, R.; et al. National networking in rare diseases and reduction of cardiac burden in thalassemia major. Eur. Heart J. 2022, 43, 2482–2492. [Google Scholar] [CrossRef]
- Wang, Z.; Bovik, A.C.; Sheikh, H.R.; Simoncelli, E.P. Image quality assessment: From error visibility to structural similarity. IEEE Trans. Image Process. 2004, 13, 600–612. [Google Scholar] [CrossRef] [PubMed]
- Meloni, A.; Pistoia, L.; Gamberini, M.R.; Ricchi, P.; Cecinati, V.; Sorrentino, F.; Cuccia, L.; Allò, M.; Righi, R.; Fina, P.; et al. The link of pancreatic iron with glucose metabolism and cardiac iron in thalassemia intermedia: A large, multicenter observational study. J. Clin. Med. 2021, 10, 5561. [Google Scholar] [CrossRef]
- Pepe, A.; Pistoia, L.; Gamberini, M.R.; Cuccia, L.; Peluso, A.; Messina, G.; Spasiano, A.; Allò, M.; Bisconte, M.G.; Putti, M.C.; et al. The close link of pancreatic iron with glucose metabolism and with cardiac complications in thalassemia major: A large, multicenter observational study. Diabetes Care 2020, 43, 2830–2839. [Google Scholar] [CrossRef]
- Au, W.-Y.; Lam, W.W.-M.; Chu, W.; Tam, S.; Wong, W.-K.; Liang, R.; Ha, S.-Y. A T2* Magnetic resonance imaging study of pancreatic iron overload in thalassemia major. Haematologica 2008, 93, 116–119. [Google Scholar] [CrossRef]
- Noetzli, L.J.; Papudesi, J.; Coates, T.D.; Wood, J.C. Pancreatic iron loading predicts cardiac iron loading in thalassemia major. Blood 2009, 114, 4021–4026. [Google Scholar] [CrossRef] [PubMed]
- Feng, L.; Ma, D.; Liu, F. Rapid MR relaxometry using deep learning: An overview of current techniques and emerging trends. NMR Biomed. 2020, 4, e4416. [Google Scholar] [CrossRef]
- Jeelani, H.; Yang, Y.; Zhou, R.; Kramer, C.M.; Salerno, M.; Weller, D.S. A Myocardial T1-Mapping Framework with Recurrent and U-Net Convolutional Neural Networks. In Proceedings of the 17th IEEE International Symposium on Biomedical Imaging, ISBI 2020, Iowa City, IA, USA, 4 April 2020; pp. 1941–1944. [Google Scholar] [CrossRef]
- Liu, F.; Feng, L.; Kijowski, R. MANTIS: Model-augmented neural network with incoherent k-space sampling for efficient mr parameter mapping. Magn. Reson. Med. 2019, 82, 174–188. [Google Scholar] [CrossRef] [PubMed]
- Restaino, G.; Meloni, A.; Positano, V.; Missere, M.; Rossi, G.; Calandriello, L.; Keilberg, P.; Mattioni, O.; Maggio, A.; Lombardi, M.; et al. Regional and global pancreatic T*2 MRI for iron overload assessment in a large cohort of healthy subjects: Normal values and correlation with age and gender. Magn. Reson. Med. 2011, 65, 764–769. [Google Scholar] [CrossRef] [PubMed]
- Huang, J.; Shen, J.; Yang, Q.; Cheng, Z.; Chen, X.; Yu, T.; Zhong, J.; Su, Y.; Guo, H.; Liang, B. Quantification of pancreatic iron overload and fat infiltration and their correlation with glucose disturbance in pediatric thalassemia major patients. Quant. Imaging Med. Surg. 2021, 11, 665–675. [Google Scholar] [CrossRef] [PubMed]
- Weingärtner, S.; Desmond, K.L.; Obuchowski, N.A.; Baessler, B.; Zhang, Y.; Biondetti, E.; Ma, D.; Golay, X.; Boss, M.A.; Gunter, J.L.; et al. Development, validation, qualification, and dissemination of quantitative mr methods: Overview and recommendations by the ismrm quantitative mr study group. Magn. Reson. Med. 2022, 87, 1184–1206. [Google Scholar] [CrossRef] [PubMed]
- Kühn, J.-P.; Hernando, D.; Mensel, B.; Krüger, P.C.; Ittermann, T.; Mayerle, J.; Hosten, N.; Reeder, S.B. Quantitative chemical shift-encoded mri is an accurate method to quantify hepatic steatosis. J. Magn. Reson. Imaging 2014, 39, 1494–1501. [Google Scholar] [CrossRef] [PubMed]
- Kato, S.; Iwasaki, A.; Kurita, Y.; Arimoto, J.; Yamamoto, T.; Hasegawa, S.; Sato, T.; Imajo, K.; Hosono, K.; Kobayashi, N.; et al. Three-dimensional analysis of pancreatic fat by fat-water magnetic resonance imaging provides detailed characterization of pancreatic steatosis with improved reproducibility. PLoS ONE 2019, 14, e0224921. [Google Scholar] [CrossRef] [Green Version]


Publisher’s Note: MDPI stays neutral with regard to jurisdictional claims in published maps and institutional affiliations. |
© 2022 by the authors. Licensee MDPI, Basel, Switzerland. This article is an open access article distributed under the terms and conditions of the Creative Commons Attribution (CC BY) license (https://creativecommons.org/licenses/by/4.0/).
Share and Cite
Santarelli, M.F.; Joubbi, S.; Meloni, A.; Pistoia, L.; Casini, T.; Massei, F.; Bitti, P.P.; Allò, M.; Cademartiri, F.; Positano, V. Fat-Corrected Pancreatic R2* Relaxometry from Multi-Echo Gradient-Recalled Echo Sequence Using Convolutional Neural Network. Electronics 2022, 11, 2829. https://doi.org/10.3390/electronics11182829
Santarelli MF, Joubbi S, Meloni A, Pistoia L, Casini T, Massei F, Bitti PP, Allò M, Cademartiri F, Positano V. Fat-Corrected Pancreatic R2* Relaxometry from Multi-Echo Gradient-Recalled Echo Sequence Using Convolutional Neural Network. Electronics. 2022; 11(18):2829. https://doi.org/10.3390/electronics11182829
Chicago/Turabian StyleSantarelli, Maria Filomena, Sara Joubbi, Antonella Meloni, Laura Pistoia, Tommaso Casini, Francesco Massei, Pier Paolo Bitti, Massimo Allò, Filippo Cademartiri, and Vincenzo Positano. 2022. "Fat-Corrected Pancreatic R2* Relaxometry from Multi-Echo Gradient-Recalled Echo Sequence Using Convolutional Neural Network" Electronics 11, no. 18: 2829. https://doi.org/10.3390/electronics11182829