Article

Machine and Deep Learning Algorithms for COVID-19 Mortality Prediction Using Clinical and Radiomic Features

1
Medical Physics Unit, Azienda USL-IRCCS di Reggio Emilia, 42123 Reggio Emilia, Italy
2
Department of Physics and Astronomy-DIFA, University of Bologna, 40126 Bologna, Italy
3
Radiology Unit, Azienda USL-IRCCS di Reggio Emilia, 42123 Reggio Emilia, Italy
4
Department of Medical and Surgical Sciences, University of Modena and Reggio Emilia, 41124 Modena, Italy
5
Department of Experimental, Diagnostic and Specialty Medicine—DIMES, IRCCS-Policlinico di S.Orsola, 40126 Bologna, Italy
6
INFN-Sezione di Bologna, 40127 Bologna, Italy
7
Radiology Sciences, Department of Medicine and Surgery Unit, Azienda Ospedaliero-Universitaria di Parma, 43126 Parma, Italy
8
Clinical Immunology, Allergy and Advanced Biotechnologies Unit, Azienda USL-IRCCS di Reggio Emilia, 42123 Reggio Emilia, Italy
9
Rheumatology Unit, Azienda USL-IRCCS di Reggio Emilia, 42123 Reggio Emilia, Italy
*
Authors to whom correspondence should be addressed.
Electronics 2023, 12(18), 3878; https://doi.org/10.3390/electronics12183878
Submission received: 2 August 2023 / Revised: 5 September 2023 / Accepted: 12 September 2023 / Published: 14 September 2023
(This article belongs to the Special Issue Revolutionizing Medical Image Analysis with Deep Learning)

Abstract

:
Aim: Machine learning (ML) and deep learning (DL) predictive models have been employed widely in clinical settings. Their potential support and aid to the clinician of providing an objective measure that can be shared among different centers enables the possibility of building more robust multicentric studies. This study aimed to propose a user-friendly and low-cost tool for COVID-19 mortality prediction using both an ML and a DL approach. Method: We enrolled 2348 patients from several hospitals in the Province of Reggio Emilia. Overall, 19 clinical features were provided by the Radiology Units of Azienda USL-IRCCS of Reggio Emilia, and 5892 radiomic features were extracted from each COVID-19 patient’s high-resolution computed tomography. We built and trained two classifiers to predict COVID-19 mortality: a machine learning algorithm, or support vector machine (SVM), and a deep learning model, or feedforward neural network (FNN). In order to evaluate the impact of the different feature sets on the final performance of the classifiers, we repeated the training session three times, first using only clinical features, then employing only radiomic features, and finally combining both information. Results: We obtained similar performances for both the machine learning and deep learning algorithms, with the best area under the receiver operating characteristic (ROC) curve, or AUC, obtained exploiting both clinical and radiomic information: 0.803 for the machine learning model and 0.864 for the deep learning model. Conclusions: Our work, performed on large and heterogeneous datasets (i.e., data from different CT scanners), confirms the results obtained in the recent literature. Such algorithms have the potential to be included in a clinical practice framework since they can not only be applied to COVID-19 mortality prediction but also to other classification problems such as diabetic prediction, asthma prediction, and cancer metastases prediction. Our study proves that the lesion’s inhomogeneity depicted by radiomic features combined with clinical information is relevant for COVID-19 mortality prediction.

1. Introduction

Since 2020, SARS-CoV-2 respiratory syndrome affected the whole world [1,2]. High-resolution computed tomography (HRCT) was extensively used to diagnose, assess, and monitor the progression of the disease. From this medical imaging technique, it is possible to extract quantitative data, the so-called radiomics. Through this set of numerical descriptors, we can investigate the possible correlation between the information extracted directly from the images’ pixel values and the clinical or biological characteristics of the involved patients [3]. As CT scans were a necessary part of the diagnostic pathway during the first period of the COVID-19 pandemic, at least in some centers, we can count CT as a non-invasive tool for enhancing the existing data available to clinicians by means of advanced mathematical analysis [4,5,6,7,8,9].
In recent years, machine learning (ML) and deep learning (DL) methods have been rapidly developing, and their applications to the medical field have increasingly spread [10,11,12,13]. Recent studies [10,14,15,16,17,18,19,20,21,22,23,24,25,26,27,28,29,30,31,32,33,34,35,36,37,38,39,40] embedded such techniques to predict COVID-19 prognosis: patient mortality, mechanical ventilation requirement, hospitalization, or need for intubation. These algorithms were extensively applied for the detection and segmentation of COVID-19 pneumonia regions from high-resolution computed tomography scans (HRCTs) and chest X-rays (CXRs) [3,36,37,41,42,43,44,45,46].
A recent review [10] analyzed studies regarding COVID-19 mortality prediction. Among the considered works, only Xiao [38] explored the contribution of radiomics to clinical data in improving mortality prediction. In addition to this, other studies [23,35,39,40] pointed out that radiomic and clinical data combination is a promising way to predict which triage is suitable for each patient.
Bae [17], Varghese [19], and Shiri [22] showed that useful information to predict patient prognosis can also be extracted from 2D radiography image sets. On the other hand, Shiri [42] built a residual network for the detection and quantification of lung pneumonia damage, while Ozturk’s model [43] aimed to discriminate between COVID-19, general pneumonia, and no findings.
From recent studies, it is clear that one of the main drawbacks in this emerging field is the small number of enrolled patients, which makes the obtained results less generalizable and prone to overfitting [47].
The future clinical utility of these prediction models is their potential support and aid to the clinician, providing an objective measure that can be shared among different centers, enabling the possibility of building more robust multicentric studies [48]. More importantly, those tools will also play a substantial role in developing and assessing personalized treatments [48,49].
In our work, we built two classifiers to predict COVID-19 mortality: a machine learning algorithm, or support vector machine (SVM), and a deep learning model, or feedforward neural network (FNN), were trained to discriminate between deceased and non-deceased patients. We chose mortality as the outcome for our evaluation since it showed the lowest bias with respect to other endpoints collectible in the first phase of the COVID-19 outbreak. We enrolled a relevant number of patients (2348), one of the major strengths of this study, from several hospitals in the Province of Reggio Emilia, Italy. Our dataset’s intrinsic inhomogeneity could make our results more robust, displaying a lower overfitting risk.

2. Materials and Methods

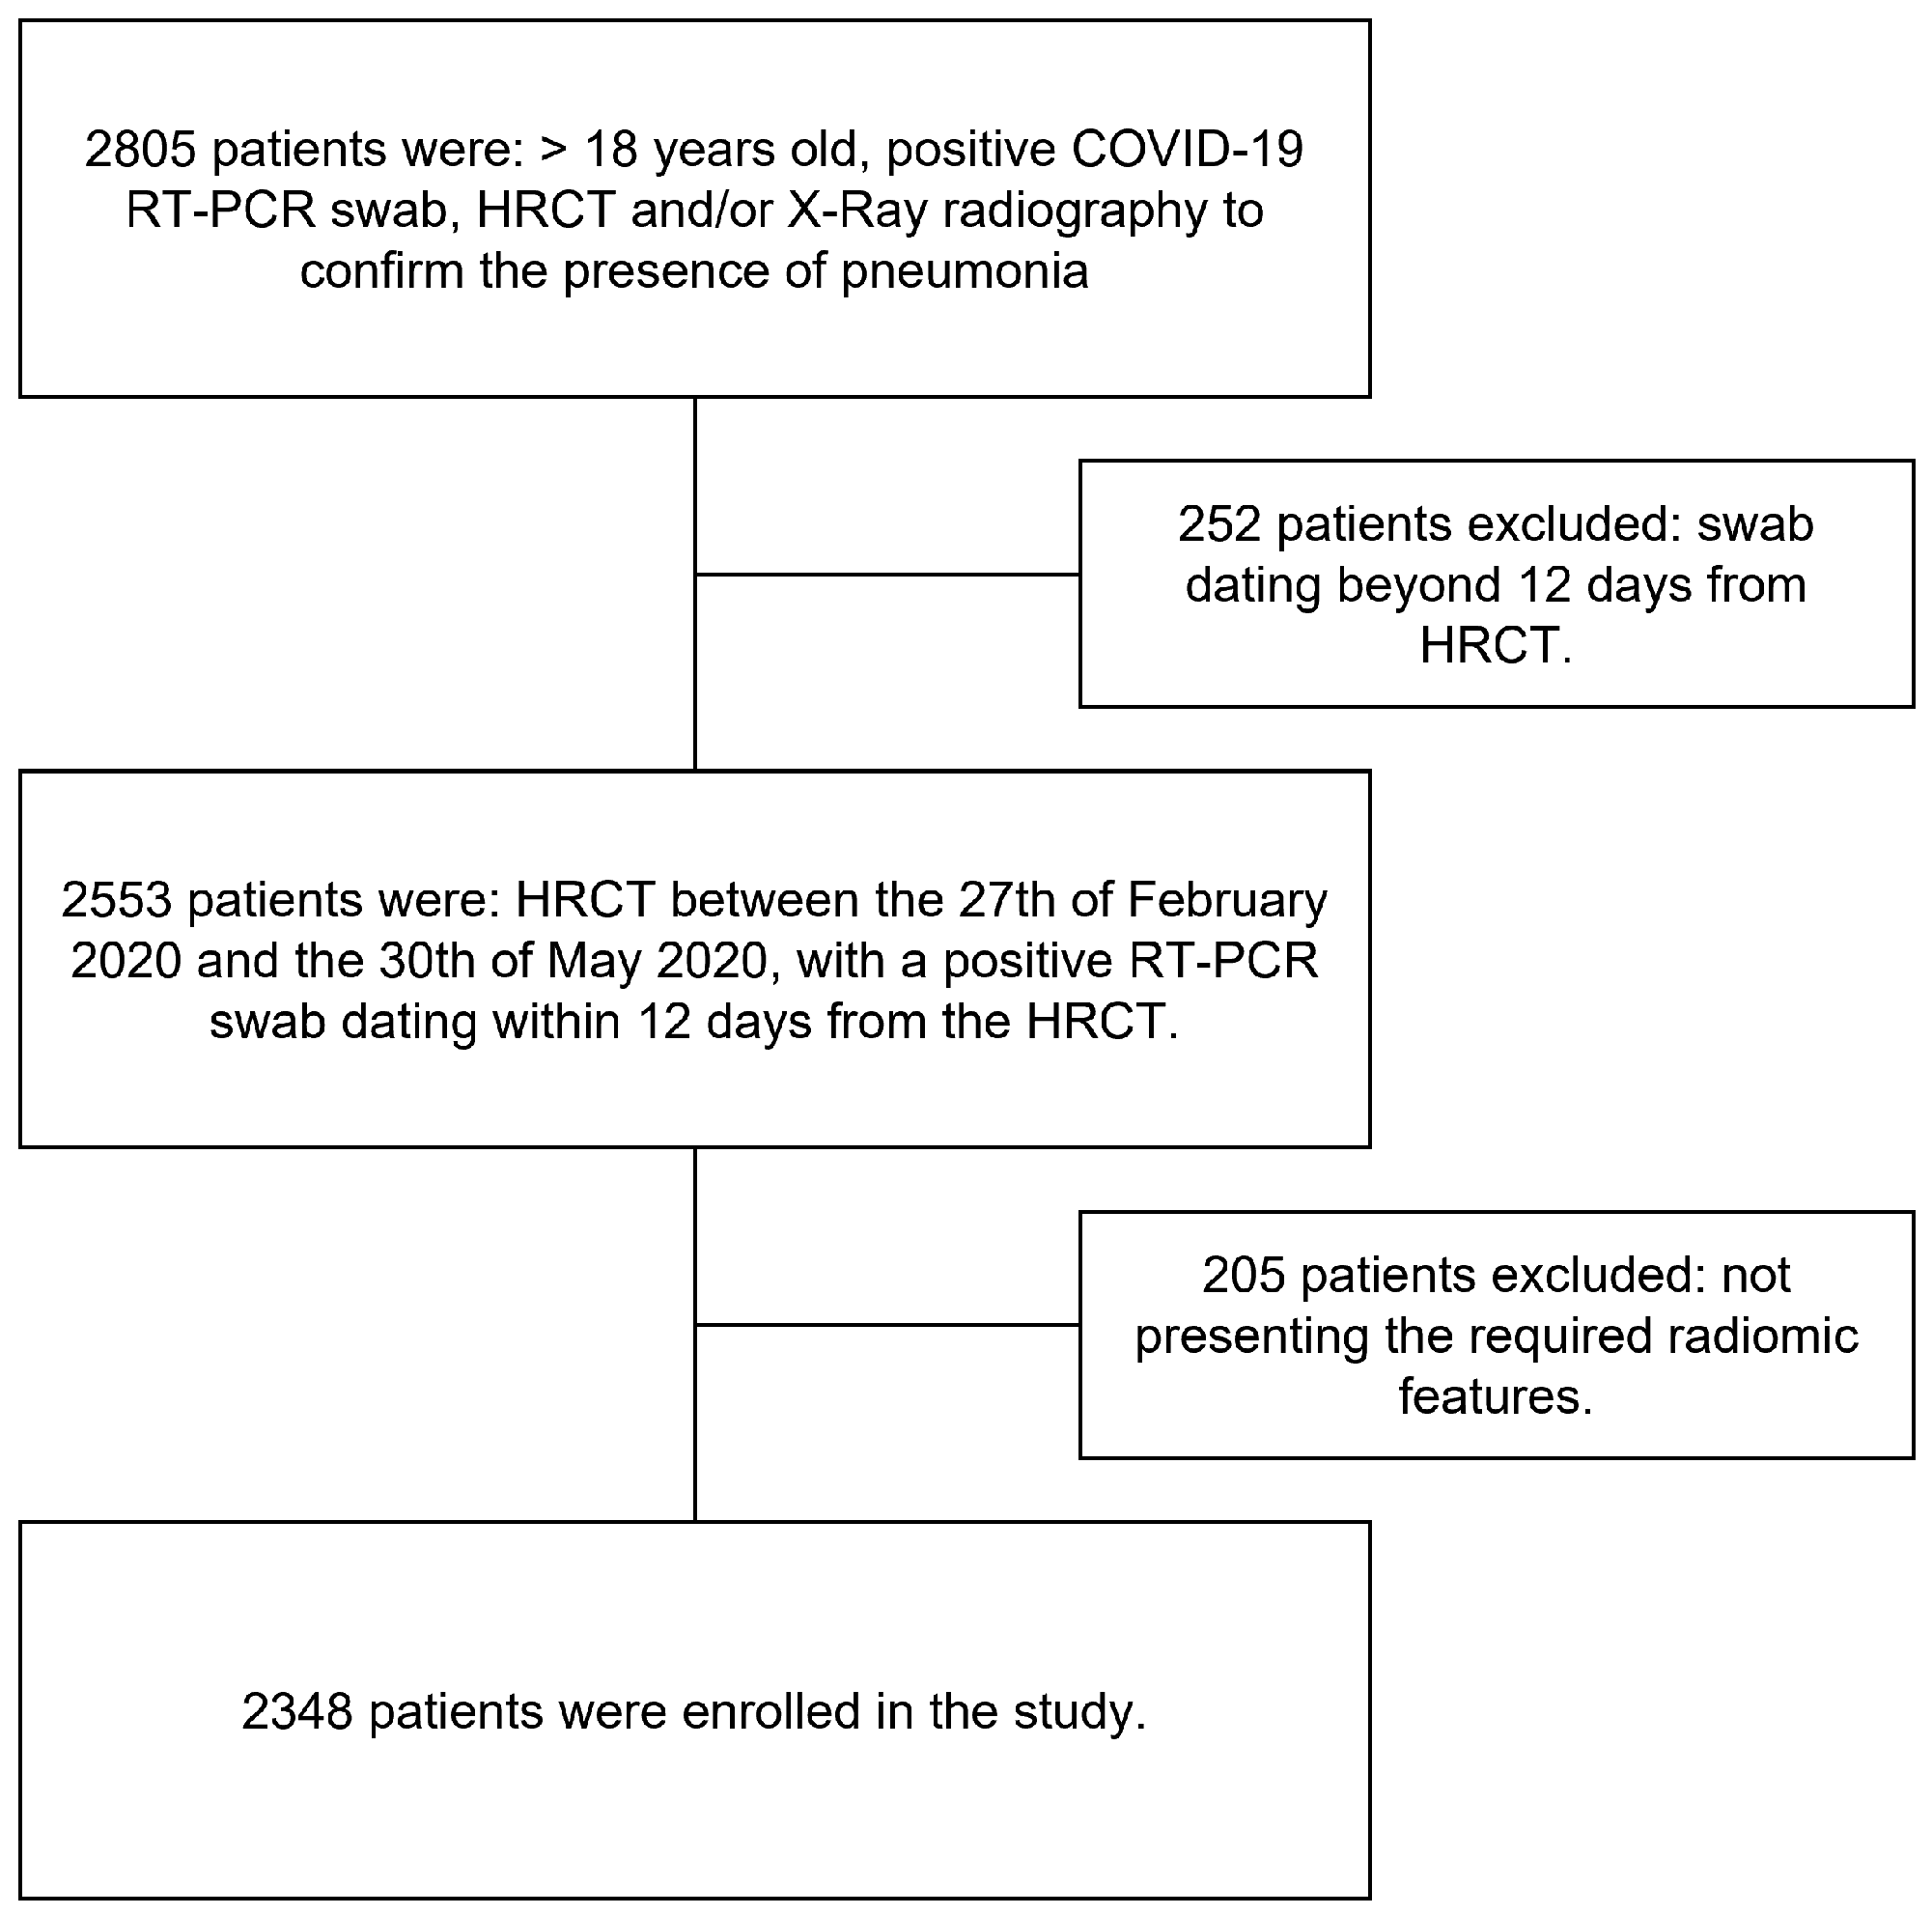
2.1. Study Population

The current study is part of a major multicentric study called “Endothelial, neutrophil, and complement perturbation linked to acute and chronic damage in COVID-19 pneumonitis coupled with machine learning approaches”, code: COVID-2020-12371808.
The project was approved by the Area Vasta Emilia Nord (AVEN) Ethics Committee (project number dated back to the 28 July 2020: 855/2020/OSS/AUSLRE) and competent authorities, following the EU and national directives and according to the principles of the Helsinki Declaration.
It engaged different Units of Azienda Unità Sanitaria Locale-IRCCS di Reggio Emilia and gathered patients from the whole Reggio Emilia province.
Patients’ inclusion criteria were: age > 18 years old; positive reverse transcriptase polymerase chain reaction (RT-PCR) swab; and an HRCT or CXR to confirm the presence of pneumonia between the 27 February 2020 and the 30 May 2020, whose positive RT-PCR swab was dated within 12 days of the CT exam. These identifed an initial cohort of 2805 patients. After excluding patients with steroids and biological agents’ therapies ongoing at diagnosis/baseline, we enrolled a final cohort of 2553 patients. Data collection met the rules of the European General Data Protection Regulation (GDPR) for chest imaging data and data analysis.
We excluded 205 patients during our work due to issues in extracting the radiomics features from the associated segmented volumes. The final dataset encompassed the clinical and radiomic information for 2348 patients. The inclusion criteria applied to the initial cohort are reported in Figure 1.
Table 1 shows clinical variables (such as gender and age) and outcome (death) for our cohort of 2348 patients. Patient deaths were clinically attributed to COVID-19 disease [50]. It is worth noting that our dataset presents a significant imbalance regarding the investigated outcome (death by COVID-19): 287 (12%) deceased patients and 2061 (88%) survived patients. This disparity will be considered during our model training [51].

2.2. Clinical Features Collection

Clinical data, including age, sex, comorbidities (such as chronic obstructive pulmonary disease (COPD), vascular diseases, heart failure, etc.), and C-reactive protein (CRP) level at the time of hospital admission, were extracted from institutional informative systems and patient clinical charts. Radiological data, including the presence of ground glass opacities (GGO), consolidations, and parenchyma involvement (PI) score (<60% or >60%), were extracted from structured reports of the hospital admission CT scan. We removed all clinical features with more than 20% missing values. We replaced the other missing values with the mean or mode of the corresponding feature distribution, depending on whether the variables were continuous or categorical [52]. Eventually, the clinical dataset was composed of the 19 clinical features presented in Table 2.

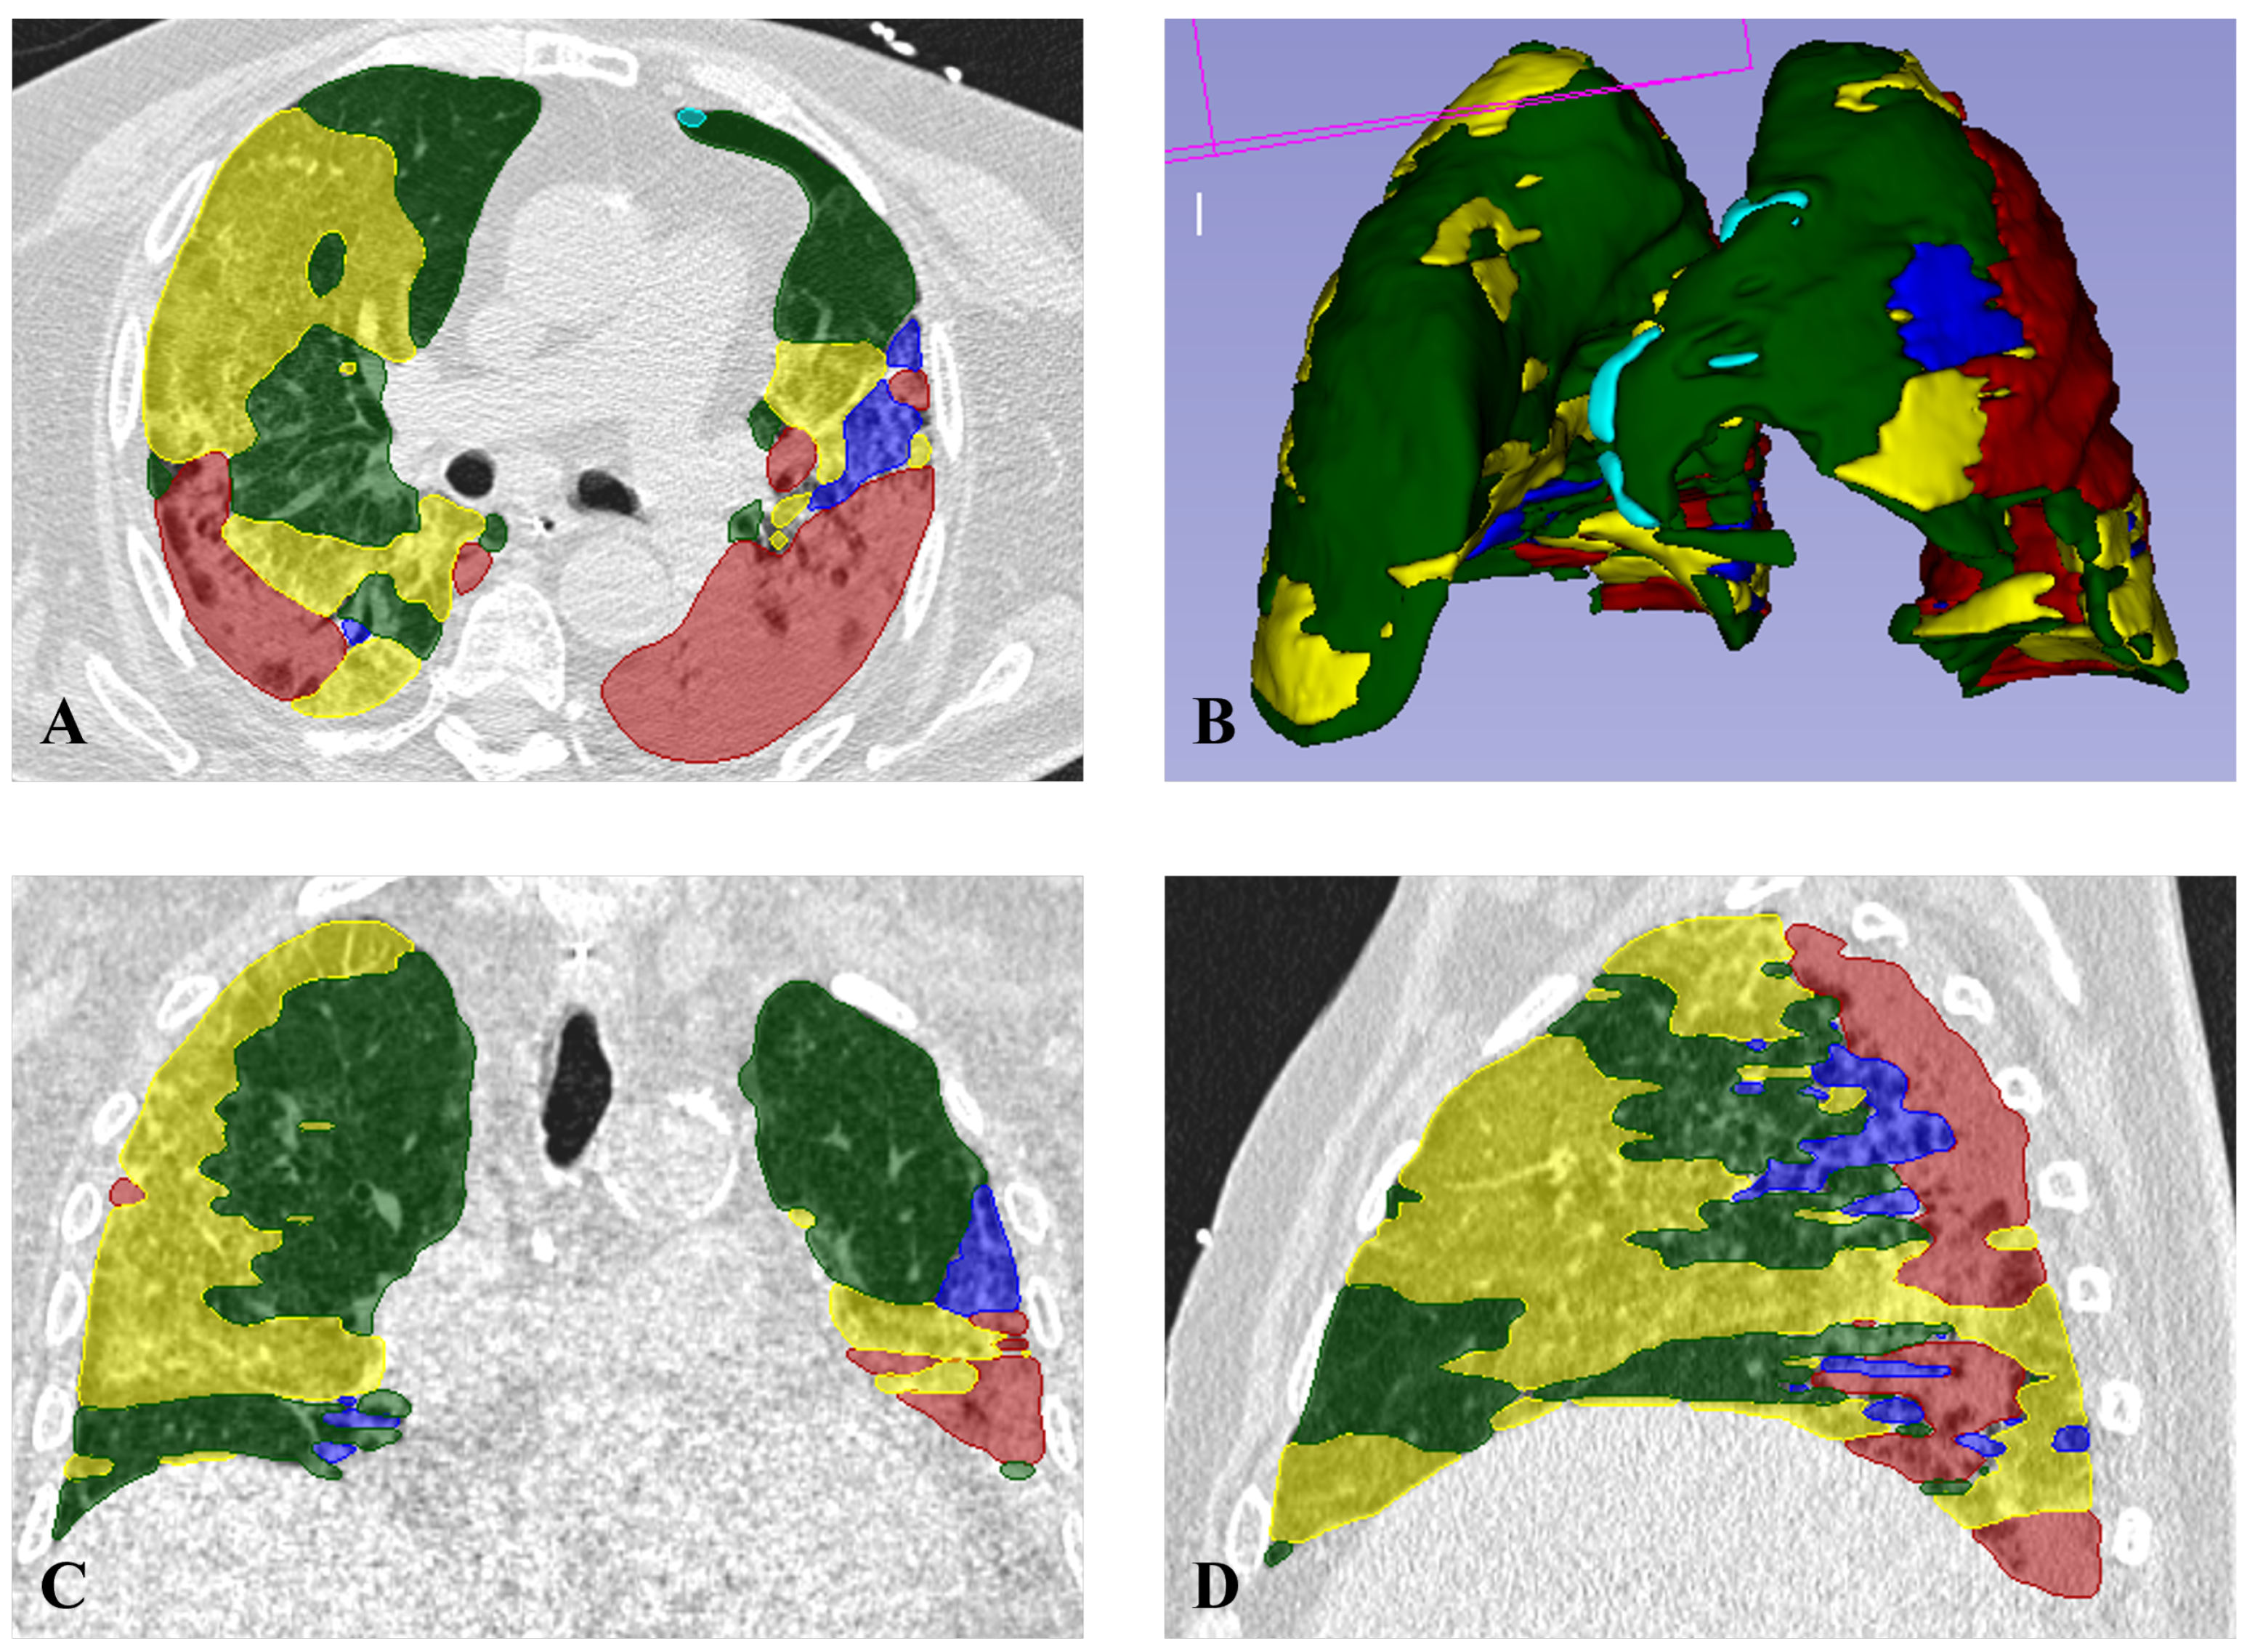
2.3. Radiomic Features Collection

Eight different scanners were employed to acquire the HRCT images, following a breath-hold acquisition protocol: BrightSpeed, Discovery MI, LightSpeed Pro 32 (GE Medical Systems, Chicago, IL, USA), Brilliance 64, iCT 128, Ingenuity CT (Koninklijke Philips N.V., Eindhoven, the Netherlands), Emotion 16, and SOMATON Definition Edge (Siemens, Munich, Germany). All devices are periodically tested through standard quality assurance programs according to national and international guidelines [53,54].
We segmented each HRCT image using Coreline Soft (Seoul, Republic of Korea) software, AVIEW (https://www.corelinesoft.com/en/lung-texture/ [55]). AVIEW lung cancer screening (LCS) is a medical imaging DL-based software that provides automated lung nodule detection, segmentation, and analysis from low-dose CT chest images. It segments different damaged lung parenchymal volumes with a thresholding technique, as previously reported [56]. Figure 2 shows two examples of AVIEW outputs from our cohort.
AVIEW software can discriminate healthy parenchyma from 5 types of lung abnormalities: ground glass opacities (GGOs), consolidations, reticular patterns, honeycombing, and emphysema [57,58]. Among those, consolidations, reticular patterns, and GGOs are clinically used to indicate COVID-19 lung pneumonia.
GGOs are hazy areas with slightly increased lung density without obscuration of bronchial and vascular structures [59]. They may be caused by partial air space-filling or interstitial thickening. GGOs are frequently accompanied by other features or patterns, including reticular and/or interlobular septal thickening and consolidation. Consolidation refers to alveolar air being replaced by pathological fluids, cells, or tissues, manifesting as an increase in pulmonary parenchymal density that obscures underlying vessels and airway walls [59]. Recent studies highlighted that GGO could progress to consolidations so that consolidations can be considered as an indication of disease progression. Reticular pattern refers to thickened pulmonary interstitial structures, such as interlobular septa and perilobular lines, manifesting as linear opacities on CT images [59].
The software generates all masks using the NIFTI (Neuroimaging Informatics Technology Initiative) format. We extracted a large number of widely-used radiomic features through the freeware pyRadiomics (available at: https://pyradiomics.readthedocs.io/, accessed on 5 September 2023): first-order statistics (18), shape-based (14), gray-level co-occurrence matrix (GLCM, 24), gray-level run length matrix (GLRLM, 16), gray-level size zone matrix (GLSZM, 16), and gray-level dependence matrix (GLDM, 14), using Pyradiomics package version 3.0.1 (Python v. 3.7.9). Through our homemade software, we also manually set both the pre-processing parameters and ten different kernels (Log 1.0, Log 3.0, and eight wavelets) for image filtering. From the original and filtered image data, we obtained a total of 5892 radiomic features for each HRCT.

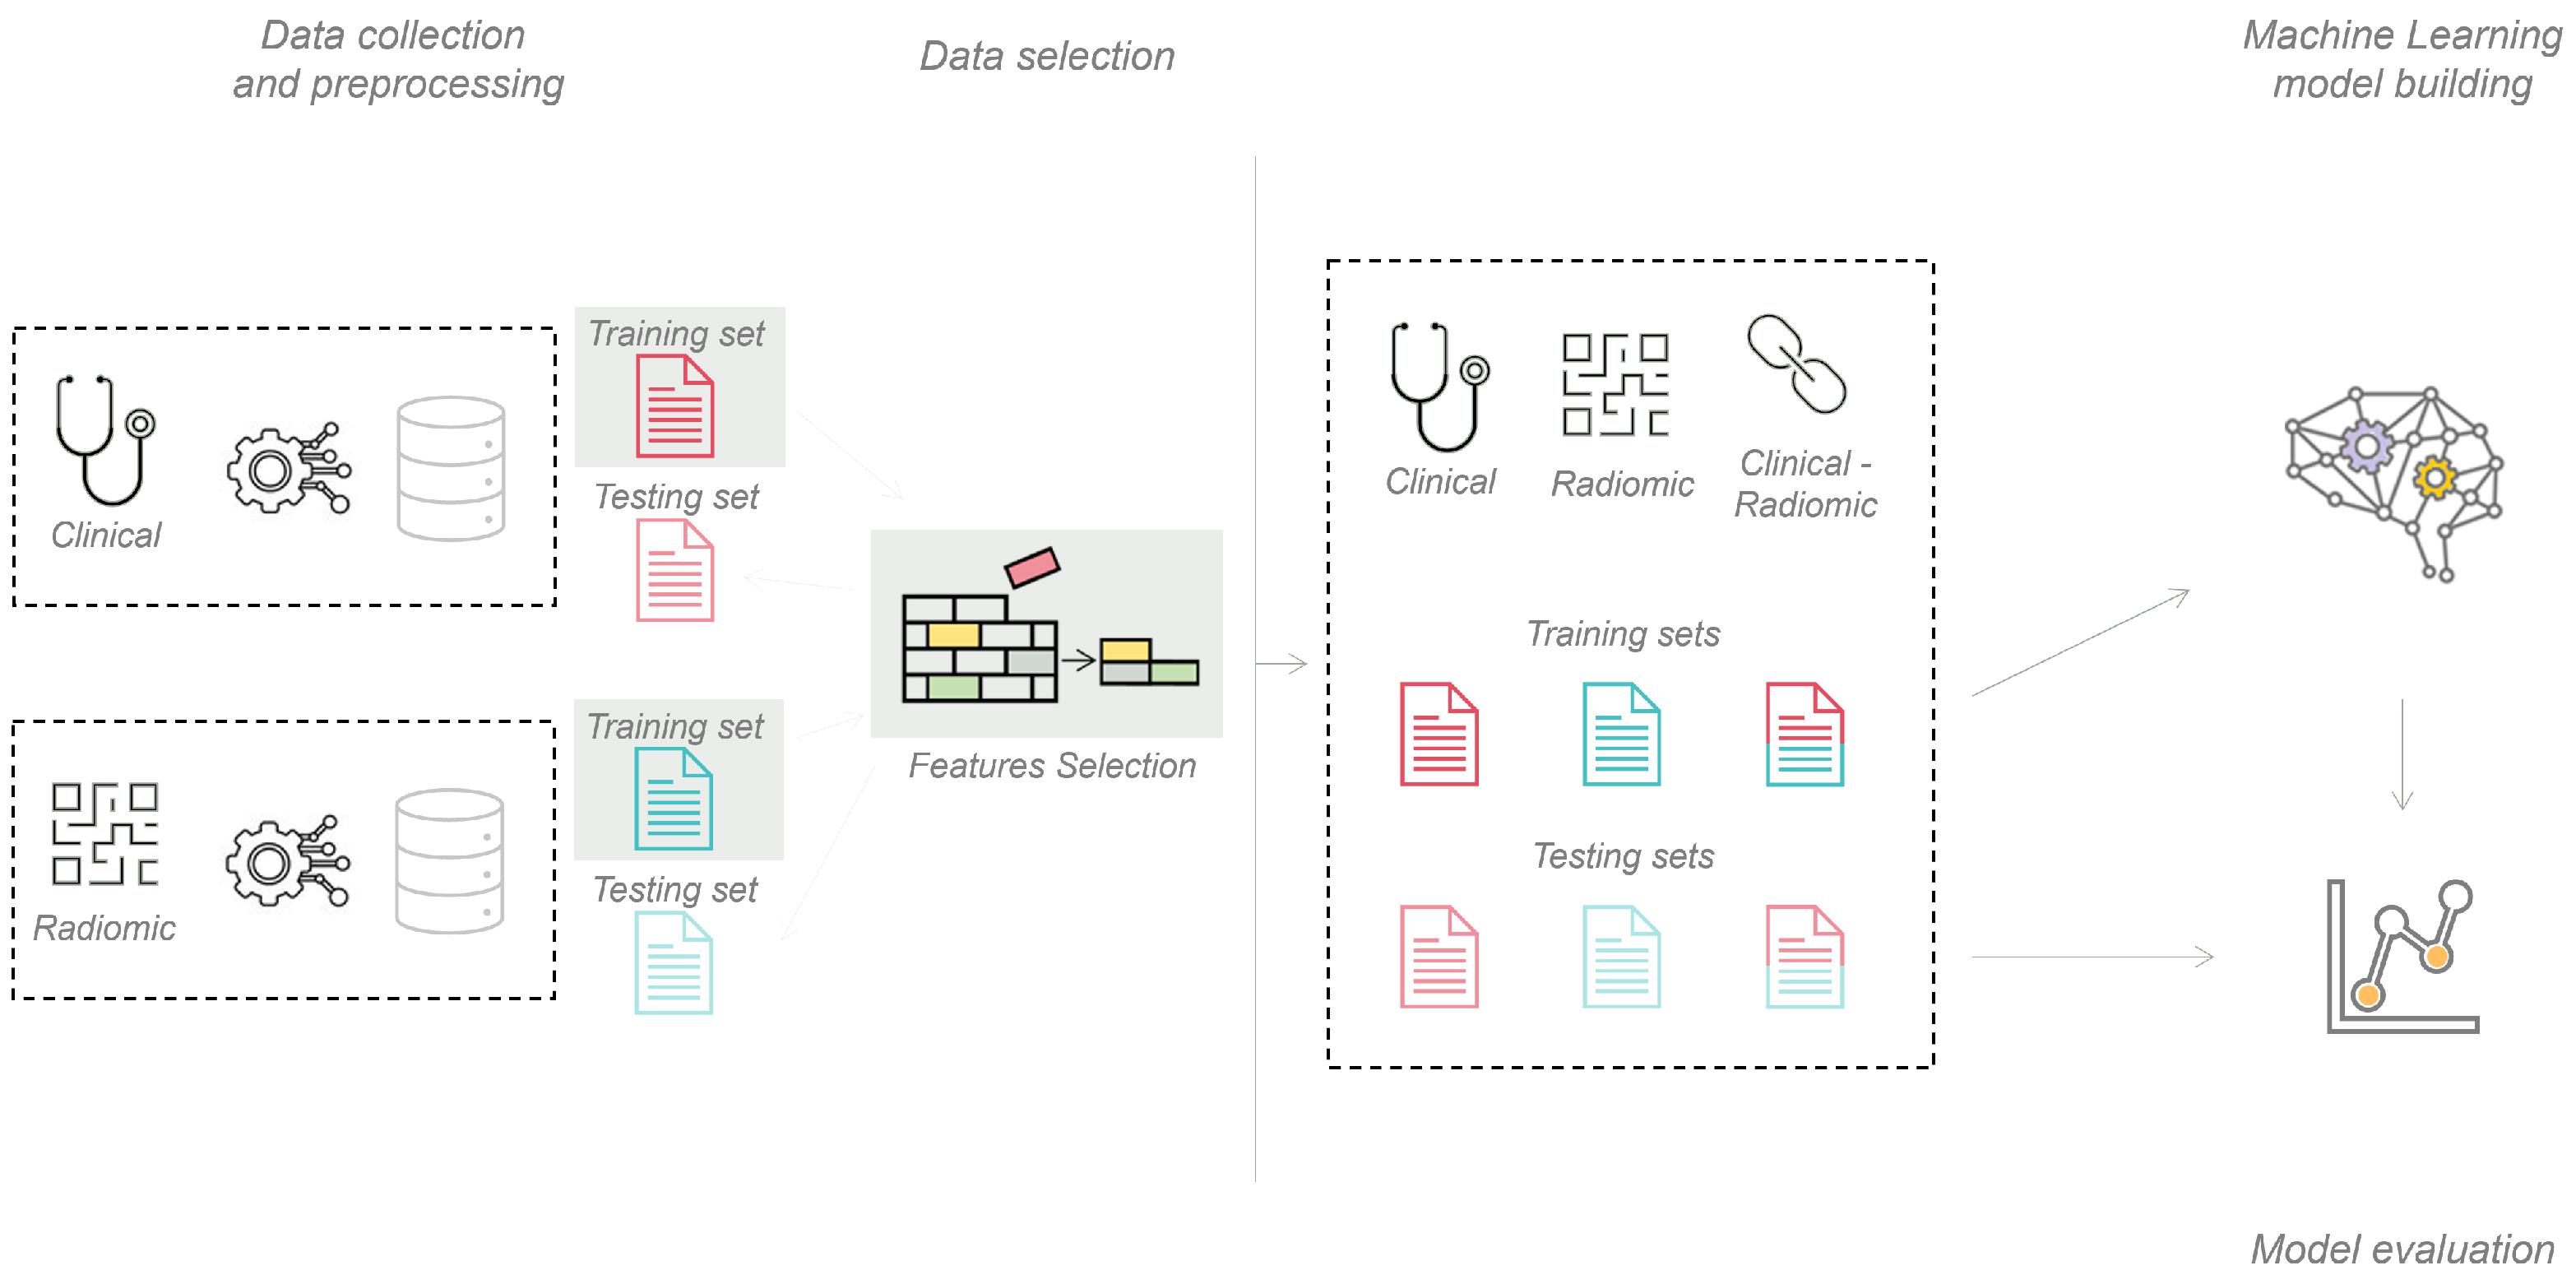
2.4. Machine Learning Pipeline

In the first step, we kept clinical and radiomic data split into two different datasets, as shown in Figure 3. Then, in each dataset separately, we standardized each feature, subtracting the mean and dividing it by the standard deviation of the corresponding feature distribution. We excluded features with a Spearman correlation coefficient >0.98 from our subsequent analyses. Finally, we split our data into two subsets, one for classifier training (70%, n = 1643) and the other for classifier validation (30%, n = 705). Thus, we performed feature selection for the COVID-19 mortality prediction outcome to the training datasets (10-fold cross-validation least absolute shrinkage and selection operator (LASSO)). We generated a new dataset from the remaining features containing clinical and radiomic selected features. Thus, for our training, we used these three different datasets. In this work, we chose the support vector machine (SVM) algorithm due to the class imbalance of our data. We trained our SVM model with two subsequent stratified 10-fold cross-validations to fine-tune its hyperparameters, which were then employed in the final training phase. Table 3 shows the set of hyperparameters chosen for the training. In this work, we will call the model trained with radiomic data only the Radiomic Model, the one trained with clinical data only the Clinical Model, and the one trained with the combination of both features the Clinical–Radiomic Model. We evaluated our model performances on the testing sets (holdout).
The SVM training session lasted 2260 s, while the testing required less than 1 s.
Table 4 shows the results in terms of four metrics: area under the curve (AUC, which is a measure of the performance of a classification model in all classification thresholds [60]), accuracy (ACC, (1)), sensitivity (SENS, (2)), and specificity (SPEC, (3)).
All metrics were computed using sklearn.metrics library (available at: https://scikit-learn.org/stable/modules/model_evaluation.html, accessed on 5 September 2023).
A C C = T P + T N T P + T N + F P + F N
S E N S = T P T P + F P
S P E C = T N T N + F P

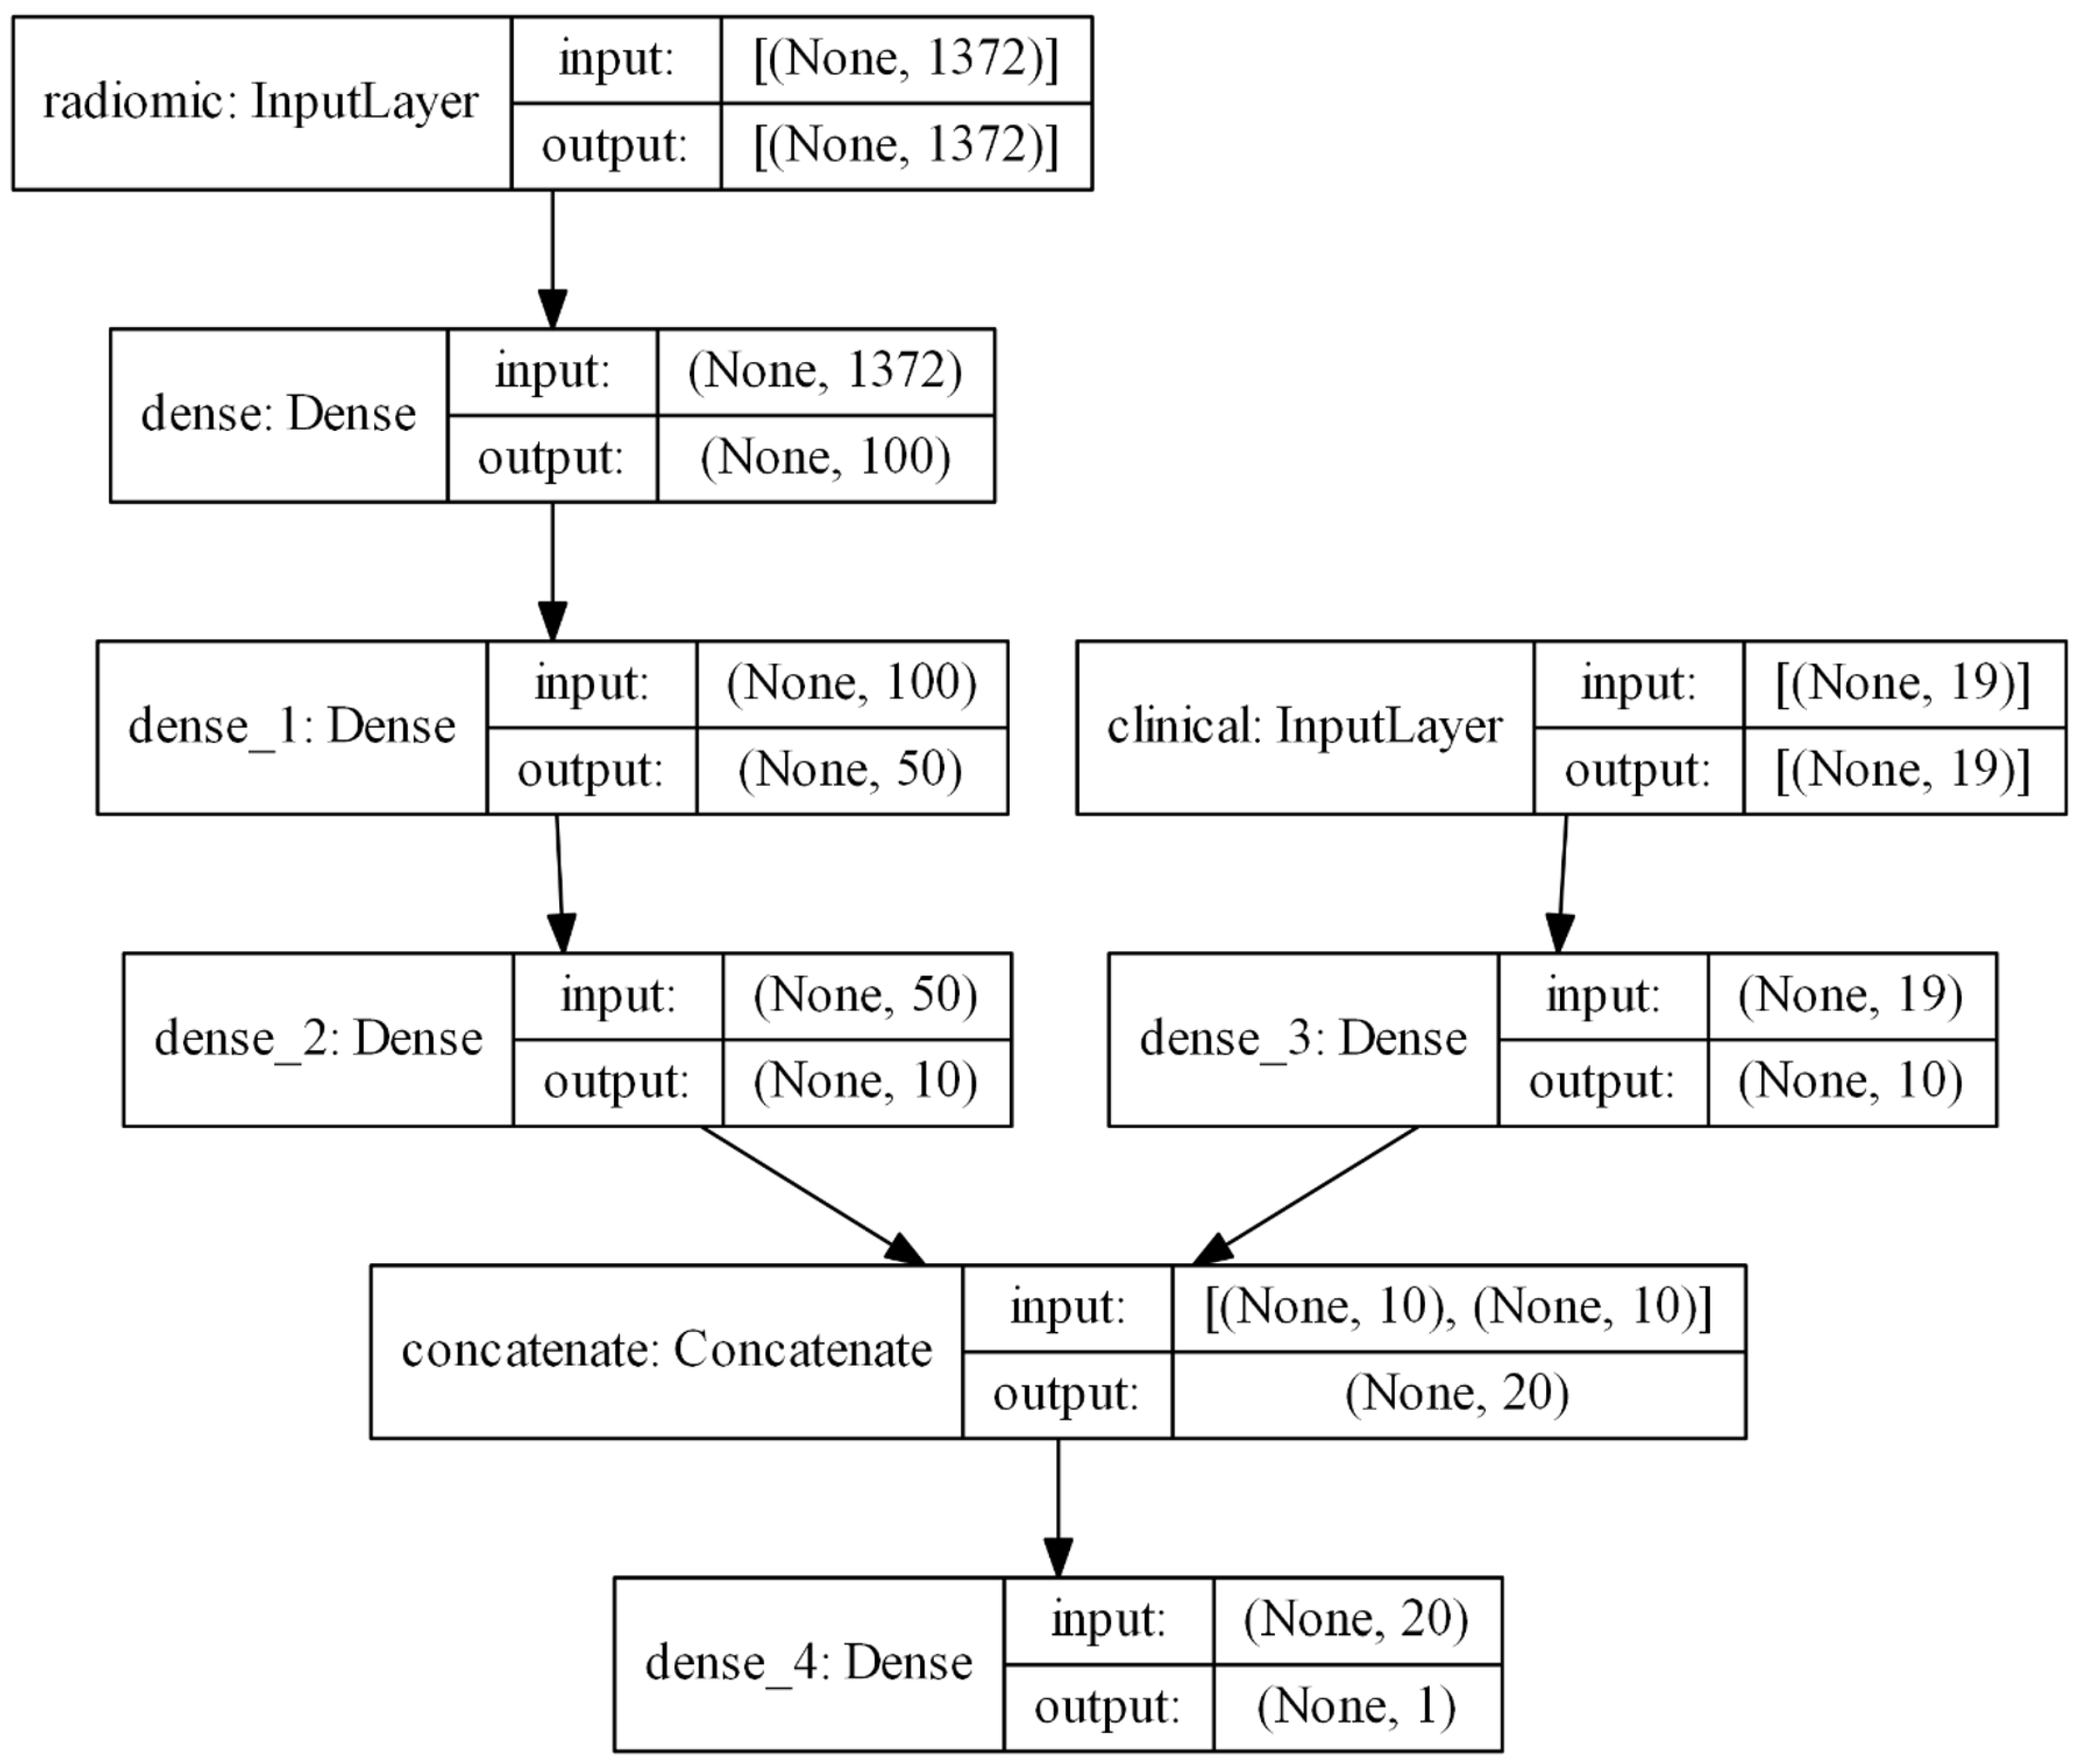
2.5. Deep Learning Pipeline

We developed a feedforward neural network (FNN) model to compare its performance with our machine learning model. The architecture is synthesized in Figure 4.
We used a grid-search strategy to identify the best model configuration and hyper-parameters. We chose the optimal model as the one that maximized the result of a five-fold cross-validation, with the ROC AUC as the metric function. The grid search was performed on the training data only. The hyperparameters included in the grid search were: number of layers, number of neurons per layer, dropout probability, number of epochs, learning rate, and batch size. Figure 4 shows the number of layers and neurons. The best dropout probability found was 0, so no dropout was used; the optimal number of epochs was 15, the learning rate was 10 3 , and the best batch size found was 32. The total number of parameters of the network is 143,080.
To account for class imbalance, the model loss was weighted to make the model pay more attention to the minority class. The final network had two branches: one to process the radiomic features (radiomic branch) and the other to process the clinical features (clinical branch). The radiomic branch was made of three consecutive fully connected layers with 100, 50, and 10 neurons each; the clinical branch had only a fully connected layer with ten neurons because the clinical features were significantly fewer than the radiomic ones. The final layers of the two branches were then concatenated and connected to the output layer of the network, which identified the patient’s probability of belonging to one of the two classes. Given the independent nature of the two branches, building two separate versions of the original network was also possible: one with the radiomic branch only and the other with the clinical branch only. These were built to evaluate the impact of the different feature sets on the final performance of the network and to compare this to the machine learning results.
In this work, we will call the Clinical–Radiomic Model the one with the two branches, the Radiomic Model the one with the radiomic branch only, and the Clinical Model the one with the clinical branch only.
The network was trained on 70% of the data and tested on the remaining 30%. No feature selection was performed on the data used to train and test the network, i.e., all of the available features were employed. All of the features were standardized using the mean and standard deviation values calculated on the training set.
FNN training session needed about 1 s per epoch; then, it took less than 1 s to test the trained model.
The results are collected in Table 4 in terms of the aforementioned metrics: area under the curve (AUC) score, accuracy (ACC), sensitivity (SENS), and specificity (SPEC).

3. Results

To validate our obtained models, we tested their predictions on a set of data not used during the training session (test set). Table 4 shows the metrics for the test set using only the clinical features, only the radiomic features, or a combination of both.
Four different metrics are presented: area under the curve (AUC), accuracy (ACC, (1)), sensitivity (SENS, (2)), and specificity (SPEC, (3)). The highest obtained score for each metric and model is highlighted in bold.

4. Discussion

Prediction models in a clinical setting aim to support the physician in decision-making regarding personalized patient care pathways. This framework could help establish the stage of the ongoing disease in a screening scenario (diagnosis prediction) or to highlight patients with a worse prognosis to choose a more intense therapy (prognosis prediction) promptly. However, especially in the latter case, their introduction into clinical routine is still delayed by the models’ reliability and accuracy when predicting new cases. Nonetheless, an automated tool is still a fundamental asset to standardize and reduce the intrinsic intra-observer variability that characterizes these processes. Deep learning and machine learning techniques are increasingly leading in predicting the outcome of COVID-19 patients [10]. In fact, recent studies reported good results for predictive models used in COVID diagnosis and the prediction of severity, prognosis, length of hospital stay, intensive care unit admission, or mechanical ventilation modes [3,10,25,27,28,29,30,31,32,33,34,35,36,37,38,39,40,46].
Our results, collected in Table 4, align with the recent literature, showing that our models can achieve good prediction accuracy. The machine learning and deep learning algorithms performed similarly, with the latter slightly outperforming the former. We can explain this result with both our parametrization strategy for our outcome (binary) and the size of our training cohort: the number of patients and the low complexity of the task (2 classes) advantaged the machine learning model. On the other hand, the deep learning model, which is usually employed for more complex tasks (multi-class or segmentation tasks) with a bigger training cohort, still performed acceptably given the task, but it could not surpass the other model. Furthermore, our DL algorithm took as input the same features as the ML one; they are usually able to manage the whole image data (i.e., pixel values), which could also be the reason why the models’ performances were similar. This interesting result can be interpreted as a potential new perspective for our future studies as we can explore how the DL algorithm can perform in more complex tasks and with different inputs. The Clinical–Radiomic Model reached higher AUCs than the other two, both for the ML and DL algorithms, confirming that combining radiomic information with clinical data can improve the model prediction. The Clinical–Radiomic Model obtained the highest AUC score in both and a significantly higher SENS score. The ACC score is similar for all three models, with the Radiomic and the Clinical Models achieved a slightly higher result than the Clinical–Radiomic Model; however, the accuracy metric is less significant than the other metric with data imbalance.
Palmisano et al. [26] retrospectively enrolled 1125 COVID-19 adults to develop a user-friendly AI platform for automatic risk stratification of COVID-19 patients. Their results are based on clinical data and CT automatic analysis and are expressed as performances in predicting patient outcomes. Their best model showed an AUC of 0.842, which is slightly lower than the one reached by our deep learning algorithm in the Clinical–Radiomic model but still consistent with our results. Our results are expected given the present literature [10,20,25,27,28,29,30,31,32,33,35,36,37,46,61,62,63,64,65,66,67,68,69,70,71,72,73,74]. Table 5 collects the performance of the most recent works regarding ML and DL methods for COVID-19 mortality prediction. As can be seen, our results are in line with those presented, considering that our method relies on external validation. Moreover, compared with most of these studies, our study had a larger cohort for training the models.
Regarding ML models, the future perspective is to validate these data on new patients and gradually introduce prediction tools in the clinical practice to support the physician’s decision.
As previously stated, another future direction of this work could be to explore further the potential of the DL algorithm, which proved to work efficiently with previously extracted features. The next step could be to perform a more complex task (i.e., survival) or provide the image data directly to the network without pre-computing features. This course of action could provide several advantages, for example, avoiding the pitfalls usually typical in models dealing with radiomic features extracted from images rather than the original pixel values, such as repeatability and reproducibility issues.

5. Conclusions

In this study, we proposed a technique providing a user-friendly and low-cost tool for COVID-19 mortality prediction. We presented a comparison between a machine Learning and a deep learning framework that can be used not only for COVID-19 mortality prediction but also for other classification tasks such as diabetic prediction, asthma prediction, and cancer metastases prediction. Moreover, even if the COVID-19 outbreak seems to be under control and the importance of the CT images in the diagnosis step decreased, imaging-based models could still be relevant, for example, in serious cases where CT imaging could remain a viable solution. We obtained similar performances for both ML and DL algorithms, which means that our algorithms have the potential to be included in a clinical practice framework. According to our results, clinical and radiomic information are found to be predictors of COVID-19 mortality. The best performance was obtained with a combination of clinical and radiomic data, both for ML and DL, with AUCs equal to 0.803 and 0.864, respectively.
Future works should further explore the potential of DL algorithms, for example, directly using image pixel data and gathering data from other centers to validate our results on external data.

Author Contributions

All authors contributed to this study’s conception and design. Material preparation, data collection, and analysis were performed by L.V., V.T., A.B., M.B. and G.C. (Gianluca Carlini). The first draft of the manuscript was written by L.V., V.T. and G.C. (Gianluca Carlini). All authors commented on previous versions of the manuscript. All authors have read and agreed to the published version of the manuscript.

Funding

This research was funded by the Italian Ministry of Health. The present study takes part in a major multi-center project, named “Endothelial, neutrophil, and complement perturbation linked to acute and chronic damage in COVID-19 pneumonitis coupled with machine learning approach”, whose code was COVID-2020-12371808. Azienda USL-IRCCS di Reggio Emilia was the project promoter.

Institutional Review Board Statement

This study was conducted in accordance with the Declaration of Helsinki and approved by the Institutional Ethics Committee of Area Vasta Emilia Nord (Registry n. 855/2020/OSS/AUSLRE, approved on the 28 July 2020).

Informed Consent Statement

Given the retrospective nature of the data collection, the Ethics Committee authorized the use of a patient’s data without his/her informed consent if all reasonable efforts have been made to contact that patient to obtain it. Written informed consent has been obtained from patients to publish this paper. Dead patients’ consent was obtained from the Personal Data Protection Authority, the Italian authority for personal data treatment carried out for scientific research purposes due to organizational impossibility reasons (deceased or non-contactable subjects). The authors affirm that human research participants provided informed consent for the publication of the images in Figure 2.

Data Availability Statement

The data presented in this study are available on request from the corresponding author.

Acknowledgments

The authors are grateful to all the units of Azienda Unità Sanitaria Locale-IRCCS di Reggio Emilia that provided support and the data collection. They would also like to extend their gratitude to Carlo Di Castelnuovo, Greta Meglioli, and Davide Giosuè Lippolis for their valuable contributions to this work.

Conflicts of Interest

The authors declare no conflict of interest.

References

  1. Zhu, N.; Zhang, D.; Wang, W.; Li, X.; Yang, B.; Song, J.; Zhao, X.; Huang, B.; Shi, W.; Lu, R.; et al. A Novel Coronavirus from Patients with Pneumonia in China. N. Engl. J. Med. 2019, 382, 727–733. [Google Scholar] [CrossRef] [PubMed]
  2. Wang, C.; Wang, Z.; Wang, G.; Lau, J.Y.N.; Zhang, K.; Li, W. COVID-19 in early 2021: Current status and looking forward. Signal Transduct. Target Ther. 2021, 6, 114. [Google Scholar] [CrossRef]
  3. Chen, H.; Mao, L.; Chen, Y.; Yuan, L.; Wang, F.; Li, X.; Cai, Q.; Qiu, J.; Chen, F. Machine learning-based CT radiomics model distinguishes COVID-19 from non-COVID-19 pneumonia. BMC Infect. Dis. 2021, 21, 931. [Google Scholar] [CrossRef] [PubMed]
  4. Timmeren, J.V.; Cester, D.; Tanadini-Lang, S.; Alkadhi, H.; Baessler, B. Radiomics in medical imaging—“how-to” guide and critical reflection. Insights Imaging 2020, 11, 91. [Google Scholar] [CrossRef]
  5. Liu, X.; Li, Y.; Qian, Z.; Sun, Z.; Xu, K.; Wang, K.; Liu, S.; Fan, X.; Li, X.; Fan, X.; et al. A radiomic signature as a non-invasive predictor of progression-free survival in patients with lower-grade gliomas. Neuroimage Clin. 2018, 20, 1070–1077. [Google Scholar] [CrossRef] [PubMed]
  6. Forghani, R.; Savadjiev, P.; Chatterjee, A.; Muthukrishnan, N.; Reinhold, C.; Forghani, B. Radiomics and Artificial Intelligence for Biomarker and Prediction Model Development in Oncology. Comput. Struct. Biotechnol. J. 2019, 17, 995–1008. [Google Scholar] [CrossRef] [PubMed]
  7. Bera, K.; Braman, N.; Gupta, A.; Velcheti, V.; Madabhushi, A. Predicting cancer outcomes with radiomics and artificial intelligence in radiology. Nat. Rev. Clin. Oncol. 2021, 19, 132–146. [Google Scholar] [CrossRef]
  8. Ahmed, S.; Yap, M.H.; Tan, M.; Hasan, M.K. ReCoNet: Multi-level Preprocessing of Chest X-rays for COVID-19 Detection Using Convolutional Neural Networks. medrxiv, 2020; Preprint. [Google Scholar] [CrossRef]
  9. Bertolini, M.; Trojani, V.; Botti, A.; Cucurachi, N.; Galaverni, M.; Cozzi, S.; Borghetti, P.; La Mattina, S.; Pastorello, E.; Avanzo, M.; et al. Novel Harmonization Method for Multi-Centric Radiomic Studies in Non-Small Cell Lung Cancer. Curr. Oncol. 2022, 29, 5179–5194. [Google Scholar] [CrossRef]
  10. Bottino, F.; Tagliente, E.; Pasquini, L.; Napoli, A.D.; Lucignani, M.; Figà-Talamanca, L.; Napolitano, A. COVID Mortality Prediction with Machine Learning Methods: A Systematic Review and Critical Appraisal. J. Pers. Med. 2021, 11, 893. [Google Scholar] [CrossRef]
  11. Li, M.; Zhang, W.; Hu, B.; Kang, J.; Wang, Y.; Lu, S. Automatic Assessment of Depression and Anxiety through Encoding Pupil-Wave from HCI in VR Scenes. ACM Trans. Multimedia Comput. Commun. Appl. 2022. [Google Scholar] [CrossRef]
  12. Chen, H.; Wang, T.; Chen, T.; Deng, W. Hyperspectral Image Classification Based on Fusing S3-PCA, 2D-SSA and Random Patch Network. Remote. Sens. 2023, 15, 3402. [Google Scholar] [CrossRef]
  13. Yu, Y.; Tang, K.; Liu, Y. A Fine-Tuning Based Approach for Daily Activity Recognition between Smart Homes. Appl. Sci. 2023, 13, 5706. [Google Scholar] [CrossRef]
  14. Zuccaro, V.; Celsa, C.; Sambo, M.; Battaglia, S.; Sacchi, P.; Biscarini, S.; Valsecchi, P.; Pieri, T.C.; Gallazzi, I.; Colaneri, M.; et al. Competing-risk analysis of coronavirus disease 2019 in-hospital mortality in a Northern Italian centre from SMAtteo COvid19 REgistry (SMACORE). Sci. Rep. 2021, 11, 1137. [Google Scholar] [CrossRef] [PubMed]
  15. Garcia-Gutiérrez, S.; Esteban-Aizpiri, C.; Lafuente, I.; Barrio, I.; Quiros, R.; Quintana, J.M.; Uranga, A. Machine learning-based model for prediction of clinical deterioration in hospitalized patients by COVID 19. Sci. Rep. 2022, 12, 7097. [Google Scholar] [CrossRef]
  16. Soda, P.; Natascha, C.D.; Tessadori, J.; Giovanni, V.; Valerio, G.; Chandra, B.; Muhammad, U.A.; Rosa, S.; Ermanno, C.; Deborah, F.; et al. AIforCOVID: Predicting the clinical outcomes in patients with COVID-19 applying AI to chest-X-rays. An Italian multicentre study. Med. Image Anal. 2021, 74, 102216. [Google Scholar] [CrossRef]
  17. Bae, J.; Kapse, S.; Singh, G.; Gattu, R.; Ali, S.; Shah, N.; Marshal, C.; Pierce, J.; Phatak, T.; Gupta, A.; et al. Predicting Mechanical Ventilation and Mortality in COVID-19 Using Radiomics and Deep Learning on Chest Radiographs: A Multi-Institutional Study. Diagnostics 2021, 11, 1812. [Google Scholar] [CrossRef]
  18. Jiao, Z.; Choi, J.W.; Halsey, K.; Tran, T.M.L.; Hsieh, B.; Wang, D.; Eweje, F.; Wang, R.; Chang, K.; Wu, J.; et al. Prognostication of patients with COVID-19 using artificial intelligence based on chest x-rays and clinical data: A retrospective study. Lancet Digit. Health 2021, 3, e286–e294. [Google Scholar] [CrossRef]
  19. Varghese, B.; Shin, H.; Desai, B.; Gholamrezanezhad, A.; Lei, X.; Perkins, M.; Oberai, A.; Nanda, N.; Cen, S.; Duddalwar, V. Predicting clinical outcomes in COVID-19 using radiomics on chest radiographs. Br. J. Radiol. 2021, 94, 20210221. [Google Scholar] [CrossRef]
  20. An, C.; Lim, H.; Kim, D.; Chang, J.H.; Choi, Y.J.; Kim, S.W. Machine learning prediction for mortality of patients diagnosed with COVID-19: A nationwide Korean cohort study. Sci. Rep. 2020, 10, 18716. [Google Scholar] [CrossRef]
  21. De Souza, F.S.H.; Hojo-Souza, N.S.; Dos Santos, E.B.; Da Silva, C.M.; Guidoni, D.L. Predicting the Disease Outcome in COVID-19 Positive Patients Through Machine Learning: A Retrospective Cohort Study With Brazilian Data. Front. Artif. Intell. 2021, 4, 2624–8212. [Google Scholar] [CrossRef]
  22. Shiri, I.; Salimi, Y.; Pakbin, M.; Hajianfar, G.; Avval, A.H.; Sanaat, A.; Mo-stafaei, S.; Akhavanallaf, A.; Saberi, A.; Mansouri, Z.; et al. COVID-19 Prognostic Modeling Using CT Radiomic Features and Machine Learning Algorithms: Analysis of a MultiInstitutional Dataset of 14,339 Patients. Phys. A 2021, 145, 105467. [Google Scholar]
  23. Shiri, I.; Sorouri, M.; Geramifar, P.; Nazari, M.; Abdollahi, M.; Salimi, Y.; Khosravi, B.; Askari, D.; Aghaghazvini, L.; Hajianfar, G.; et al. Machine learning-based prognostic modeling using clinical data and quantitative radiomic features from chest CT images in COVID-19 patients. Comput. Biol. Med. 2021, 132, 104304. [Google Scholar] [PubMed]
  24. Tamal, M.; Alshammari, M.; Alabdullah, M.; Hourani, R.; Alola, H.; Hegazi, T. An integrated framework with machine learning and radiomics for accurate and rapid early diagnosis of COVID-19 from Chest X-ray. Expert Syst. Appl. 2021, 180, 115152. [Google Scholar] [PubMed]
  25. Iori, M.; Castelnuovo, C.D.; Verzellesi, L.; Meglioli, G.; Lippolis, D.; Nitrosi, A.; Monelli, F.; Besutti, G.; Trojani, V.; Bertolini, M.; et al. Mortality Prediction of COVID-19 Patients Using Radiomic and Neural Network Features Extracted from a Wide Chest X-ray Sample Size: A Robust Approach for Different Medical Imbalanced Scenarios. Appl. Sci. 2022, 12, 3903. [Google Scholar] [CrossRef]
  26. Palmisano, A.; Vignale, D.; Boccia, E.; Nonis, A.; Gnasso, C.; Leone, R.; Montagna, M.; Nicoletti, V.; Bianchi, A.G.; Brusamolino, S.; et al. AI-SCoRE (artificial intelligence-SARS CoV2 risk evaluation): A fast, objective and fully automated platform to predict the outcome in COVID-19 patients. Radiol. Med. 2022, 127, 960–972. [Google Scholar] [CrossRef] [PubMed]
  27. Wang, R.; Jiao, Z.; Yang, L.; Choi, J.W.; Xiong, Z.; Halsey, K.; Tran, T.M.L.; Pan, I.; Collins, S.A.; Feng, X.; et al. Artificial intelligence for prediction of COVID-19 progression using CT imaging and clinical data. Eur. Radiol. 2022, 32, 205–212. [Google Scholar] [CrossRef]
  28. Liang, W.; Liang, H.; Ou, L.; Chen, B.; Chen, A.; Li, C.; Li, Y.; Guan, W.; Sang, L.; Lu, J.; et al. Development and Validation of a Clinical Risk Score to Predict the Occurrence of Critical Illness in Hospitalized Patients With COVID-19. JAMA Intern. Med. 2020, 180, 1081–1089. [Google Scholar] [CrossRef]
  29. Banoei, M.; Dinparastisaleh, R.; Zadeh, A.; Mirsaeidi, M. Machine-learning-based COVID-19 mortality prediction model and identification of patients at low and high risk of dying. Crit. Care 2021, 25, 1–14. [Google Scholar] [CrossRef]
  30. Alballa, N.; Al-Turaiki, I. Machine learning approaches in COVID-19 diagnosis, mortality, and severity risk prediction: A review. Inform. Med. Unlocked 2021, 24, 100564. [Google Scholar] [CrossRef]
  31. Karthikeyan, A.; Garg, A.; Vinod, P.K.; Priyakumar, U.D. Machine Learning Based Clinical Decision Support System for Early COVID-19 Mortality Prediction. Digit. Public Heal. Front. Public Health 2021, 9, 626697. [Google Scholar] [CrossRef]
  32. Kuno, T.; Sahashi, Y.; Kawahito, S.; Takahashi, M.; Iwagami, M.; Egorova, N.N. Prediction of in-hospital mortality with machine learning for COVID-19 patients treated with steroid and remdesivir. J. Med. Virol. 2022, 94, 958–964. [Google Scholar] [CrossRef] [PubMed]
  33. Subudhi, S.; Verma, A.; Patel, A.; Hardin, C.C.; Khandekar, M.J.; Lee, H.; McEvoy, D.; Stylianop-oulos, T.; Munn, L.L.; Dutta, S.; et al. Comparing machine learning algorithms for predicting ICU admission and mortality in COVID-19. NPJ Digit. Med 2021, 4, 87. [Google Scholar] [CrossRef] [PubMed]
  34. Chadaga, K.; Prabhu, S.; Umakanth, S.; Vivekananda, B.K.; Niranjana, S.; Rajagopala, C.P.; Krishna, P.K. COVID-19 Mortality Prediction among Patients Using Epidemiological Parameters: An Ensemble Machine Learning Approach. Eng. Sci. 2021, 16, 221–233. [Google Scholar] [CrossRef]
  35. Purkayastha, S.; Xiao, Y.; Jiao, Z.; Thepumnoeysuk, R.; Halsey, K.; Wu, J.; Tran, T.; Hsieh, B.; Choi, J.; Wang, D.; et al. Machine Learning-Based Prediction of COVID-19 Severity and Progression to Critical Illness Using CT Imaging and Clinical Data. Korean J. Radiol. 2021, 22, 1213–1224. [Google Scholar] [CrossRef]
  36. Fusco, R.; Grassi, R.; Granata, V.; Setola, S.V.; Grassi, F.; Cozzi, D.; Pecori, B.; Izzo, F.; Petrillo, A. Artificial Intelligence and COVID-19 Using Chest CT Scan and Chest X-ray Images: Machine Learning and Deep Learning Approaches for Diagnosis and Treatment. J. Pers. Med. 2021, 11, 993. [Google Scholar] [CrossRef]
  37. Li, L.; Qin, L.; Xu, Z.; Yin, Y.; Wang, X.; Kong, B.; Bai, J.; Lu, Y.; Fang, Z.; Song, Q.; et al. Using Artificial Intelligence to Detect COVID-19 and Community-acquired Pneumonia Based on Pulmonary CT: Evaluation of the Diagnostic Accuracy. Radiology 2020, 296, E65–E71. [Google Scholar] [CrossRef]
  38. Xiao, F.; Sun, R.; Sun, W.; Xu, D.; Lan, L.; Li, H.; Liu, H.; Xu, H. Radiomics analysis of chest CT to predict the overall survival for the severe patients of COVID-19 pneumonia. Phys. Med. Biol. 2021, 66, 105008. [Google Scholar] [CrossRef]
  39. Xie, Z.; Sun, H.; Wang, J.; Xu, H.; Li, S.; Zhao, C.; Gao, Y.; Wang, X.; Zhao, T.; Duan, S.; et al. A novel CT-based radiomics in the distinction of severity of coronavirus disease 2019 (COVID-19) pneumonia. BMC Infect. Dis. 2021, 21, 608. [Google Scholar] [CrossRef]
  40. Homayounieh, F.; Ebrahimian, S.; Babaei, R.; Mobin, H.K.; Zhang, E.; Bizzo, B.C.; Mohseni, I.; Digumarthy, S.R.; Kalra, M.K. CT Radiomics, Radiologists, and Clinical Information in Predicting Outcome of Patients with COVID-19 Pneumonia. Radiol. Cardiothorac. Imaging 2020, 2, e200322. [Google Scholar] [CrossRef]
  41. Win, K.; Maneerat, N.; Sreng, S.; Hamamoto, K. Ensemble Deep Learning for the Detection of COVID-19 in Unbalanced Chest X-ray Dataset. Appl. Sci. 2021, 11, 10528. [Google Scholar]
  42. Shiri, I.; Arabi, H.; Salimi, Y.; Sanaat, A.H.; Akhavanalaf, A.; Hajianfar, G.; Askari, D.; Moradi, S.; Mansouri, Z.; Pakbin, M.; et al. COLI-NET: Fully Automated COVID-19 Lung and Infection Pneumonia Lesion Detection and Segmentation from Chest CT Images. medRxiv 2021. [Google Scholar] [CrossRef]
  43. Ozturk, T.; Talo, M.; Yildirim, E.A.; Baloglu, U.B.; Yildirim, O.; Rajendra Acharya, U. Automated detection of COVID-19 cases using deep neural networks with Xray images. Comput. Biol. Med. 2020, 121, 103792. [Google Scholar] [CrossRef] [PubMed]
  44. Grassi, R.; Belfiore, M.P.; Montanelli, A.; Patelli, G.; Urraro, F.; Giacobbe, G.; Fusco, R.; Granata, V.; Petrillo, A.; Sacco, P.; et al. COVID-19 pneumonia: Computer-aided quantification of healthy lung parenchyma, emphysema, ground glass and consolidation on chest computed tomography (CT). Radiol. Medica 2020, 126, 3. [Google Scholar] [CrossRef] [PubMed]
  45. Laino, M.E.; Ammirabile, A.; Posa, A.; Cancian, P.; Shalaby, S.; Savevski, V.; Neri, E. The Applications of Artificial Intelligence in Chest Imaging of COVID-19 Patients: A Literature Review. Diagnostics 2021, 11, 1317. [Google Scholar] [CrossRef]
  46. Wang, S.; Kang, B.; Ma, J.; Zeng, X.; Xiao, M.; Guo, J.; Cai, m.; Yang, J.; Li, Y.; Meng, X.; et al. A deep learning algorithm using CT images to screen for Corona virus disease (COVID-19). Eur. Radiol. 2021, 31, 6096–6104. [Google Scholar] [CrossRef] [PubMed]
  47. Shah, R.; Heinicke, D. Using Small Datasets to Build Models. Available online: https://www.datarobot.com/blog/using-small-datasets-to-build-models (accessed on 5 September 2023).
  48. Avanzo, M.; Trianni, A.; Botta, F.; Talamonti, C.; Stasi, M.; Iori, M. Artificial Intelligence and the Medical Physicist: Welcome to the Machine. Appl. Sci. 2021, 11, 1691. [Google Scholar] [CrossRef]
  49. Schork, N.J. Artificial Intelligence and Personalized Medicine. In Precision Medicine in Cancer Therapy; Springer: Cham, Switzerland, 2019; pp. 265–283. [Google Scholar] [CrossRef]
  50. Zerbo, S.; La Mantia, M.; Malta, G.; Albano, G.; Rifiorito, A.; Manco, V.; Falco, V.; Argo, A. Mortality of Hospitalized Patients with SARS-COV-2 Infection in University Tertiary Care of Italy. Euromediterr. Biomed. J. 2023, 18, 84–89. [Google Scholar] [CrossRef]
  51. Sun, Y.; Wong, A.K.C.; Kamel, M.S. Classification of Imabalanced Data: A Review. Int. J. Pattern Recognit. Artif. Intell. 2009, 23, 687–719. [Google Scholar] [CrossRef]
  52. Glas, C. Missing Data. In International Encyclopedia of Education, 3rd ed.; Peterson, P., Baker, E., McGaw, B., Eds.; Elsevier: Oxford, UK, 2010; pp. 283–288. [Google Scholar] [CrossRef]
  53. Donini, B.; Rivetti, S.; Lanconelli, N.; Bertolini, M. Free software for performing physical analysis of systems for digital radiography and mammography. Med. Phys. 2014, 41, 051903. [Google Scholar] [CrossRef]
  54. Nitrosi, A.; Bertolini, M.; Borasi, G.; Botti, A.; Barani, A.; Rivetti, S.; Pierotti, L. Application of QC_DR Software for Acceptance Testing and Routine Quality Control of Direct Digital Radiography Systems: Initial Experiences using the Italian Association of Physicist in Medicine Quality Control Protocol. Digit. Imaging 2009, 22, 656Y666. [Google Scholar] [CrossRef]
  55. Coreline. Available online: https://www.aview-lung.com/ (accessed on 4 August 2022).
  56. Ho, T.; Park, J.; Kim, T.; Park, B.; Lee, J.; Kim, J.; Kim, K.; Choi, S.; Kim, Y.; Lim, J.; et al. Deep Learning Models for Predicting Severe Progression in COVID-19-Infected Patients: Retrospective Study. JMIR Med. Inform. 2021, 9, e24973. [Google Scholar] [CrossRef] [PubMed]
  57. Ye, Z.; Zhang, Y.; Wang, Y.; Huang, Z.; Song, B. Chest CT manifestations of new coronavirus disease 2019 (COVID-19): A pictorial review. Eur. Radiol. 2020, 30, 4381–4389. [Google Scholar] [CrossRef] [PubMed]
  58. Lee, K.; Kang, E.; Yong, H.; Kim, C.; Lee, K.; Hwang, S.; Oh, Y. A Stepwise Diagnostic Approach to Cystic Lung Diseases for Radiologists. Korean J. Radiol. 2019, 20, 1368–1380. [Google Scholar] [CrossRef] [PubMed]
  59. Hansell, D.; Bankier, A.; MacMahon, H.; McLoud, T.; Müller, N.; Remy, J. Fleischner Society: Glossary of terms for thoracic imaging. Radiology 2008, 246, 697–722. [Google Scholar] [CrossRef]
  60. Narkhede, S. Understanding AUC-ROC Curve. Available online: https://towardsdatascience.com/understanding-auc-roc-curve-68b2303cc9c5 (accessed on 5 September 2023).
  61. Vaid, A.; Somani, S.; Russak, A.J.; De Freitas, J.K.; Chaudhry, F.F.; Paranjpe, I.; Johnson, K.W.; Lee, S.J.; Miotto, R.; Richter, F.; et al. Machine Learning to Predict Mortality and Critical Events in a Cohort of Patients With COVID-19 in New York City: Model Development and Validation. J. Med. Internet. Res. 2020, 22, e24018. [Google Scholar] [CrossRef]
  62. Abdulaal, A.; Patel, A.; Charani, E.; Denny, S.; Mughal, N.; Moore, L. Prognostic Modeling of COVID-19 Using Artificial Intelligence in the United Kingdom: Model Development and Validation. J. Med. Internet. Res. 2020, 22, e20259. [Google Scholar] [CrossRef]
  63. Abdulaal, A.; Patel, A.; Charani, E.; Denny, S.; Alqahtani, S.A.; Davies, G.W.; Mughal, N.; Moore, L.S.P. Comparison of deep learning with regression analysis in creating predictive models for SARS-CoV-2 outcomes. BMC Med. Inform. Decis. Mak. 2020, 20, 1–11. [Google Scholar] [CrossRef]
  64. Ko, H.; Chung, H.; Kang, W.S.; Park, C.; Kim, D.W.; Kim, S.E.; Chung, C.R.; Ko, R.E.; Lee, H.; Seo, J.H.; et al. An Artificial Intelligence Model to Predict the Mortality of COVID-19 Patients at Hospital Admission Time Using Routine Blood Samples: Development and Validation of an Ensemble Model. J. Med. Internet. Res. 2020, 22, e25442. [Google Scholar] [CrossRef]
  65. Di Castelnuovo, A.; Bonaccio, M.; Costanzo, S.; Gialluisi, A.; Antinori, A.; Berselli, N.; Blandi, L.; Bruno, R.; Cauda, R.; Guaraldi, G.; et al. Common cardiovascular risk factors and in-hospital mortality in 3,894 patients with COVID-19: Survival analysis and machine learning-based findings from the multicentre Italian CORIST Study. Int. J. Antimicrob. Agents 2020, 30, 1899–1913. [Google Scholar] [CrossRef]
  66. Booth, A.L.; Abels, E.; McCaffrey, P. Development of a prognostic model for mortality in COVID-19 infection using machine learning. Mod. Pathol. 2021, 34, 522–531. [Google Scholar] [CrossRef]
  67. Li, S.; Lin, Y.; Zhu, T.; Fan, M.; Xu, S.; Qiu, W.; Chen, C.; Li, L.; Wang, Y.; Yan, J.; et al. Development and external evaluation of predictions models for mortality of COVID-19 patients using machine learning method. Neural. Comput. Appl. 2021, 35, 13037–13046. [Google Scholar] [CrossRef] [PubMed]
  68. Ning, W.; Lei, S.; Yang, J.; Cao, Y.; Jiang, P.; Yang, Q.; Zhang, J.; Wang, X.; Chen, F.; Geng, Z.; et al. Open resource of clinical data from patients with pneumonia for the prediction of COVID-19 outcomes via deep learning. Nat. Biomed. Eng. 2020, 4, 1197–1207. [Google Scholar] [CrossRef]
  69. Bertsimas, D.; Lukin, G.; Mingardi, L.; Nohadani, O.; Orfanoudaki, A.; Stellato, B.; Wiberg, H.; Gonzalez-Garcia, S.; Parra-Calderón, C.L.; Robinson, K.; et al. COVID-19 mortality risk assessment: An international multi-center study. PLoS ONE 2020, 15, e0243262. [Google Scholar] [CrossRef]
  70. Guan, X.; Zhang, B.; Fu, M.; Li, M.; Yuan, X.; Zhu, Y.; Peng, J.; Guo, H.; Lu, Y. Clinical and inflammatory features based machine learning model for fatal risk prediction of hospitalized COVID-19 patients: Results from a retrospective cohort study. Ann. Med. 2021, 53, 257–266. [Google Scholar] [CrossRef]
  71. Vaid, A.; Jaladanki, S.; Xu, J.; Teng, S.; Kumar, A.; Lee, S.; Somani, S.; Paranjpe, I.; De Freitas, J.K.; Wanyan, T.; et al. Federated Learning of Electronic Health Records to Improve Mortality Prediction in Hospitalized Patients With COVID-19: Machine Learning Approach. JMIR Med. Inform. 2021, 9, e24207. [Google Scholar] [CrossRef]
  72. Hu, C.; Liu, Z.; Jiang, Y.; Shi, O.; Zhang, X.; Xu, K.; Suo, C.; Wang, Q.; Song, Y.; Yu, K.; et al. Early prediction of mortality risk among patients with severe COVID-19, using machine learning. Int. J. Epidemiol. 2020, 49, 1918–1929. [Google Scholar] [CrossRef]
  73. Ikemura, K.; Bellin, E.; Yagi, Y.; Billett, H.; Saada, M.; Simone, K.; Stahl, L.; Szymanski, J.; Goldstein, D.Y.; Reyes Gil, M. Using Automated Machine Learning to Predict the Mortality of Patients With COVID-19: Prediction Model Development Study. J. Med. Internet. Res. 2021, 23, e23458. [Google Scholar] [CrossRef] [PubMed]
  74. Tezza, F.; Lorenzoni, G.; Azzolina, D.; Barbar, S.; Leone, L.A.C.; Gregori, D. Predicting in-Hospital Mortality of Patients with COVID-19 Using Machine Learning Techniques. J. Pers. Med. 2021, 11, 343. [Google Scholar] [CrossRef] [PubMed]
  75. Stachel, A.; Daniel, K.; Ding, D.; Francois, F.; Phillips, M.; Lighter, J. Development and validation of a machine learning model to predict mortality risk in patients with COVID-19. BMJ Health Care Inform. 2021, 28, e100235. [Google Scholar] [CrossRef]
Figure 1. A flowchart showing patient inclusion criteria.
Electronics 12 03878 g001
Figure 2. 2D ((A) axial, (C) coronal, and (D) Sagittal) and 3D (B) segmentations of a COVID-19 patient. Green: healthy parenchyma; red: consolidations; yellow: ground glass opacities; blue: reticular pattern, light blue: emphysema.
Electronics 12 03878 g002
Figure 3. Machine learning pipeline scheme.
Electronics 12 03878 g003
Figure 4. Neural network architecture. The network is divided into two separate branches for the independent analysis of the radiomic and clinical features. The radiomic branch has a higher number of hidden layers and neurons because radiomic features are way more numerous than clinical ones. The outputs of the two branches are then concatenated and passed to a final dense layer to produce a comprehensive output.
Electronics 12 03878 g004
Table 1. Population features summary.
Population FeaturesNumber
Total patients2348
Survived patients2061 (88%)
Dead patients287 (12%)
Mean Age ± sd [min–max]63 ± 16 [18–100]
Mean Survived Age ± sd [min–max]61 ± 16 [18–99]
Mean Dead Age ± sd [min–max]80 ± 10 [45–100]
Women1085 (46%)
Dead women98 (9%)
Men1263 (54%)
Dead men186 (15%)
Table 2. Clinical and radiological features comprising the clinical dataset.
Clinical Features
AgeSex
CRP valueObesity
Vascular DiseasesDementia
Heart FailureCOPD
DyslipidemiaCancer
ArrhythmiasCardiac Ischaemia
Cerebrovascular diseasesDiabetes
Chronic Renal FailureHypertension
Ground Glass OpacitiesConsolidations
PI > 60%
Table 3. Best hyperparameter values tuned during SVM training for death prediction.
HyperparameterValue
C15
gamma0.0001
kernelrbf
class weightbalanced
Table 4. Performance metrics of the ML classifier (SVM) and DL algorithm for the holdout testing sets (clinical dataset, radiomic dataset, and the set containing both). AUC: area under the curve, ACC: accuracy, SENS: sensitivity, and SPEC: specificity. The best result obtained for each metric is bolded.
Machine LearningDeep Learning
Clinical Radiomic Clinical-
Radiomic
Clinical Radiomic Clinical-
Radiomic
AUC0.7940.7710.8030.8250.8440.864
ACC0.7700.8000.8130.7770.7770.766
SENS0.7630.8090.8160.7330.6980.814
SPEC0.8260.7330.7910.7840.7880.759
Table 5. Performance Metrics (AUC, ACC, SENS, SPEC) of recent machine learning and deep learning models for COVID-19 mortality prediction. AUC: area under the curve, ACC: accuracy, SENS: sensitivity, and SPEC: specificity.
ModelAUCACCSENSSPEC
Our model ML0.8030.8130.8160.791
Our model DL0.8640.7660.8140.759
Vaid et al., 2020 [61]0.8900.9760.4420.991
Abdulaal et al., 2020 [62]0.9010.8620.8750.859
Abdulaal et al., 2020 [63]0.8690.8370.5000.966
Ko et al., 2020 [64]-0.9300.9200.930
Di et al., 2020 [65]-0.8340.9500.308
Banoei et al., 2021 [29]0.9100.7500.9000.870
Booth et al., 2021 [66]0.930-0.7600.910
Li et al., 2021 [67]0.9180.7990.7740.903
Ning et al., 2020 [68]0.8560.7870.8820.783
Bertsimas et al., 2020 [69]0.9020.850-0.866
An et al., 2020 [20]0.962-0.9200.918
Guan et al., 2021 [70]-0.9910.876-
Vaid et al., 2021 [71]0.8360.7800.8050.702
Hu et al., 2021 [72]0.895-0.8920.687
Ikemura et al., 2021 [73]0.903-0.8380.836
Tezza et al., 2021 [74]0.840-0.7880.774
Stachel et al., 2021 [75]0.9900.9600.2400.970
Disclaimer/Publisher’s Note: The statements, opinions and data contained in all publications are solely those of the individual author(s) and contributor(s) and not of MDPI and/or the editor(s). MDPI and/or the editor(s) disclaim responsibility for any injury to people or property resulting from any ideas, methods, instructions or products referred to in the content.

