
Aircraft Detection and Fine-Grained Recognition Based on High-Resolution Remote Sensing Images


Abstract
:1. Introduction
- Some studies only focus on detecting aircraft objects and do not fine-identify specific aircraft types, which has a poor applicability in some scenarios.
- The differences between various aircraft types in remote sensing images are very subtle, making it challenging to classify specific aircraft types accurately.
- In high-resolution remote sensing images, the high complexity of the object background causes many difficulties in detecting and classifying an aircraft.
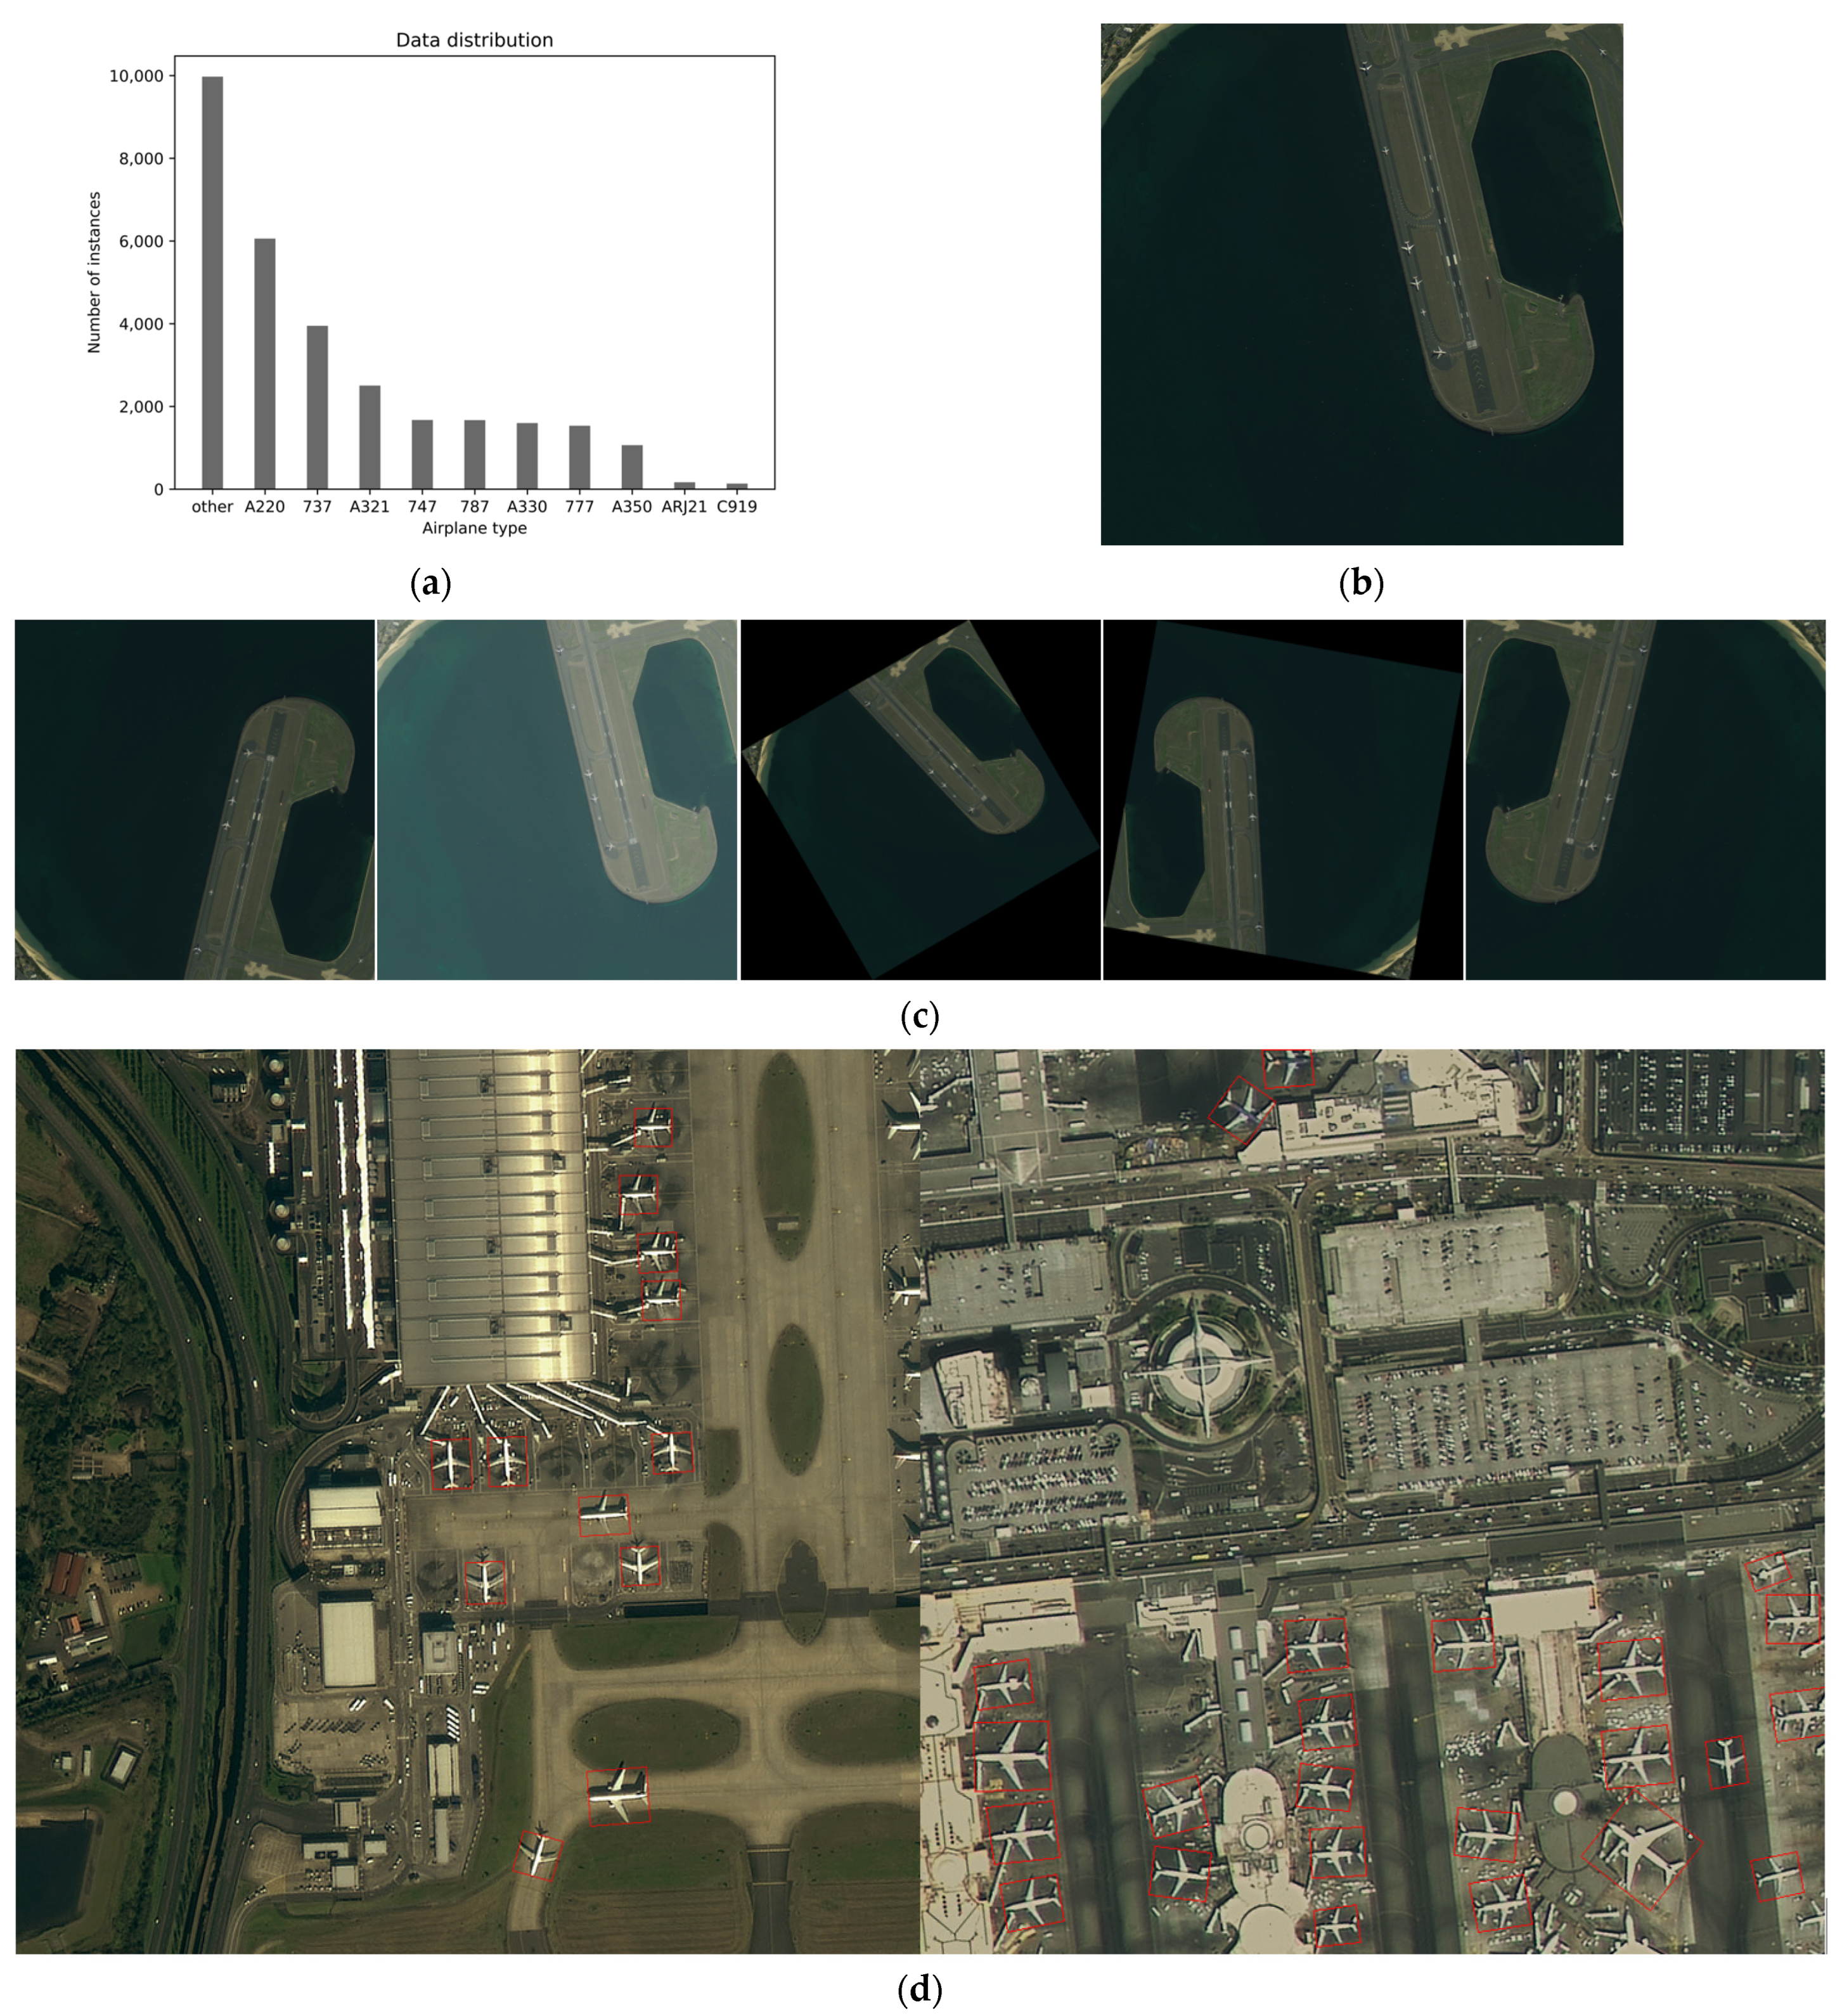
- Because of the imbalanced instances of various aircrafts, the number of instances of various aircraft types in the existing dataset shows a long-tailed distribution.
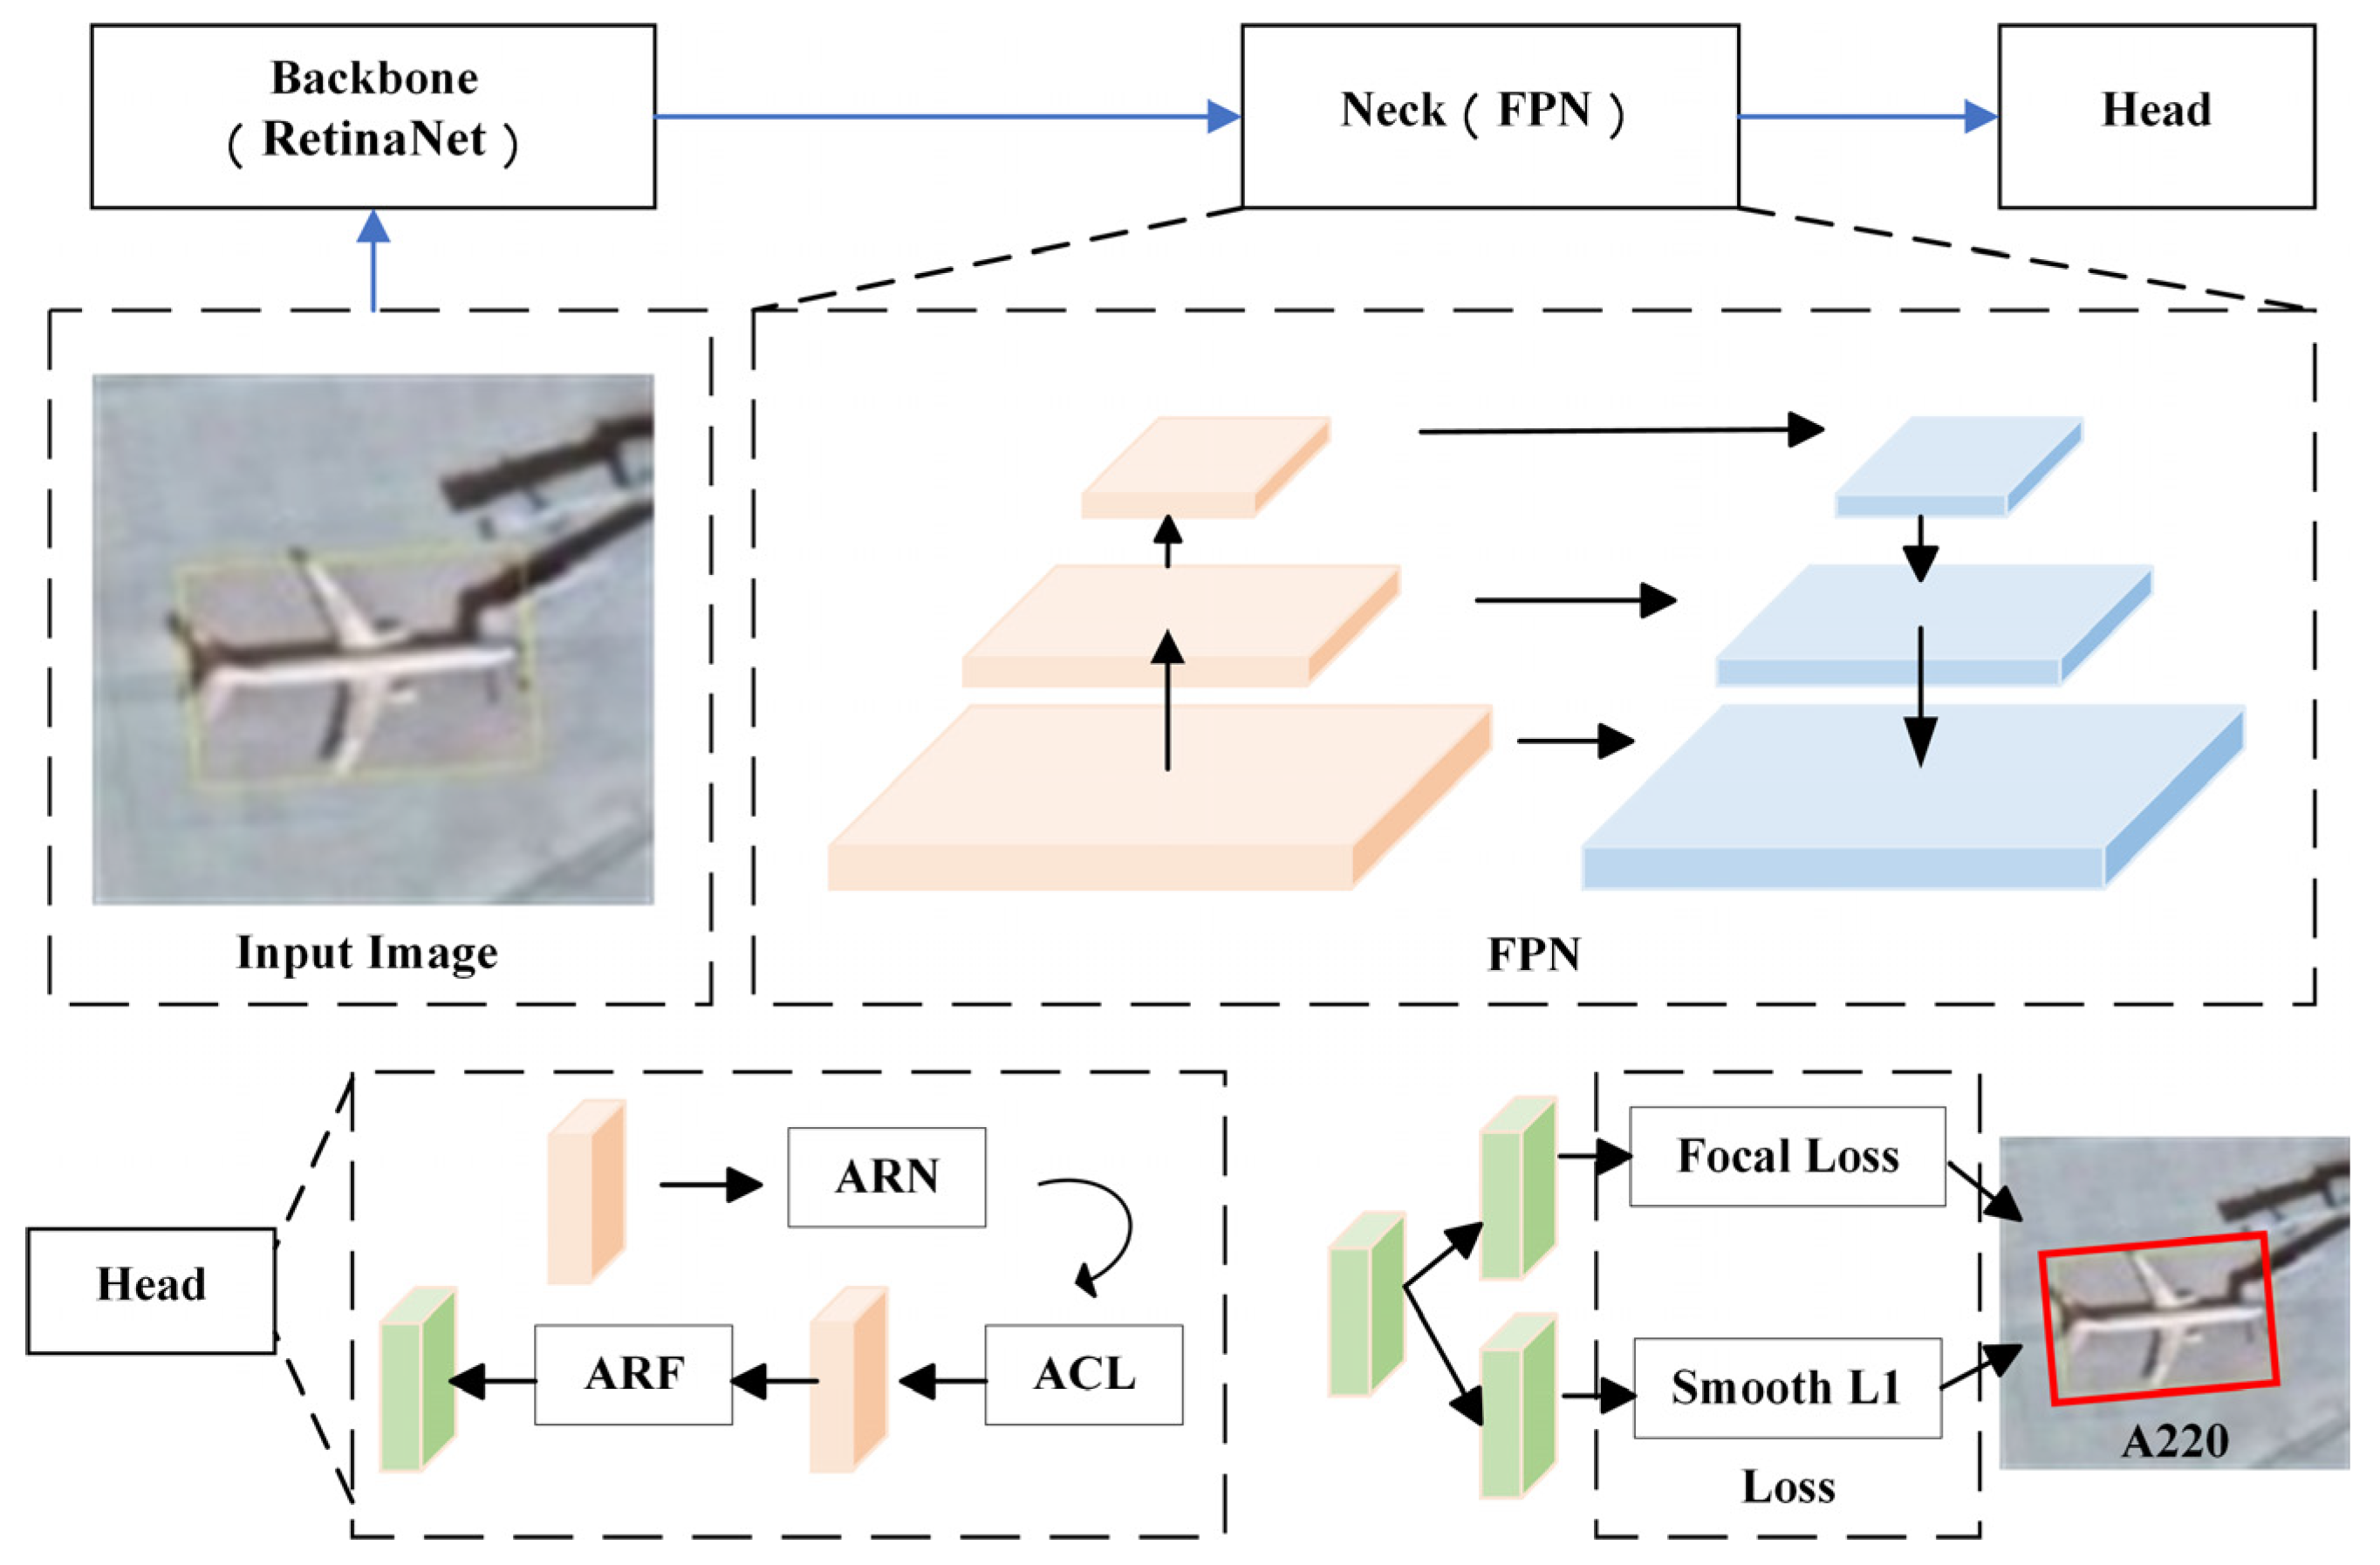
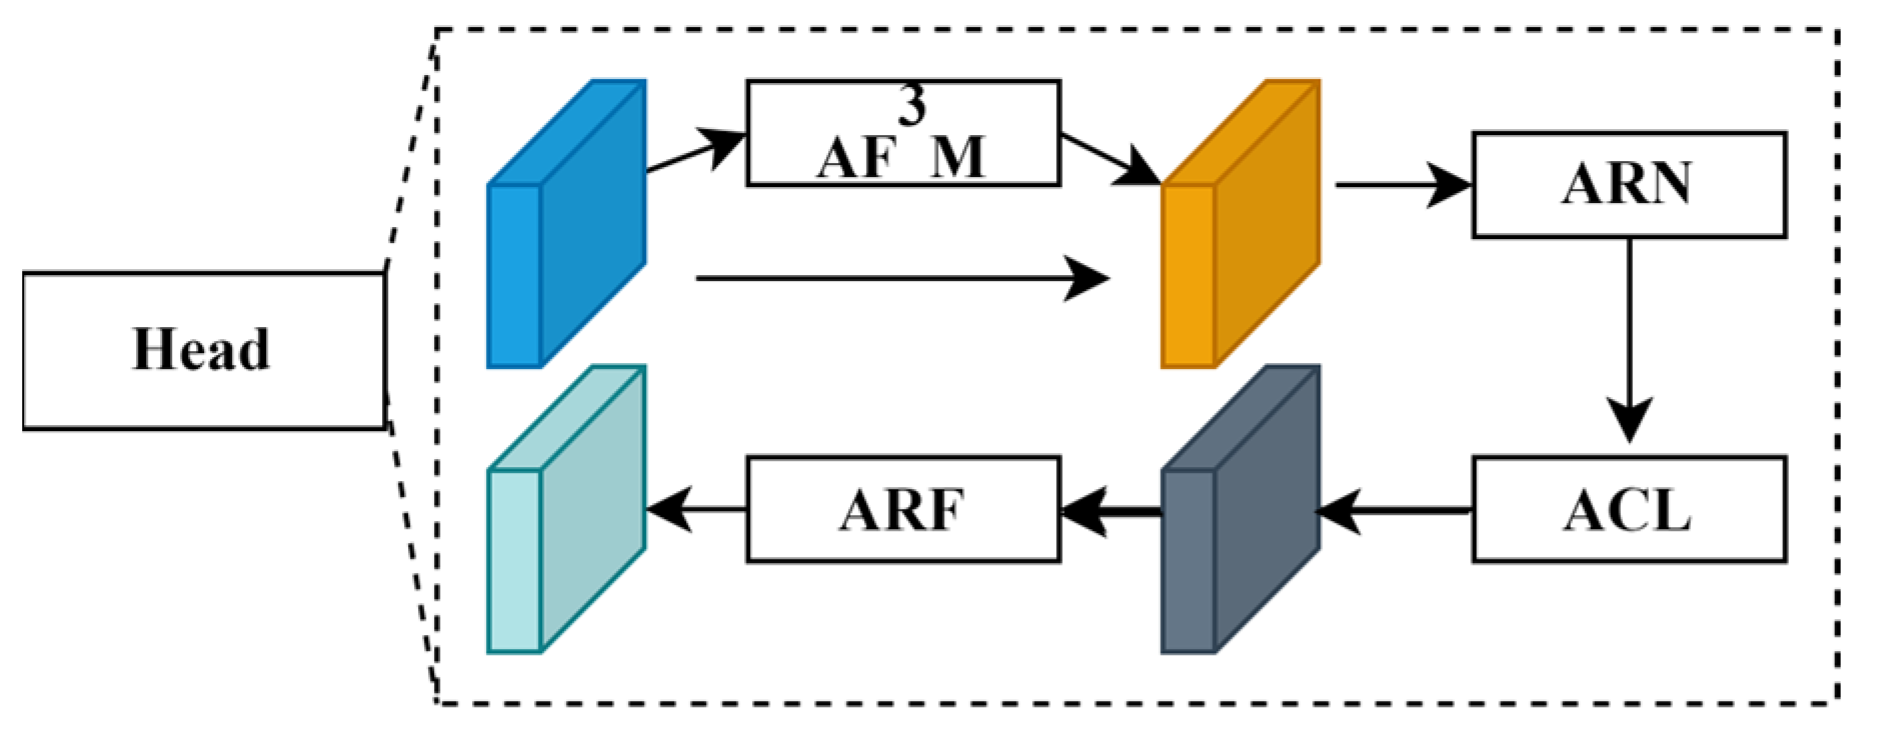
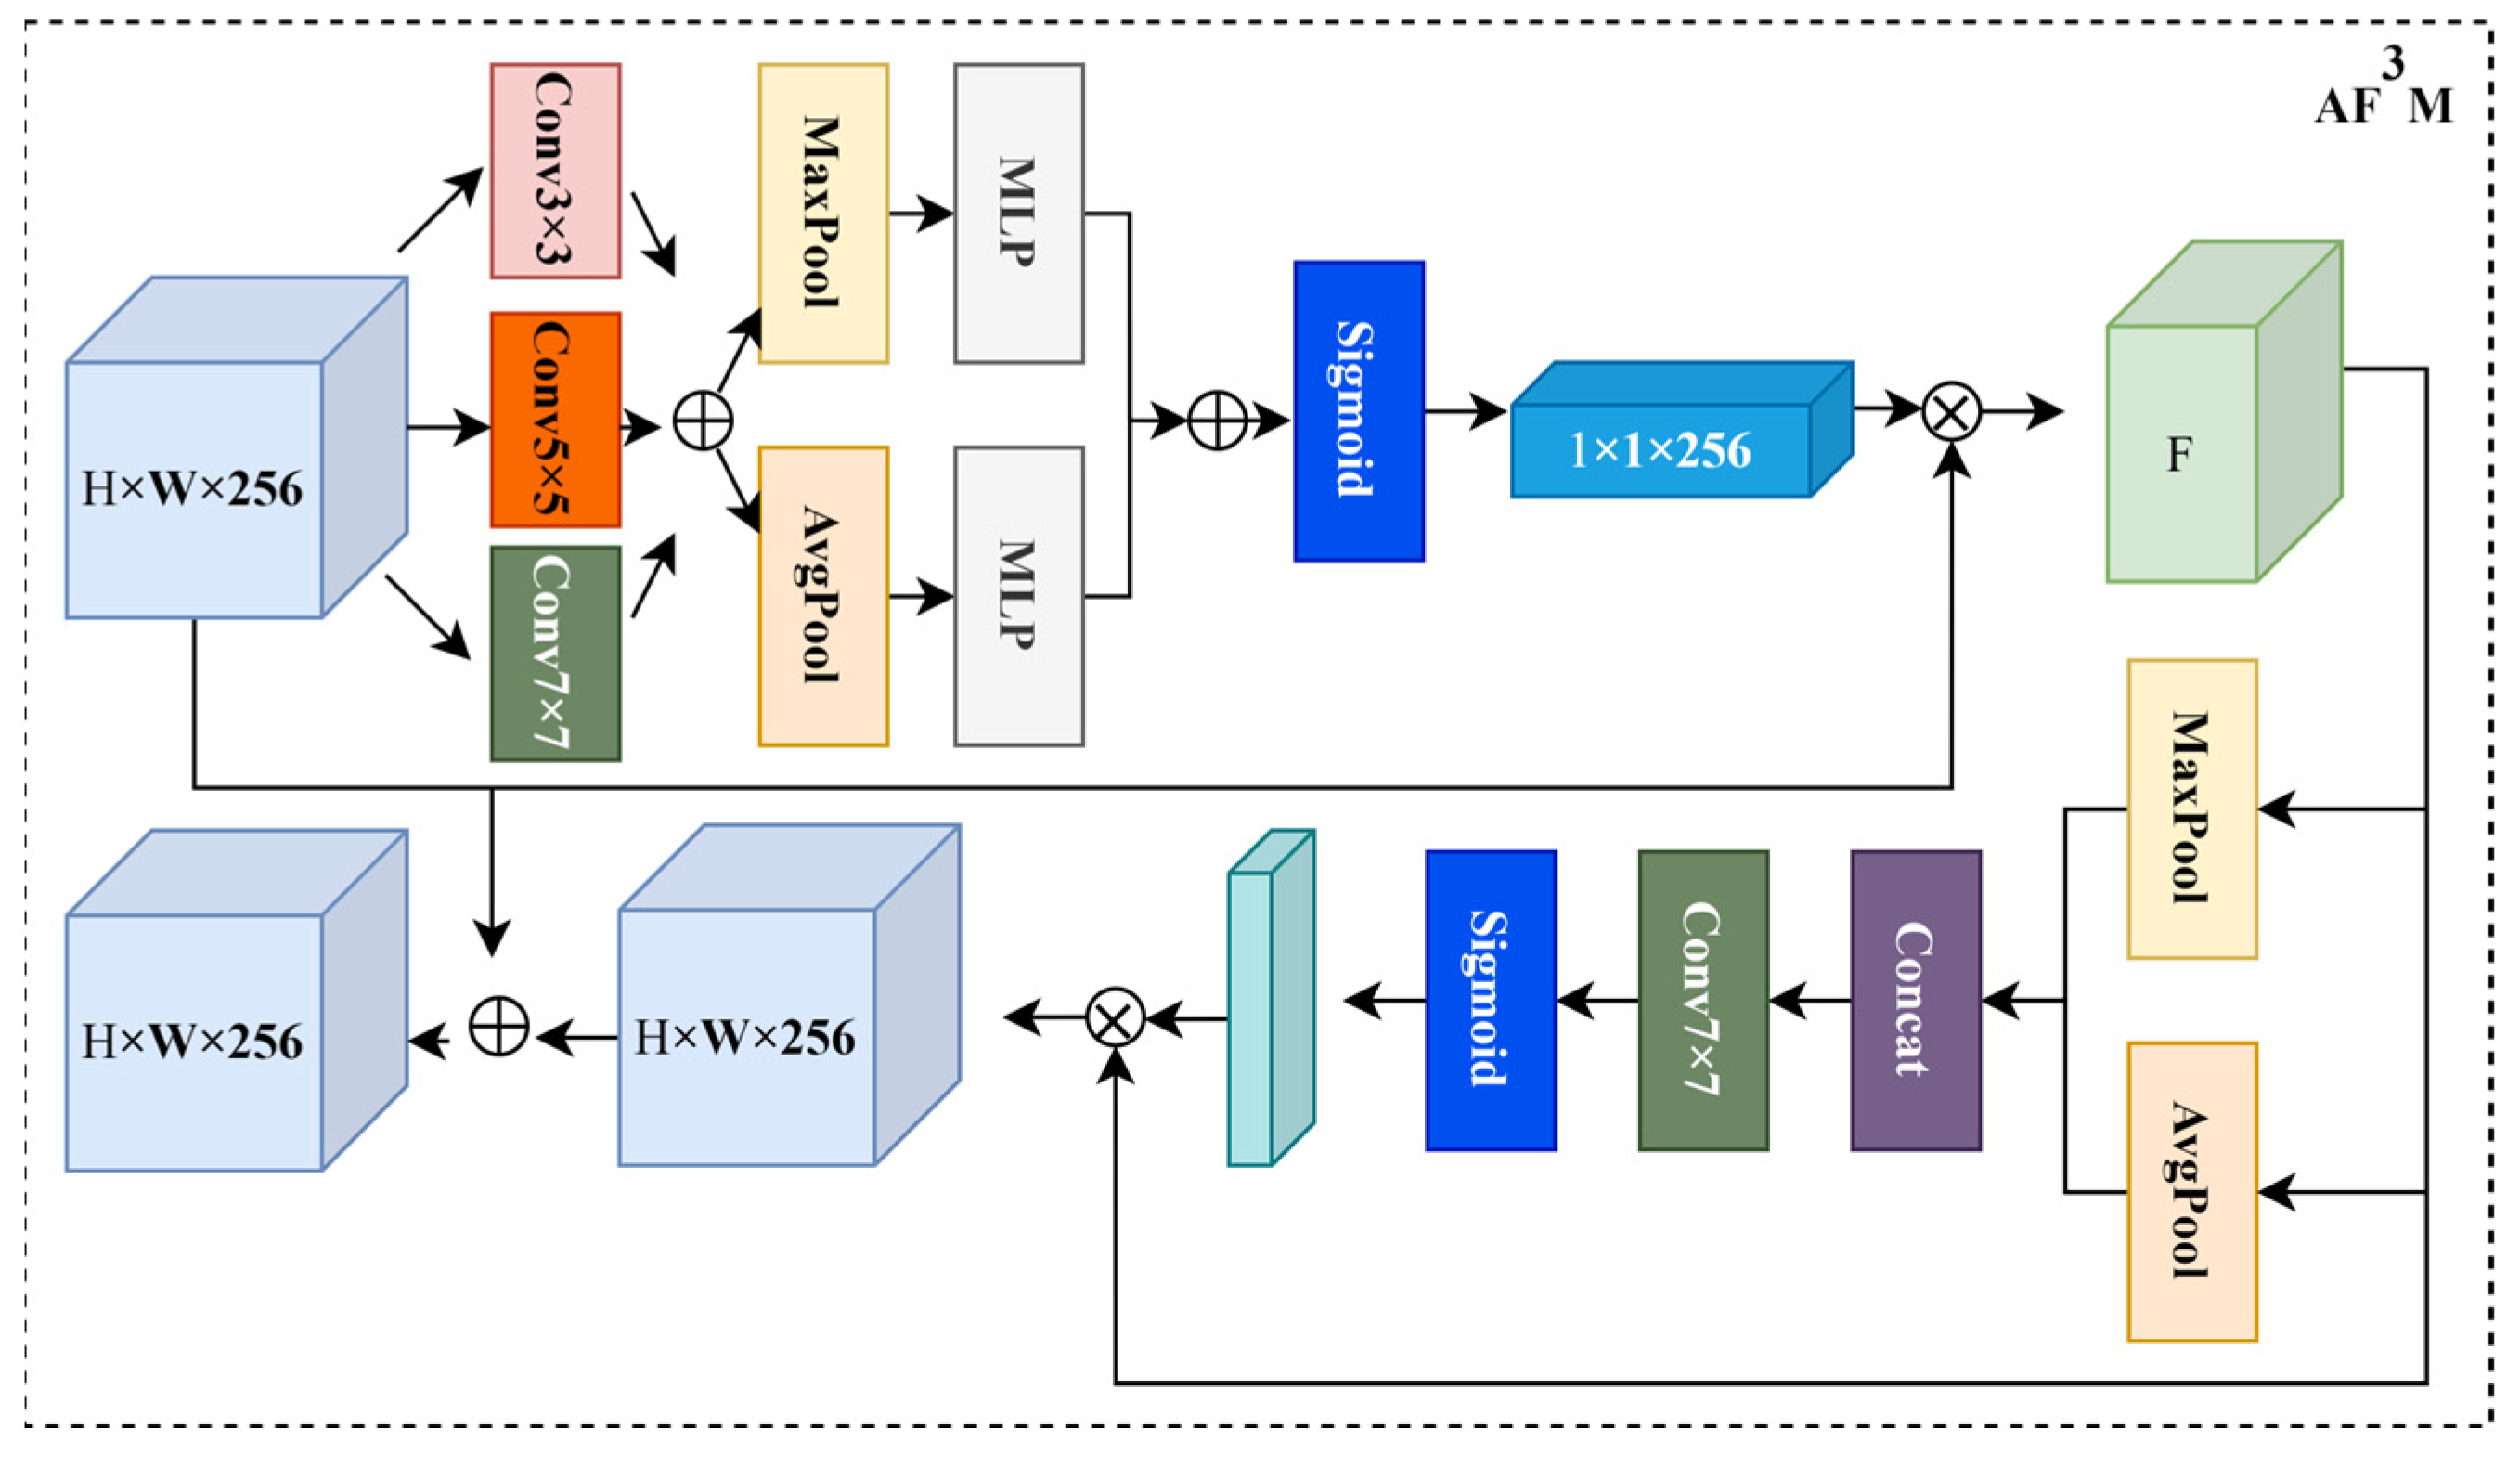
- Introduces an attention mechanism in the detection head, combines multi-scale feature fusion, and constructs the AF3M, which makes feature aggregation occur in the channel and space between the fine-grained features of different aircraft types and increases the semantic feature distance between different aircraft types.
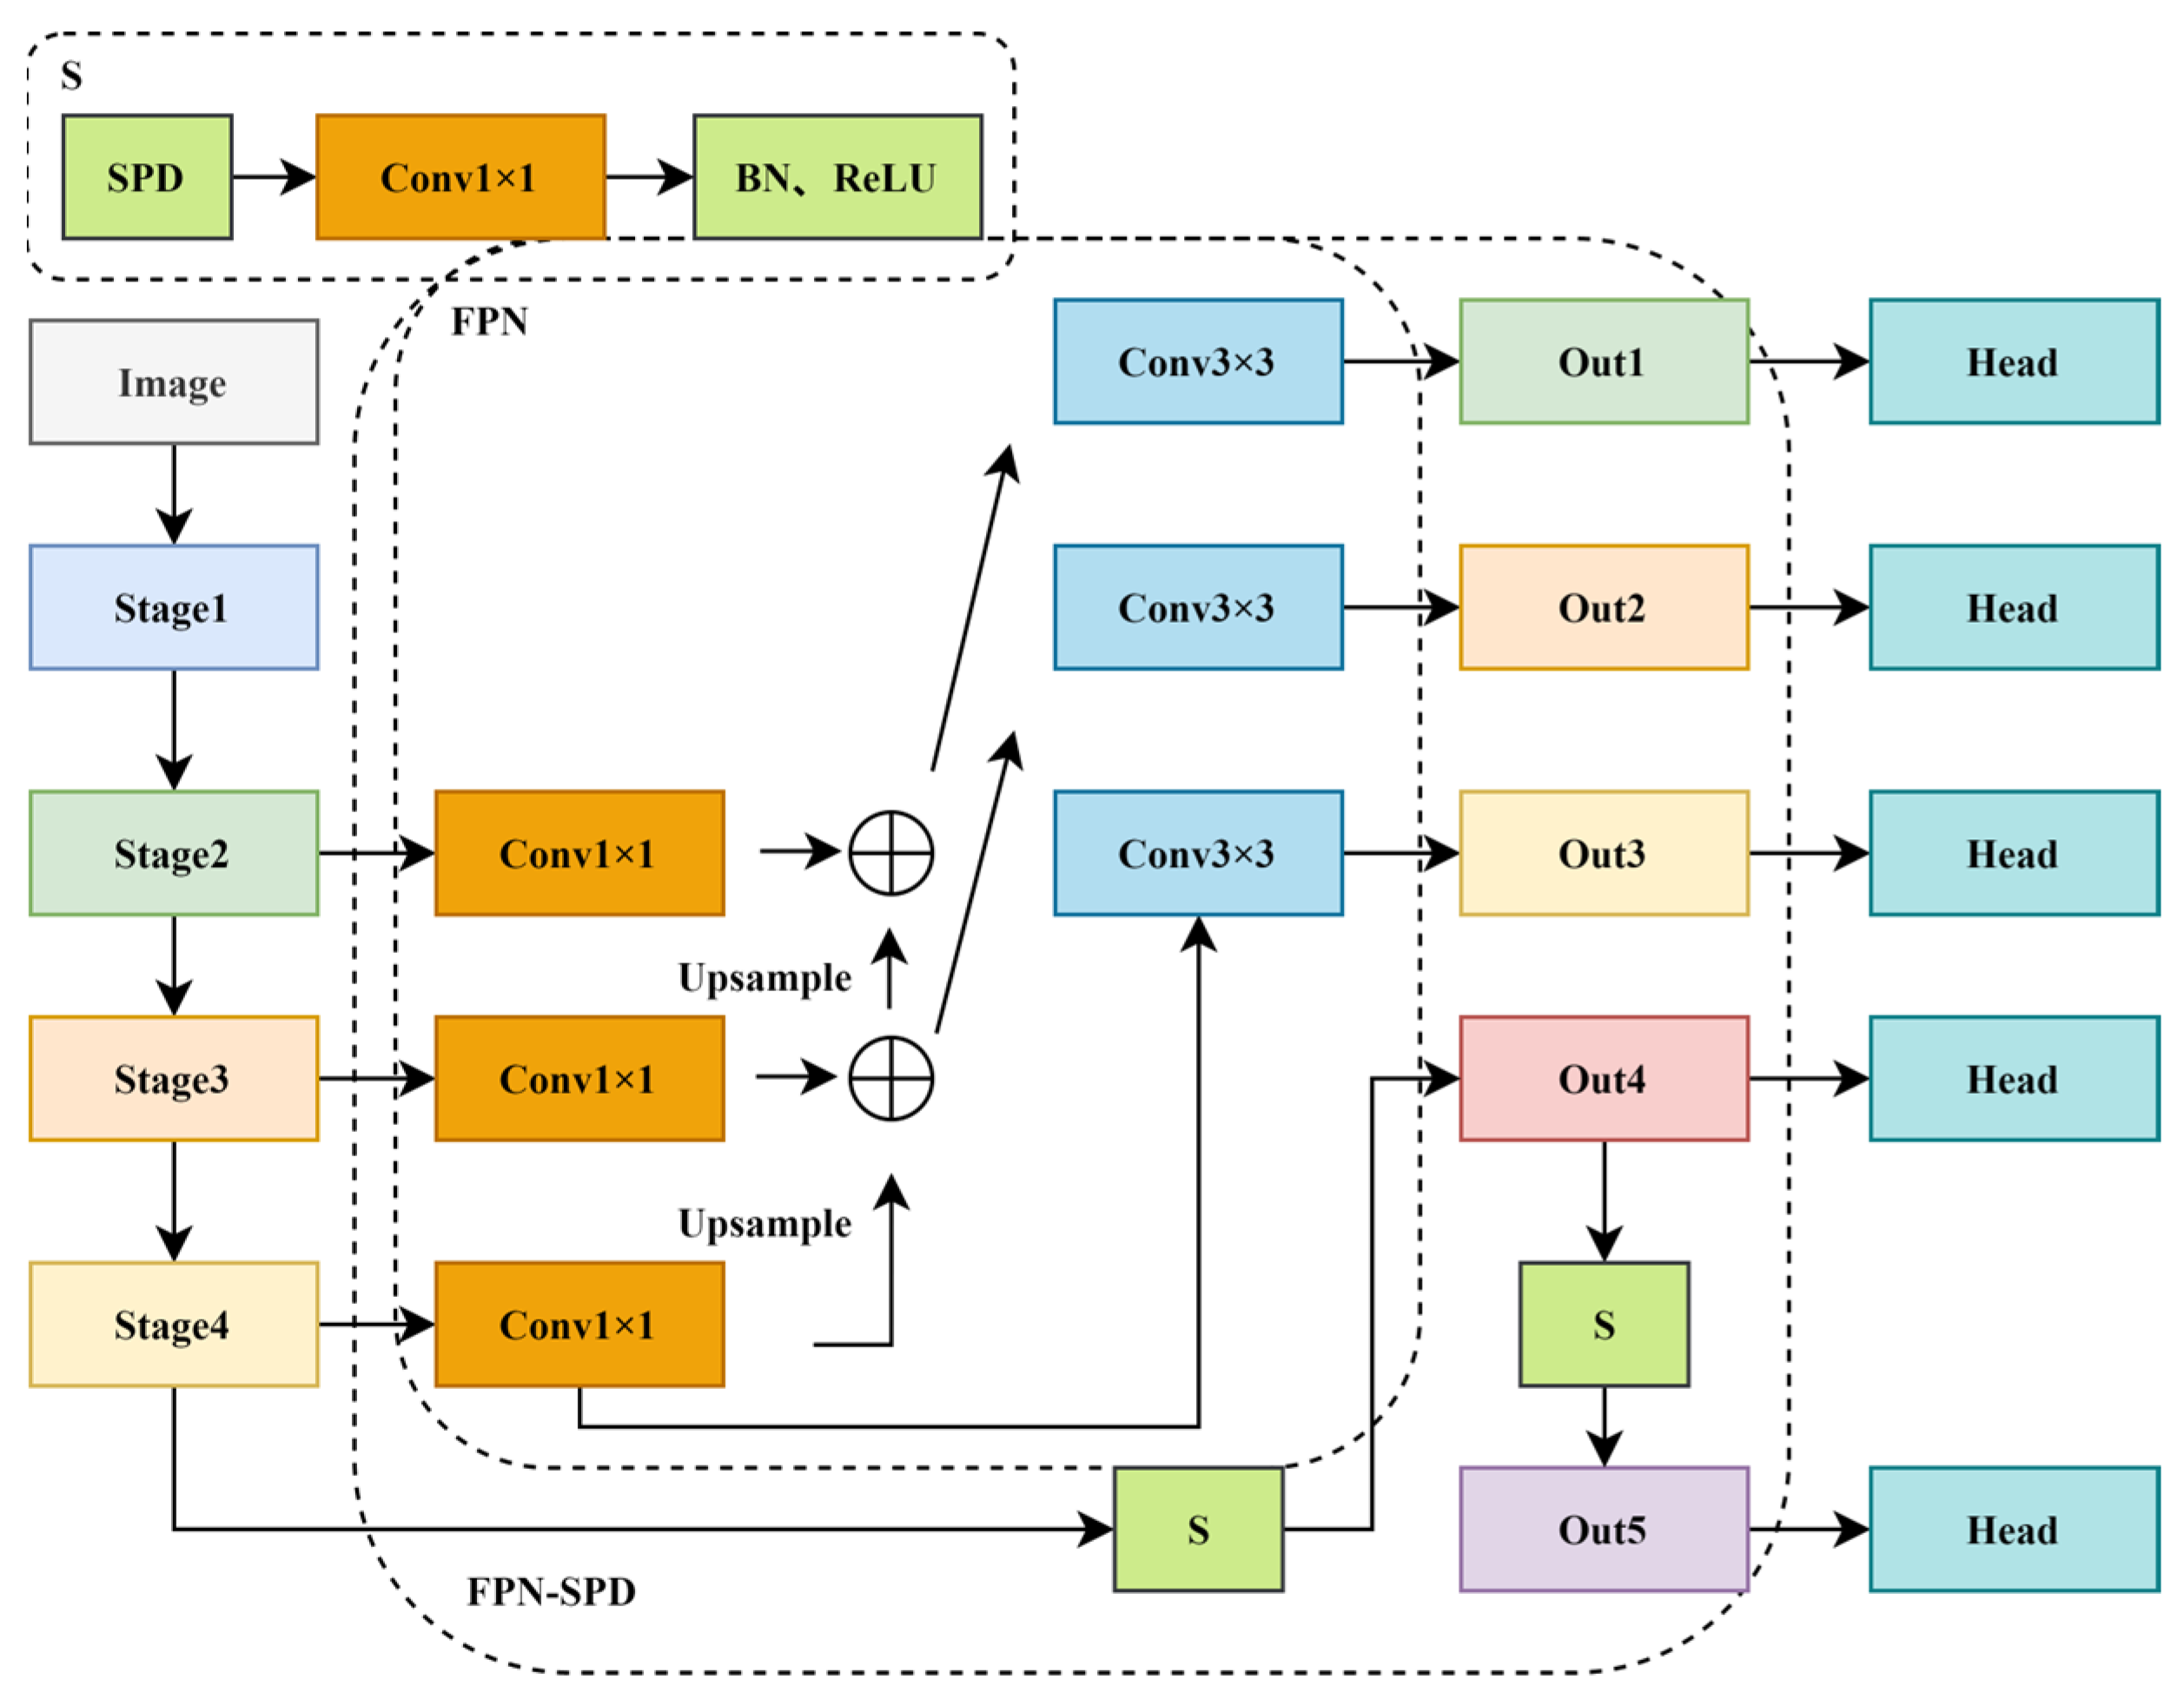
- Introduces the SPD [18] module in the Neck to improve the traditional FPN [19] and construct the FPN-SPD structure with three input layers and five output layers, and replaces the convolutional layer with SPD in the downsampling stage, followed by BN and ReLU to reduce the fine-grained information loss and improve the detection accuracy of small objects.
- In this paper, we perform data augmentation on some remote sensing images to alleviate the accuracy loss caused by the imbalanced number of instances and replace the RetinaNet backbone with ResNet101 [20] to extract aircraft features further and improve the detection accuracy.
2. Related Work
2.1. S2ANet
2.2. Attention Mechanisms
2.3. Regression Loss
2.4. Space-to-Depth
3. Algorithm Improvement
3.1. AF3M
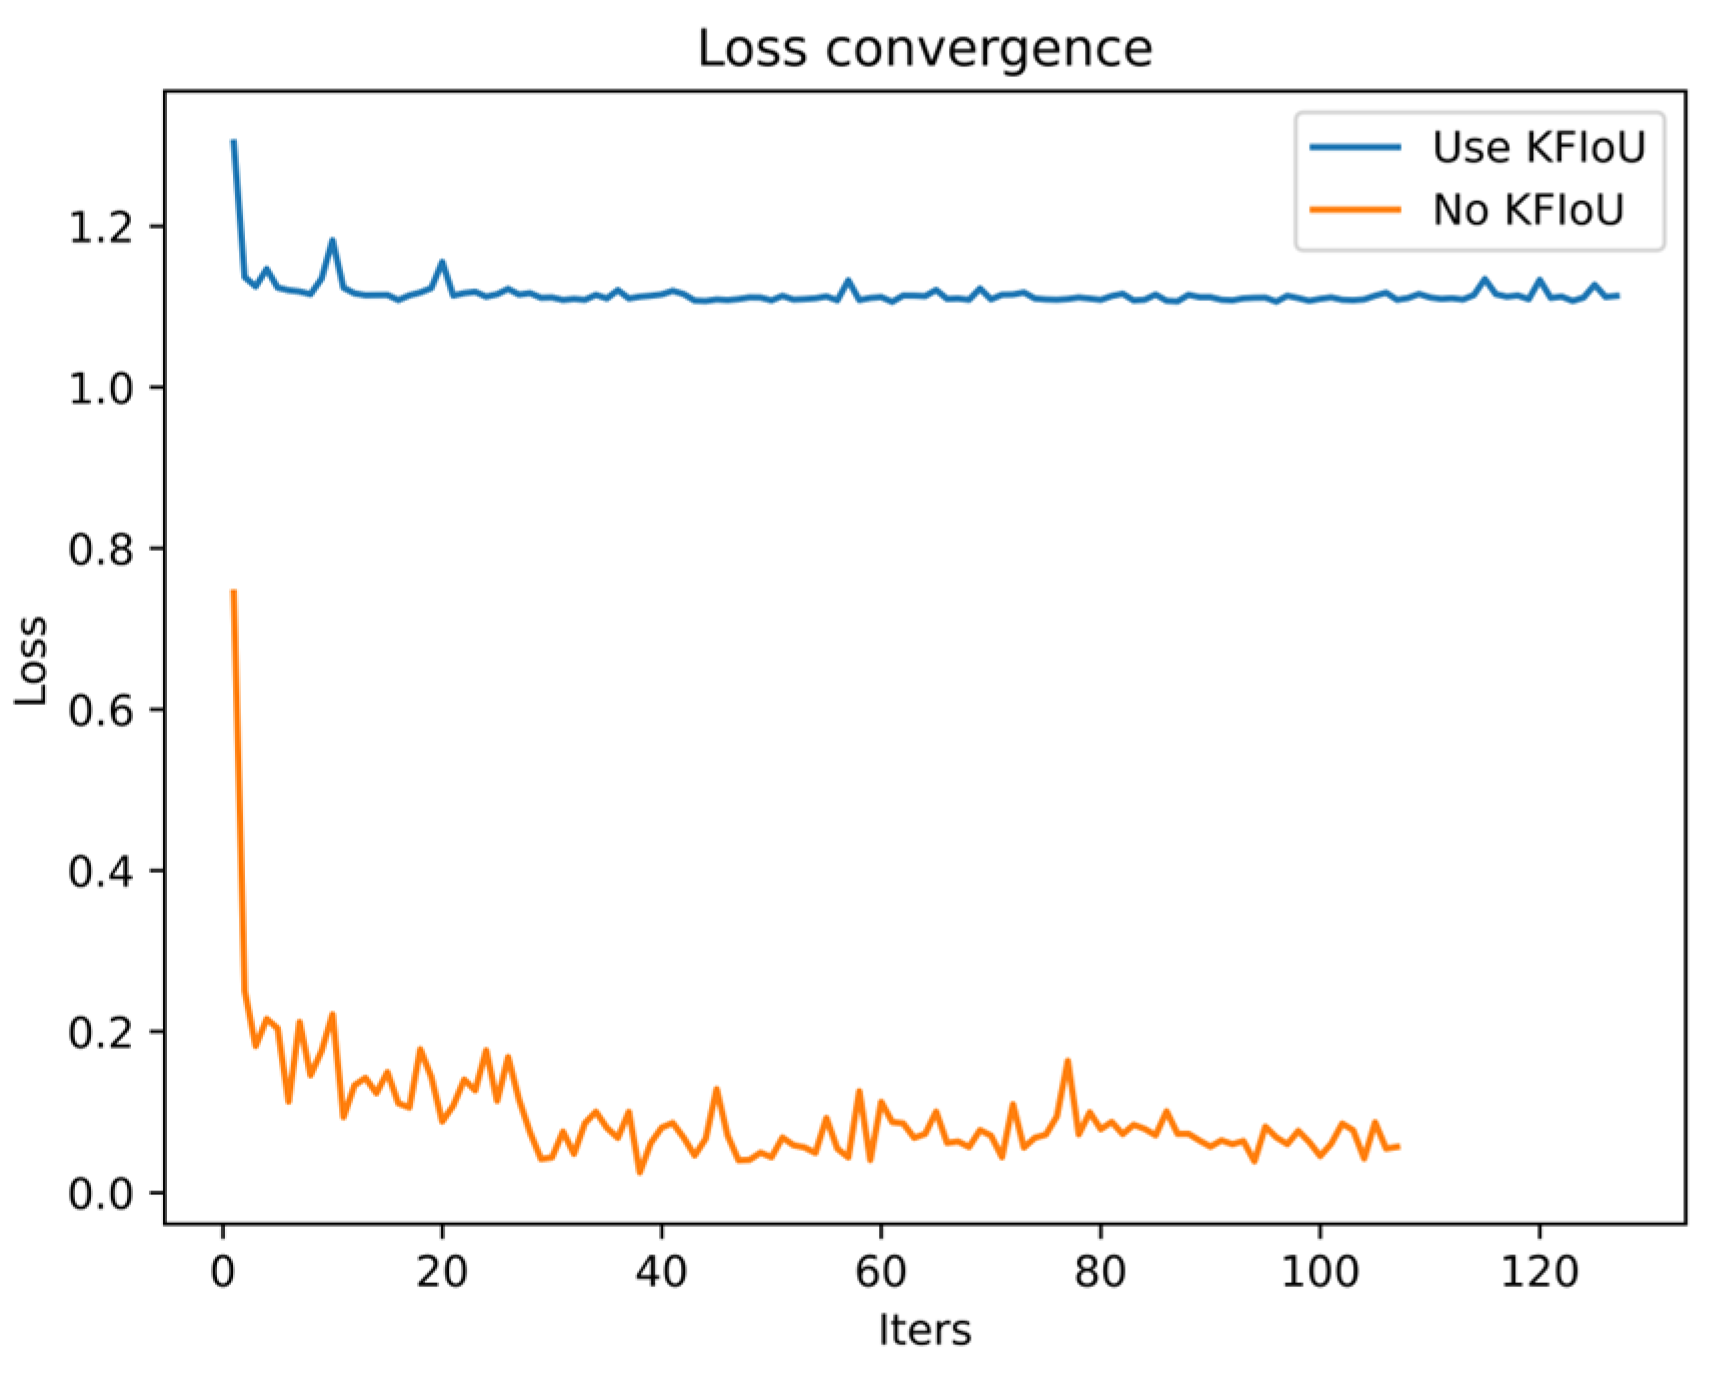
3.2. Optimize Regression Loss
3.3. FPN-SPD
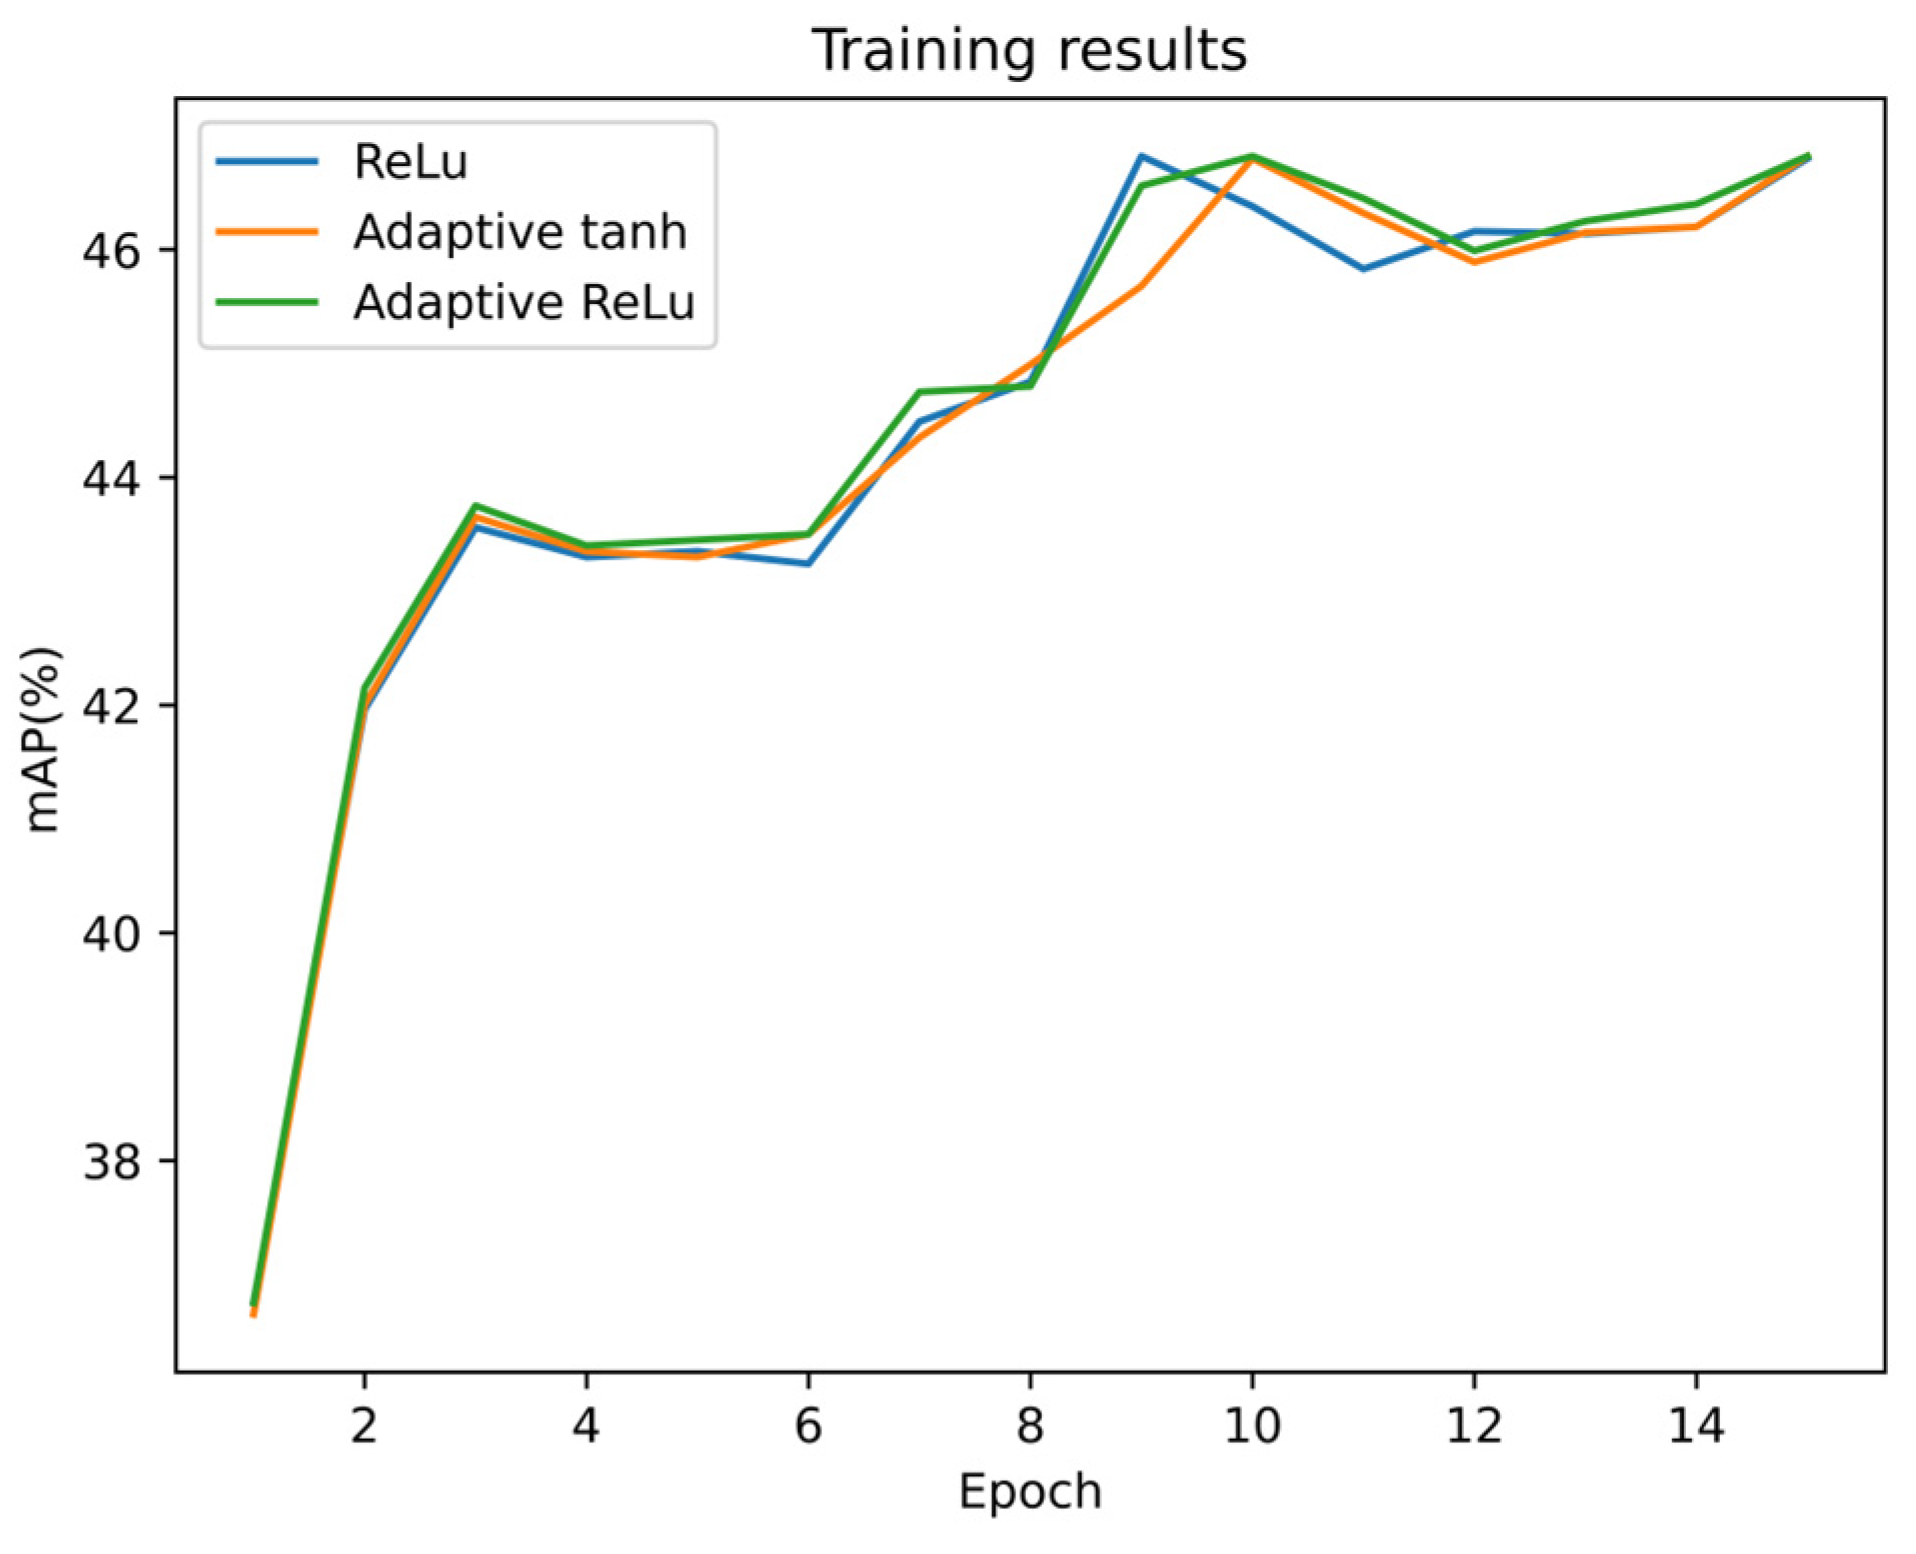
3.4. Selection of Activation Function
4. Experiment and Result Analysis
4.1. Experimental Environment
4.2. Experimental Indicators
4.3. Image Enhancement
4.4. Comparative Experiment
4.4.1. Performance on the FAIR1M Dataset
4.4.2. Performance on the DOTA Dataset
4.5. Ablation Experiment
5. Discussion
6. Conclusions
Author Contributions
Funding
Data Availability Statement
Conflicts of Interest
Abbreviations
| S2ANet | Single-shot Alignment Network |
| FS2ANet | Fine-grained S2ANet |
| AF3M | Aircraft fine feature focusing module |
| SPD | Space-to-depth |
| FPN | Feature pyramid network |
| KFIoU | SkewIoU based on Kalman filtering |
| CNN | Convolutional Neural Network |
| SA-S | Shape adaptive selection |
| SA-M | Shape adaptive measurement |
| FAM | Feature Alignment Module |
| ODM | Orientation Detection Module |
| CAM | Channel attention module |
| SAM | Spatial attention module |
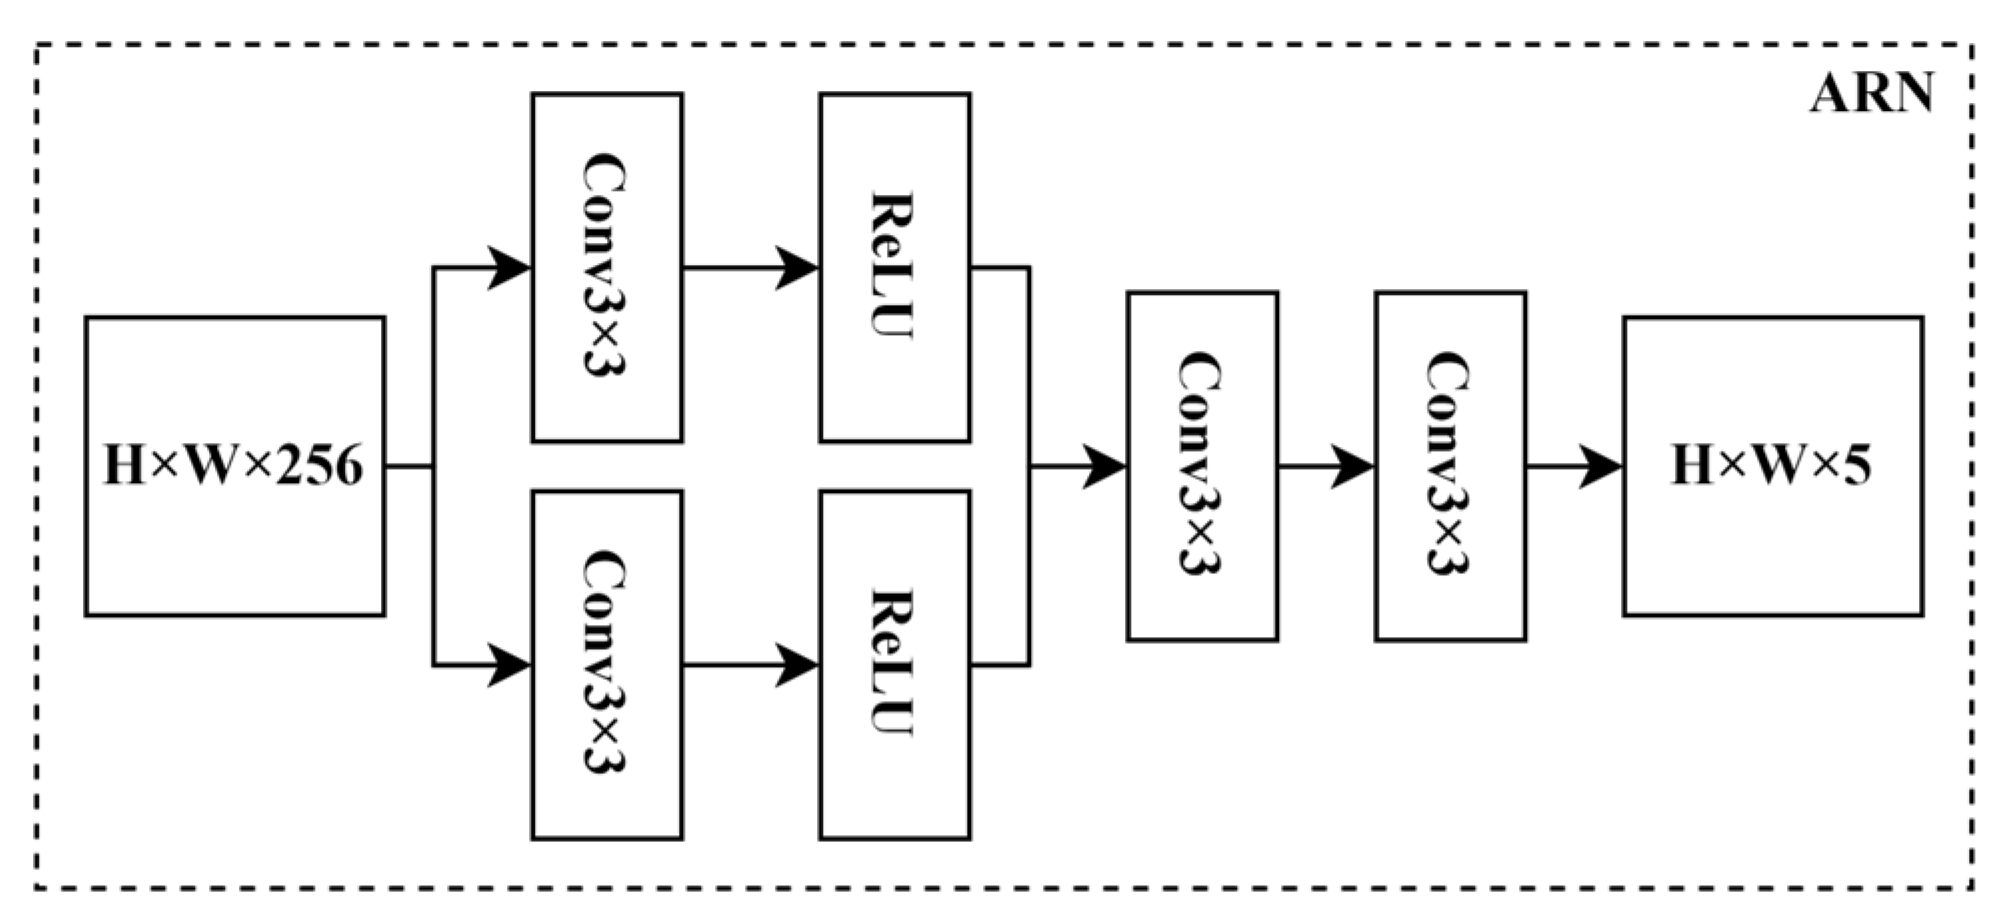
| ARN | Anchor refinement network |
| AP | Average precision |
| IoU | Intersection over union |
| R | Recall |
| P | Precision |
| YOLO | You only look once |
| SSD | Single-shot multi-box detector |
| mAP | Mean average precision |
| MLP | Multi-layer perceptron |
| BN | Batch Normalization |
| SGD | Stochastic gradient descent |
References
- Lecun, Y.; Bottou, L. Gradient-based learning applied to document recognition. Proc. IEEE 1998, 86, 2278–2324. [Google Scholar] [CrossRef]
- Ju, M.; Niu, B.; Jin, S.; Liu, Z. SuperDet: An Efficient Single-Shot Network for Vehicle Detection in Remote Sensing Images. Electronics 2023, 12, 1312. [Google Scholar] [CrossRef]
- Guo, J.; Wang, Z.; Zhang, S. FESSD: Feature Enhancement Single Shot MultiBox Detector Algorithm for Remote Sensing Image Target Detection. Electronics 2023, 12, 946. [Google Scholar] [CrossRef]
- Yu, L.; Zhou, X.; Wang, L.; Zhang, J. Boundary-Aware Salient Object Detection in Optical Remote-Sensing Images. Electronics 2022, 11, 4200. [Google Scholar] [CrossRef]
- Ren, S.; He, K.; Girshick, R.; Sun, J. Faster R-CNN: Towards Real-Time Object Detection with Region Proposal Networks. IEEE Trans. Pattern Anal. Mach. Intell. 2017, 39, 1137–1149. [Google Scholar] [CrossRef] [PubMed] [Green Version]
- Liu, W.; Anguelov, D.; Erhan, D.; Szegedy, C.; Reed, S.; Fu, C.Y.; Berg, A.C. Ssd: Single shot multibox detector. In Proceedings of the Computer Vision–ECCV 2016: 14th European Conference, Amsterdam, The Netherlands, 11–14 October 2016; Springer Nature Switzerland: Cham, Switzerland, 2016; pp. 21–37. [Google Scholar]
- Redmon, J.; Divvala, S.; Girshick, R.; Farhadi, A. You only look once: Unified, real-time object detection. In Proceedings of the IEEE Conference on Computer Vision and Pattern Recognition, Las Vegas, NV, USA, 26 June–1 July 2016; pp. 779–788. [Google Scholar]
- Wang, S.; Gao, X.; Sun, H.; Zheng, X.; Sun, X. Aircraft object detection method based on CNN for high-resolution SAR images. J. Radar 2017, 6, 195–203. [Google Scholar]
- Jiang, Y.; Zhu, X.; Wang, X.; Yang, S.; Li, W.; Wang, H.; Fu, P.; Luo, Z. R2CNN: Rotational Region CNN for Orientation Robust Scene Text Detection. arXiv 2017, arXiv:1706.09579. [Google Scholar]
- Ding, J.; Xue, N.; Long, Y.; Xia, G.S.; Lu, Q. Learning RoI Transformer for Oriented Object Detection in Aerial Images. In Proceedings of the 2019 IEEE/CVF Conference on Computer Vision and Pattern Recognition (CVPR), Long Beach, CA, USA, 15–20 June 2019. [Google Scholar]
- Yang, X.; Liu, Q.; Yan, J.; Li, A.; Zhang, Z.; Yu, G. R3Det: Refined Single-Stage Detector with Feature Refinement for Rotating Object. arXiv 2019, arXiv:1908.05612. [Google Scholar] [CrossRef]
- Han, J.; Ding, J.; Xue, N.; Xia, G.S. ReDet: A Rotation-equivariant Detector for Aerial Object Detection. In Proceedings of the IEEE/CVF Conference on Computer Vision and Pattern Recognition 2021, Nashville, TN, USA, 20–25 June 2021. [Google Scholar]
- Han, J.; Ding, J.; Li, J.; Xia, G.S. Align Deep Features for Oriented Object Detection. arXiv 2020, arXiv:2008.09397. [Google Scholar] [CrossRef]
- Lin, T.Y.; Goyal, P.; Girshick, R.; He, K.; Dollár, P. Focal loss for dense object detection. In Proceedings of the IEEE International Conference on Computer Vision, Venice, Italy, 22–29 October 2017; pp. 2980–2988. [Google Scholar]
- Hou, L.; Lu, K.; Xue, J.; Li, Y. Shape-adaptive selection and measurement for oriented object detection. In Proceedings of the AAAI Conference on Artificial Intelligence, Virtual, 22 February–1 March 2022; Volume 36, pp. 923–932. [Google Scholar]
- Girshick, R. Fast r-cnn. In Proceedings of the IEEE International Conference on Computer Vision, Santiago, Chile, 7–13 December 2015; pp. 1440–1448. [Google Scholar]
- Yang, X.; Zhou, Y.; Zhang, G.; Yang, J.; Wang, W.; Yan, J.; Zhang, X.; Tian, Q. The kfiou loss for rotated object detection. arXiv 2022, arXiv:2201.12558. [Google Scholar]
- Sunkara, R.; Luo, T. No more strided convolutions or pooling: A new CNN building block for low-resolution images and small objects. In Proceedings of the Machine Learning and Knowledge Discovery in Databases: European Conference, ECML PKDD 2022, Grenoble, France, 19–23 September 2022; Springer Nature Switzerland: Cham, Switzerland, 2023; pp. 443–459. [Google Scholar]
- Lin, T.Y.; Dollár, P.; Girshick, R.; He, K.; Hariharan, B.; Belongie, S. Feature pyramid networks for object detection. In Proceedings of the IEEE Conference on Computer Vision and Pattern Recognition, Honolulu, HI, USA, 21–26 July 2017; pp. 2117–2125. [Google Scholar]
- He, K.; Zhang, X.; Ren, S.; Sun, J. Deep residual learning for image recognition. In Proceedings of the IEEE Conference on Computer Vision and Pattern Recognition, Las Vegas, NV, USA, 26 June–1 July 2016; pp. 770–778. [Google Scholar]
- Hu, J.; Shen, L.; Sun, G. Squeeze-and-excitation networks. In Proceedings of the IEEE Conference on Computer Vision and Pattern Recognition, Salt Lake City, UT, USA, 18–23 June 2018; pp. 7132–7141. [Google Scholar]
- Wang, Q.; Wu, B.; Zhu, P.; Li, P.; Zuo, W.; Hu, Q. ECA-Net: Efficient channel attention for deep convolutional neural networks. In Proceedings of the IEEE/CVF Conference on Computer Vision and Pattern Recognition, Seattle, WA, USA, 13–19 June 2020; pp. 11534–11542. [Google Scholar]
- Woo, S.; Park, J.; Lee, J.Y.; Kweon, I.S. Cbam: Convolutional block attention module. In Proceedings of the European Conference on Computer Vision (ECCV), Munich, Germany, 8–14 September 2018; pp. 3–19. [Google Scholar]
- Jagtap, A.D.; Karniadakis, G.E. How important are activation functions in regression and classification? A survey, performance comparison, and future directions. arXiv 2022, arXiv:2209.02681. [Google Scholar] [CrossRef]
- Glorot, X.; Bordes, A.; Bengio, Y. Deep sparse rectifier neural networks. In Proceedings of the Fourteenth International Conference on Artificial Intelligence and Statistics, Fort Lauderdale, FL, USA, 11–13 April 2011; pp. 315–323, Workshop and Conference Proceedings. [Google Scholar]
- Dubey, S.R.; Chakraborty, S. Average biased relu based cnn descriptor for improved face retrieval. Multimed. Tools Appl. 2021, 80, 23181–23206. [Google Scholar] [CrossRef]
- Eger, S.; Youssef, P.; Gurevych, I. Is it time to swish? comparing deep learning activation functions across nlp tasks. arXiv 2019, arXiv:1901.02671. [Google Scholar]
- Sun, X.; Wang, P.; Yan, Z.; Xu, F.; Wang, R.; Diao, W.; Chen, J.; Li, J.; Feng, Y.; Xu, T.; et al. FAIR1M: A benchmark dataset for fine-grained object recognition in high-resolution remote sensing imagery. ISPRS J. Photogramm. Remote Sens. 2022, 184, 116–130. [Google Scholar] [CrossRef]
- Xia, G.S.; Bai, X.; Ding, J.; Zhu, Z.; Belongie, S.; Luo, J.; Datcu, M.; Pelillo, M.; Zhang, L. DOTA: A Large-scale Dataset for Object Detection in Aerial Images. In Proceedings of the IEEE Conference on Computer Vision and Pattern Recognition, Salt Lake City, UT, USA, 18–23 June 2018. [Google Scholar] [CrossRef] [Green Version]
- Jagtap, A.D.; Karniadakis, G.E. Adaptive activation functions accelerate convergence in deep and physics-informed neural networks. J. Comput. Phys. 2019, 404, 109136. [Google Scholar]


| Algorithm | mAP0.5% | APmax% |
|---|---|---|
| S2ANet | 42.92 | 86.3 |
| S2ANet+SE | 43.12 | 81.3 |
| S2ANet+CBAM | 43.65 | 83 |
| S2ANet+ECA | 43.55 | 83.6 |
| S2ANet+AF3M (Ours) | 44.21 | 81.3 |
| Algorithm | mAP0.5/% | AP-Max | AP-Min | Recall-Max | Recall-Min |
|---|---|---|---|---|---|
| Roi-Transformer | 42.27 | 0.756 | 0.01 | 0.944 | 0.143 |
| SASM | 33.33 | 0.638 | 0.004 | 0.985 | 0.679 |
| ReDet | 41.99 | 0.706 | 0.053 | 0.949 | 0.179 |
| R3Det | 41.82 | 0.839 | 0.003 | 0.989 | 0.643 |
| Faster-Rcnn | 41.76 | 0.836 | 0.028 | 0.967 | 0.132 |
| Rotated RetinaNet | 38.31 | 0.776 | 0.002 | 0.988 | 0.679 |
| GWD | 42.28 | 0.816 | 0.002 | 0.983 | 0.679 |
| S2ANet | 42.95 | 0.863 | 0.003 | 0.978 | 0.679 |
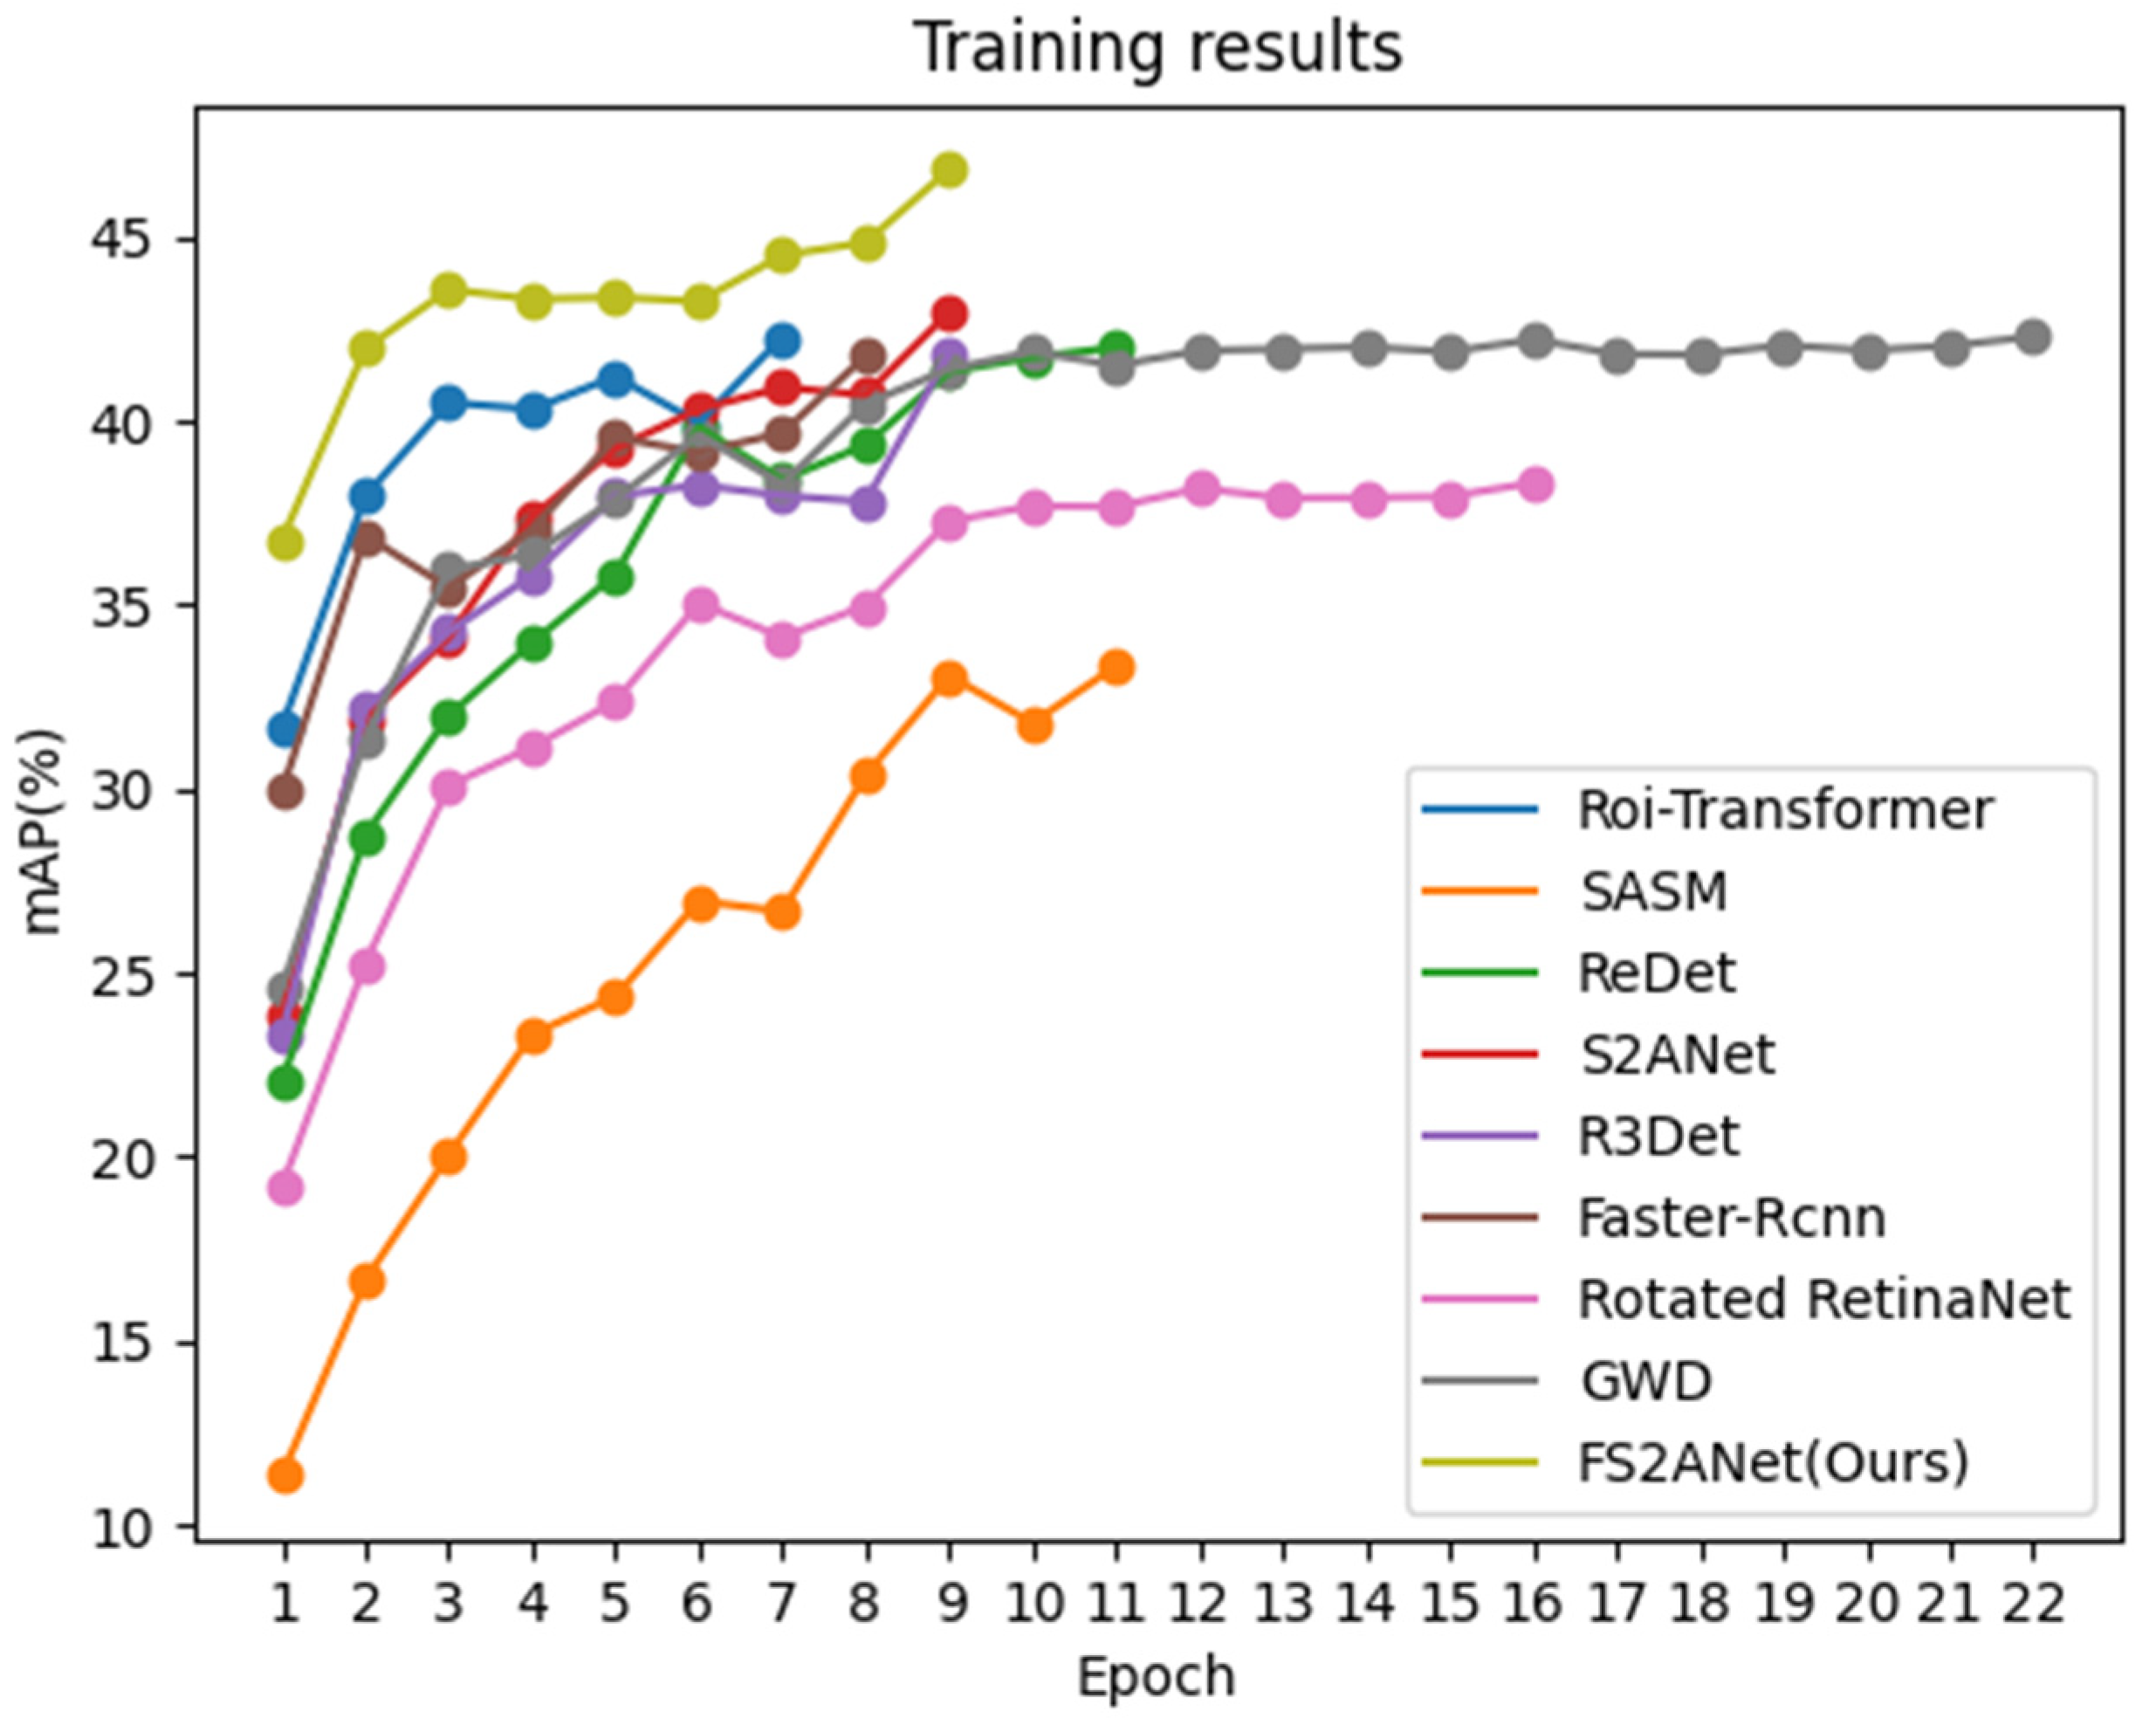
| FS2ANet (Ours) | 46.82 | 0.849 | 0.131 | 0.971 | 0.357 |
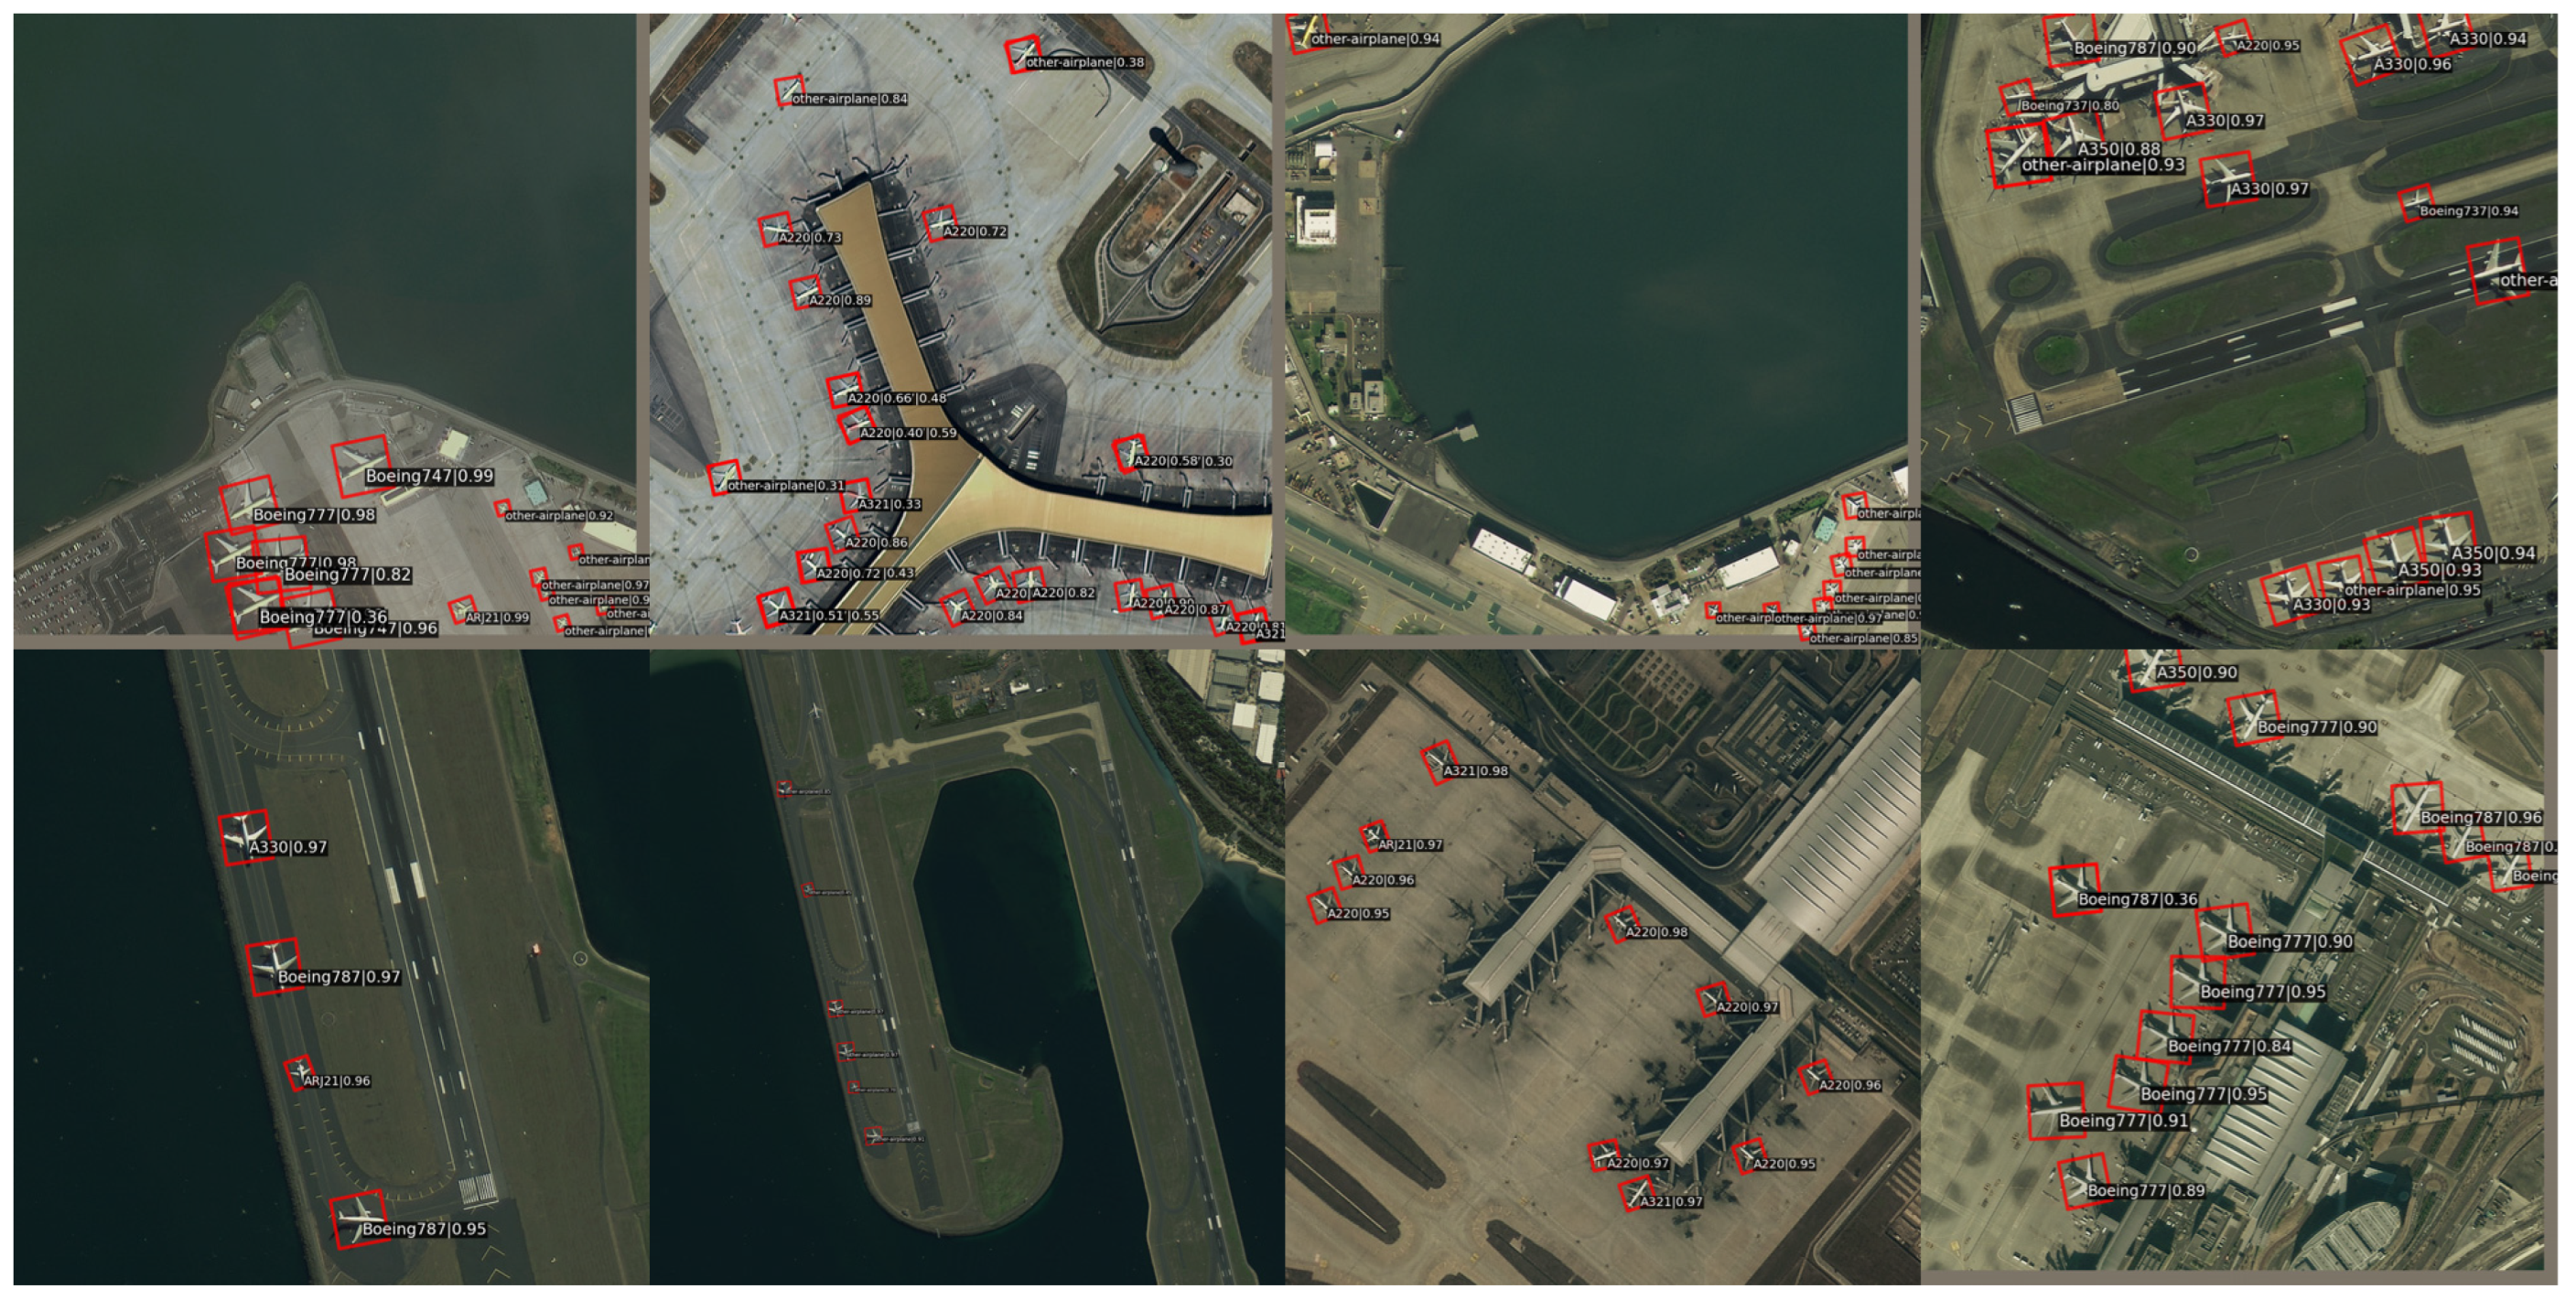
| S2ANet | FS2ANet | |||
|---|---|---|---|---|
| Class | Recall | AP | Recall | AP |
| Boeing737 | 0.97 | 0.386 | 0.948 | 0.427 |
| Boeing747 | 0.976 | 0.863 | 0.971 | 0.849 |
| Boeing777 | 0.968 | 0.141 | 0.845 | 0.219 |
| Boeing787 | 0.978 | 0.463 | 0.947 | 0.524 |
| ARJ21 | 0.839 | 0.11 | 0.552 | 0.131 |
| C919 | 0.679 | 0.003 | 0.357 | 0.189 |
| A220 | 0.977 | 0.446 | 0.969 | 0.471 |
| A321 | 0.97 | 0.608 | 0.944 | 0.584 |
| A330 | 0.958 | 0.393 | 0.874 | 0.452 |
| A350 | 0.925 | 0.583 | 0.919 | 0.576 |
| Other airplane | 0.953 | 0.728 | 0.940 | 0.727 |
| Algorithm | Backbone | Size | mAP0.5/% |
|---|---|---|---|
| Roi-Transformer | ResNet50 | 1024 × 1024 | 77.83 |
| SASM | ResNet50 | 1024 × 1024 | 77.65 |
| ReDet | ResNet50 | 1024 × 1024 | 78.21 |
| R3Det | ResNet50 | 1024 × 1024 | 76.50 |
| Faster-Rcnn | ResNet50 | 1024 × 1024 | 77.40 |
| Rotated RetinaNet | ResNet50 | 1024 × 1024 | 76.62 |
| GWD | ResNet50 | 1024 × 1024 | 77.87 |
| S2ANet | ResNet50 | 1024 × 1024 | 77.86 |
| FS2ANet (Ours) | ResNet50 | 1024 × 1024 | 78.40 |
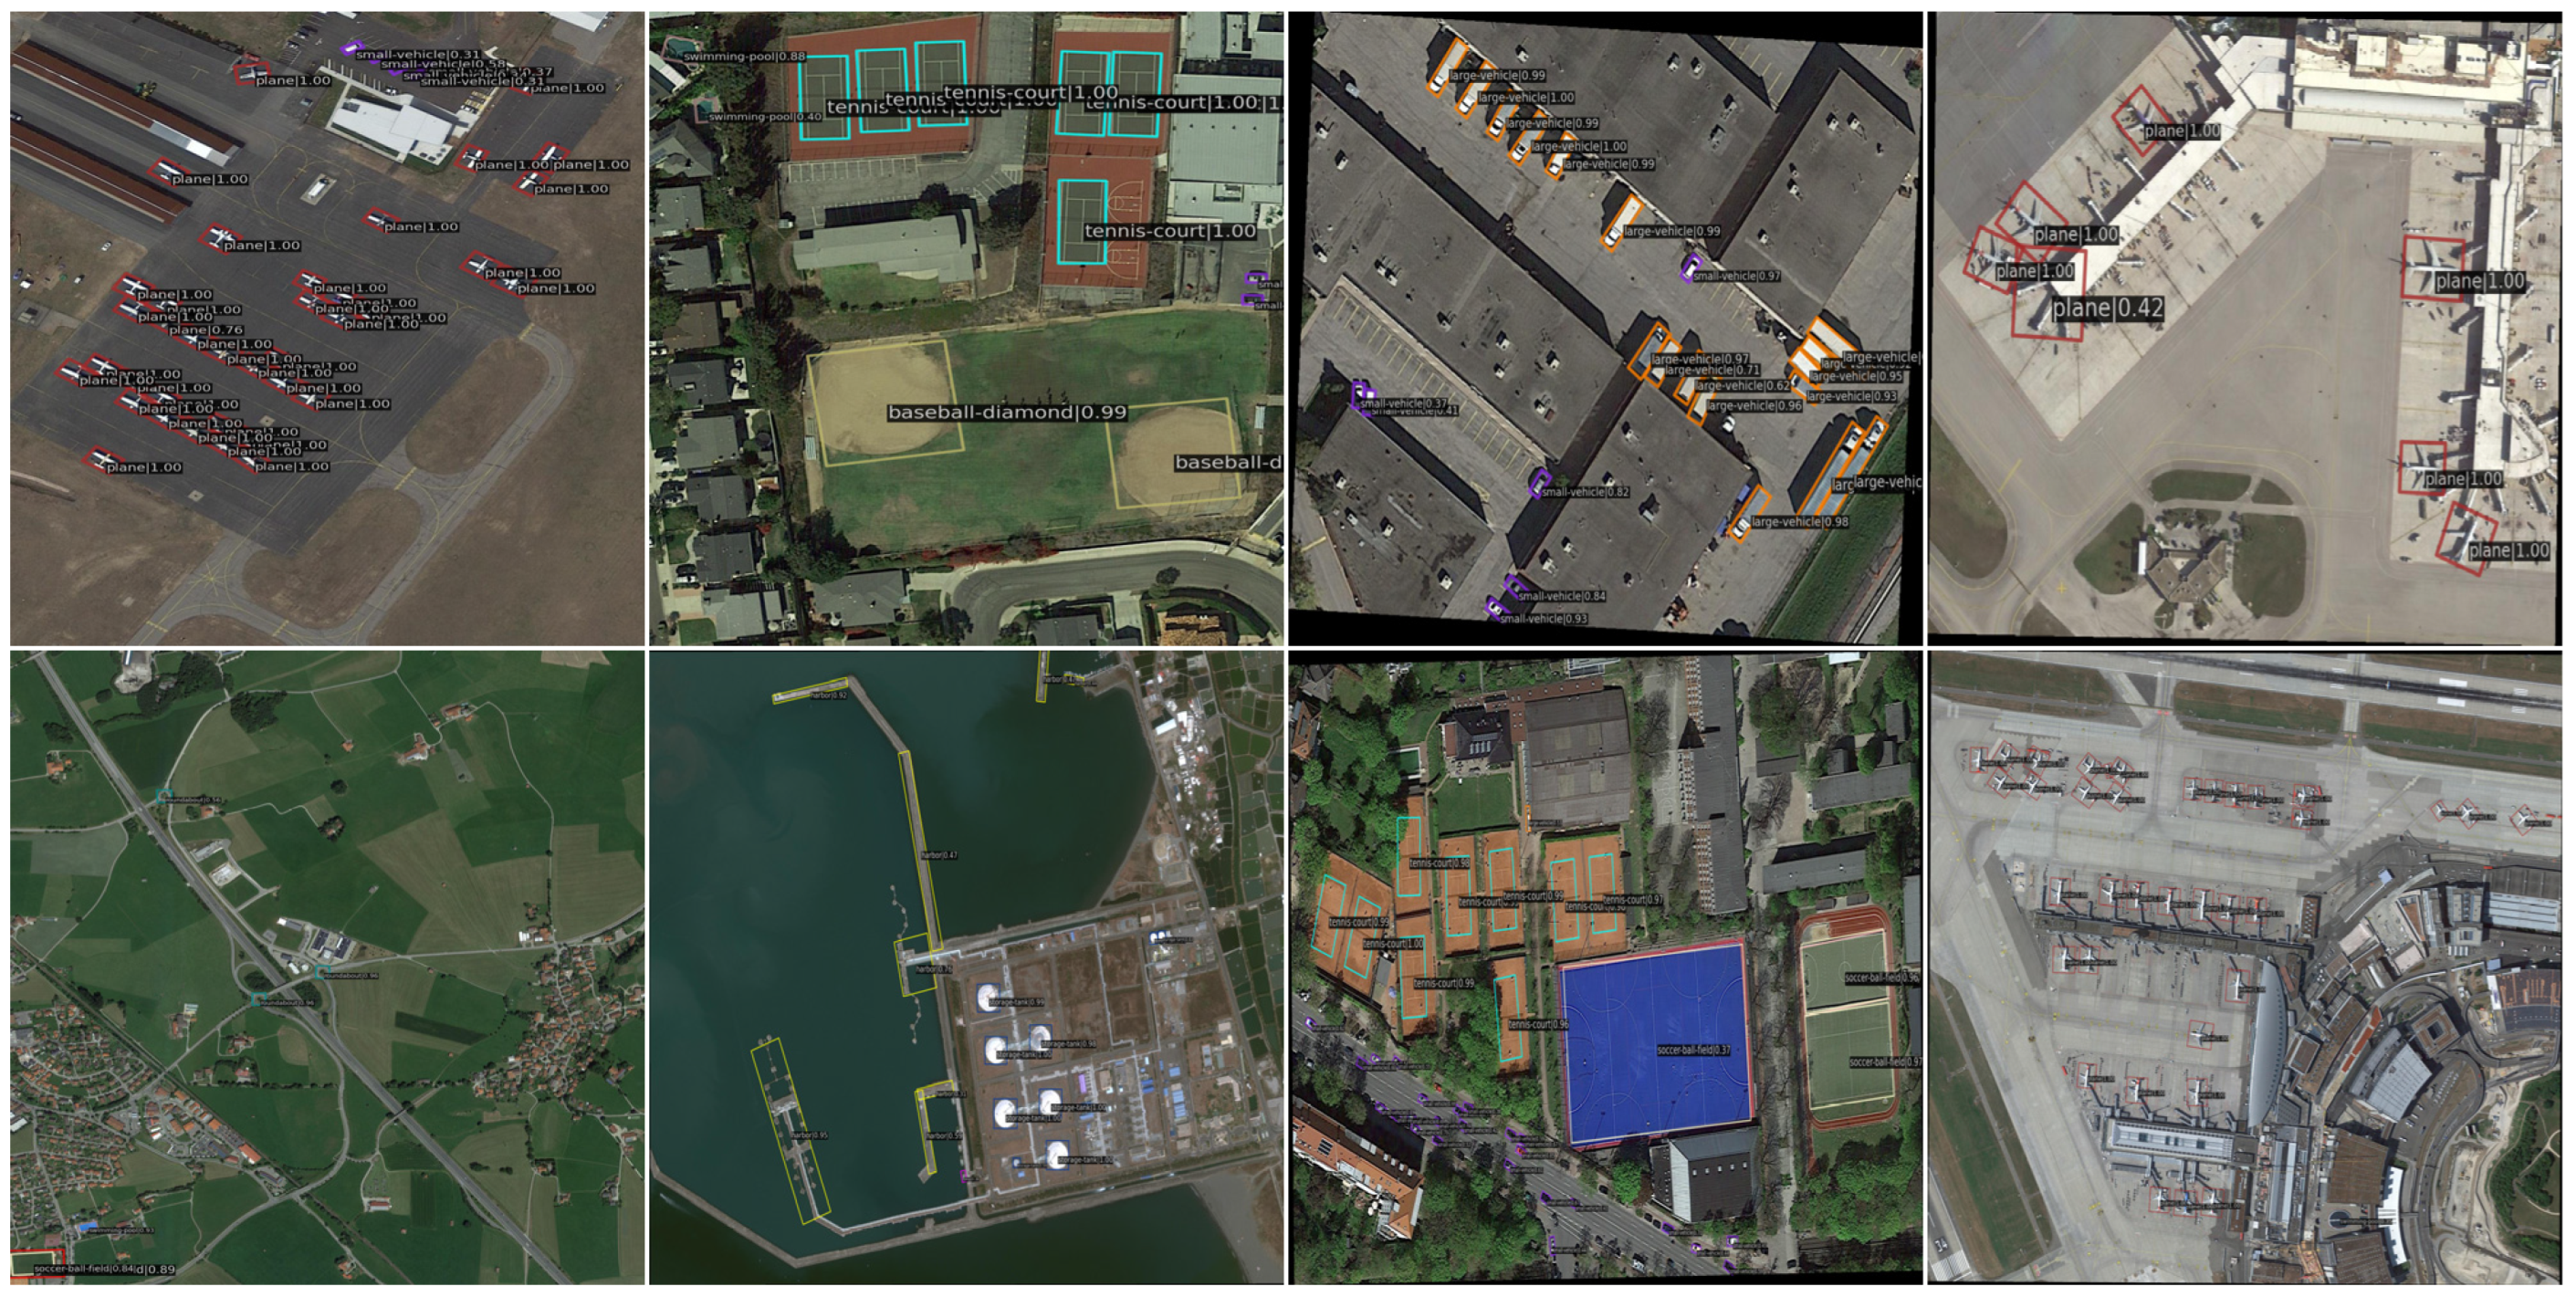
| Class | Gts | Dets | Recall | AP |
|---|---|---|---|---|
| plane | 4449 | 10,617 | 0.955 | 0.905 |
| ship | 18,537 | 39,330 | 0.955 | 0.895 |
| storage tank | 4740 | 14,108 | 0.822 | 0.780 |
| baseball diamond | 358 | 3277 | 0.936 | 0.842 |
| tennis court | 1512 | 6159 | 0.959 | 0.908 |
| basketball court | 266 | 4006 | 0.962 | 0.885 |
| ground track field | 212 | 3075 | 0.863 | 0.721 |
| harbor | 4167 | 24,890 | 0.864 | 0.779 |
| bridge | 785 | 10,254 | 0.783 | 0.622 |
| large vehicle | 8819 | 47,535 | 0.942 | 0.867 |
| small vehicle | 10,579 | 71,087 | 0.864 | 0.717 |
| helicopter | 122 | 6040 | 0.869 | 0.700 |
| roundabout | 275 | 2752 | 0.909 | 0.795 |
| soccer field | 251 | 3754 | 0.837 | 0.670 |
| swimming pool | 732 | 5639 | 0.816 | 0.674 |
| Algorithm | Data Augmentation | ResNet101 | AF3M | KFIoU | FPN-SPD | mAP0.5 (%) |
|---|---|---|---|---|---|---|
| S2ANet | 42.95 | |||||
| S2ANet+Data enhancement | √ | 45.3 (+2.35) | ||||
| S2ANet+ResNet101 | √ | 44.1 (+1.15) | ||||
| S2ANet+AF3M | √ | 44.21 (+1.26) | ||||
| S2ANet+KFIoU | √ | 43.46 (+0.51) | ||||
| S2ANet+FPN-SPD | √ | 43.53 (+0.58) | ||||
| S2ANet+AF3M+FPN-SPD | √ | √ | 44.52 (+1.57) | |||
| S2ANet+AF3M+KFIoU | √ | √ | 44.55 (1.6) | |||
| S2ANet+KFIoU+FPN-SPD | √ | √ | 43.81 (+0.86) | |||
| S2ANet+AF3M+KFIoU+FPN-SPD | √ | √ | √ | 44.8 (+1.85) | ||
| FS2ANet (Ours) | √ | √ | √ | √ | √ | 46.82 (+3.87) |
Disclaimer/Publisher’s Note: The statements, opinions and data contained in all publications are solely those of the individual author(s) and contributor(s) and not of MDPI and/or the editor(s). MDPI and/or the editor(s) disclaim responsibility for any injury to people or property resulting from any ideas, methods, instructions or products referred to in the content. |
© 2023 by the authors. Licensee MDPI, Basel, Switzerland. This article is an open access article distributed under the terms and conditions of the Creative Commons Attribution (CC BY) license (https://creativecommons.org/licenses/by/4.0/).
Share and Cite
Guan, Q.; Liu, Y.; Chen, L.; Zhao, S.; Li, G. Aircraft Detection and Fine-Grained Recognition Based on High-Resolution Remote Sensing Images. Electronics 2023, 12, 3146. https://doi.org/10.3390/electronics12143146
Guan Q, Liu Y, Chen L, Zhao S, Li G. Aircraft Detection and Fine-Grained Recognition Based on High-Resolution Remote Sensing Images. Electronics. 2023; 12(14):3146. https://doi.org/10.3390/electronics12143146
Chicago/Turabian StyleGuan, Qinghe, Ying Liu, Lei Chen, Shuang Zhao, and Guandian Li. 2023. "Aircraft Detection and Fine-Grained Recognition Based on High-Resolution Remote Sensing Images" Electronics 12, no. 14: 3146. https://doi.org/10.3390/electronics12143146