Article

MRLBot: Multi-Dimensional Representation Learning for Social Media Bot Detection

School of Cyber Science and Engineering, Sichuan University, Chengdu 610065, China
*
Author to whom correspondence should be addressed.
Electronics 2023, 12(10), 2298; https://doi.org/10.3390/electronics12102298
Submission received: 8 May 2023 / Accepted: 15 May 2023 / Published: 19 May 2023
(This article belongs to the Special Issue Artificial Intelligence Technologies and Applications)

Abstract

:
Social media bots pose potential threats to the online environment, and the continuously evolving anti-detection technologies require bot detection methods to be more reliable and general. Current detection methods encounter challenges, including limited generalization ability, susceptibility to evasion in traditional feature engineering, and insufficient exploration of user relationships. To tackle these challenges, this paper proposes MRLBot, a social media bot detection framework based on unsupervised representation learning. We design a behavior representation learning model that utilizes Transformer and a CNN encoder–decoder to simultaneously extract global and local features from behavioral information. Furthermore, a network representation learning model is proposed that introduces intra- and outer-community-oriented random walks to learn structural features and community connections from the relationship graph. Finally, the behavioral representation and relationship representation learning models are combined to generate fused representations for bot detection. The experimental results of four publicly available social network datasets demonstrate that the proposed method has certain advantages over state-of-the-art detection methods in this field.

1. Introduction

The advent of online social networks (OSNs) such as Twitter, Instagram, and Weibo has brought revolutionary advancements in communication tools, providing users with a novel means to create and disseminate personal content. With the growing influence of social networks, an increasing number of individuals and organizations are utilizing OSNs to accomplish their objectives. To fully leverage the power of social networks, it is necessary to have sufficient influence on these platforms, leading to the emergence of social media bots.
Social media bots (SMBs) are computer programs that generate content, engage in social interactions, online discussions, and other activities, with the aim of imitating human accounts. Research on SMBs has shown that a substantial proportion of English-speaking users on Twitter, ranging from 9% to 15%, display bot-like behavior. The estimated total number of bots on Twitter is approximately 8.5% of all users, equating to tens of millions [1]. SMBs can be categorized as benign, neutral, or malicious. Among these, malicious bots pose a significant threat to OSNs. Attackers typically control and direct malicious bots, planning and executing their attack behaviors. The presence and activities of malicious bots have a significant impact on specific topics and public opinions on the Internet. For instance, during the 2010 U.S. midterm elections, malicious bots infiltrated Twitter, promoting specific candidates and spreading rumors and misinformation about others [2]. Similar attacks were observed during the 2016 U.S. presidential election [3].
To mitigate the proliferation of malicious behaviors on OSNs, researchers have proposed various techniques for detecting and banning bot accounts. Nevertheless, attackers can reverse-engineer their bot accounts by exploiting existing detection methods to evade filtering by the platform. This constant cat-and-mouse game has rendered this field dynamic, thereby increasing the demands for the enhanced reliability and universality of new detection technologies. Currently, commonly used techniques for detecting SMBs are typically classified into two main types: graph-based, and node-based [4]. However, there are still several bottlenecks and challenges in this field, including the following:
  • The generalization ability of detection methods; existing detection models may only be applicable to particular OSNs, and their performance on other OSNs may be suboptimal,
  • Traditional feature engineering-based methods can be expensive and susceptible to evasion; the manual extraction of distinctive features to discern between malicious bots and legitimate users requires significant domain expertise and human resources. Moreover, when malicious bots enhance their anti-detection capabilities, the originally defined feature set may lose its effectiveness,
  • Insufficient exploration of user relationships; existing detection methods that rely on user relationships demand substantial time and computational resources. Furthermore, considering the privacy regulations of OSNs, potential features should be extracted from a restricted and accessible set of user relationships to the fullest extent feasible.
In order to tackle these challenges, this paper introduces a framework called MRLBot for detecting malicious bots in social networks using representation learning. The framework aims to model multi-dimensional information of user behaviors and relationships through automated feature extraction and the high generalization capability of general representation learning, ultimately accomplishing the detection task. The primary contributions of this paper are summarized as follows:
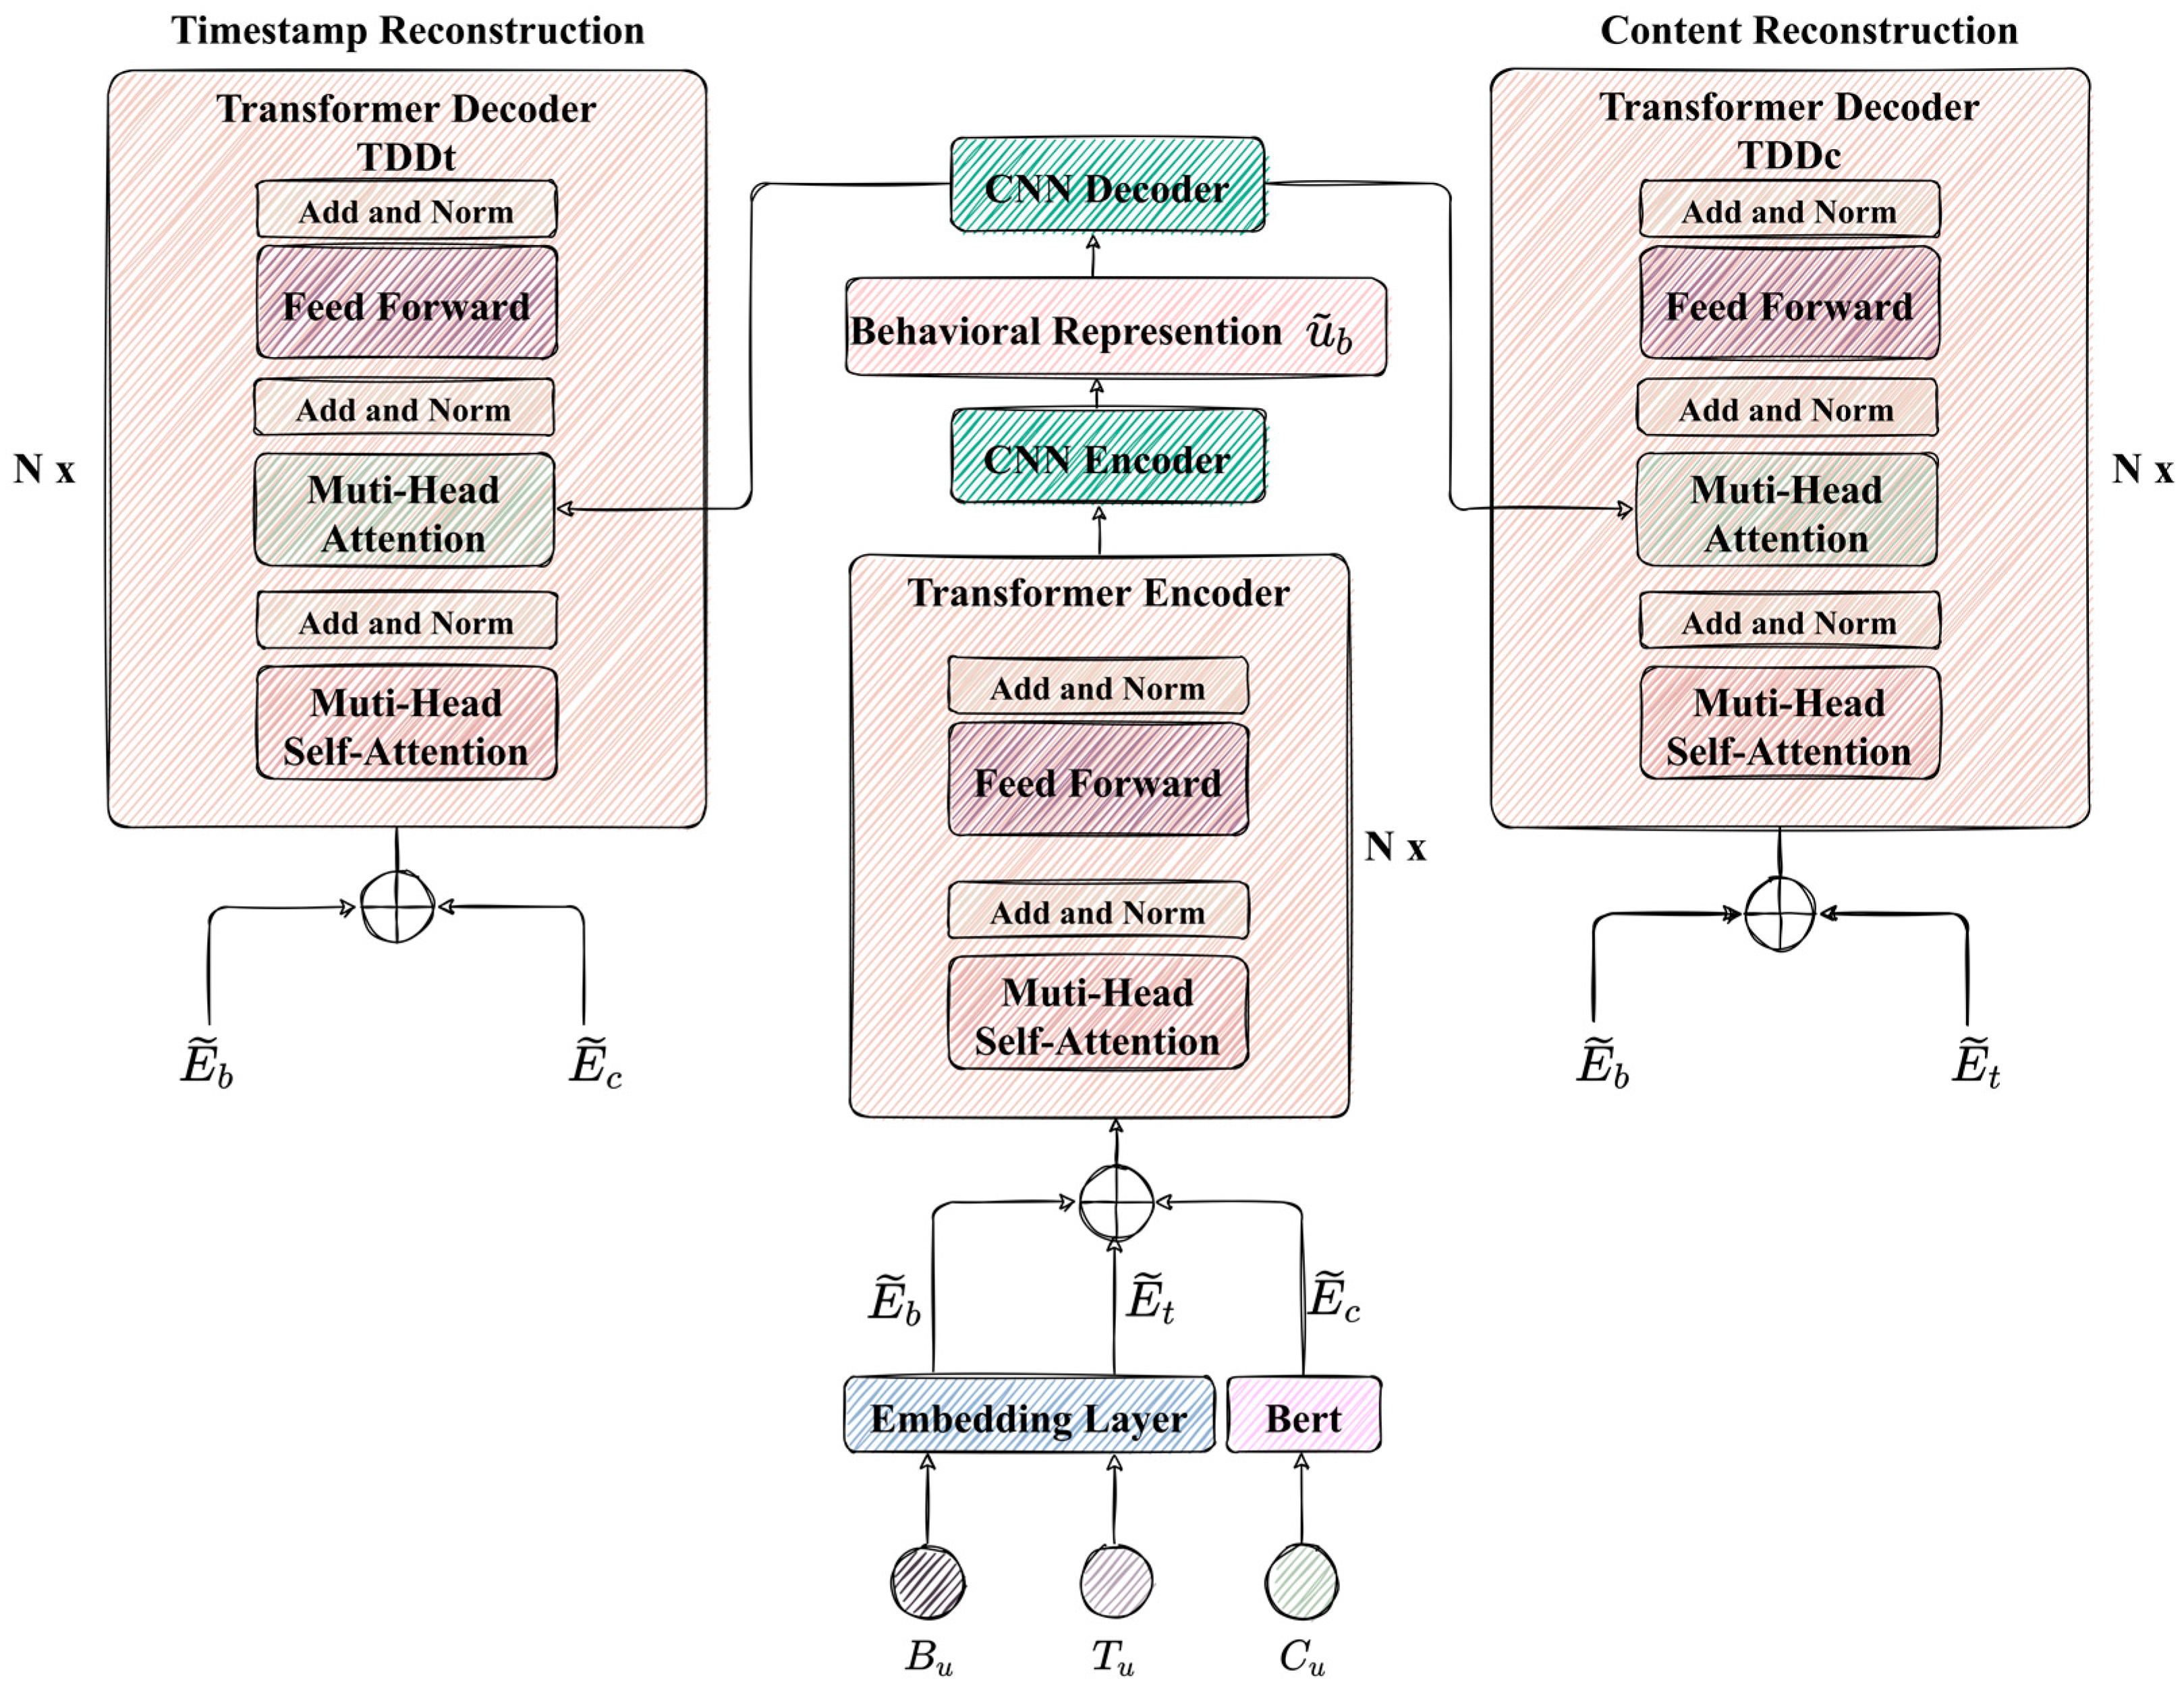
  • We propose a behavior representation learning model, DDTCN. The model abstracts user activities on social networks to obtain behavior sequences, which are then encoded using the contextual global feature extraction ability of Transformer for time series. A CNN encoder–decoder is subsequently cascaded to extract local information from the sequences. Additionally, the representation ability of the output vectors is enhanced through the proposed Transformer dual decoder;
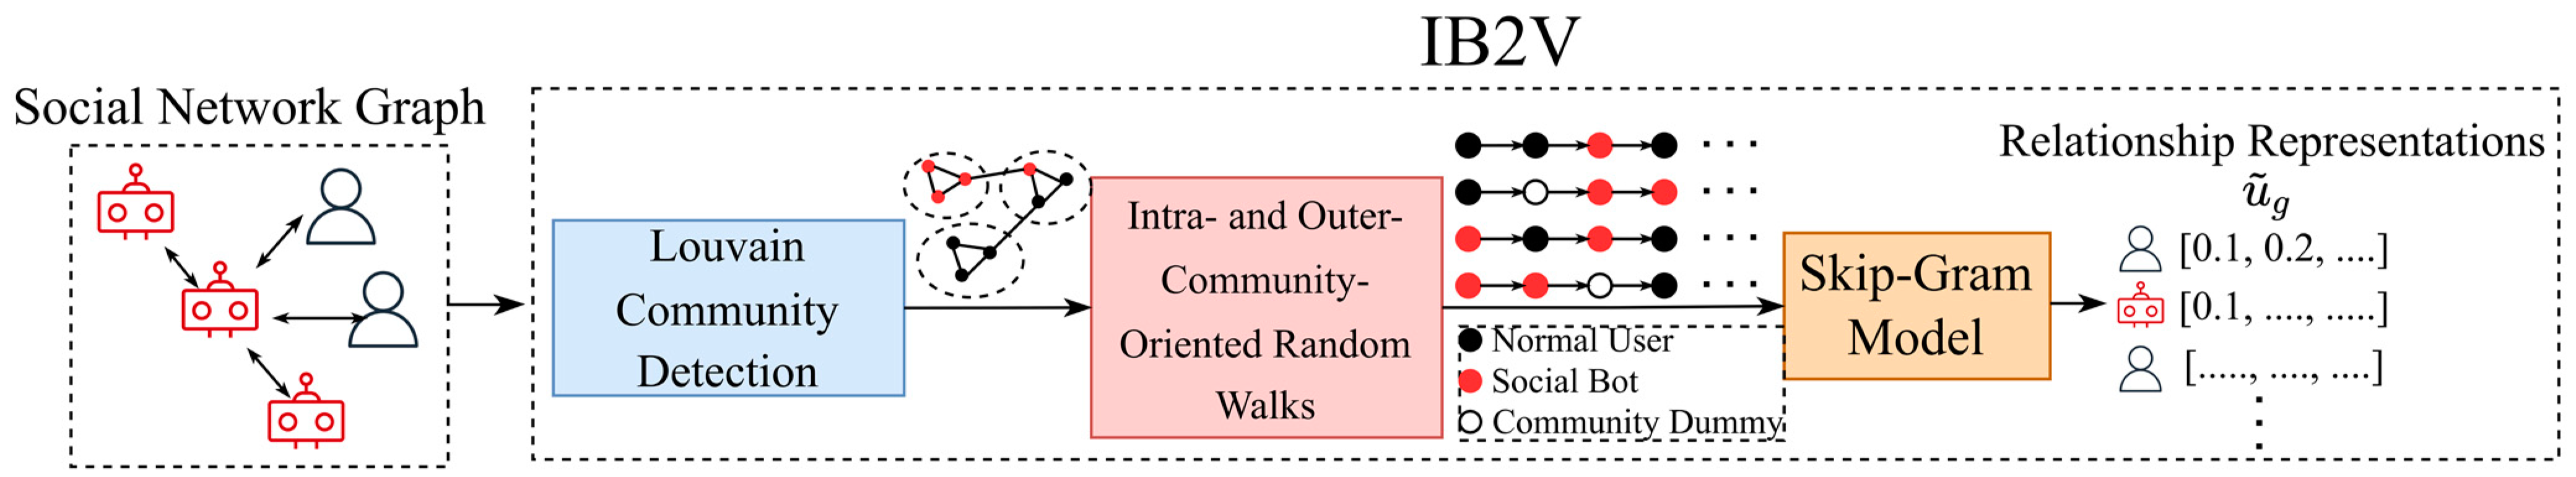
  • This paper presents a network representation learning model, IB2V, based on latent communities. Additionally, we propose an incremental learning strategy for large-scale network graphs to reduce the time cost of generating representations for newly added nodes, while maintaining the performance of the model. The model learns the structural features of node neighborhoods through a novel random walk algorithm, while also preserving the internal structure of communities and the correlations between them;
  • We design a generalized detection framework for various social network platforms, achieved through unified input from multiple platforms. The framework integrates components for behaviora; representation and relationship representation learning to generate fused representations, thereby enhancing detection performance.
In the rest of this paper, we conduct a comprehensive review of the relevant literature in Section 2. Section 3 provides a detailed overview of the preliminaries of user behaviors and relationships in social networks. Subsequently, in Section 4, we present the proposed MRLBot. In Section 5, we present the experimental results and corresponding analyses. Section 6 includes a review of the study’s findings, along with our directions for future research.

2. Related Works

2.1. Graph-Based Detection Approaches

A graph, G, in mathematical terms is a collection of vertices, V(G), and edges, E(G), that represent points connected in a plane or space. Graph structures are widely employed in diverse fields to represent pairwise relationships between objects. Early graph-based models for SMB detection were based on the architecture of the studied OSN and established user relationships. Feng et al. [5] constructed an undirected graph using the bidirectional follow relationship among target users, and then created a matrix of target users and their related users based on the Jaccard coefficient. Subsequently, the probability of a user being identified as a social bot was calculated based on the similarity between matrices. Dorri et al. [6] proposed SocialBotHunter, which was based on the isomorphism of social network graphs, where isomorphism suggests that two accounts may share similar attributes if they are associated in the social network. This model detected bots on Twitter by analyzing users’ social behaviors and interaction records. Abu-El-Rub et al. [7] employed a graph-based approach to model geographical information and clustered accounts based on graph structure and other collected information. Furthermore, Ahmad et al. [8] employed the unsupervised machine learning method to cluster graphs for bot detection by modeling social media data using a set of features and weighted graphs.
Extracting features from rich relational information in graph has long been a challenging problem. Recently, new research approaches have emerged, with a common method involving the transformation of topological and relational information into low-dimensional vectors, followed by training and inference using machine learning algorithms. Pham et al. [9] proposed a community-based random walk strategy that generates low-dimensional node representations while preserving local neighborhood relationships and intra-community structure. Magelinski et al. [10] utilized the graph neural network to extract latent local features of social network graphs by aggregating nodes along one-dimensional slices of the feature space, and then performed classification based on generated multi-channel histograms. Feng et al. [11] introduced a framework called BotRGCN, which constructs a relation-based heterogeneous graph and enhances the model’s ability to detect bots disguised as normal users by using multimodal user semantics and profiles. Building upon this, they considered varying relationship strengths between users in their recent work [12], and constructed a heterogeneous network with users as nodes and diverse relationships as edges.
However, in reality, OSNs are typically of massive scale, with some even having billions of user nodes. Consequently, most graph-based methods for detecting malicious SMBs in OSNs demand substantial training times and significant computing resources. Moreover, obtaining relationships for all users is highly challenging due to privacy constraints in OSNs, which impedes the further development of graph-based methods in this field.

2.2. Node-Based Detection Approaches

Most graph-based methods focus solely on the relationships between nodes, disregarding the valuable information contained within user nodes. Supervised machine learning is the prevailing method for node-based detection. These methods employ machine learning classifiers to detect malicious SMBs, treating the detection as binary classification and relying on a substantial amount of annotated data for training. Daouadi et al. [13] proposed an augmented set of features that leverage the interaction volume between accounts, combined with other features from previous research, to detect bot accounts on Twitter. Kudugunta et al. [14] employed the content of individual tweets and six account features to identify bots on Twitter. Wang et al. [15] hypothesized that tweets of social bots exhibit similarity due to shared goals among attackers, and utilized tweet similarity for detecting social bots on Twitter. Ping et al. [16] utilized CNN-LSTM to extract features from tweet content and metadata. Wei et al. [17] used the bidirectional long short-term memory (BiLSTM) network to capture features from tweets for classifying human and spam bots on Twitter. Stanton et al. [18] introduced a method called spamGAN that utilizes generative adversarial networks (GAN) to detect spam bots and enhance text classification accuracy in online comments with limited labeled data.
In addition to supervised learning, unsupervised machine learning methods have also been applied in this field. These methods do not rely on annotated data or unique features of individual accounts for classification purposes. Cresci et al. [19,20] extracted and analyzed digital DNA sequences from users’ online behaviors, and applied standard DNA analysis techniques to distinguish between legitimate accounts and spam accounts on the platform. Mazza et al. [21] collected a dataset of 10 million retweets and developed a novel visualization method to differentiate between benign and malicious retweet activities. They proposed an unsupervised bot detection technique called Retweet-Buster (RTbust), which utilizes feature extraction and clustering. Feng et al. [22] proposed a representation learning framework called SATAR for the unsupervised identification of bot accounts on Twitter. SATAR employs semantic, attribute, and neighborhood information about specific users for unsupervised pretraining on a large number of user samples to achieve generalization across different OSNs, and fine-tunes the model for adaptability to specific OSNs.
The majority of machine learning-based models for detecting malicious SMBs mentioned above focus on detecting at the user node, while disregarding the relationships between users and the structural information of the social graph. Moreover, these models are only applicable to OSNs with typical features. In different OSNs, users can perform varied actions, access personal information, and form relationships with other users, making it challenging to transfer feature sets or extraction methods proposed for a specific OSN to another. Additionally, behavioral patterns of malicious SMBs demonstrate high variability and diversity across different OSNs, which require increased demand for the generalizability of detection methods.

3. Preliminaries

This section presents definitions for “behavior” and “relationship” in social networks, and integrates input from various platforms to ensure the generalizability of the detection framework across different OSNs.

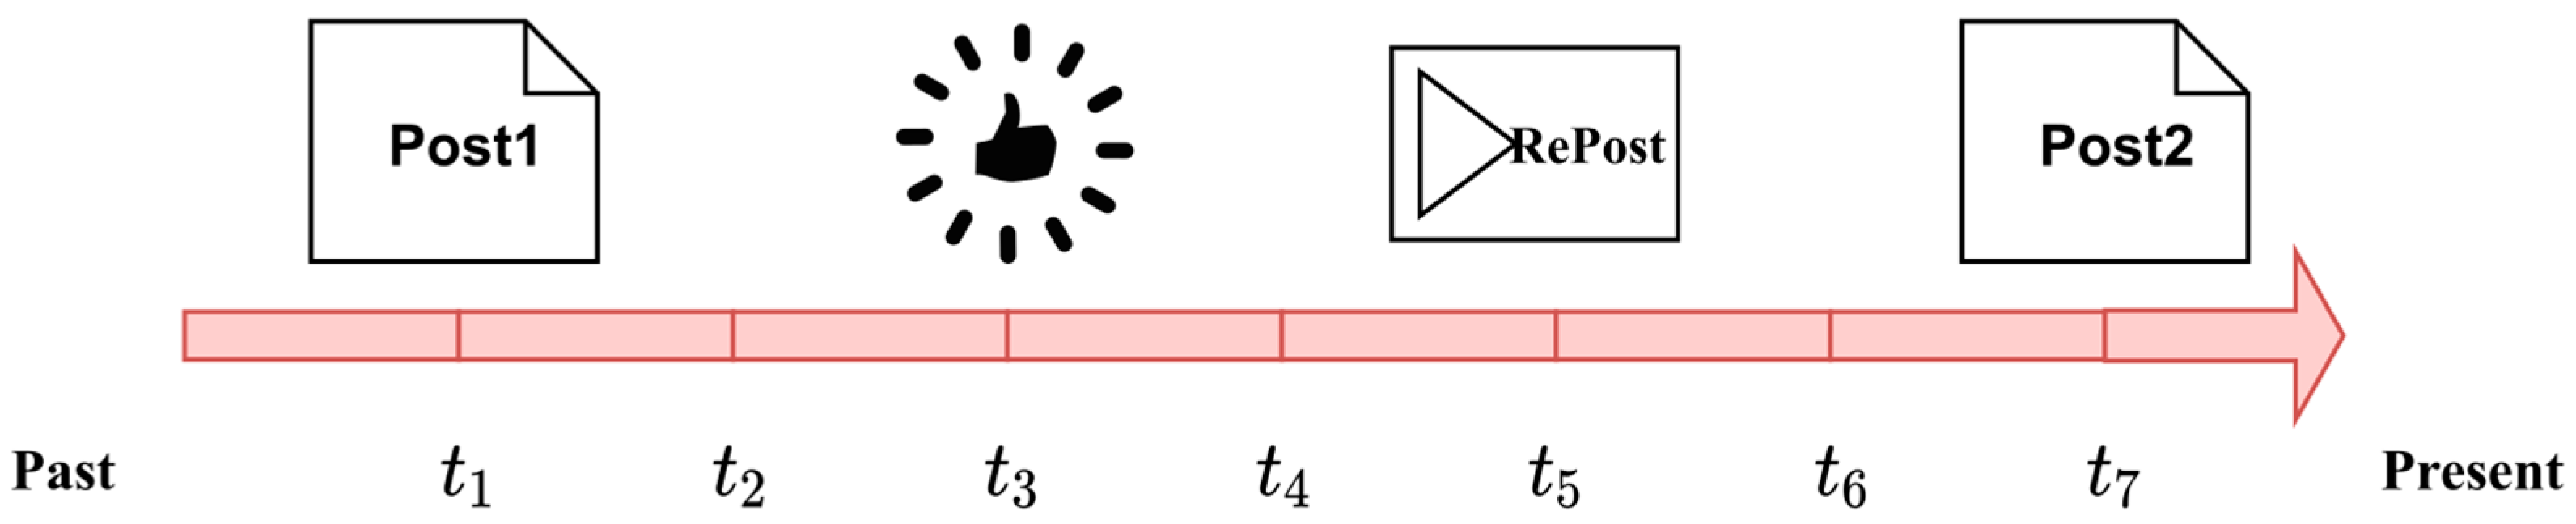
3.1. User Behaviors in Social Networks

Generally, social networks are commonly used by individuals to fulfill various needs, such as communication, information acquisition, and social interaction, among others. The actions of users in different OSNs such as those depicted in Figure 1 can be considered events that take place at different timestamps on a timeline, encompassing the diverse actions and interactions carried out by users at each timestamp.
The data generated from these behaviors contain valuable information that reflects the unique characteristics of users. Therefore, deep learning techniques can be utilized to analyze and model user behaviors, generating representation vectors that capture the behavioral patterns of users. By comparing and analyzing these representation vectors, it is possible to distinguish normal accounts from malicious SMBs.
We summarize the common actions performed by users in OSNs, including Post, Follow, Like, and Repost. The behavior of a user, u, on a social network can be defined by the behavior type sequence, B u , and the corresponding timestamp sequence, T u , both of which comprise a set number of operations.
B u = b u , 1 , b u , 2 , , b u , i , , b u , l 1 , b u , l
T u = t u , 1 , t u , 2 , , t u , i , , t u , l 1 , t u , l
B u represents the behavior type sequence for user u’s l actions, where b u , i P o s t ,   F o l l o w ,   L i k e ,   R e p o s t denotes the behavior type of the i-th action. T u is the timestamp sequence for each action of user u, where t u , i T represents the timestamp of the i-th action, and T represents the collection of all timestamps within the data collection period. To account for the temporal characteristics of user behavior, T u is arranged in an increasing sequence, with timestamps being sorted based on values, i.e., t u , i 1 t u , i t u , i + 1   1 i l 1 .
Posts or reposts generated by malicious SMBs often exhibit biased or directed characteristics and differ from the content posted by regular users. Therefore, the semantic features of these posts play a critical role in detecting malicious SMBs. Consequently, the content of posts should be incorporated as part of the definition of user behavior sequences. Specifically, the content sequence, C u , can be defined as follows:
C u = c u , 1 , c u , 2 , , c u , i , , c u , l 1 , c u , l
C u represents the posts published by user u during l actions, where c u , i denotes the content posted by user u in the i-th action. If no content is posted during a particular operation, c u , i is recorded as empty.

3.2. User Relationships in Social Networks

Social relationships among users in social networks can be integrated to form a social network graph. An OSN can be represented as a directed graph, G = V , E , where V and E denote sets of user nodes and relationship edges, respectively. However, due to the existence of different types of relationships and varying interaction frequencies among users, representing the relationship information among users in social networks with the directed graph is inadequate. To more accurately represent the strength of relationships between users, we propose assigning weights to the edges to create a directed weighted graph, G = V , E , W , where W denotes the set of edge weights. In this study, we categorize the strength of relationships into five levels: very weak, weak, medium, strong, and very strong. The allocation rules for relationship strength levels and corresponding weights, W i , are based on the assumption that relationship E i occurs k times from user V p to user V q , as shown in Table 1.

4. MRLBot: Methodology

This paper proposes a malicious SMB detection framework called MRLBot based on multi-dimensional representation learning, as depicted in Figure 2.
The framework consists of the following three steps:
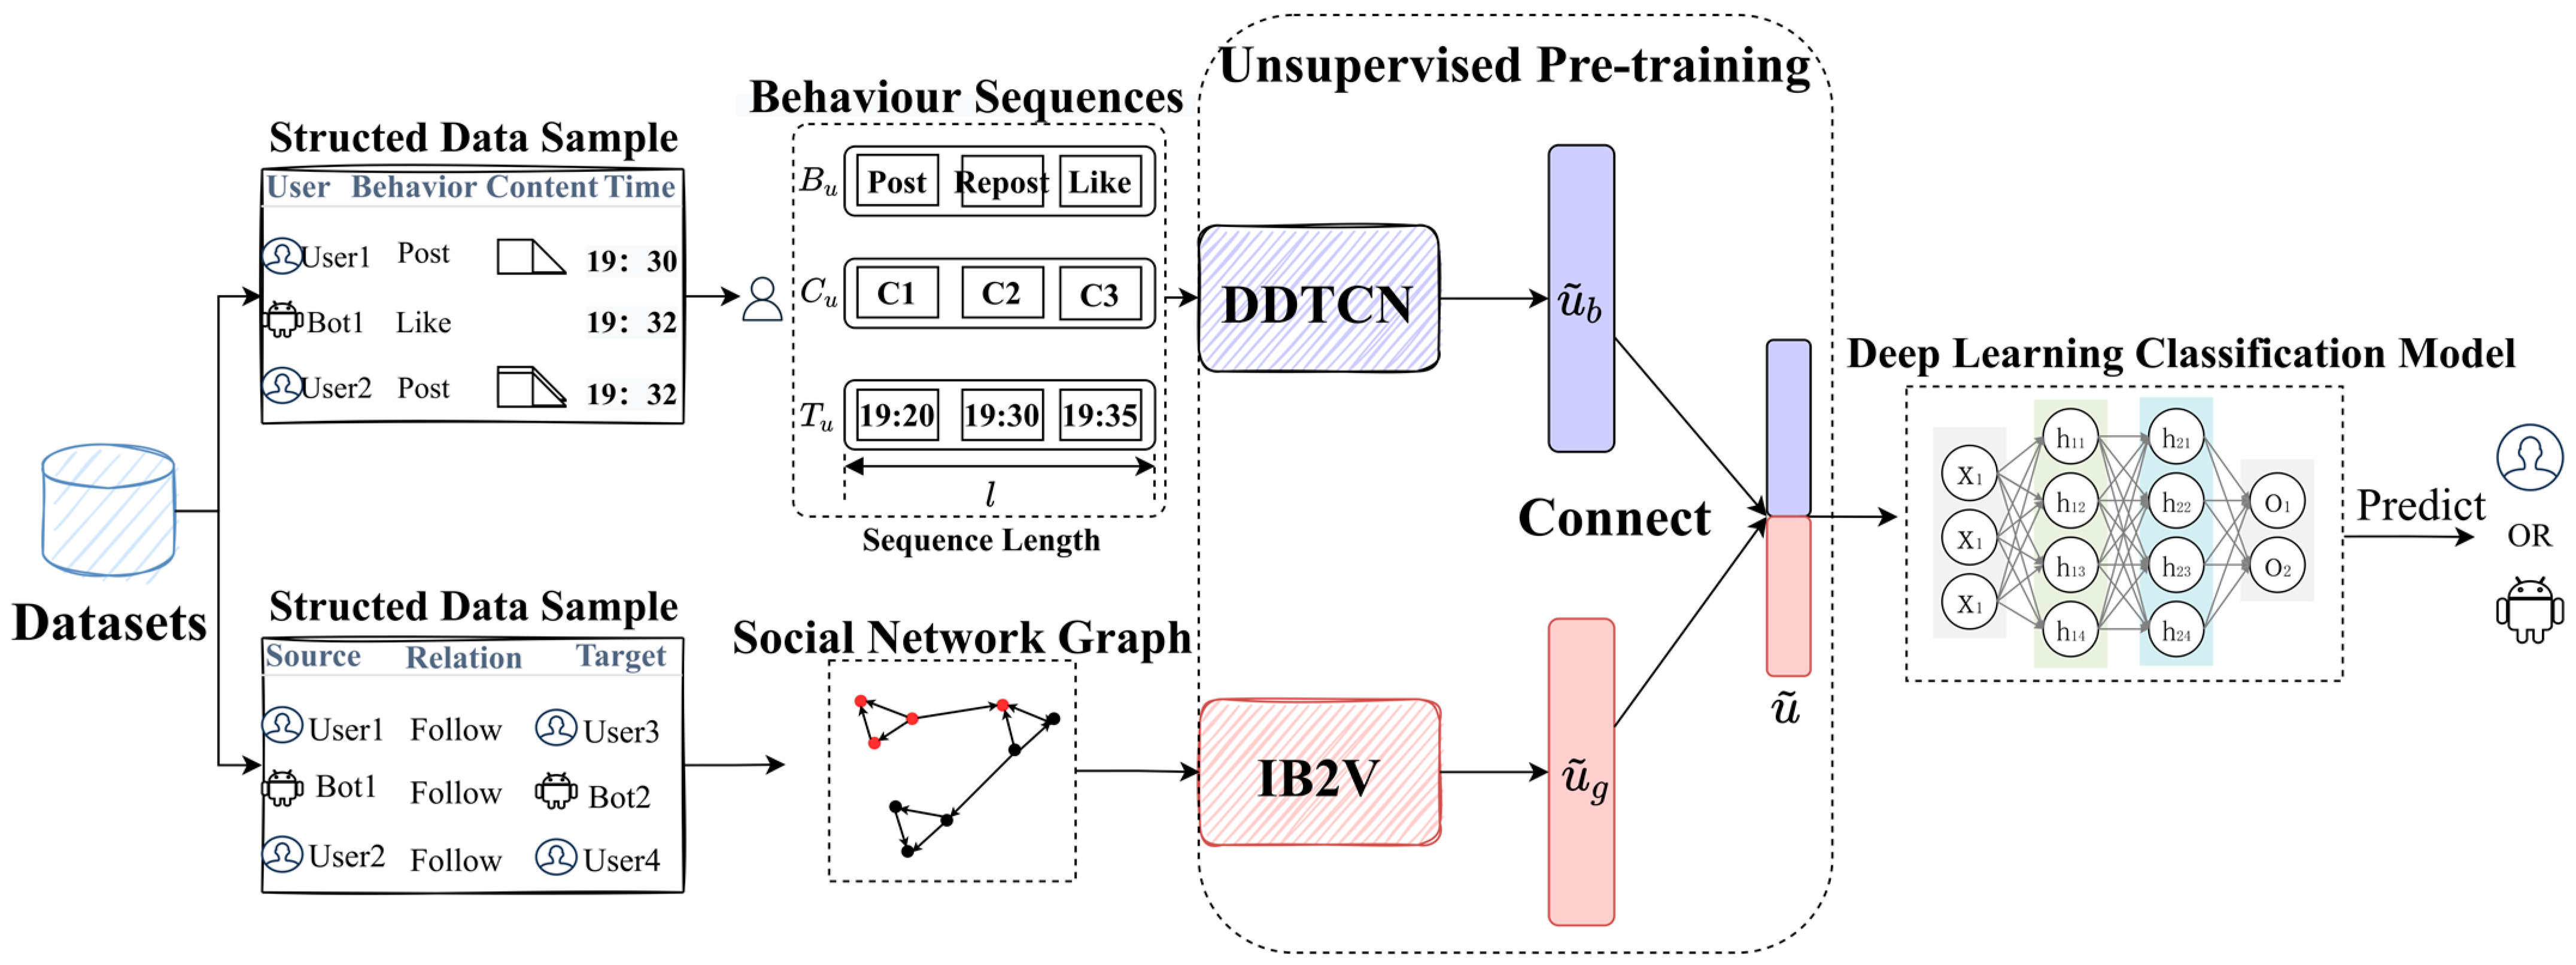
  • Data restructuration and preprocessing; due to potential differences in structured rules across diverse datasets, it is advisable to restructure the data for further preprocessing and expansion. The rules for data restructuration are formulated based on the user behaviors and relationships defined in Section 3.1 and Section 3.2. Each record in the table represents the behavior of each user or bot at a specific time point, including the behavior type and posted content, as well as interaction relationships. Preprocessing for the restructured data involves aggregating the records to generate user behavior sequences ( B u , C u , T u ), and to build the social network relationship graph, G = V , E , W , with a focus on each user and each relationship (source node and target node),
  • The generation and fusion of multi-dimensional user representations; the behavior sequences are input into the behavior representation learning model, DDTCN, and the directed weighted graph is input into the relationship representation learning model, IB2V. Through unsupervised learning, optimizers are performed separately to generate behavior representations and relationship representations that capture each user’s characteristics. Then, these two types of representations are concatenated to complete the fusion of multi-dimensional representations,
  • The training and detection of the deep learning classifier; a fully connected neural network is employed to construct the classifier, with the fused representations serving as input, to achieve an accurate detection framework. During the training process of the detection framework, hyperparameters are adjusted to ensure optimal performance. Additionally, a labeled dataset is utilized to train the classifier, facilitating the effective judgment and identification of malicious SMBs based on different user representations.

4.1. DDTCN: Behavioral Representation Learning Model

Traditional RNN structures are capable of analyzing high-frequency and uniform behavior information and exhibit limitations in handling low-frequency and un-uniform behaviors that evolve over time [23]. In contrast, Transformer structures have been shown to effectively model multiple sequences and generate meaningful contextual representations in temporal interaction data [24]. Inspired by this, we propose a Transformer-based behavioral representation learning model, named DDTCN, for modeling user behavior in social networks. The architecture of DDTCN is illustrated in Figure 3.
When considering behavior sequences in social networks, relying solely on Transformer may present limitations. To address this, DDTCN incorporates two optimizations based on Transformer:
  • Incorporating a CNN encoder–decoder concatenated with Transformer to capture both local and global information of user behavior simultaneously;
  • Adding a parallel decoder on top of Transformer to retain diverse information and further mitigate information loss during the generation of user behavior representations.
DDTCN encodes different types of sequences at the input layer and merges them together. The original input sequences are encoded using embedding layers, including a behavior type-embedding matrix, M b B × d , and time-embedding matrix, M t T × d , where d is the dimension of the projection vectors, B denotes the number of behavior types, and T is the number of timestamps. By performing a look-up table, input embeddings for B u and T u are obtained, denoted as E ˜ b l × d and E ˜ t l × d , respectively:
E ˜ b = e b , 1 , e b , 2 , , e b , i , , e b , l 1 , e b , l
E ˜ t = e t , 1 , e t , 2 , , e t , i , , e t , l 1 , e t , l
where e b , i d is the embedding of b u , i , and e t , i d is the embedding of t u , i .
As the length of each content in the content sequence, C u , may be different, it is necessary to encode each text to align its dimension with the embeddings of other sequences ( E ˜ a and E ˜ t ), while preserving its semantic features. To achieve this, we utilize the pre-trained BERT [25] model to encode C u and obtain the content embeddings E ˜ c l × d :
E ˜ c = e c , 1 , e c , 2 , , e c , i , , e c , l 1 , e c , l
where e c , i d is the embedding of c u , i after encoding with BERT.
Based on the embeddings defined above, the input of the Transformer encoder can be defined as E ˜ I l × d :
E ˜ I = E ˜ b + E ˜ c + E ˜ t

4.1.1. Transformer Encoder

The Transformer encoder is the key component of our model, responsible for fusing and compressing different types of information. The Transformer encoder is composed of two components: the multi-headed self-attention mechanism (MHSA) and the feedforward network (FFN). The MHSA can capture valid information from a variety of subspaces, while the MHSA is defined explicitly as follows:
M H S A X n = C o n c a t h e a d 1 , h e a d 2 , , h e a d h W O
h e a d i = A t t e n t i o n X n W i Q , X n W i K , X n W i V
where X n is the input to n -th layer of the Transformer encoder, i.e., X 1 = E ˜ I when n = 1 . The projection matrices W i Q d × d / h , W i K d × d / h , W i V d × d / h , and W O d × d represent the parameters that can be learned in each attention head in the MHSA. In this paper, the scaled dot product is used as the formula for attention, defined as follows:
A t t e n t i o n Q , K , V = s o f t m a x Q K d / h V
where Q = X n W i Q , K = X n W i K , and V = X n W i V . Additionally, d / h is the scaling factor that prevents the inner product ( Q K ) from becoming excessively large.
Additionally, we provide MHSA with the nonlinear characteristic using a feedforward network, which is defined as follows:
F N X ˜ n = L e a k y R e L U X ˜ n W 1 F + b 1 F W 2 F + b 2 F
where W 1 F , W 2 F , b 1 F , and b 2 F are all trainable parameters in FFN, and L e a k y R e L U is the activation function.
Through the residual structure, the final output at the n -th layer of the Transformer encoder is X n + 1 l × d :
X n + 1 = L a y e r N o r m F F N X ˜ n + X ˜ n

4.1.2. CNN Encoder–Decoder

Peng et al. [26] proposed that the cascaded multi-head self-attention (MHSA) in Transformer can capture long-range feature dependencies. However, it may suffer from the loss of local feature information. In contrast, CNN convolutional operation excels at extracting local features but struggles to capture global features simultaneously. Relying solely on MHSA to focus on global user behavior representations may overlook the active state during specific periods. Therefore, taking these factors into consideration, we design a cascaded CNN encoder–decoder to capture important local information in behavior sequences.
Based on TextCNN [27], we have developed a CNN encoder–decoder that consists of a CNN encoder and a CNN decoder. The CNN encoder comprises a two-dimensional convolutional layer, a one-dimensional max pooling layer, and a fully connected layer. The size of the convolutional kernel, k w ,   k e , can be adjusted to capture specific lengths of continuous information. Meanwhile, to ensure coverage of the sequence embeddings, the dimension of the convolutional kernel is set to be the same as the embedding dimension, i.e., k e = d . The dimension of the max pooling layer is also set to match the feature map generated by the convolutional kernel, which reduces the model parameter size through downsampling to alleviate the overfitting. Finally, the fully connected layer compresses the feature map and generates the user behavior representation, u ˜ b . The definition of the CNN encoder is as follows:
u ˜ b = M a x p o o l C o n v N e t X u ; k w ,   k e , Θ W C E + b C E
where X u is the output of the Transformer encoder, k w ,   k e and Θ represent the parameters of the CNN encoder, and W C E and b C E are the parameters of the linear layer.
In the CNN decoder, u ˜ b is used to reconstruct the input, X u , of the CNN encoder, in preparation for the reconstruction task in the Transformer decoder. Corresponding to the encoder, the CNN decoder begins with a fully connected layer, followed by an upsampling layer to recover information lost due to max pooling. Finally, a two-dimensional transposed convolutional layer is connected to restore the convolutional operation of the encoder. The definition of the CNN decoder is as follows:
X u = C o n v T r a n s N e t U p s a m p l e W C D u ˜ b + b C E
where W C D and b C D are the parameters of the linear layer.

4.1.3. Transformer Dual Decoder

Typically, research involving the encoder–decoder structure (autoencoder) employs only one unsupervised reconstruction task to train the model. To minimize information loss during the compression, our method incorporates parallel reconstruction tasks. Specifically, E ˜ b and E ˜ c are used as the Query to reconstruct the timestamp embeddings, E ˜ t , in addition to reconstructing E ˜ c for retaining the feature of contents. The parallel reconstruction tasks endow the generated representations with the ability to recover diverse types of data, thereby enhancing the feature extraction capability of the autoencoder.
As the conventional Transformer decoder lacks the capability to perform parallel reconstruction tasks, we design the Transformer dual decoder (TDD) with two decoders: TDDc, which reconstructs E ˜ c , and TDDt, which reconstructs E ˜ t . Considering model complexity and computation time, we do not reconstruct E ˜ b . The reconstructions of E ˜ c and E ˜ t are defined as follows in the formulas:
D ˜ c n = L a y e r N o r m M H A T D D c D c n + D c n
D ˜ t n = L a y e r N o r m M H A T D D t D t n + D t n
E ˜ c = L a y e r N o r m F F N T D D c D ˜ c n + D ˜ c n
E ˜ t = L a y e r N o r m F F N T D D t D ˜ t n + D ˜ t n
where MHA and FFN represent the formulas for the multi-head attention mechanism and feedforward network in Transformer. D c n is the input to the n-th layer of TDDc, and when n = 1 , D c 1 = E ˜ b + E ˜ t . D t n denotes the input to the n-th layer of TDDt, and when n = 1 , D t 1 = E ˜ b + E ˜ c . Lastly, E ˜ c and E ˜ t serve as the final outputs of the dual decoders, which are the reconstructions of the content embeddings, E ˜ c , and the timestamp embeddings, E ˜ t , respectively.
To minimize information loss and enhance feature extraction performance, the restoration of E ˜ c and E ˜ t to C u and T u is considered. Since T u is encoded using a lookup table in the embedding layer, the changing weights of the embedding layer during training may cause loss of information in E ˜ t . If only the differences between E ˜ t and E ˜ t are compared, the reconstructed information may not match the original sequence. Therefore, the most probable time-reconstructed sequence, T u , can be calculated by reverse computation using M t and the softmax layer:
T u = s o f t m a x E ˜ t M t
In contrast, C u is encoded using the pre-trained BERT model. Additionally, to retain its semantic features, the parameters in BERT are fixed during training, meaning that the embedding vectors in E ˜ c remain unchanged. Hence, the differences between E ˜ c and E ˜ c can be directly calculated to assess the model’s ability to reconstruct contents.

4.1.4. Optimization Objectives

The DDTCN model adopts a multi-task joint training strategy. Specifically, the model uses two reconstruction tasks to achieve unsupervised training of the encoder–decoder structure, as outlined in Algorithm 1.
Algorithm 1: Training algorithm of DDTCN
  • Input: Behavior type sequences, B u u U , timestamp sequences, T u u U , content sequences, C u u U , the length of user behavior sequences, l , the dimension of embeddings, d , and the dimension of user behavior representations, e , for the users in U .
  • Output: The learned user behavioral representations, u ˜ b u U .
  • Randomly initialize the parameters in DDTCN;
  • For  u = 1 U   carry out
  • Project the input series, obtain behavior type embeddings, E ˜ b , time embeddings, E ˜ t and content embeddings, E ˜ c ;
  • Set input embeddings, E ˜ I , through Equation (7);
  • Learn the user behavioral representation, u ˜ b , from the Transformer and CNN encoder–decoder;
  • Learn the content sequence reconstruction, E ˜ c , and the time sequence reconstruction, T u , using Equations (17) and (19);
  • Perform SGD based on Equation (24) to reduce the error in the reconstruction and improve the behavioral representation’s performance;
  • End
Following the reconstruction tasks described in Section 4.1.2, the Softmax cross-entropy (SCE) loss function is employed to calculate L t i m e for time sequence reconstruction. Additionally, the mean squared error (MSE) loss function is employed to calculate L c o n t e n t for content sequence reconstruction:
L S C E y ^ , y = 1 y log [ softmax y ^ ]
L M S E y ^ , y = 1 n i = 0 n y ^ i y i 2
L t i m e = L S C E T u , T u
L c o n t e n t = 1 l k = 1 l L M S E e c , k ^ , e c , k
where L S C E is the calculation formula for SCE, 1 y denotes the one-hot encoding of the true label y, and y ^ is the predicted value. L M S E is the calculation formula for MSE. When calculating L c o n t e n t , since the dimensions of E ˜ and E ˜ c are both l × d , the specific calculation method for the loss value is to compute the mean squared error for each embedding vector, and then to take the average of the losses for all embedding vectors. The loss function of the entire model encompasses both L t i m e and L c o n t e n t , and they are combined by summing up the loss values to define L m a i n as follows:
L m a i n = L t i m e + L c o n t e n t
where L m a i n serves as the loss function for the entire model, accounting for the losses incurred in both the time reconstruction and content reconstruction.

4.2. IB2V: Relationship Representation Learning Model

According to the research by Pham et al. [9] (Bot2Vec), in various OSNs, normal users or bots tend to interact with other users who belong to their shared social circles. Typically, botnets managed by attackers establish relationships with each other and maintain interaction frequency to disguise themselves as normal users for evading detection. These social circles can be considered potential communities within the network graph, and by utilizing community information and its internal structural features, it is possible to differentiate between normal users and bots.
Based on prior work on network representation learning and Bot2Vec, we have developed a novel relationship network representation learning model called IB2V (Incremental Bot2Vec), as shown in Figure 4. The main focus of IB2V is to characterize the relationships among users and embed the user nodes from the network graph into low-dimensional vectors using unsupervised learning. Once potential communities are identified in the graph, we employ a strategy that combines breadth-first sampling and depth-first sampling to generate context neighborhoods for each node. Meanwhile, in order to preserve the internal structure of each community, transfer probabilities are designed to restrict the neighborhood set to remain within the community. By acquiring the neighborhood relationships of user nodes and preserving the internal structure of communities, node representations are generated. In order to enhance the performance and usability of the model, IB2V introduces two optimizations:
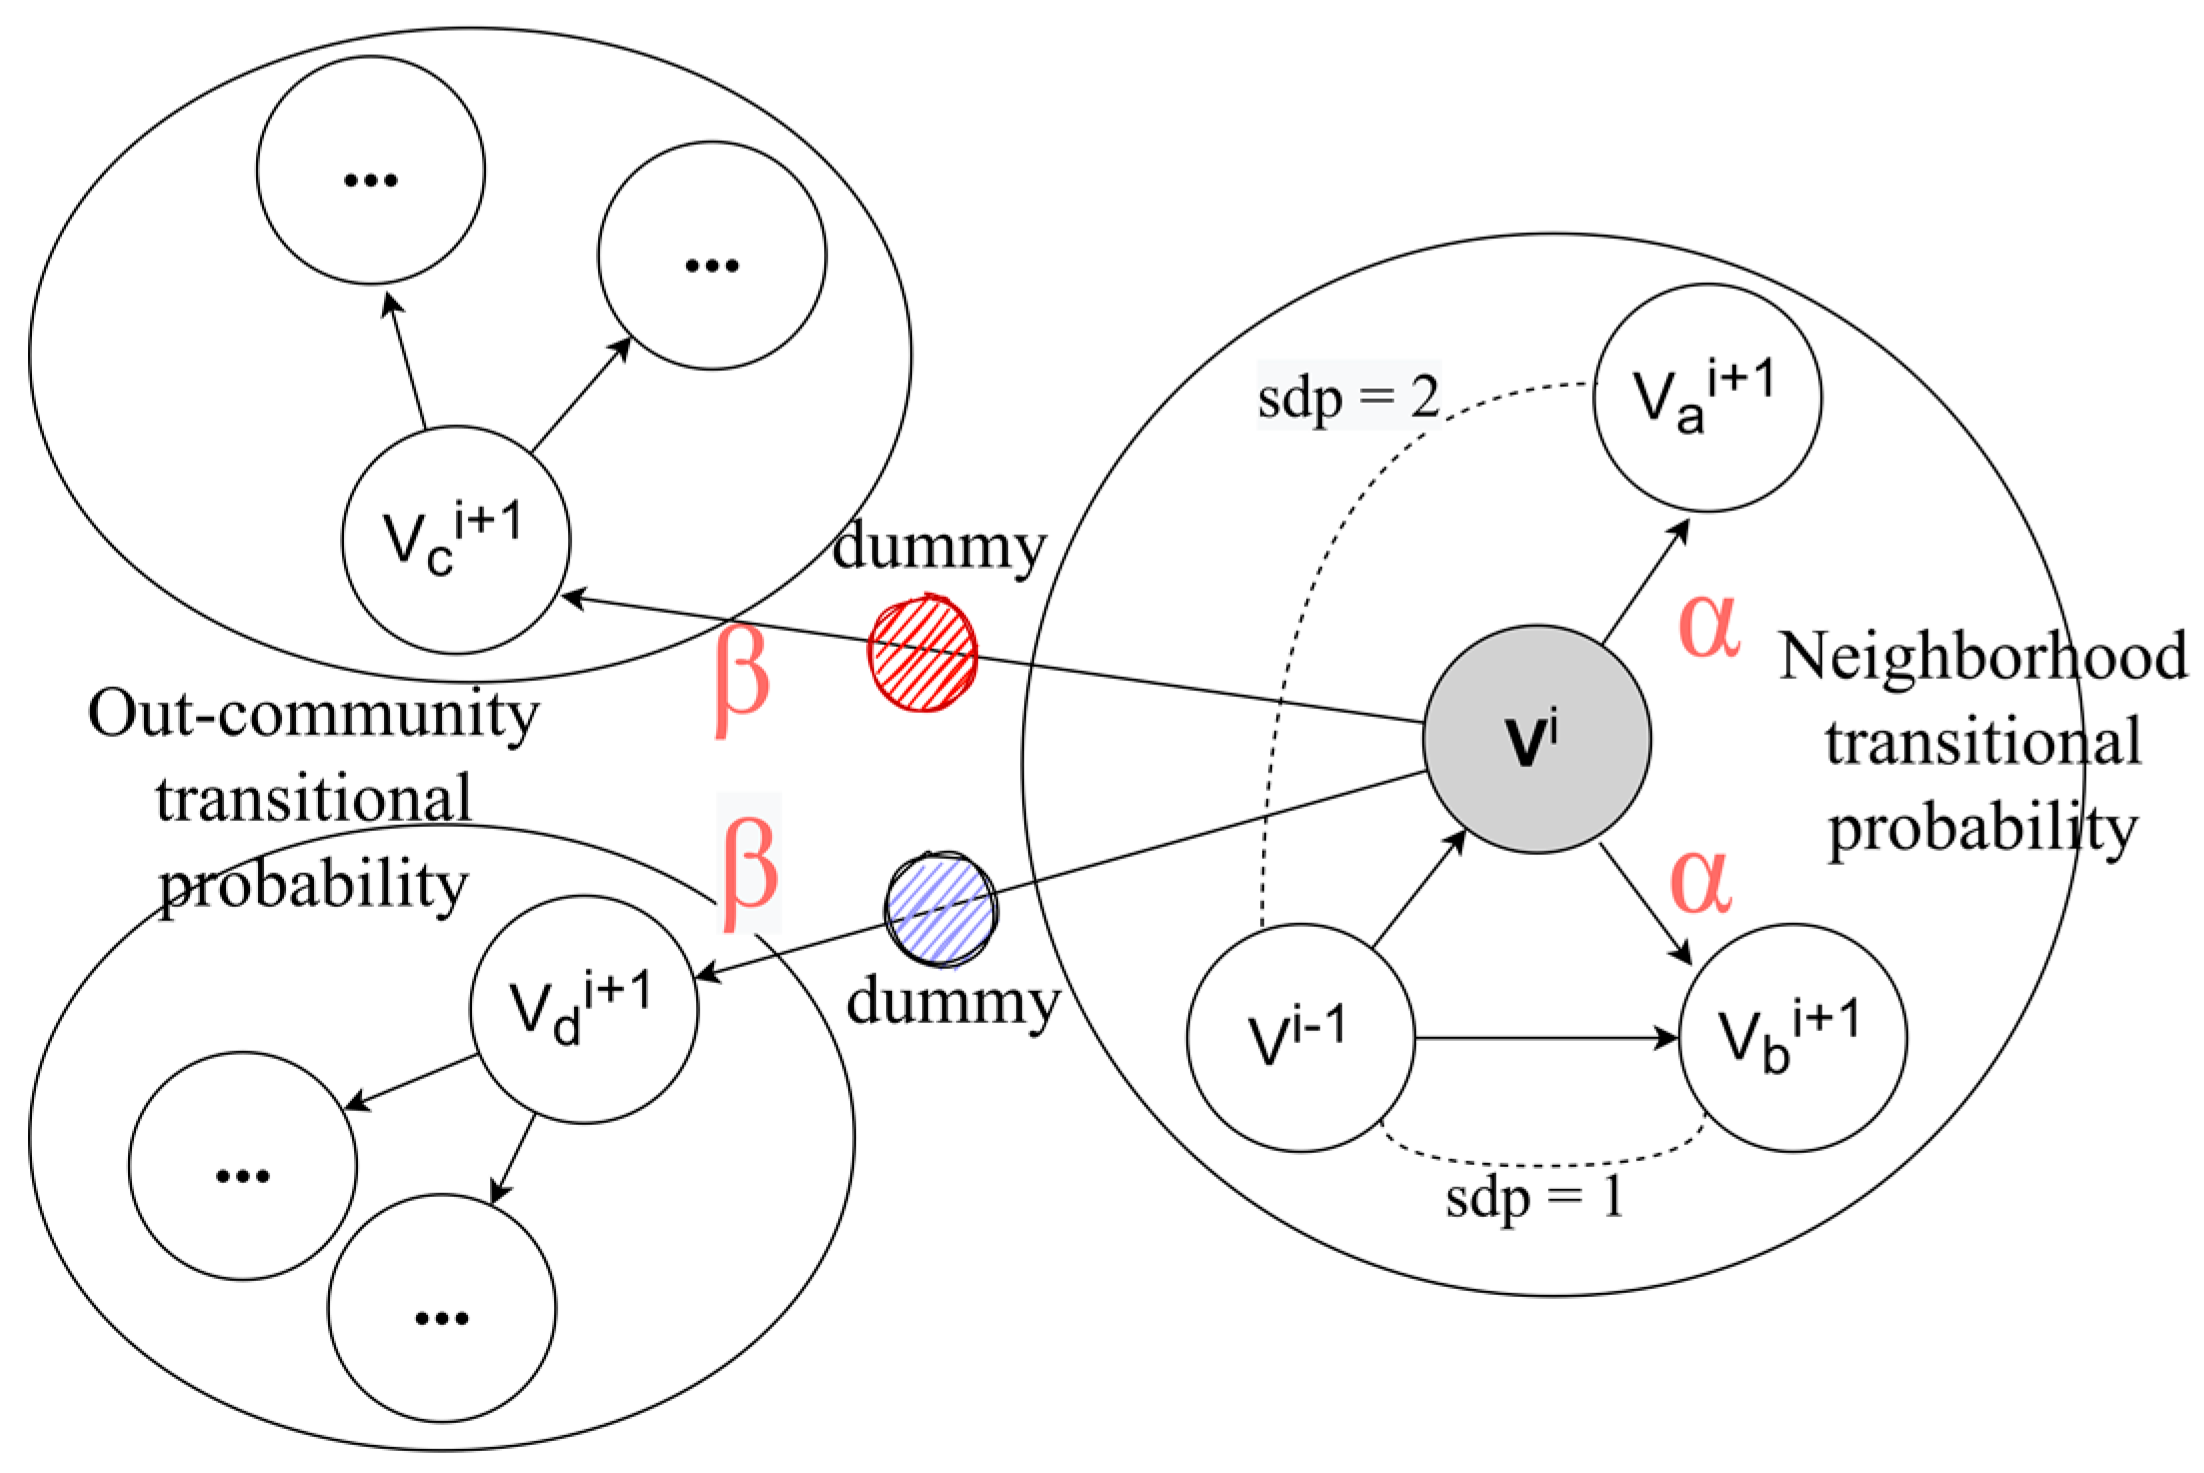
  • Outer-community association. During the random walk process, in case of cross-community movement, dummy nodes related to the communities are added between the nodes and participate in the similarity calculation of context neighborhoods;
  • An incremental learning strategy. This strategy aims to learn representation vectors of newly added nodes while maintaining model performance as much as possible, avoiding the retraining of the entire graph structure and reducing time costs.

4.2.1. Intra- and Outer-Community-Oriented Random Walks

Initially, the Louvain community detection algorithm [28] is used to determine the community to which the node belongs. Subsequently, leveraging the community information, the graph-based structure of OSN is converted into a Skip-gram model using a walk strategy.
In a random walk process, the length of the random walk is set to l , the starting point is s = v 0 , i steps have been taken, and the walker is at node v i . v i + 1 is a node in the social graph, and the transition probability from v i to v i + 1 is defined as π v i v i + 1 , C v i , as shown in the following formula:
π v i v i + 1 = w v i , v i + 1 · α v i , v i + 1 λ , i f   v i , v i + 1 E   a n d   v i + 1 C v i w v i , v i + 1 · β v i , v i + 1 λ , i f   v i , v i + 1 E   a n d   v i + 1 C v i 0 , o t h e r w i s e
where E is the set of directed edges (relationships) in the graph. α v i , v i + 1 is the non-normalized transition probability from v i to v i + 1 within the community when v i and v i + 1 belong to the same community, C v i . β v i , v i + 1 is the non-normalized transition probability across communities from v i to v i + 1 when v i and v i + 1 do not belong to the same community. w v i , v i + 1 is the weight of the directed edge between v i and v i + 1 . λ is the global normalization constant, which is calculated by summing up all the non-normalized transition probabilities of node v i .
The random walk strategy in Bot2Vec sets the transition probabilities α v i , v i + 1 and β v i , v i + 1 within and outside the community as follows:
α v i , v i + 1 = 1 p , i f   s p d v i 1 , v i + 1 = 0 1 ,   i f   s p d v i 1 , v i + 1 = 1 1 q ,   i f   s p d v i 1 , v i + 1 = 2
β v i , v i + 1 = α v i , v i + 1 · 1 r C v i
where v i 1 represents the previous node of v i . s p d v i 1 , v i + 1 is the shortest path distance from v i 1 to v i + 1 . Since it takes at most two steps from v i 1 to v i + 1 , the value of s p d v i 1 , v i + 1 can only be selected from 0 , 1 , 2 . C v i is the number of nodes in the community to which v i belongs. Meanwhile, p , q , and r are hyperparameters. r C v i is the penalty value.
Figure 5 shows the random walk process of our model. The in–out parameter q can control the distance of the random walk. When q < 1 , the walk is more likely to choose nodes farther away from v i 1 . When q > 1 , the walk is more likely to visit nodes closer to v i 1 ; that is, nodes around v i 1 . By setting q , the random walk process can be controlled to explore outward from the source node or to explore the surroundings. In addition, the return parameter p can control the probability of the random walk revisiting the previous node; that is, v i + 1 = v i 1 . Increasing the value of p helps reduce the likelihood of sampling the same node in the random walk process. The penalty value r C v i is used for cross-community sampling to control the movement of the random walker, either to the outside or staying within the current community, when starting from the current node. Thus, changing the value of r can guide the random walker in capturing the local structure of each user node.
In addition, to preserve cross-community information during the sampling process, IB2V introduces dummy community nodes between each community, as depicted in Figure 5. Let us assume a dummy node, D k D , where D is the set of all dummy nodes, and D k is positioned between different communities, C v k and C v k + 1 . When the random walker moves across communities, from v k to v k + 1 , we include the dummy node D k in the sampled context, forming v k D k v k + 1 . By performing these operations, the generated node context during random walk sampling includes community dummy nodes, which takes into account the association between different communities and cross-community information.

4.2.2. Node Representation Learning and Optimization Objectives

The primary objective of the model is to acquire the latent node representation u ˜ g with a dimensionality of e . Skip-gram model and Word2Vec are used to learn the representation of each node by sampling context neighborhoods through random walks. For a node v in a social network, the optimization objective of IB2V is to maximize the probability of its neighboring nodes appearing, as shown in the following equation:
max θ c N v l o g P r c | v ; θ
where N v represents the set of neighboring nodes of v obtained through sampling strategies. Additionally, given node v , l o g P r c | v ; θ is the conditional probability of node c occurring, which can be represented by the following equation:
l o g P r c | v ; θ = exp u ˜ c · u ˜ v u V exp u ˜ u · u ˜ v
where u ˜ c and u ˜ v are the representation vectors of c and v , respectively. To reduce the computational cost of model parameter updates, the network embedding process adopts a negative sampling technique, which randomly selects a subset of neurons for updates. Negative sampling has been proven to be effective at training large-scale datasets, such as text corpora and information networks. In a more detailed implementation process, for each positive training sample, a set of K negative samples is randomly selected from the given node set V according to the noise distribution, P u . The optimization function with the negative sampling strategy is L θ :
L θ = l o g   σ u ˜ c · u ˜ v + k = 1 K E u k ~ P u l o g   σ u ˜ u k · u ˜ v
where σ is the sigmoid activation function, P u is the noise distribution for randomly selecting K negative-sample nodes from the given node set, and u k is the user node selected through negative sampling.

4.2.3. Incremental Learning Strategy

OSNs in the real world are typically characterized by a large scale, with some networks having hundreds of millions of user nodes. When new nodes and relationships are added, incremental training on the existing social graph must be considered. However, reloading the complete social graph, resampling, and relearning representations for each node can consume a large amount of time and computational resources.
Therefore, this paper proposes an incremental learning strategy for IB2V that aims to reduce the time cost of model continuation training as much as possible, while minimizing performance degradation. The specific process is illustrated in Figure 6.
To improve the efficiency of model training, the incremental learning strategy adopts various methods, including avoiding redundant community detection, reducing sampling frequency, and fixing the weights of old nodes, as follows:
  • Specifically, the model first conducts community detection and saves the community membership for each node;
  • Then, the original social graph is converted into a community graph, where nodes are represented as communities. Based on the saved community information and structure, newly added nodes are integrated into the community graph and undergo a new round of community detection to determine their community membership;
  • Then, the newly added nodes are used as the starting point for the random walk process, which generates context sequences after sampling from the new social graph;
  • In the final step, the representations of old nodes are fixed, and the Skip-gram model is used to learn the representations for all new nodes.

5. Experiments and Discussions

5.1. Datasets and Evaluation Metrics

In order to assess and evaluate the performance of the detection framework and its generalization ability across different OSNs, this study utilizes four publicly available datasets from distinct OSNs:
  • Cresci-2015 [29] (Twitter). The statistical information of the dataset is presented in Table 2, comprising 5301 users, out of which 3351 accounts are labeled as bots, accounting for 63% of all users. This dataset includes tweet records and user profiles of relevant users, and consists of five sub-datasets: TFP, E13, FSF, INT, and TWT. All sub-datasets have label information, with users annotated as either bots or normal users.
  • Social-Spammer [30] (Tagged). This dataset is collected from the Tagged social networking website and contains a large labeled dataset of bots. It encompasses a total of 5,607,454 accounts with their profiles, 912,280,409 relationship records between accounts, and timestamps of interactions. This dataset forms a heterogeneous network with seven different types of relationships between users (“Message”, “Pet Game”, “Meet-Me Game”, “Add Friend”, “Give A Gift”, “Report Abuse”, and “View Profile”). Among these, 221,305 accounts are labeled as bots, which constitutes 3.9% of all accounts.
  • MicroblogPCU [31] (Weibo). This dataset is collected by researchers for spam detection in Weibo, and includes basic attribute of users, as well as the content they posted and corresponding timestamps. It contains a total of 48,848 Weibo posts and 781 accounts. Among all the accounts, the number of labeled normal users is 113, and the number of malicious bots is 66.
  • TwiBot-22 [32] (Twitter), a comprehensive graph-based Twitter bot detection benchmark that presents the largest dataset to date. The dataset contains 1,000,000 users (39,943 accounts are labeled as bots), 86,764,167 tweets, and 170,185,937 edges between users.
According to the methods of re-structuring and pre-processing, the four datasets mentioned above are processed. For the experiments, all datasets are divided into training set, validation set, and test set in a ratio of 7:1:2, respectively. To test the model’s generalization ability and its applicability to new users, MRLBot is trained on the training set in an unsupervised manner to generate user representations. The deep learning classifier is trained using a supervised task of predicting malicious SMBs, and the performance of the detection framework is evaluated using the test set. Additionally, to prevent model overfitting, the training quality is evaluated using the validation set. Table 3 presents the evaluation metrics used in this study.
In Table 3, TP, TN, FP, and FN represent true positive, true negative, false positive, and false negative, respectively. The primary focus of this study is the detection of malicious SMBs, with bots being considered positive samples and normal users being considered negative samples. Therefore, accuracy is employed as a measure of the overall classification performance. In cases where the dataset has a significant imbalance between positive and negative samples (e.g., in the Social-Spammer dataset where bots account for only 3.9% of all accounts), evaluation metrics that emphasize positive samples, such as precision, recall, and F1 score, should be given priority.

5.2. Experimental Setups

Based on the PyTorch deep learning framework (version 1.11.0), we constructed MRLBot. The hyperparameter settings are provided in Table 4. In the experimental discussion section of Section 5.4, significant hyperparameters will be adjusted to assess their impact on the model’s performance.
To demonstrate MRLBot’s ability to detect malicious SMBs, we compared it against the following baseline methods:
  • AdaBoost [14]. This method uses a 10-dimensional feature set based on user profiles and employs AdaBoost for bot classification. The feature “favorite_counts” is present in the Cresci-2015 dataset. but it is not available in the other two datasets, and thus is not used in experiments involving these datasets.
  • DeeProBot [33]. This method uses metadata from user profiles and replaces the descriptive text in the metadata with pre-trained global word embeddings. The model consists of LSTM and fully connected layers to handle mixed types of features, including numerical, binary, and text. As the datasets used in this paper lack “Sentiment” and “Timing” features; these features are not taken into consideration during input construction.
  • BotRGCN [11]. The authors constructed a heterogeneous graph from the follower relationships, embedding multimodal user semantics and attribute information into the graph, and applied graph convolutional network for detecting bots. Since the dataset used in this paper do not include account avatars, this feature is not considered when constructing inputs.
  • SATAR [22]. This method is an unsupervised Twitter user representation learning framework that jointly utilizes semantic, attribute, and neighborhood information, and employs a co-influence module to aggregate this information.
The above methods have corresponding implementations in publicly available code repositories, and hyperparameters from the published papers are referred to for optimal performance.

5.3. Experimental Results

This section discusses the comparative experiments that were conducted on the proposed MRLBot, utilizing datasets from three distinct social networks, along with the use of the baseline methods mentioned in Section 5.2. Table 5 presents the experimental results of all detection frameworks on Cresci-2015 and TwiBot-22.
MRLBot demonstrated superior performance in terms of accuracy and the F1 score compared to other bot detection frameworks, achieving 97.25% accuracy and a 97.85% F1 score. Despite achieving the highest precision, AdaBoost generated a significant number of false positives in bot identification, mistakenly classifying numerous bot samples as normal users. SATAR, although achieving the highest recall, also misclassified some normal users as bots. Overall, MRLBot achieved the best detection performance on the Cresci-2015 dataset. Similarly, MRLBot achieved the best performance on TwiBot-22.
The detection performance on Social-Spammer and MicroblogPCU is shown in Table 6.
On the Social-Spammer dataset, which contains richer relational information, BotRGCN achieved the highest detection performance. This is attributed to the utilization of graph convolutional networks in BotRGCN, which capture the global contextual information of the social graph and define it as a heterogeneous graph, taking into account the diverse types of relationships among users. Our proposed MRLBot outperformed other methods except BotRGCN, indicating that the integration of multi-dimensional features can enhance the detection performance and accomplish the performance of graph neural network in supervised tasks.
On the MicroblogPCU dataset with a small sample size, MRLBot outperformed SATAR, which is also an unsupervised framework, and achieved the best performance among all the compared frameworks. This indicates that the fusion of multi-dimensional information improved the detection performance of user representations.
In light of the experimental results and the analysis presented above, we can draw the following conclusions: MRLBot demonstrated effective detection results on diverse datasets, showcasing its ability to generalize across various OSNs. Furthermore, on the four publicly available datasets, the detection performance of MRLBot surpassed that of state-of-the-art baseline frameworks in this field, validating the efficacy of our approach in integrating multi-dimensional representations.

5.4. Discussions

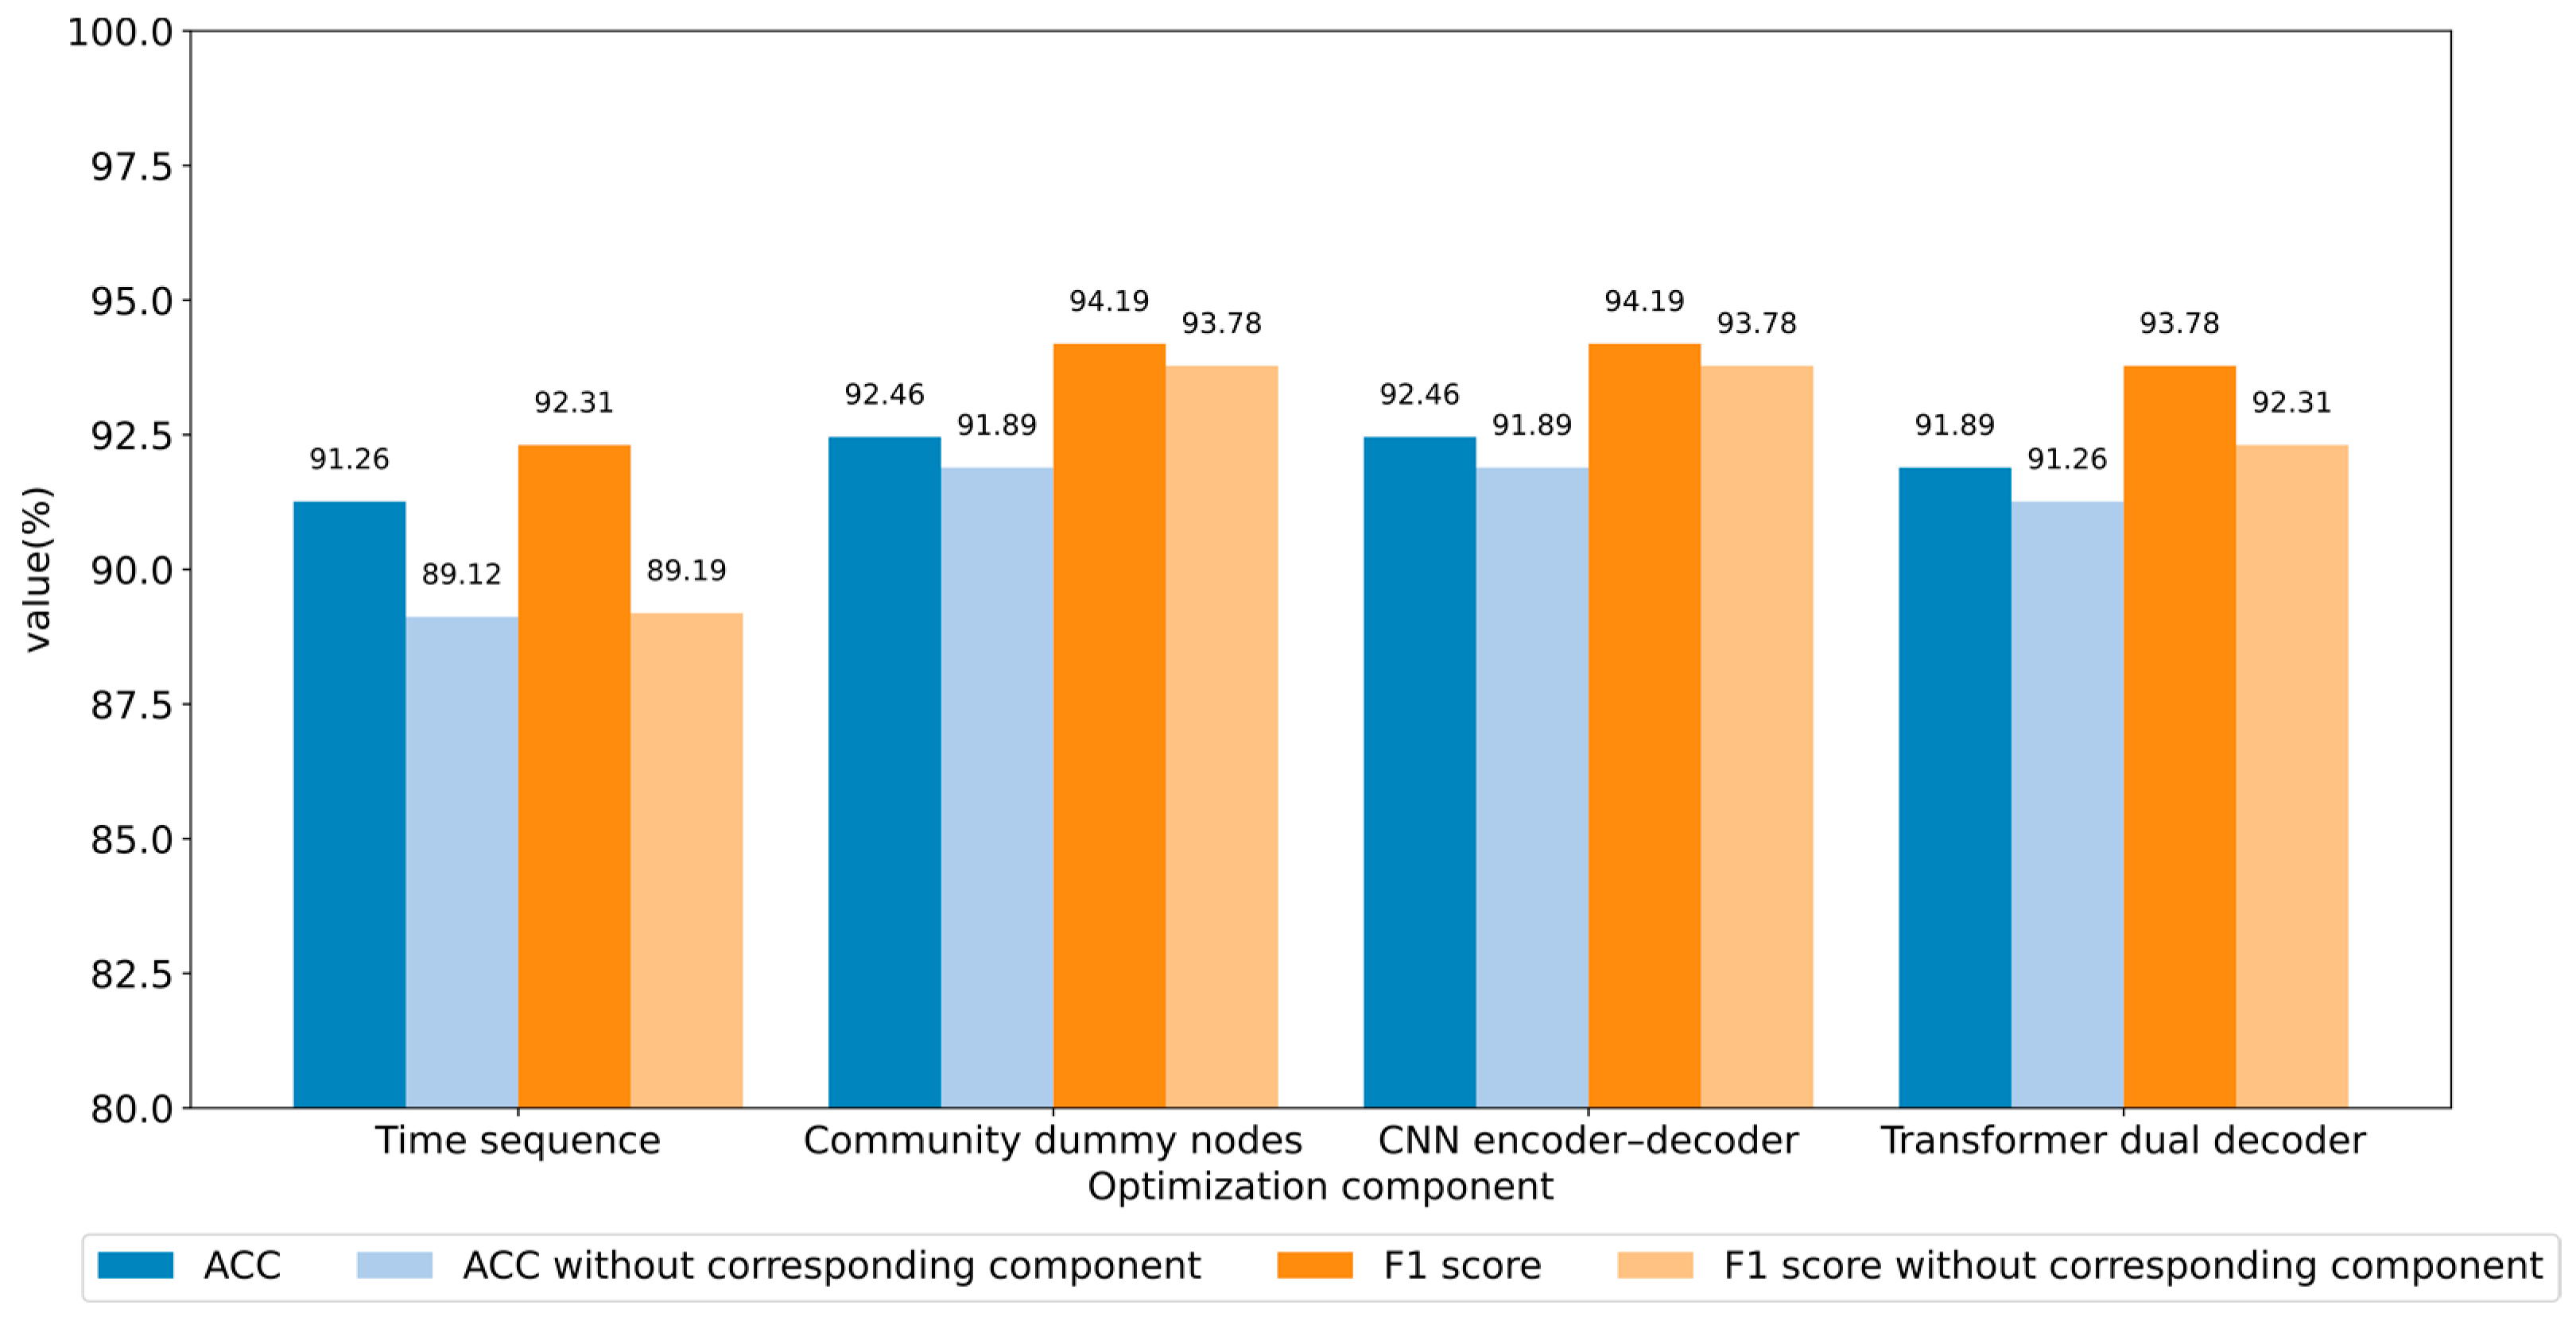
5.4.1. Ablation Study

This paper presents various structures and components aimed at optimizing the detection performance and generalization ability. In this section, we evaluate the contribution of each component to MRLBot. Variants of the framework are generated by selectively reducing techniques and components, while maintaining consistent hyperparameters. Ablation experiments were performed on the Cresci-2015 dataset. The control groups for the experiments are as follows:
  • Timestamp sequence. The model variants consist of TCN and TCNpos. TCN (Transformer Convolutional Network) is the structure of DDTCN in MRLBot without the dual decoder, reconstructing only the published content in the decoder part. TCNpos replaces time embedding with position embedding in the input layer.
  • Community dummy nodes. The control groups are IB2V and Bot2Vec.
  • CNN encoder–decoder. The control groups are DDTCN and DDTN, with DDTN being a variant of our model that does not utilize CNN autoencoder.
  • Transformer dual decoder. The control groups are DDTCN and TCN.
Figure 7 presents the accuracy and F1 score of each control group in comparison to all the optimization components. The results of the ablation experiments indicate that the proposed components achieved significant optimization effects.
To illustrate the significance of timestamp sequences for the model, ablation experiments were conducted to compare the performance of TCN with timestamp sequences, against that of TCNpos without timestamp sequences. The model’s performance improvement with timestamp sequences is evident in terms of the accuracy and F1 score. This is because, although Transformer is capable of capturing contextual relationships in sequences, it lacks information about the timing of user behavior. Moreover, the Transformer dual decoder demonstrated a notable improvement of 1.47% in the F1 score compared to the other components in the control group. We posit that the parallel decoder, through the reconstruction of timestamp sequence, enhances the temporal features of user representations. This facilitates the more accurate identification of samples that were previously challenging to determine, thereby resulting in a more balanced detection performance.

5.4.2. Efficiency of Incremental Learning Strategy

In the comparative experiment, a graph of all nodes and relationships from the dataset was constructed to learn user representations. MRLBot was trained on a per-user-node basis, using 50% of the nodes from the Social-Spammer dataset as the initial training set. Subsequently, the percentage of nodes was incrementally increased from 50% to 100% to simulate the scenario of adding new users.
In the absence of the incremental learning strategy described in Section 4.2.3, the representations of all nodes must be relearned following the algorithmic flow of IB2V, and the classifier needs to be retrained using the newly added 10% nodes as the test set to validate the classification performance. The effectiveness of this strategy was verified by comparing the time taken and detection performance of generating representation vectors for newly added nodes with and without using the incremental learning strategy.
Based on the findings in Table 7 and Table 8, the incremental learning strategy can greatly decrease the time cost of learning representations for newly added nodes. However, the strategy may result in a trade-off between time cost and detection performance. This is because this strategy does not re-sample and generate context sequences for all nodes, resulting in the loss of structural information of some nodes in the graph. Additionally, the performance of the generated representations for new nodes may also be affected due to the fixed representation of old nodes and the loss of structure features. As the number of nodes grows, the loss of detection performance caused by the incremental learning strategy becomes more severe. Therefore, it is recommended to use the incremental learning strategy to generate representation vectors for a certain amount of newly added nodes to reduce training time costs. However, when a large number of new users are added to the social network over a period of time, in order to ensure detection performance, it is recommended to re-sample the new social graph structure and refresh the representation vectors of all nodes.

5.4.3. Validity of Relationship Strength

In Section 4.1.1, the user’s social network was defined as a directed weighted graph, and the relationship strength among users was divided. We tested the variation in MRLBot’s detection performance on the Social-Spammer dataset when the input of IB2V was a directed unweighted graph and a directed weighted graph.
Based on the findings in Table 9, the detection performance of MRLBot was enhanced when the relationship strength among users was considered. We defined the relationship strength based on the number of interactions among users and quantified it using the weight of edges in the relationship graph. The experimental results indicate that this optimization scheme enables the network representation learning method to capture more relationship features from the social graph, leading to the improved performance of node representation in bot detection tasks.

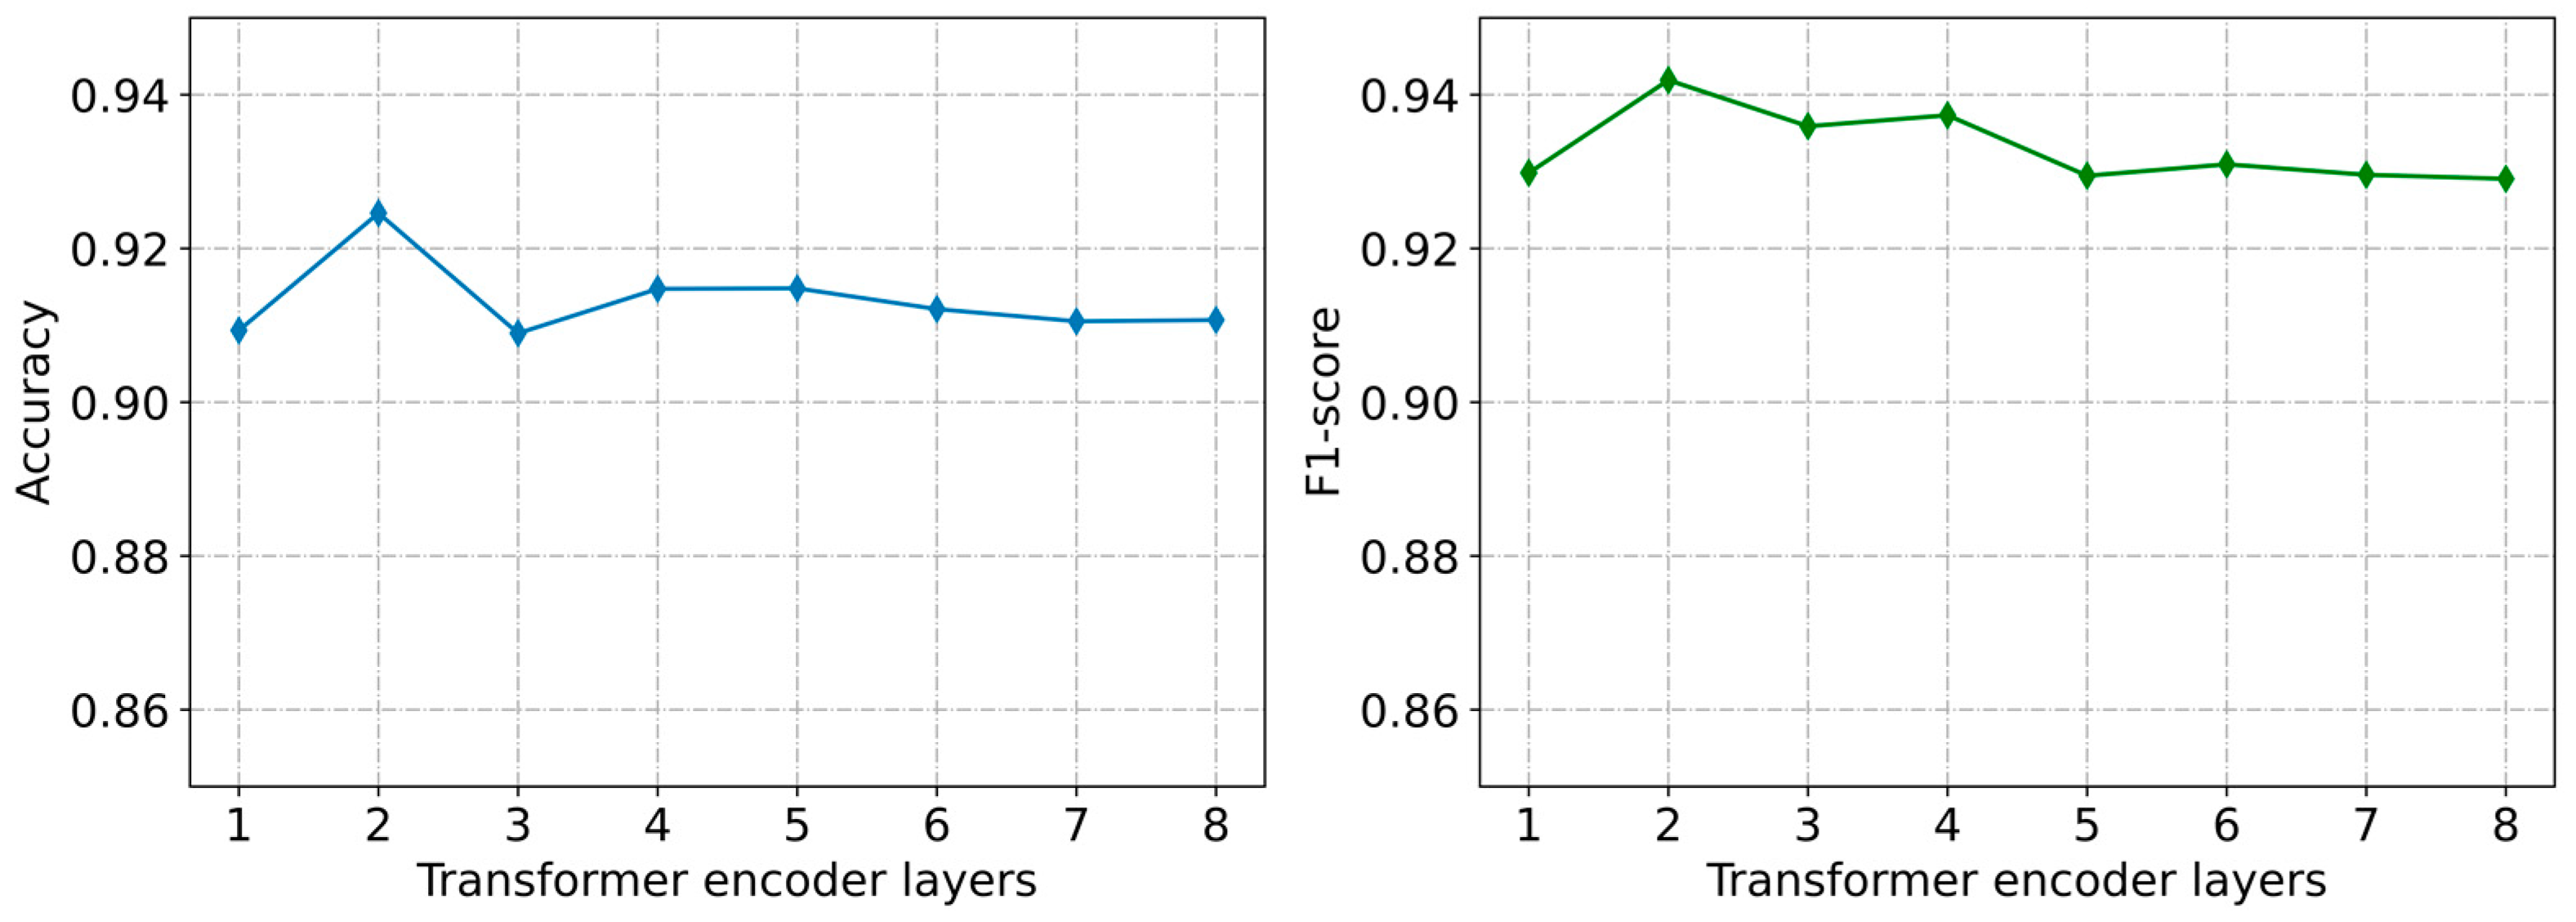
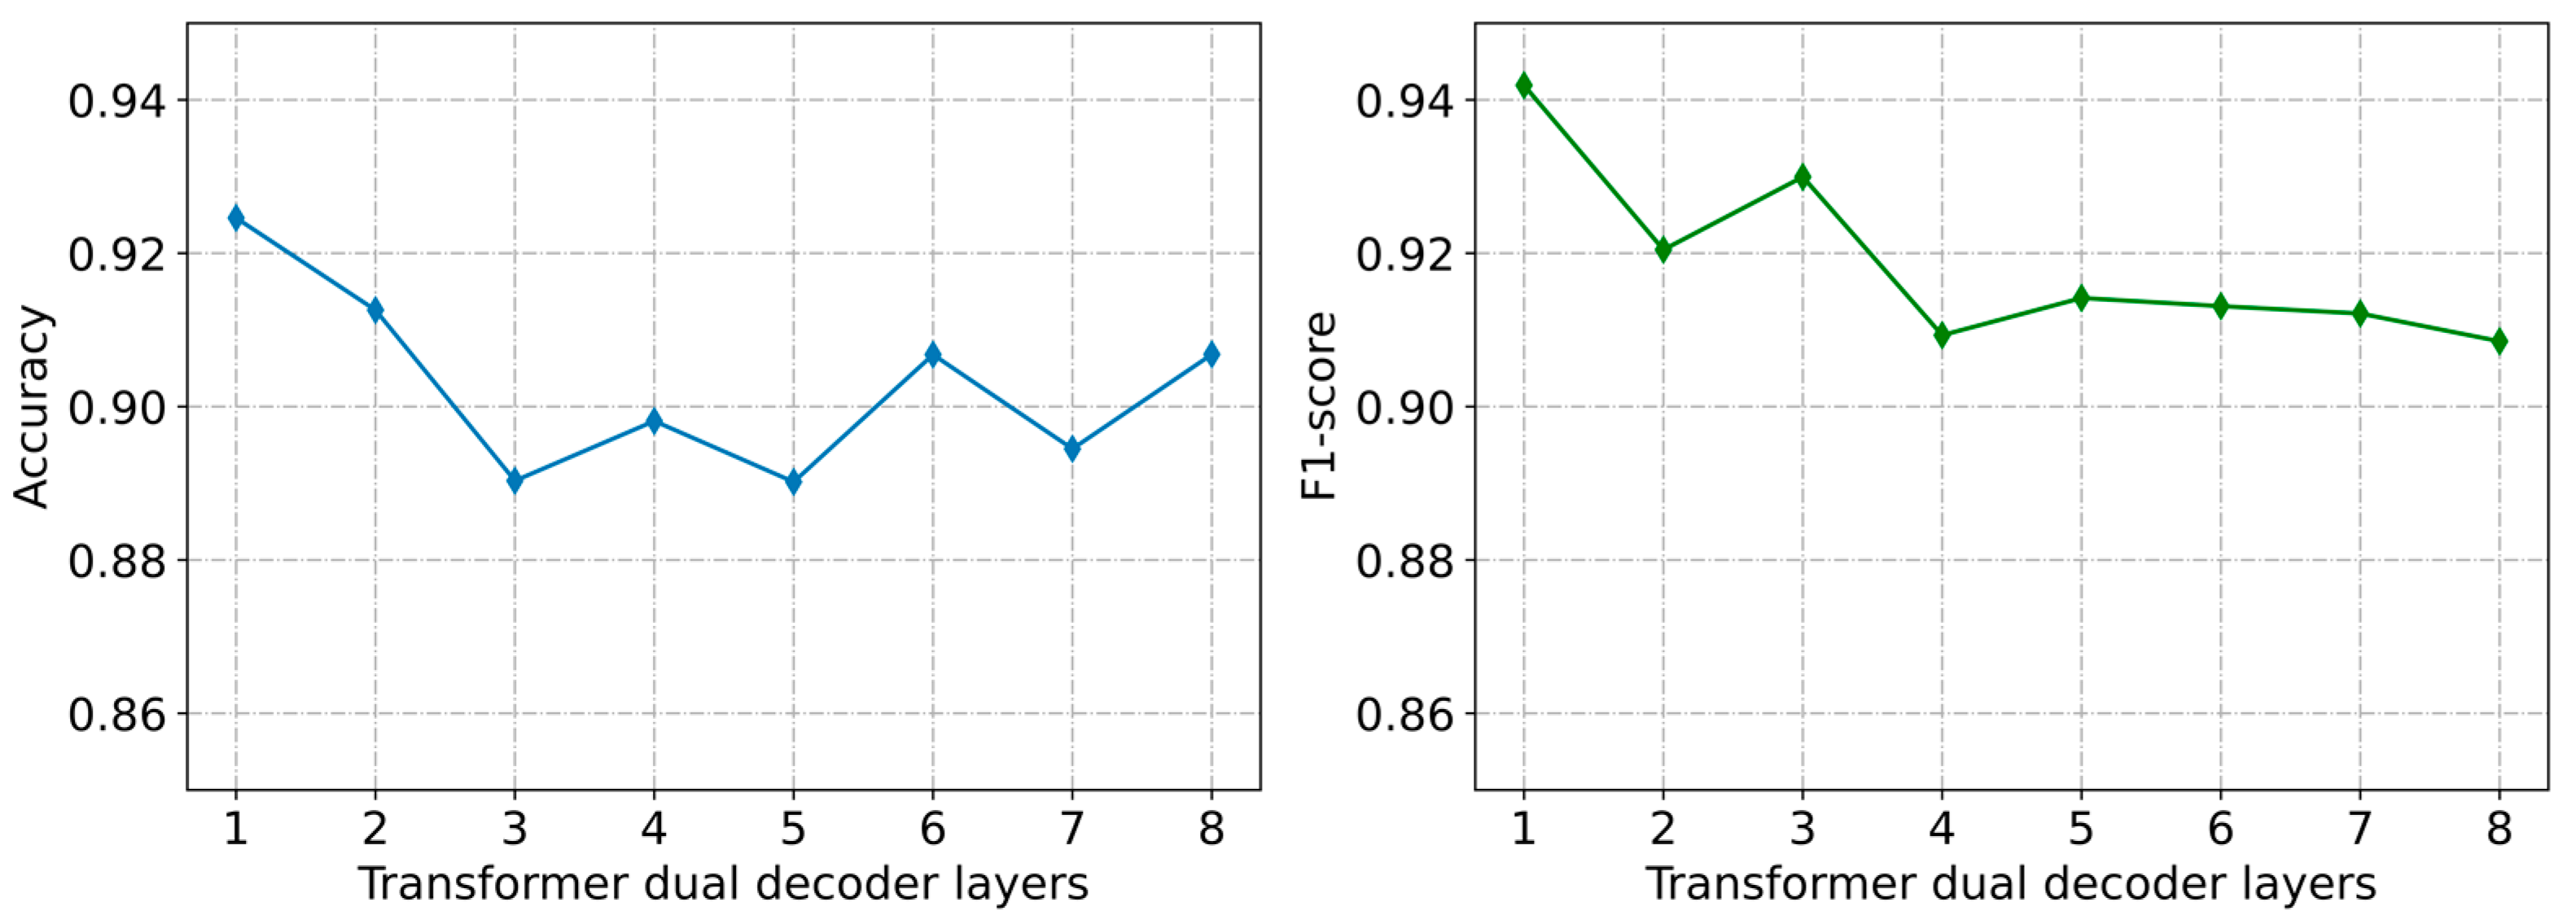
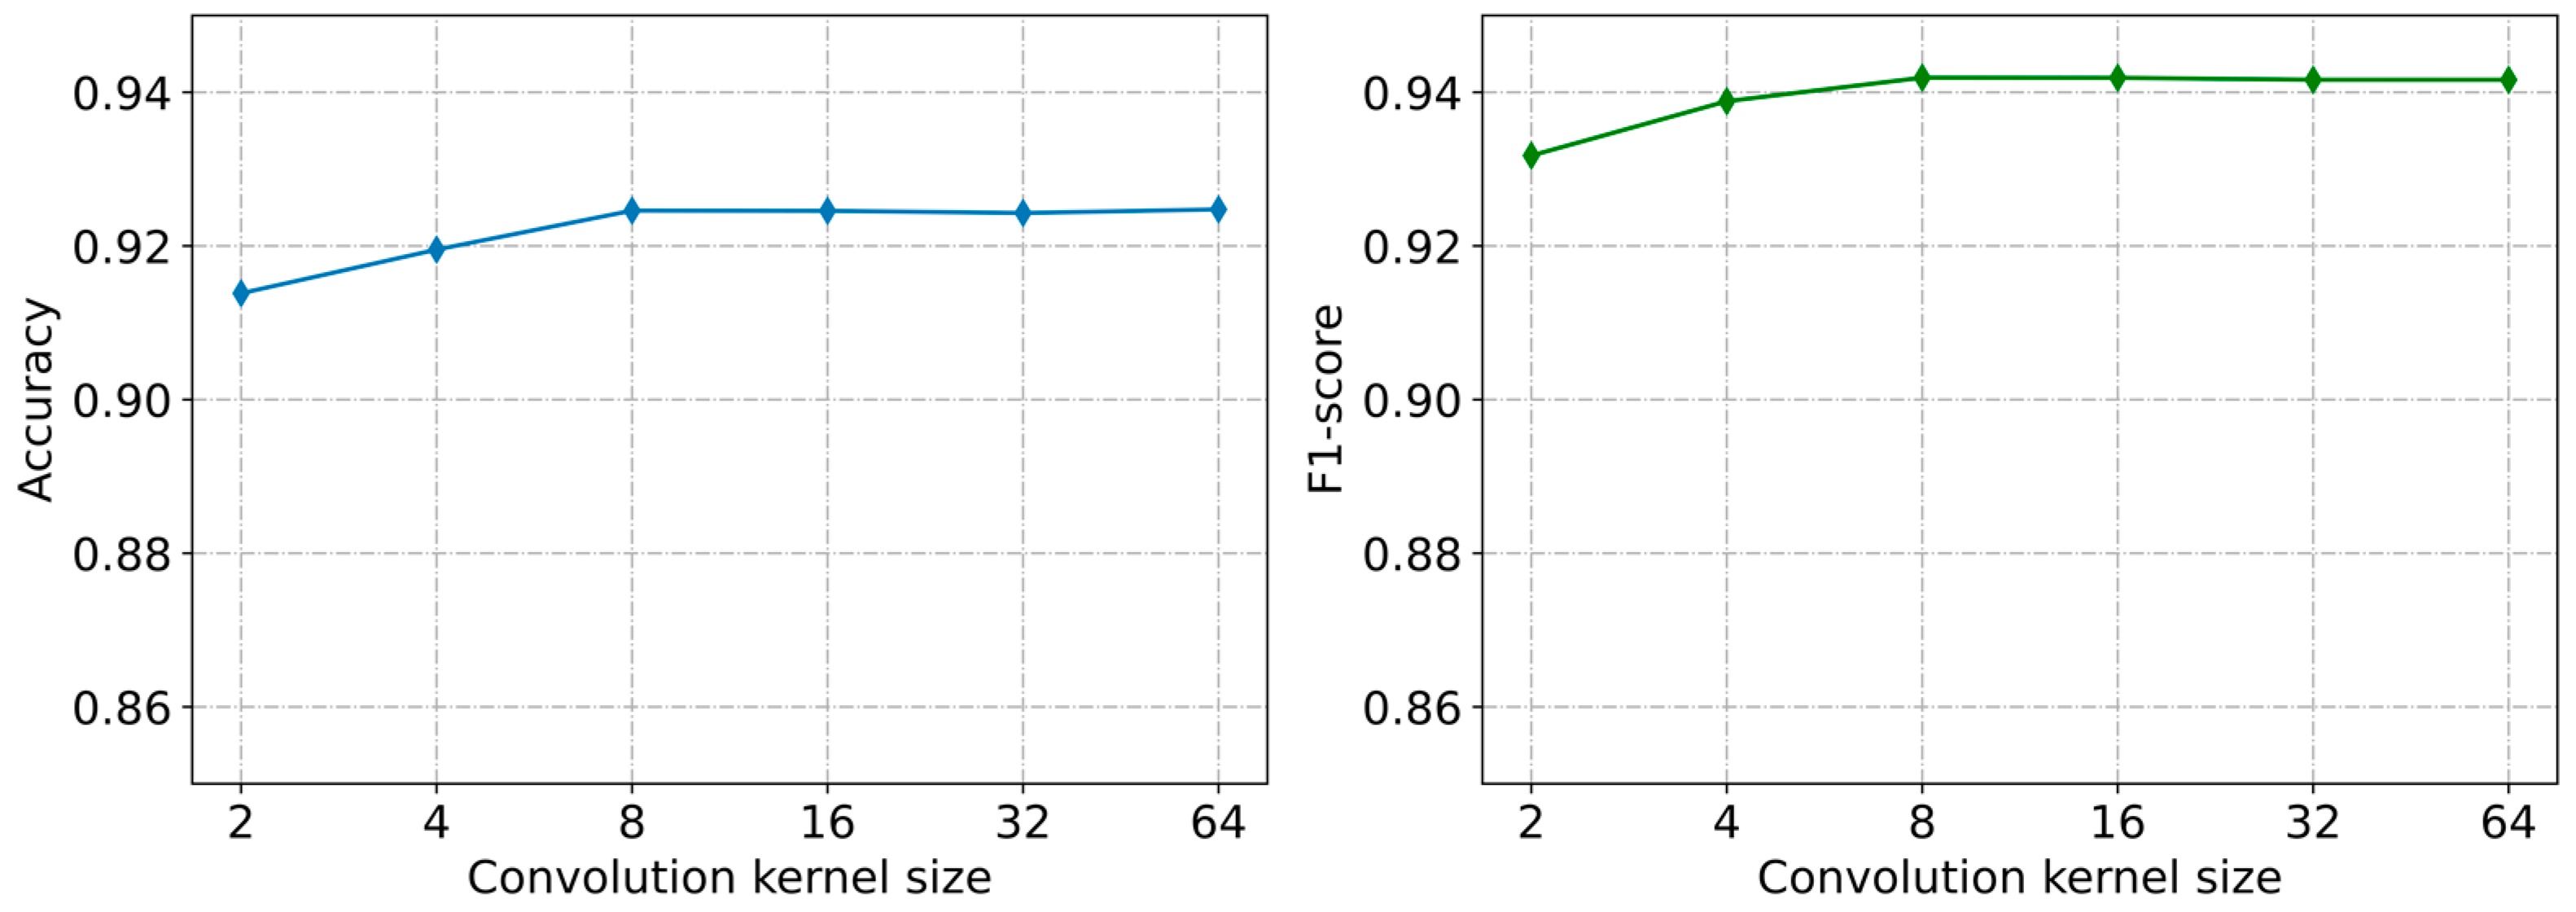
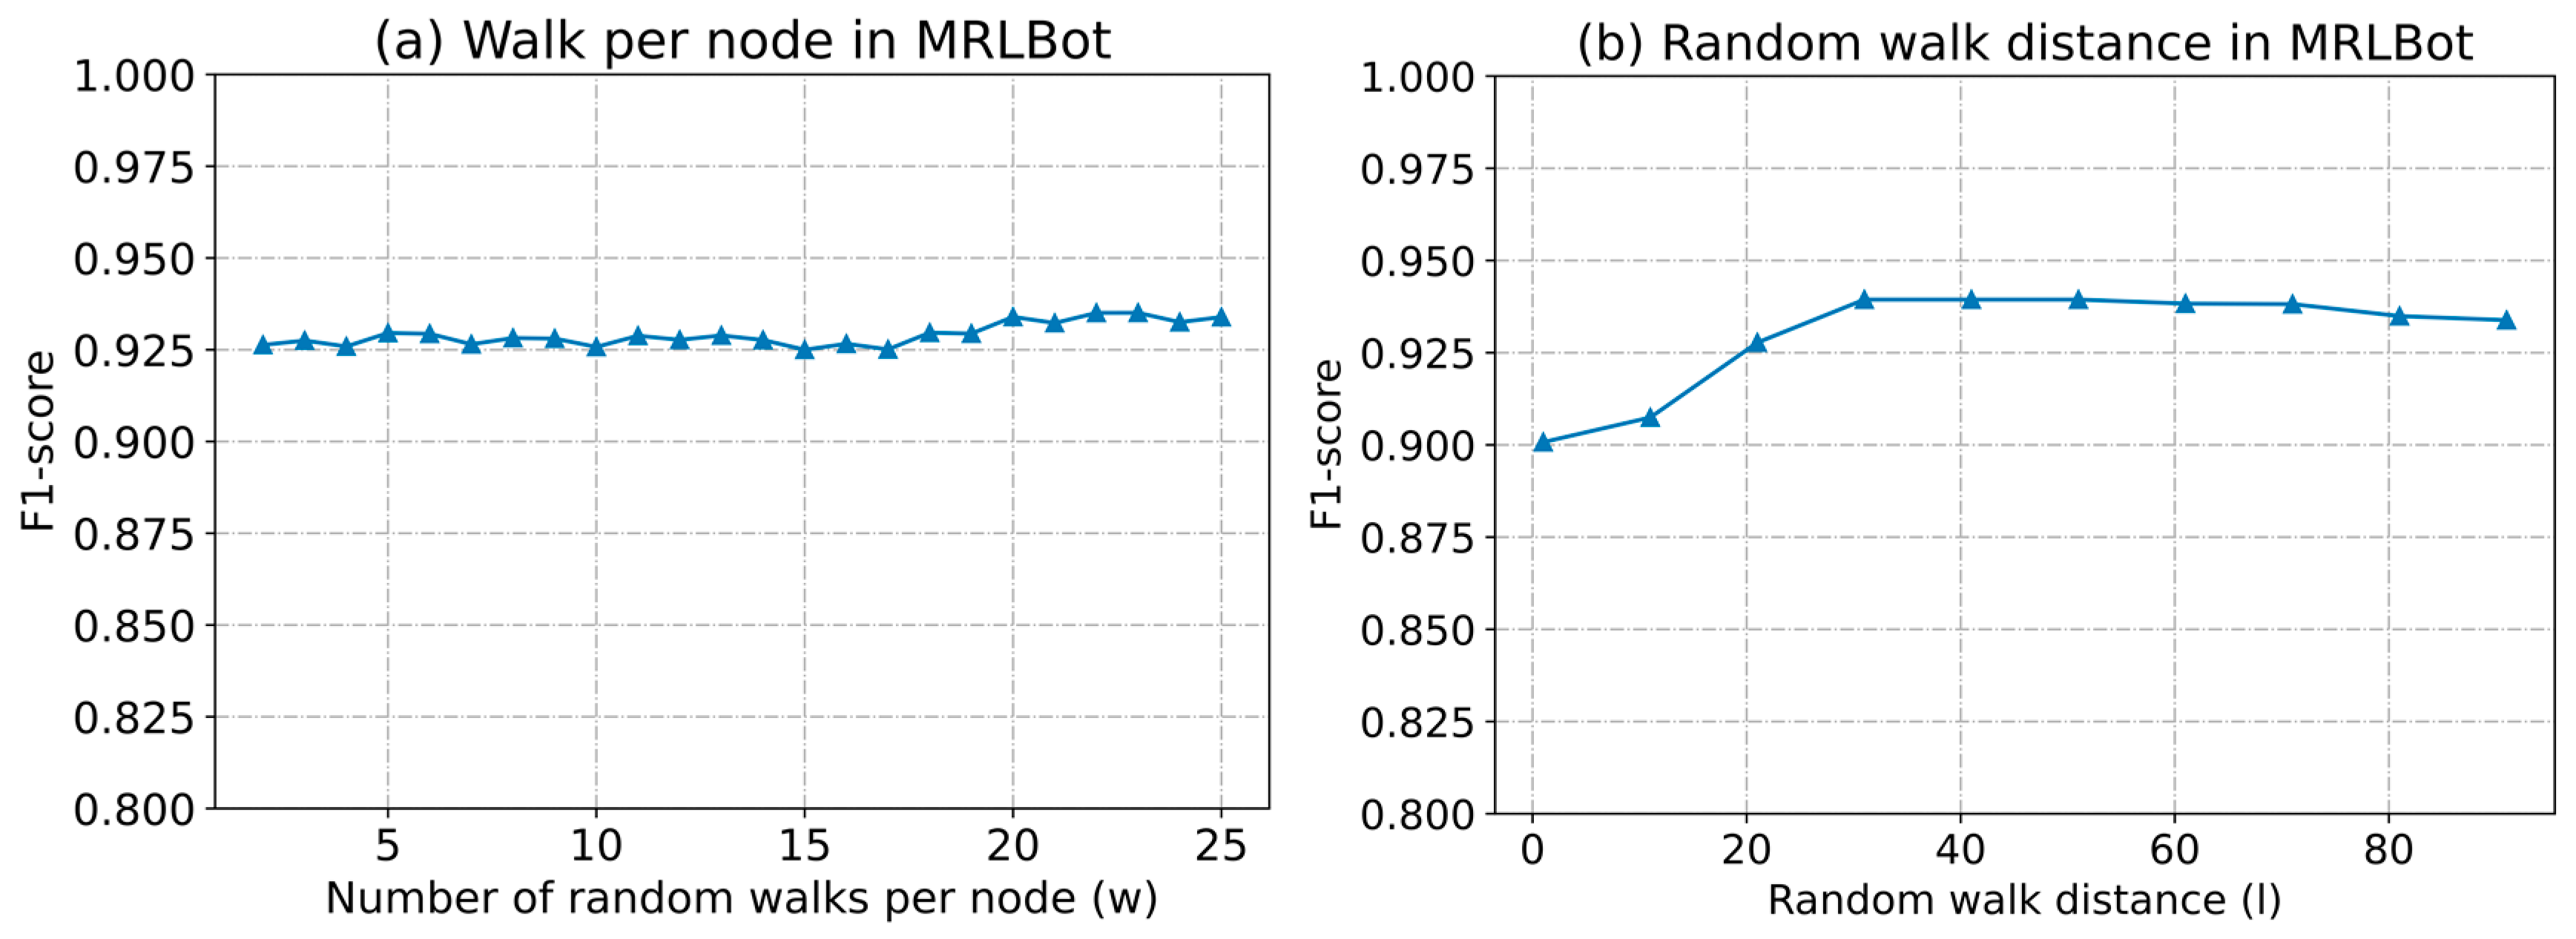
5.4.4. Parameter Sensitivity of the Model

The primary objective of selecting suitable hyperparameters for the model is to achieve optimal performance within the constraints of time and computational resources. This section investigates the impact of different hyperparameters on the model’s performance, in order to evaluate the robustness of our model using the Cresci-2015 dataset.
In our model, MRLBot, the behavior representation part is based on the Transformer encoder–decoder structure. The number of layers in the Transformer encoder and decoder may affect the model’s performance. Without changing other hyperparameters, we recorded the results of the detection framework in terms of accuracy and the F1 score by varying the number of layers in the Transformer encoder and dual decoder in DDTCN, as shown in Figure 8 and Figure 9.
The detection performance was optimized when the number of layers in the Transformer dual decoder was set to 1 and the number of layers in the Transformer encoder was set to 2. Thus, the depth of our model is not the determining factor of performance, as increasing the depth would raise the computational cost and model complexity.
To extract local information from the behavior sequence, we used a CNN autoencoder. The size of the convolutional kernel can affect the final performance of the model. We set the size of the convolutional kernel as two-dimensional k w ,   k e , where k e is the same as the embedding dimension of the model, i.e., k e = d . By varying k w in the set 2 ,   4 ,   8 ,   16 ,   32 ,   64 , we recorded the performance change of the detection framework with the change in the convolutional kernel size, as shown in Figure 10.
This can be attributed to the fact that larger convolutional kernels result in longer sequence lengths being calculated within each kernel, causing the model to focus more on textual content and temporal information. As a consequence, the ratio of important local information to unimportant information decreases, leading to diminishing returns in model performance. Furthermore, projecting high-dimensional information into a low-dimensional space does not increase the amount of effective information in the user vectors as the convolutional kernel size increases. As a result, the accuracy and F1 score plateaus, with no further improvement observed beyond a kernel size of eight.
Most network representation learning techniques are highly sensitive to changes in hyperparameters, such as the number of random walks per node ( w ) and the length of each walk ( l ). Based on the results depicted in in Figure 11, stability and optimal performance in bot classification tasks were achieved with w > 18 and l = 30 ~ 50 . This can be attributed to the fact that increasing the values of w and l results in an increased number of contextual nodes for each user node. Therefore, these parameters should be carefully chosen, taking into consideration the size of the network, in order to generate sufficient training samples for the network’s representation learning. Finally, sensitivity experiments on parameters indicate that, considering the balance between time, computational resources, and model performance, parameter settings of w = 20 and l = 30 50 can be adopted.

5.4.5. Limitations

Our proposed method has the following limitations:
  • Limitations of research hypotheses. In Section 3, we simplified user behaviors and relationships in social networks, which is a critical weakness and a simplification of the research work. In actual social networks, user behaviors and relationships are more complex and have more variables. Furthermore, the hypothesis method we employed is based solely on past research and historical experience, without taking into account future changes. There are two main limitations to this approach. Firstly, due to the reduction in variables considered, the detection performance may decrease in the real environment, even though the rationality of the research is guaranteed. Secondly, attackers may bypass the detection methods we proposed by disguising software robots as real users based on these assumptions.
  • Limitations of technical methods. During the representation fusion stage, we concatenated representations of different dimensions, which has the potential to affect the final performance.
  • Limitations of experimental scenarios. All experiments in this paper were conducted using publicly available datasets and did not involve actual online environments. These datasets were collected by researchers in the past, and the performance on these datasets can indicate whether or not the detection method was effective in the past time period. However, it is also important to consider the timeliness of the detection method; that is, whether or not it is effective in the latest time period. Real-time monitoring in online environments requires more complex engineering work and will be the focus of our future research.

6. Conclusions

This paper presents a novel method for detecting malicious SMBs based on multi-dimensional representation learning. Detection methods relying on a single feature, such as behavior or relationship, may perform poorly when that feature is missing in a social network platform. To address this limitation, this study proposes a framework that combines behavior representation and relationship representation learning models to generate fused representations. By unifying the input from multiple platforms, the framework achieves generalization across different social network platforms. Specifically, an unsupervised representation learning model, DDTCN, based on user behavior, is proposed, along with different optimization components to enhance the model’s output vectors for users. Additionally, a network representation learning model, IB2V, is proposed, which incorporates an incremental learning strategy for large-scale social network graphs to reduce the time cost of generating representations for newly added nodes while maintaining performance. This model captures not only the structural features of node neighborhoods, but also the internal structure of communities and the correlations between communities. The experimental results demonstrate the effectiveness of the framework, with good detection performance being achieved on all datasets.

Author Contributions

Conceptualization, F.Z. and Y.L.; methodology, F.Z.; software, F.Z.; validation, F.Z., Y.L. and Y.S.; formal analysis, F.Z.; investigation, F.Z.; resources, F.Z.; data curation, F.Z.; writing—original draft preparation, F.Z.; writing—review and editing, Y.L.; visualization, F.Z.; supervision, F.Z.; project administration, Y.L. All authors have read and agreed to the published version of the manuscript.

Funding

This work receives no external funding.

Data Availability Statement

The source code can be obtained by contacting the authors via the emails provided.

Conflicts of Interest

The authors declare no conflict of interest.

References

  1. Subrahmanian, V.S.; Azaria, A.; Durst, S.; Kagan, V.; Galstyan, A.; Lerman, K.; Zhu, L.; Ferrara, E.; Flammini, A.; Menczer, F. The DARPA Twitter Bot Challenge. Computer 2016, 49, 38–46. [Google Scholar] [CrossRef]
  2. Ratkiewicz, J.; Conover, M.; Meiss, M.; Gonçalves, B.; Flammini, A.; Menczer, F. Detecting and tracking political abuse in social media. In Proceedings of the International AAAI Conference on Web and Social Media, Barcelona, Spain, 17–21 July 2011; pp. 297–304. [Google Scholar]
  3. Bessi, A.; Ferrara, E. Social bots distort the 2016 US Presidential election online discussion. First Monday 2016, 21, 11. [Google Scholar]
  4. Orabi, M.; Mouheb, D.; Al Aghbari, Z.; Kamel, I. Detection of bots in social media: A systematic review. Inf. Process. Manag. 2020, 57, 102250. [Google Scholar] [CrossRef]
  5. Feng, B.; Li, Q.; Pan, X.; Zhang, J.; Guo, D. Groupfound: An effective approach to detect suspicious accounts in online social networks. Int. J. Distrib. Sens. Netw. 2017, 13, 1550147717722499. [Google Scholar] [CrossRef]
  6. Dorri, A.; Abadi, M.; Dadfarnia, M. Socialbothunter: Botnet detection in twitter-like social networking services using semi-supervised collective classification. In Proceedings of the 2018 IEEE 16th International Conference on Dependable, Autonomic and Secure Computing, 16th International Conference on Pervasive Intelligence and Computing, 4th International Conference on Big Data Intelligence and Computing and Cyber Science and Technology Congress (DASC/PiCom/DataCom/CyberSciTech), Athens, Greece, 12–15 August 2018; pp. 496–503. [Google Scholar]
  7. Abu-El-Rub, N.; Mueen, A. Botcamp: Bot-driven interactions in social campaigns. In Proceedings of the The World Wide Web conference, San Francisco, CA, USA, 13–17 May 2019; pp. 2529–2535. [Google Scholar]
  8. Yu, Z.; Lian, J.; Mahmoody, A.; Liu, G.; Xie, X. Adaptive User Modeling with Long and Short-Term Preferences for Personalized Recommendation. In Proceedings of the IJCAI, Macao, China, 10–16 August 2019; pp. 4213–4219. [Google Scholar]
  9. Pham, P.; Nguyen, L.T.; Vo, B.; Yun, U. Bot2Vec: A general approach of intra-community oriented representation learning for bot detection in different types of social networks. Inf. Syst. 2022, 103, 101771. [Google Scholar] [CrossRef]
  10. Magelinski, T.; Beskow, D.; Carley, K.M. Graph-hist: Graph classification from latent feature histograms with application to bot detection. In Proceedings of the AAAI Conference on Artificial Intelligence, New York, NY, USA, 7–12 February 2020; pp. 5134–5141. [Google Scholar]
  11. Feng, S.; Wan, H.; Wang, N.; Luo, M. BotRGCN: Twitter bot detection with relational graph convolutional networks. In Proceedings of the 2021 IEEE/ACM International Conference on Advances in Social Networks Analysis and Mining, Virtual, The Netherlands, 8–11 November 2021; pp. 236–239. [Google Scholar]
  12. Feng, S.; Tan, Z.; Li, R.; Luo, M. Heterogeneity-aware twitter bot detection with relational graph transformers. In Proceedings of the AAAI Conference on Artificial Intelligence, Virtual, 30 July 2022; pp. 3977–3985. [Google Scholar]
  13. Daouadi, K.E.; Rebaï, R.Z.; Amous, I. Bot detection on online social networks using deep forest. In Artificial Intelligence Methods in Intelligent Algorithms, Proceedings of 8th Computer Science Online Conference, Volume 2, Online, 24–27 April 2019; Springer: Cham, Switzerland, 2019; pp. 307–315. [Google Scholar]
  14. Kudugunta, S.; Ferrara, E. Deep neural networks for bot detection. Inf. Sci. 2018, 467, 312–322. [Google Scholar] [CrossRef]
  15. Wang, B.; Zhang, L.; Gong, N.Z. Sybilblind: Detecting fake users in online social networks without manual labels. In Proceedings of the Research in Attacks, Intrusions, and Defenses: 21st International Symposium, RAID 2018, Heraklion, Crete, Greece, 10–12 September 2018; pp. 228–249. [Google Scholar]
  16. Ping, H.; Qin, S. A social bots detection model based on deep learning algorithm. In Proceedings of the 2018 IEEE 18th International Conference on Communication Technology (ICCT), Chongqing, China, 8–11 October 2018; pp. 1435–1439. [Google Scholar]
  17. Wei, F.; Nguyen, U.T. Twitter bot detection using bidirectional long short-term memory neural networks and word embeddings. In Proceedings of the 2019 First IEEE International Conference on Trust, Privacy and Security in Intelligent Systems and Applications (TPS-ISA), Los Angeles, CA, USA, 12–14 December 2019; pp. 101–109. [Google Scholar]
  18. Stanton, G.; Irissappane, A.A. GANs for semi-supervised opinion spam detection. arXiv 2019, arXiv:1903.08289. [Google Scholar]
  19. Cresci, S.; Di Pietro, R.; Petrocchi, M.; Spognardi, A.; Tesconi, M. DNA-inspired online behavioral modeling and its application to spambot detection. IEEE Intell. Syst. 2016, 31, 58–64. [Google Scholar] [CrossRef]
  20. Cresci, S.; Di Pietro, R.; Petrocchi, M.; Spognardi, A.; Tesconi, M. Social fingerprinting: Detection of spambot groups through DNA-inspired behavioral modeling. IEEE Trans. Dependable Secur. Comput. 2017, 15, 561–576. [Google Scholar] [CrossRef]
  21. Mazza, M.; Cresci, S.; Avvenuti, M.; Quattrociocchi, W.; Tesconi, M. Rtbust: Exploiting temporal patterns for botnet detection on twitter. In Proceedings of the 10th ACM Conference on Web Science, Boston, MA, USA, 30 June–3 July 2019; pp. 183–192. [Google Scholar]
  22. Feng, S.; Wan, H.; Wang, N.; Li, J.; Luo, M. Satar: A self-supervised approach to twitter account representation learning and its application in bot detection. In Proceedings of the 30th ACM International Conference on Information & Knowledge Management, Virtual, 1–5 November 2021; pp. 3808–3817. [Google Scholar]
  23. Bach, N.X.; Long, D.H.; Phuong, T.M. Recurrent convolutional networks for session-based recommendations. Neurocomputing 2020, 411, 247–258. [Google Scholar] [CrossRef]
  24. Zhang, J.; Bai, B.; Lin, Y.; Liang, J.; Bai, K.; Wang, F. General-Purpose User Embeddings based on Mobile App Usage. In Proceedings of the 26th ACM SIGKDD International Conference on Knowledge Discovery and Data Mining (KDD), Electr Network, Virtual, 23–27 August 2020; pp. 2831–2840. [Google Scholar]
  25. Devlin, J.; Chang, M.-W.; Lee, K.; Toutanova, K. Bert: Pre-training of deep bidirectional transformers for language understanding. arXiv 2018, arXiv:1810.04805. [Google Scholar]
  26. Peng, Z.; Huang, W.; Gu, S.; Xie, L.; Wang, Y.; Jiao, J.; Ye, Q. Conformer: Local features coupling global representations for visual recognition. In Proceedings of the IEEE/CVF International Conference on Computer Vision, Montreal, BC, Canada, 17 October 2021; pp. 367–376. [Google Scholar]
  27. Chen, Y. Convolutional Neural Network for Sentence Classification. Master′s Thesis, University of Waterloo, Waterloo, ON, Canada, August 2015. [Google Scholar]
  28. De Meo, P.; Ferrara, E.; Fiumara, G.; Provetti, A. Generalized louvain method for community detection in large networks. In Proceedings of the 2011 11th International Conference on Intelligent Systems Design and Applications, Cordoba, Spain, 22–24 November 2011; pp. 88–93. [Google Scholar]
  29. Cresci, S.; Di Pietro, R.; Petrocchi, M.; Spognardi, A.; Tesconi, M. Fame for sale: Efficient detection of fake Twitter followers. Decis. Support Syst. 2015, 80, 56–71. [Google Scholar] [CrossRef]
  30. Fakhraei, S.; Foulds, J.; Shashanka, M.; Getoor, L. Collective spammer detection in evolving multi-relational social networks. In Proceedings of the 21st Acm Sigkdd International Conference on Knowledge Discovery and Data Mining, Sydney, Australia, 10–13 August 2015; pp. 1769–1778. [Google Scholar]
  31. Gu, B.; Zhai, Z.; Li, X.; Huang, H. Towards Fairer Classifier via True Fairness Score Path. In Proceedings of the 31st ACM International Conference on Information & Knowledge Management, Atlanta, GA, USA, 17–21 October 2022; pp. 3113–3121. [Google Scholar]
  32. Feng, S.; Tan, Z.; Wan, H.; Wang, N.; Chen, Z.; Zhang, B.; Zheng, Q.; Zhang, W.; Lei, Z.; Yang, S. TwiBot-22: Towards graph-based Twitter bot detection. arXiv 2022, arXiv:2206.04564. [Google Scholar]
  33. Hayawi, K.; Mathew, S.; Venugopal, N.; Masud, M.M.; Ho, P.-H. DeeProBot: A hybrid deep neural network model for social bot detection based on user profile data. Soc. Netw. Anal. Min. 2022, 12, 43. [Google Scholar] [CrossRef] [PubMed]
Figure 1. The behavioral activities of a social network user from the past to the present. When timestamp is t 1 , the user was posting. When timestamp is t 3 , the user liked a posted piece of content. When timestamp is t 5 , the user reposted posts. When timestamp is t 7 , the user was posting another piece of content.
Electronics 12 02298 g001
Figure 2. The architecture of MRLBot. DDTCN is the behavioral representation learning model. IB2V is the relationship representation learning model. u ˜ b is the generated behavior representation, and u ˜ g is the generated relationship representation. u ˜ is the multi-dimensional representation.
Electronics 12 02298 g002
Figure 3. The architecture of DDTCN.
Electronics 12 02298 g003
Figure 4. The architecture of IB2V.
Electronics 12 02298 g004
Figure 5. Intra- and outer-community-oriented random walks.
Electronics 12 02298 g005
Figure 6. Incremental learning strategy for IB2V.
Electronics 12 02298 g006
Figure 7. Results of the ablation study (Cresci-2015 dataset).
Electronics 12 02298 g007
Figure 8. Performance of the detection framework with different Transformer encoder layers (Cresci-2015 dataset).
Electronics 12 02298 g008
Figure 9. Performance of the detection framework with different Transformer dual-decoder layers (Cresci-2015 dataset).
Electronics 12 02298 g009
Figure 10. Performance of the detection framework with different convolutional kernel sizes (Cresci-2015 dataset).
Electronics 12 02298 g010
Figure 11. Performance of the detection framework with different IB2V parameters (Cresci-2015 dataset); (a) performance of the detection framework with different number of random walks per node; (b) performance of the detection framework with different random walk distances.
Electronics 12 02298 g011
Table 1. The allocation rules for relationship strength levels and corresponding weights.
Relationship StrengthAllocation Rule Weight   ( W i )
Very Weak k = 1 1
Weak 2 k < 4 2
Medium 4 k < 6 3
Strong 6 k < 8 4
Very Strong k 8 5
Table 2. Details of the Cresci-2015 dataset.
Sub-DatasetsAccountsTweetsFriend RelationshipsFollow Relationships
TFP469563,693241,710258,494
E1314812,068,037667,2251,526,944
FSF116922,910253,02611,893
INT133758,925517,48523,173
TWT845114,192729,83928,588
Total number of accounts5301
Number of bots3351 (63%)
Table 3. Evaluation metrics.
MetricsFormulaDescription
Accuracy (ACC) TP + TN ALL Classification accuracy is the percentage of all categories identified correctly.
Precision TP TP + FP The ratio of the number of correctly identified malicious SMBs to the total number of identified samples.
Recall TP FN + TP The ratio of the number of correctly identified malicious SMBs to the number of samples that should be identified.
F1 score 2 TP 2 TP + FP + FN F1 score is a statistical metric to measure model accuracy. Both accuracy and recall are considered in the metric.
Table 4. Hyperparameter settings of the proposed detection framework.
HyperparametersSettings
User behavior sequence length (l)64
Embedding dimension (d)128
Representation dimension e 128
Transformer Encoder layers ( n e ) 2
Transformer dual-decoder layers ( n d ) 1
Convolution kernel size ( k w ,   k e )[8, d]
Skip-gram sliding window size ( s w )7
Negative sampling sample size ( K )5
Random walk distance ( l )30
Number of random walks per node ( w )20
Return parameter ( p )1
In–out parameter ( q )1
Out-community parameter (r)1
DNN Layers3
Dropout rate0.1
Learning rate1 × 10−4
Table 5. Detection results on Cresci-2015 and TwiBot-22.
MethodsCresci-2015TwiBot-22
ACCPrecisionRecallF1ACCPrecisionRecallF1
AdaBoost [14]0.75330.99820.60950.75740.76500.80000.14990.2474
DeeProBot [33]0.84270.92960.79310.85590.65870.44310.61980.5167
BotRGCN [11]0.96520.95510.99170.97310.79660.74810.46800.5750
SATAR [22]0.93420.90660.99880.95050.78220.72700.45100.5567
MRLBot0.97250.96540.99200.97850.80250.78450.50500.6145
Table 6. Detection results on Social-Spammer and MicroblogPCU.
MethodsSocial-SpammerMicroblogPCU
ACCPrecisionRecallF1ACCPrecisionRecallF1
AdaBoost [14]0.96550.54560.75290.63270.89910.85710.83220.8445
DeeProBot [33]0.96330.52480.74120.61450.90520.85070.86550.8580
BotRGCN [11]0.99670.94290.97550.95890.91080.86360.87670.8701
SATAR [22]0.99600.93190.96950.95030.91210.85290.88560.8689
MRLBot0.99620.93250.97420.95290.92540.88060.90880.8945
Table 7. Detection F1 score with different learning strategies (Social-Spammer dataset).
StrategiesDataset Size
60%70%80%90%100%
Original learning0.94310.97440.97820.95210.9529
Incremental learning0.92100.93520.92880.90350.8975
Table 8. Time consumption (seconds) for representation learning with different learning schemes (Social-Spammer dataset).
StrategiesDataset Size
60%70%80%90%100%
Original learning23,75228,50235,25338,00342,454
Incremental learning15,50019,68123,92226,83231,269
Table 9. Detection results of MRLBot before and after adding the relationship strength (Social-Spammer dataset).
Graph TypeSocial-Spammer Dataset
ACCPrecisionRecallF1
Directed unweighted graph0.9951 0.9176 0.9622 0.9394
Directed weighted graph0.9954 0.9204 0.9671 0.9432
Disclaimer/Publisher’s Note: The statements, opinions and data contained in all publications are solely those of the individual author(s) and contributor(s) and not of MDPI and/or the editor(s). MDPI and/or the editor(s) disclaim responsibility for any injury to people or property resulting from any ideas, methods, instructions or products referred to in the content.

