
On-Line Diagnostics of Electrolytic Capacitors in Fault-Tolerant LED Lighting Systems


Abstract
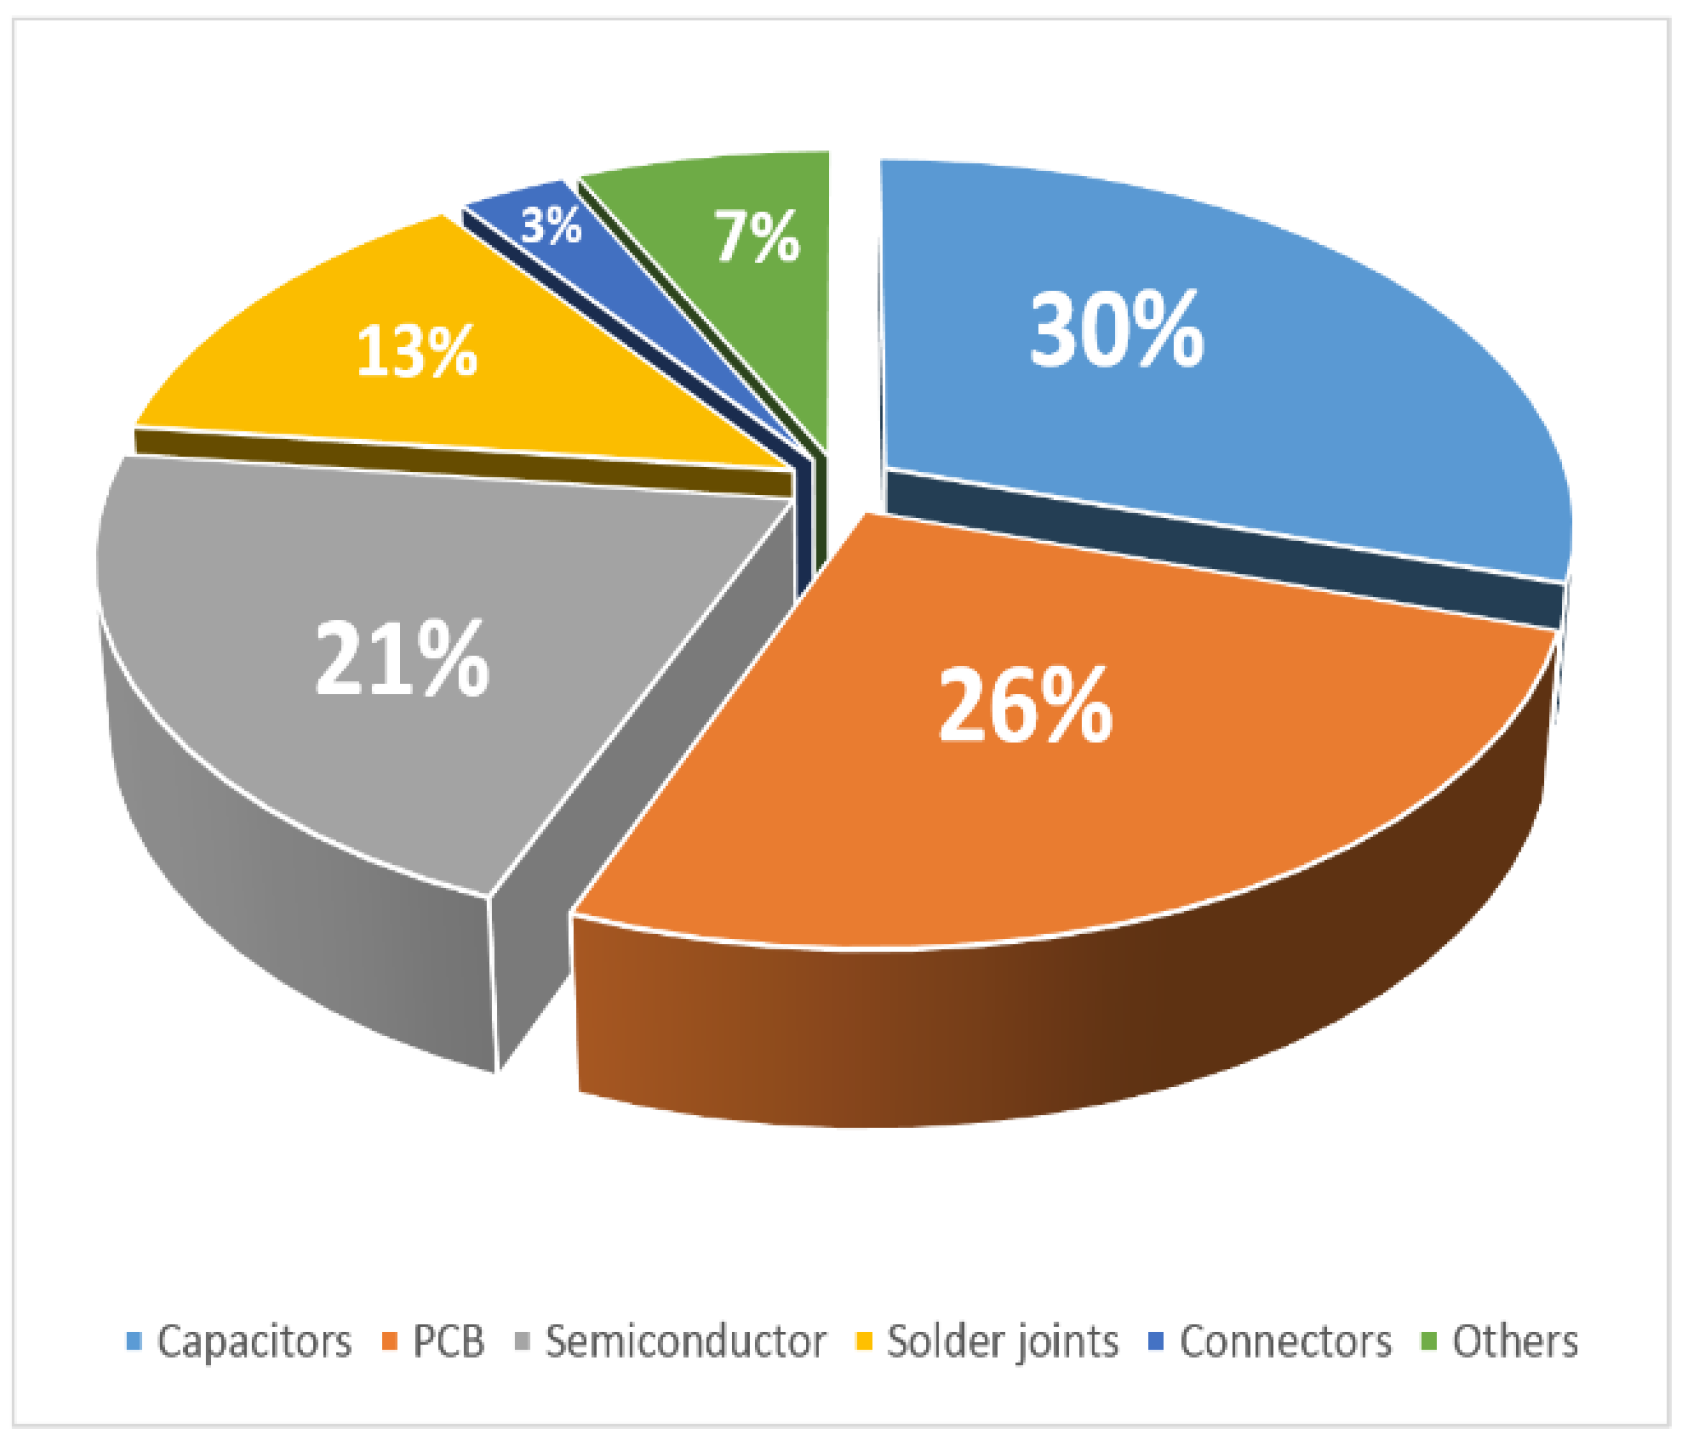
:1. Introduction
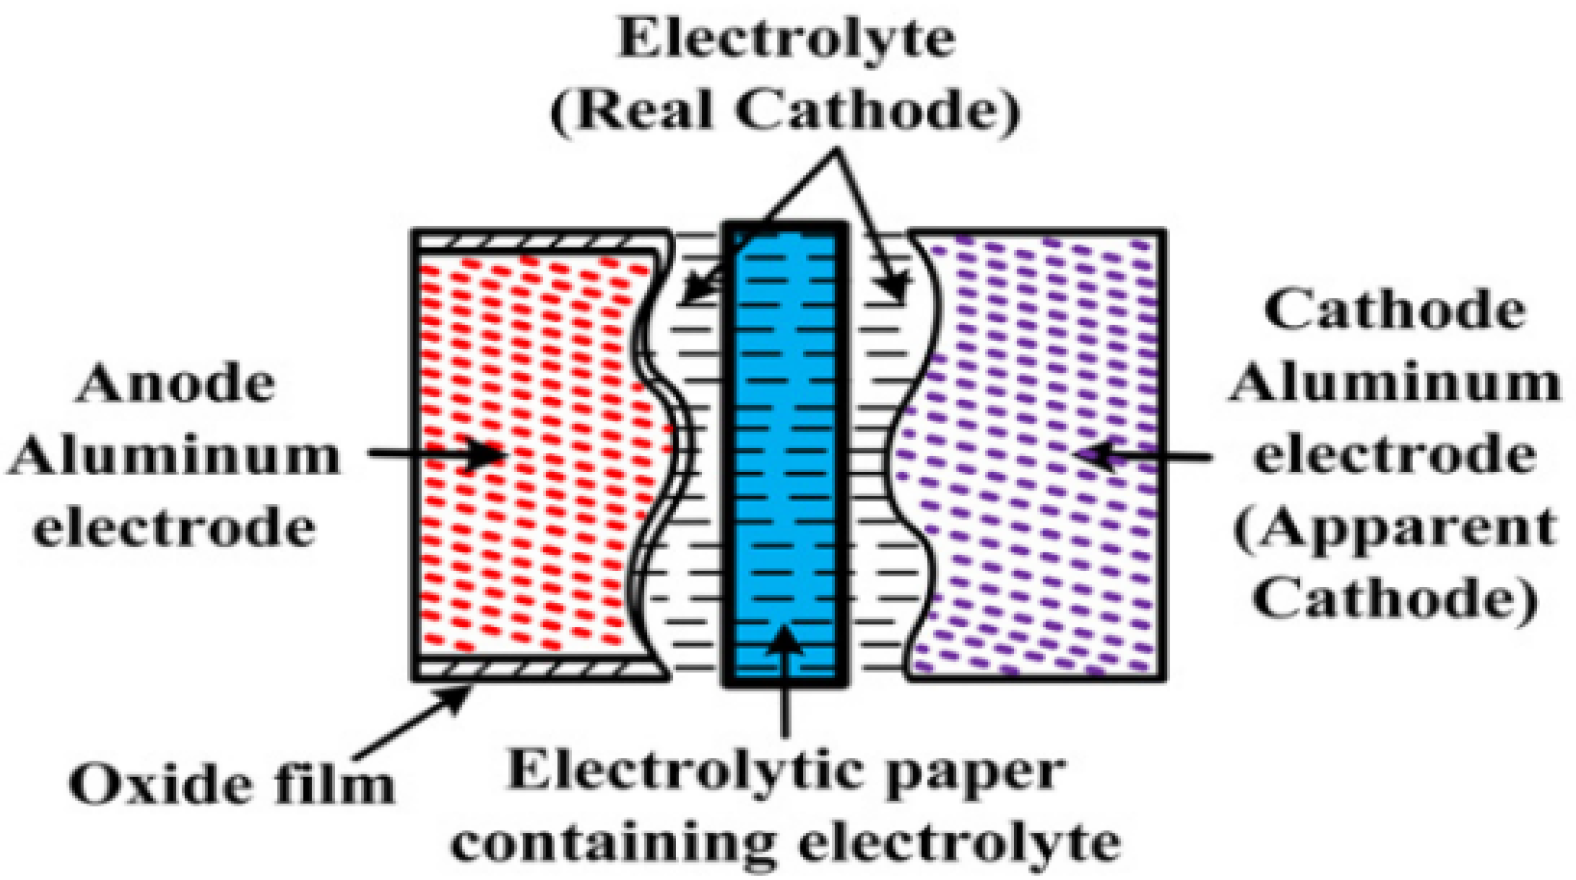
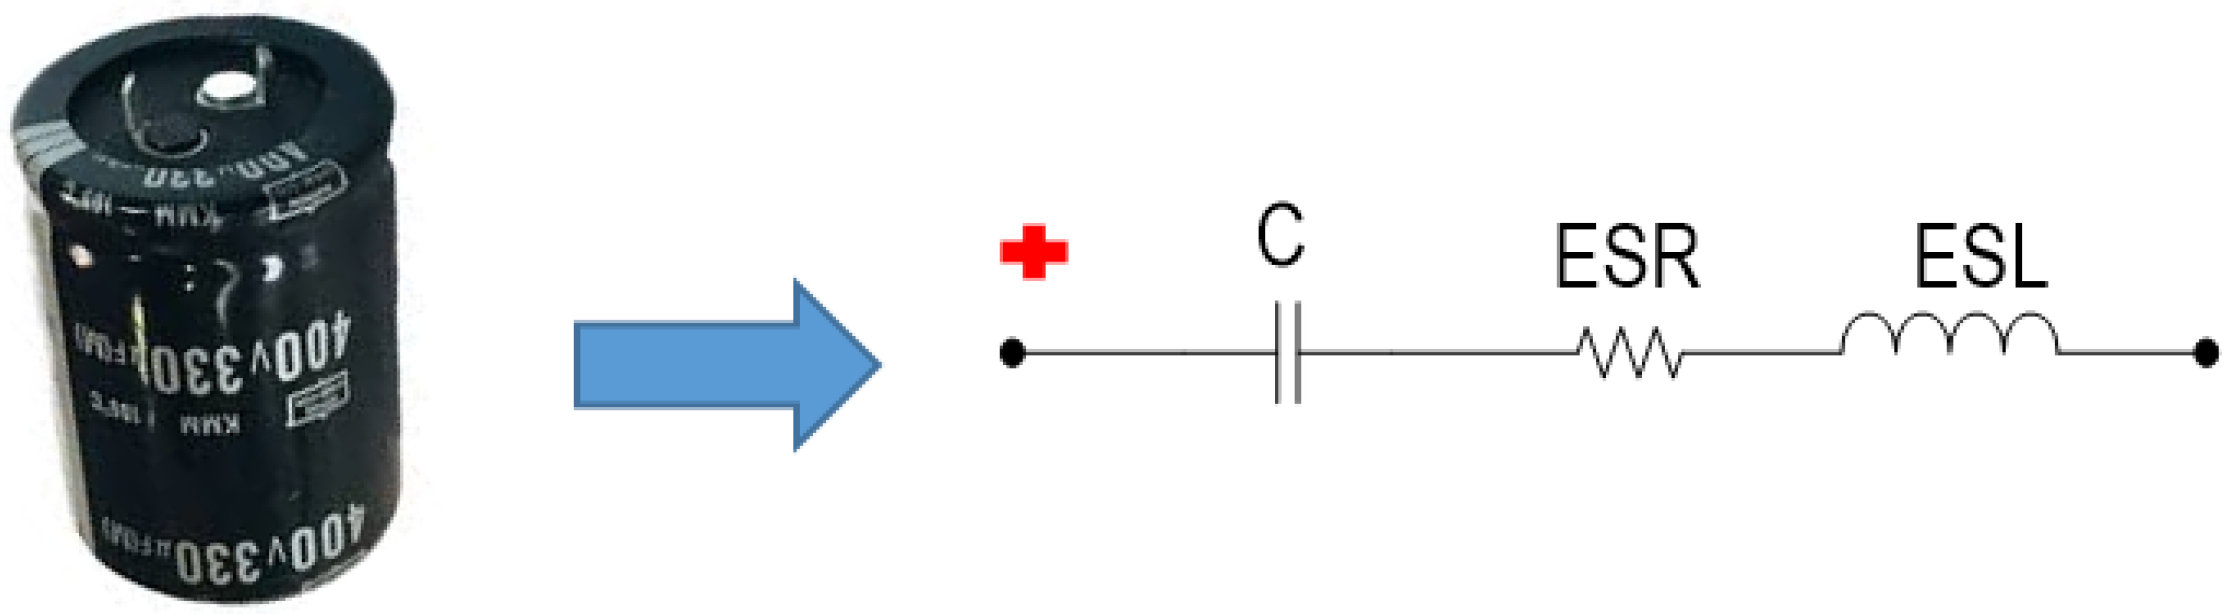
1.1. Characteristics and Equivalent Circuit of AECs
1.2. Temperature Effect
1.3. Proposed Converter Architecture
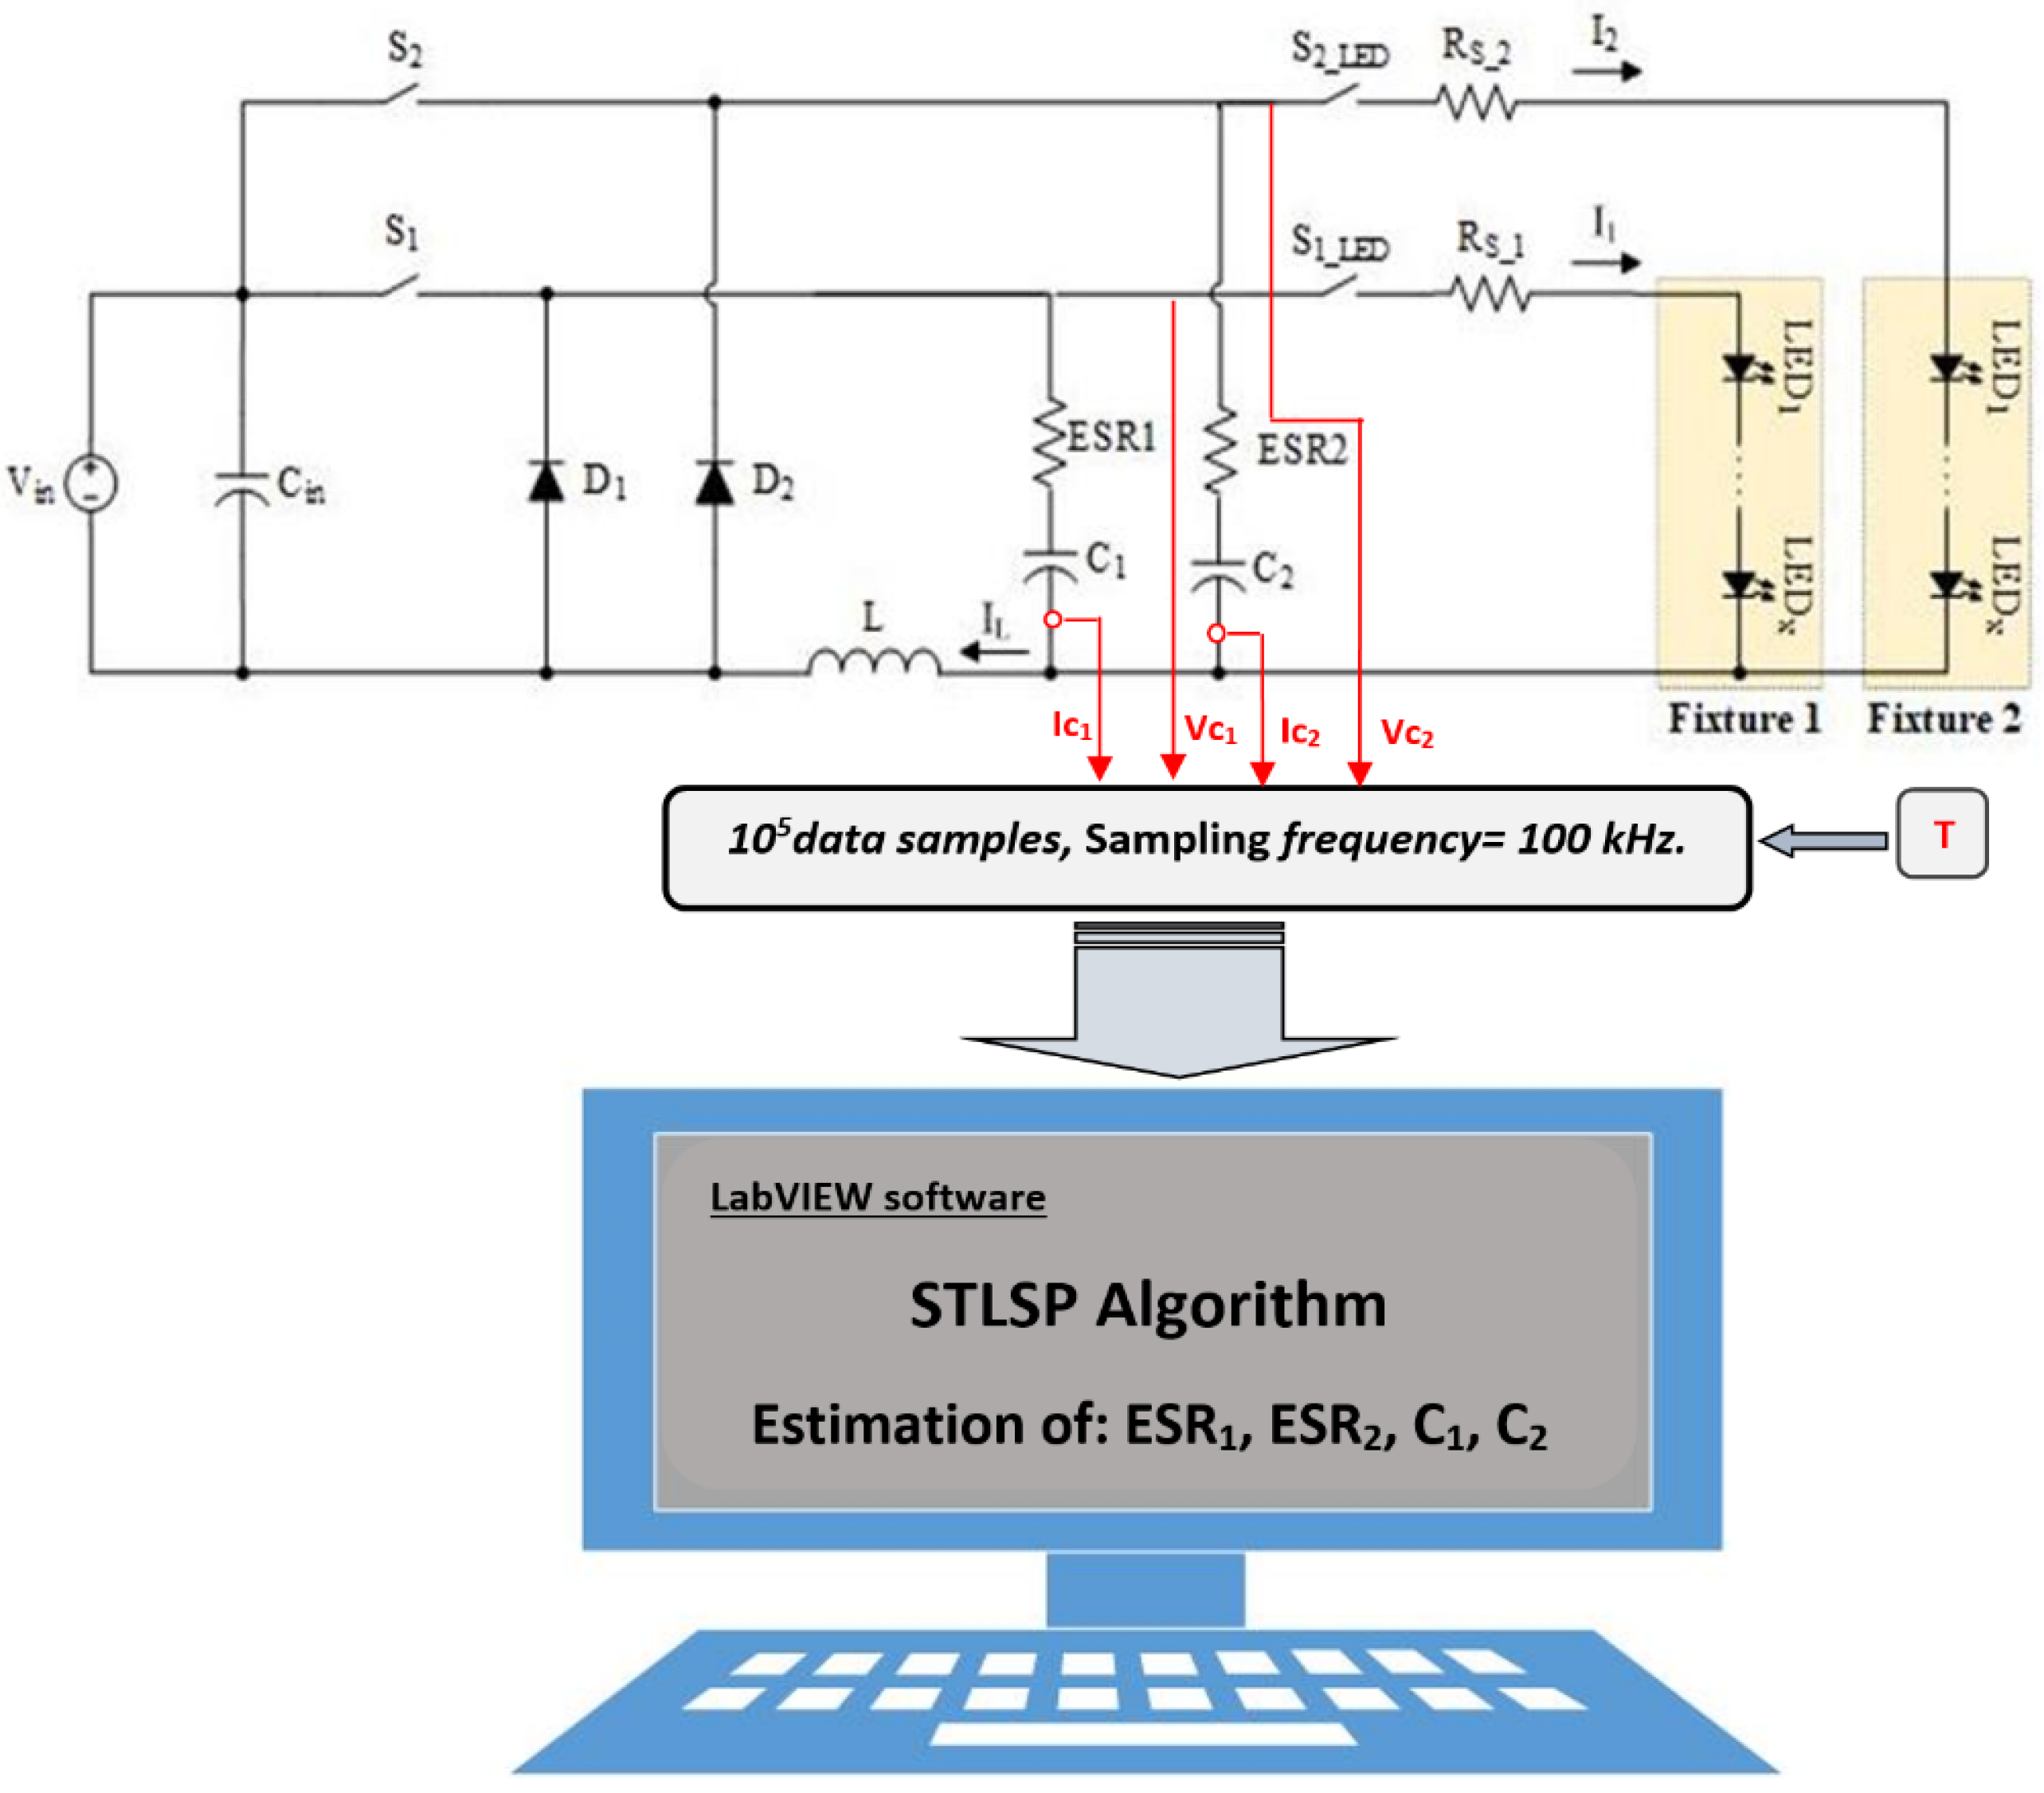
2. Converter Control and Fault-Detection Algorithm
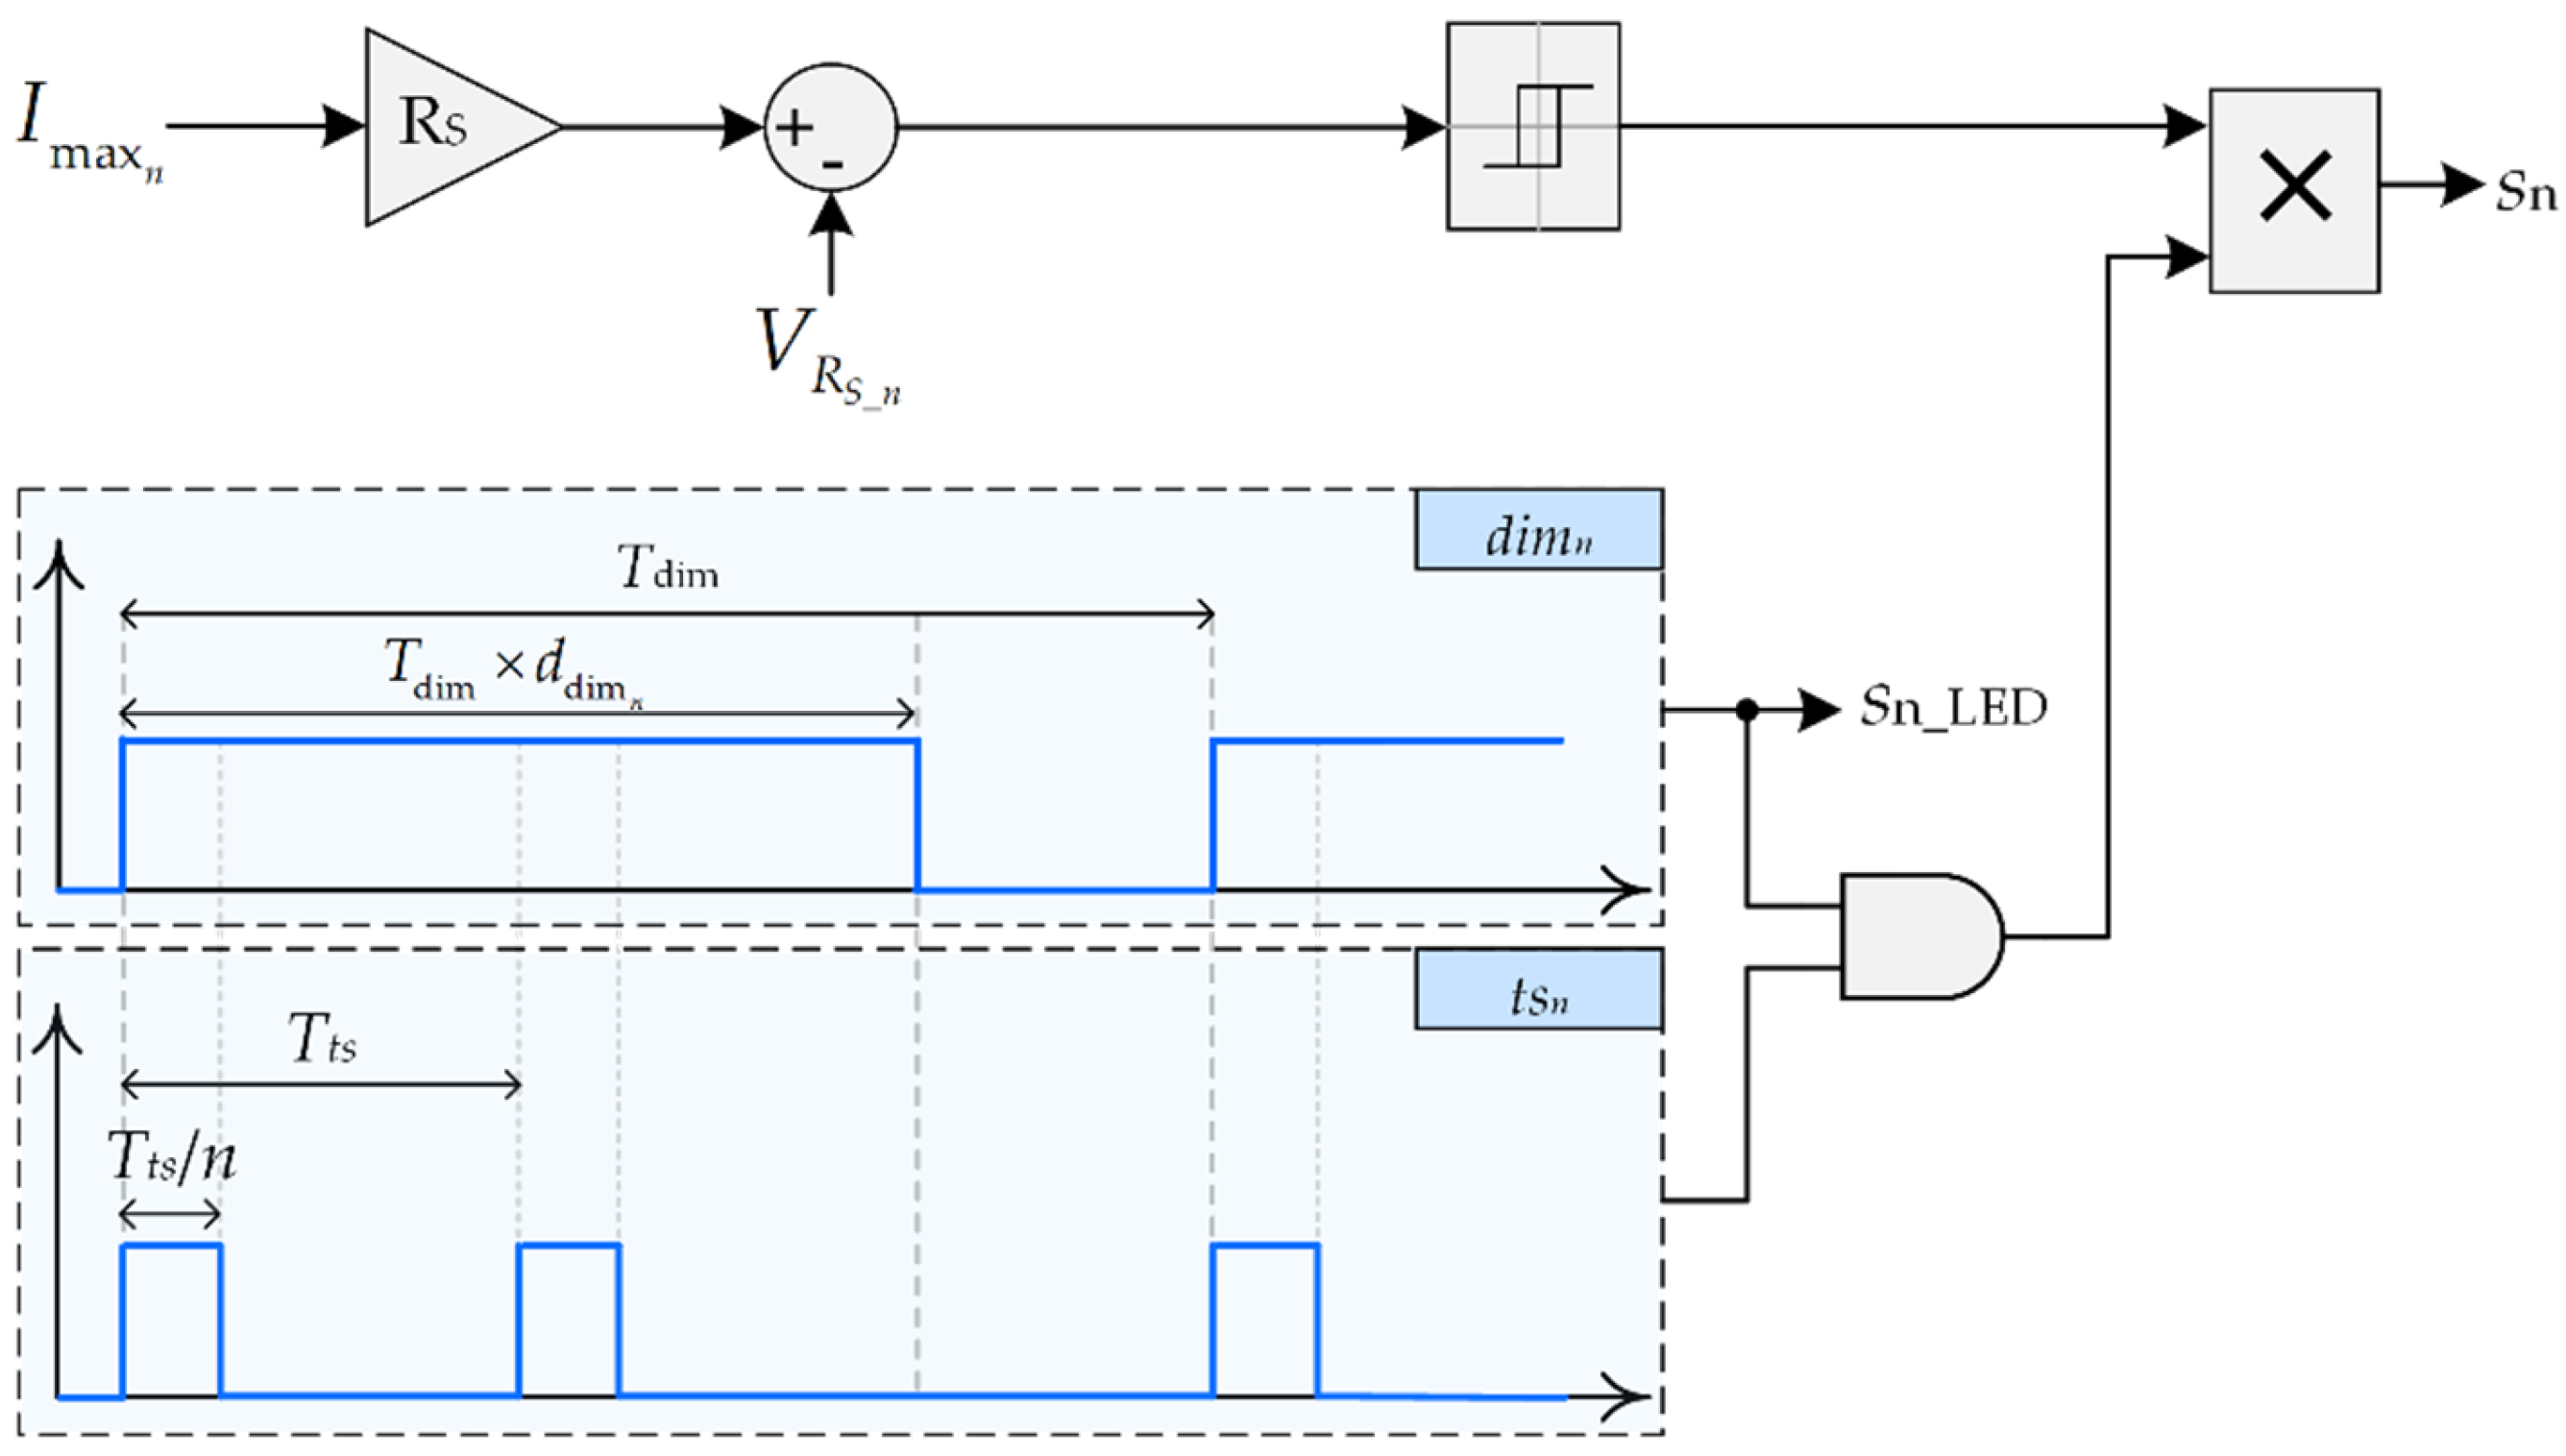
2.1. Converter Control
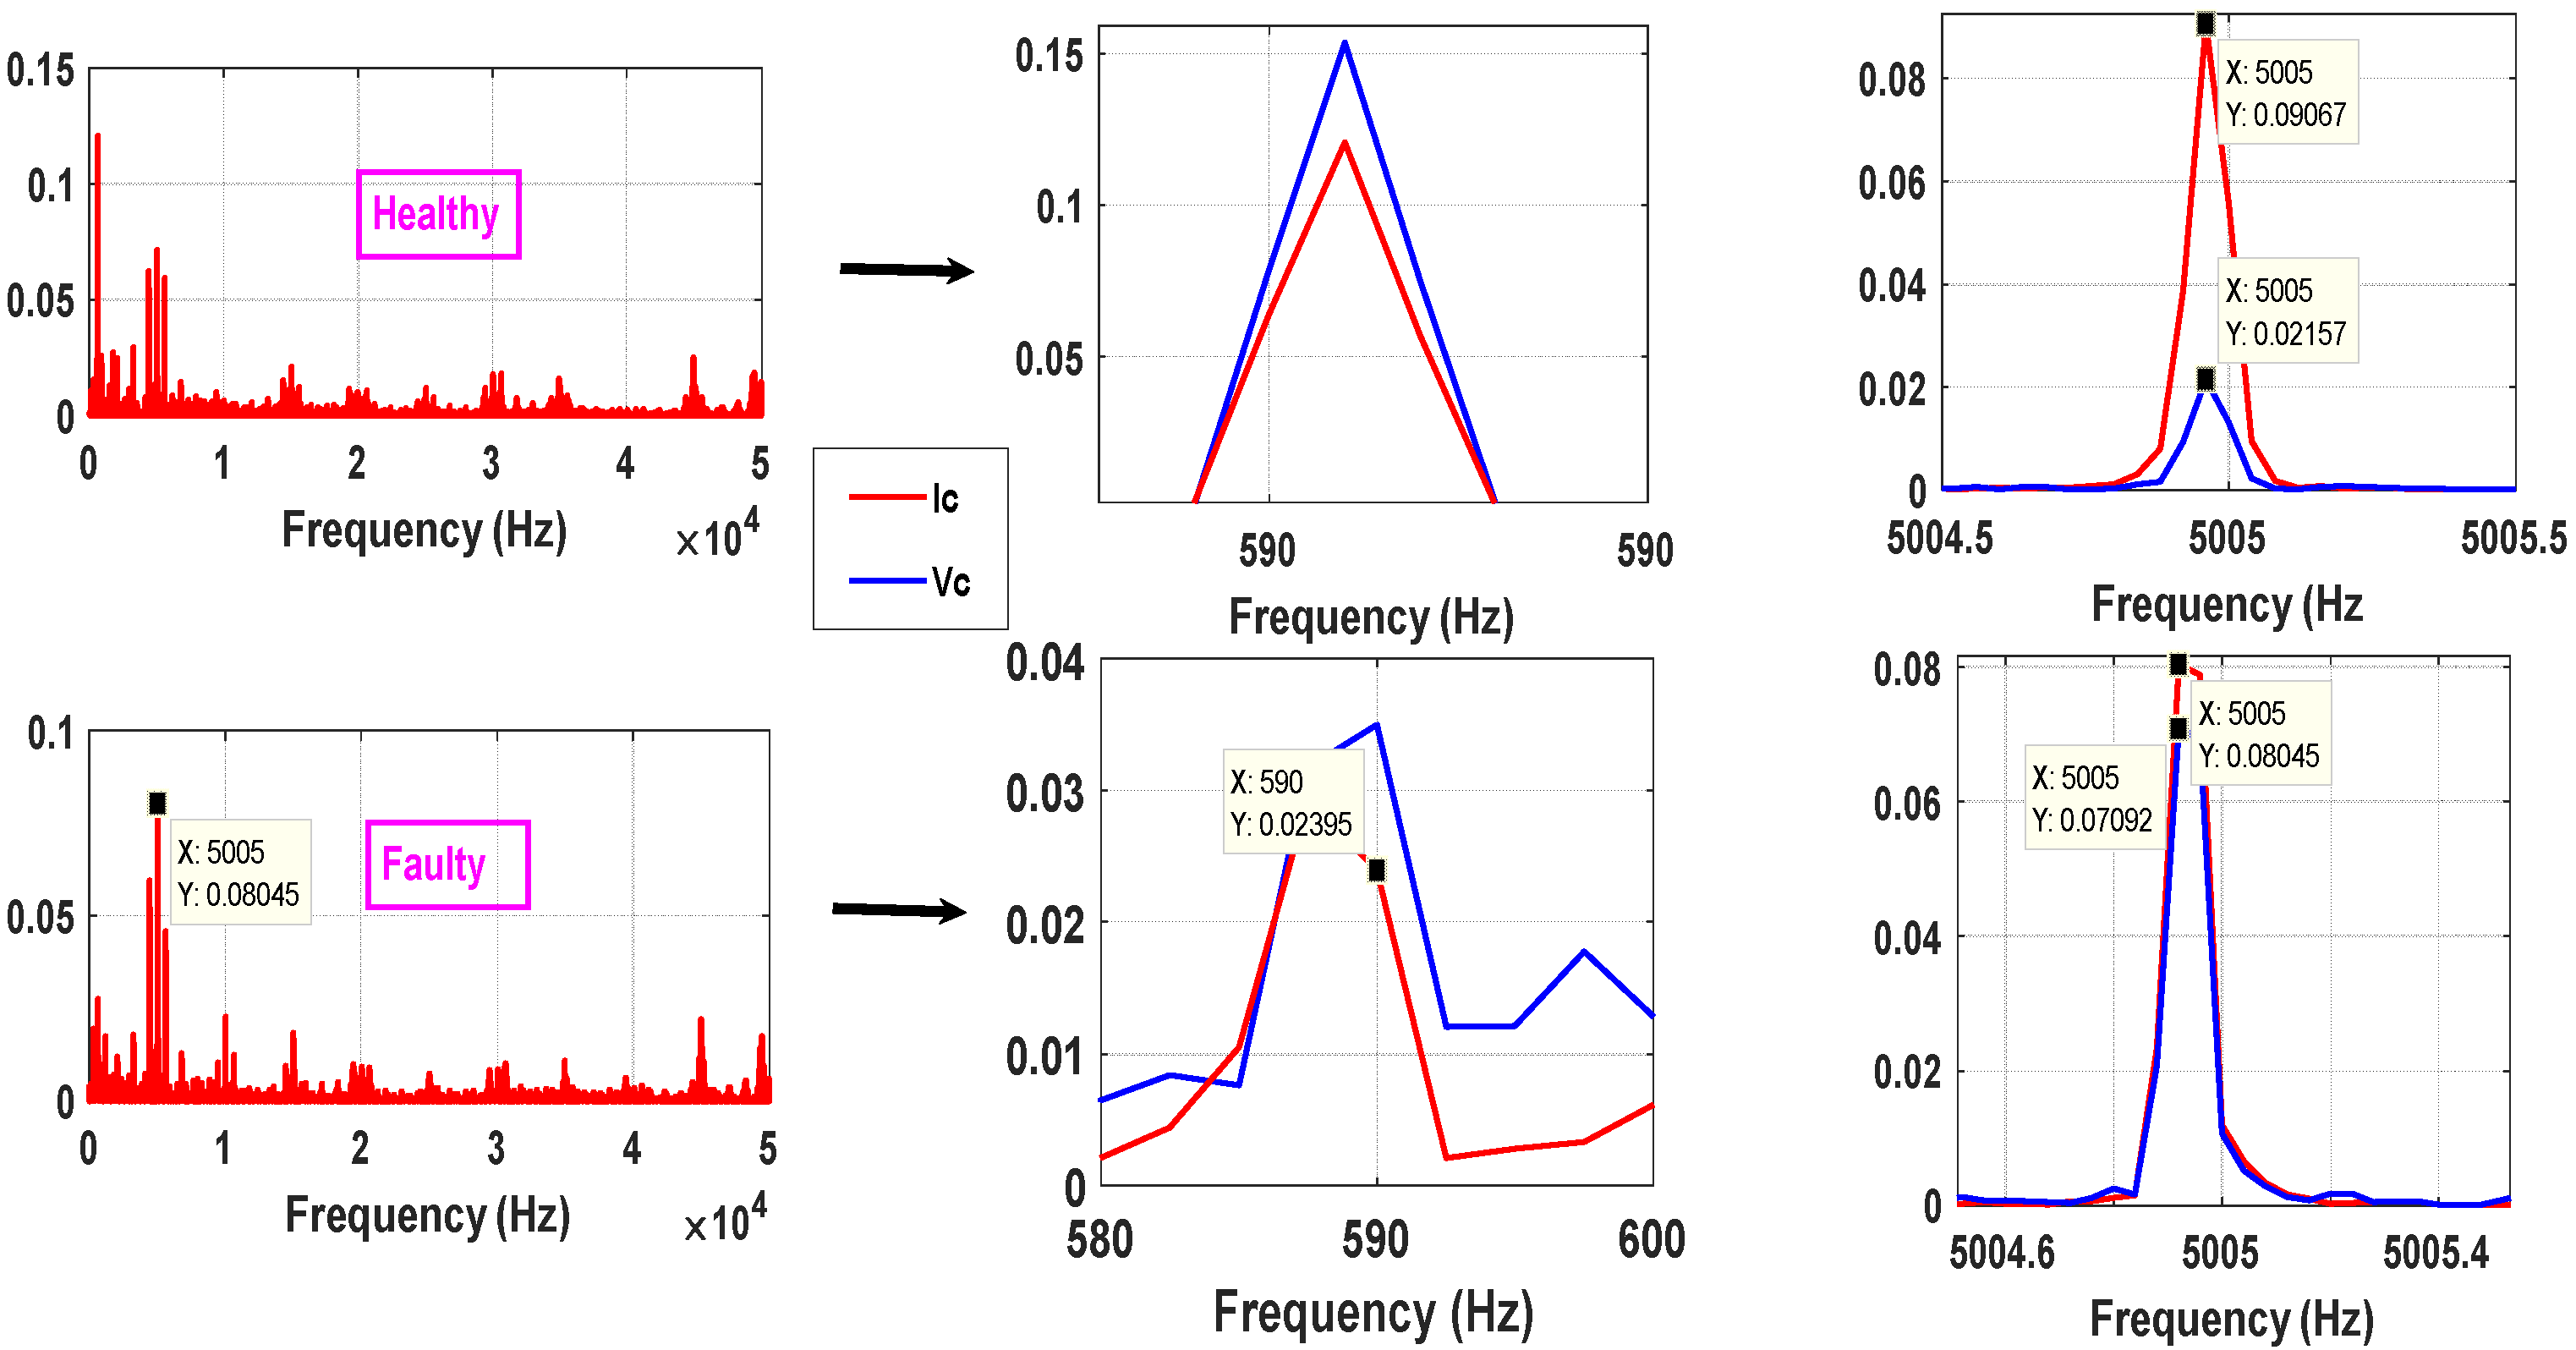
2.2. Fault-Detection Algorithm
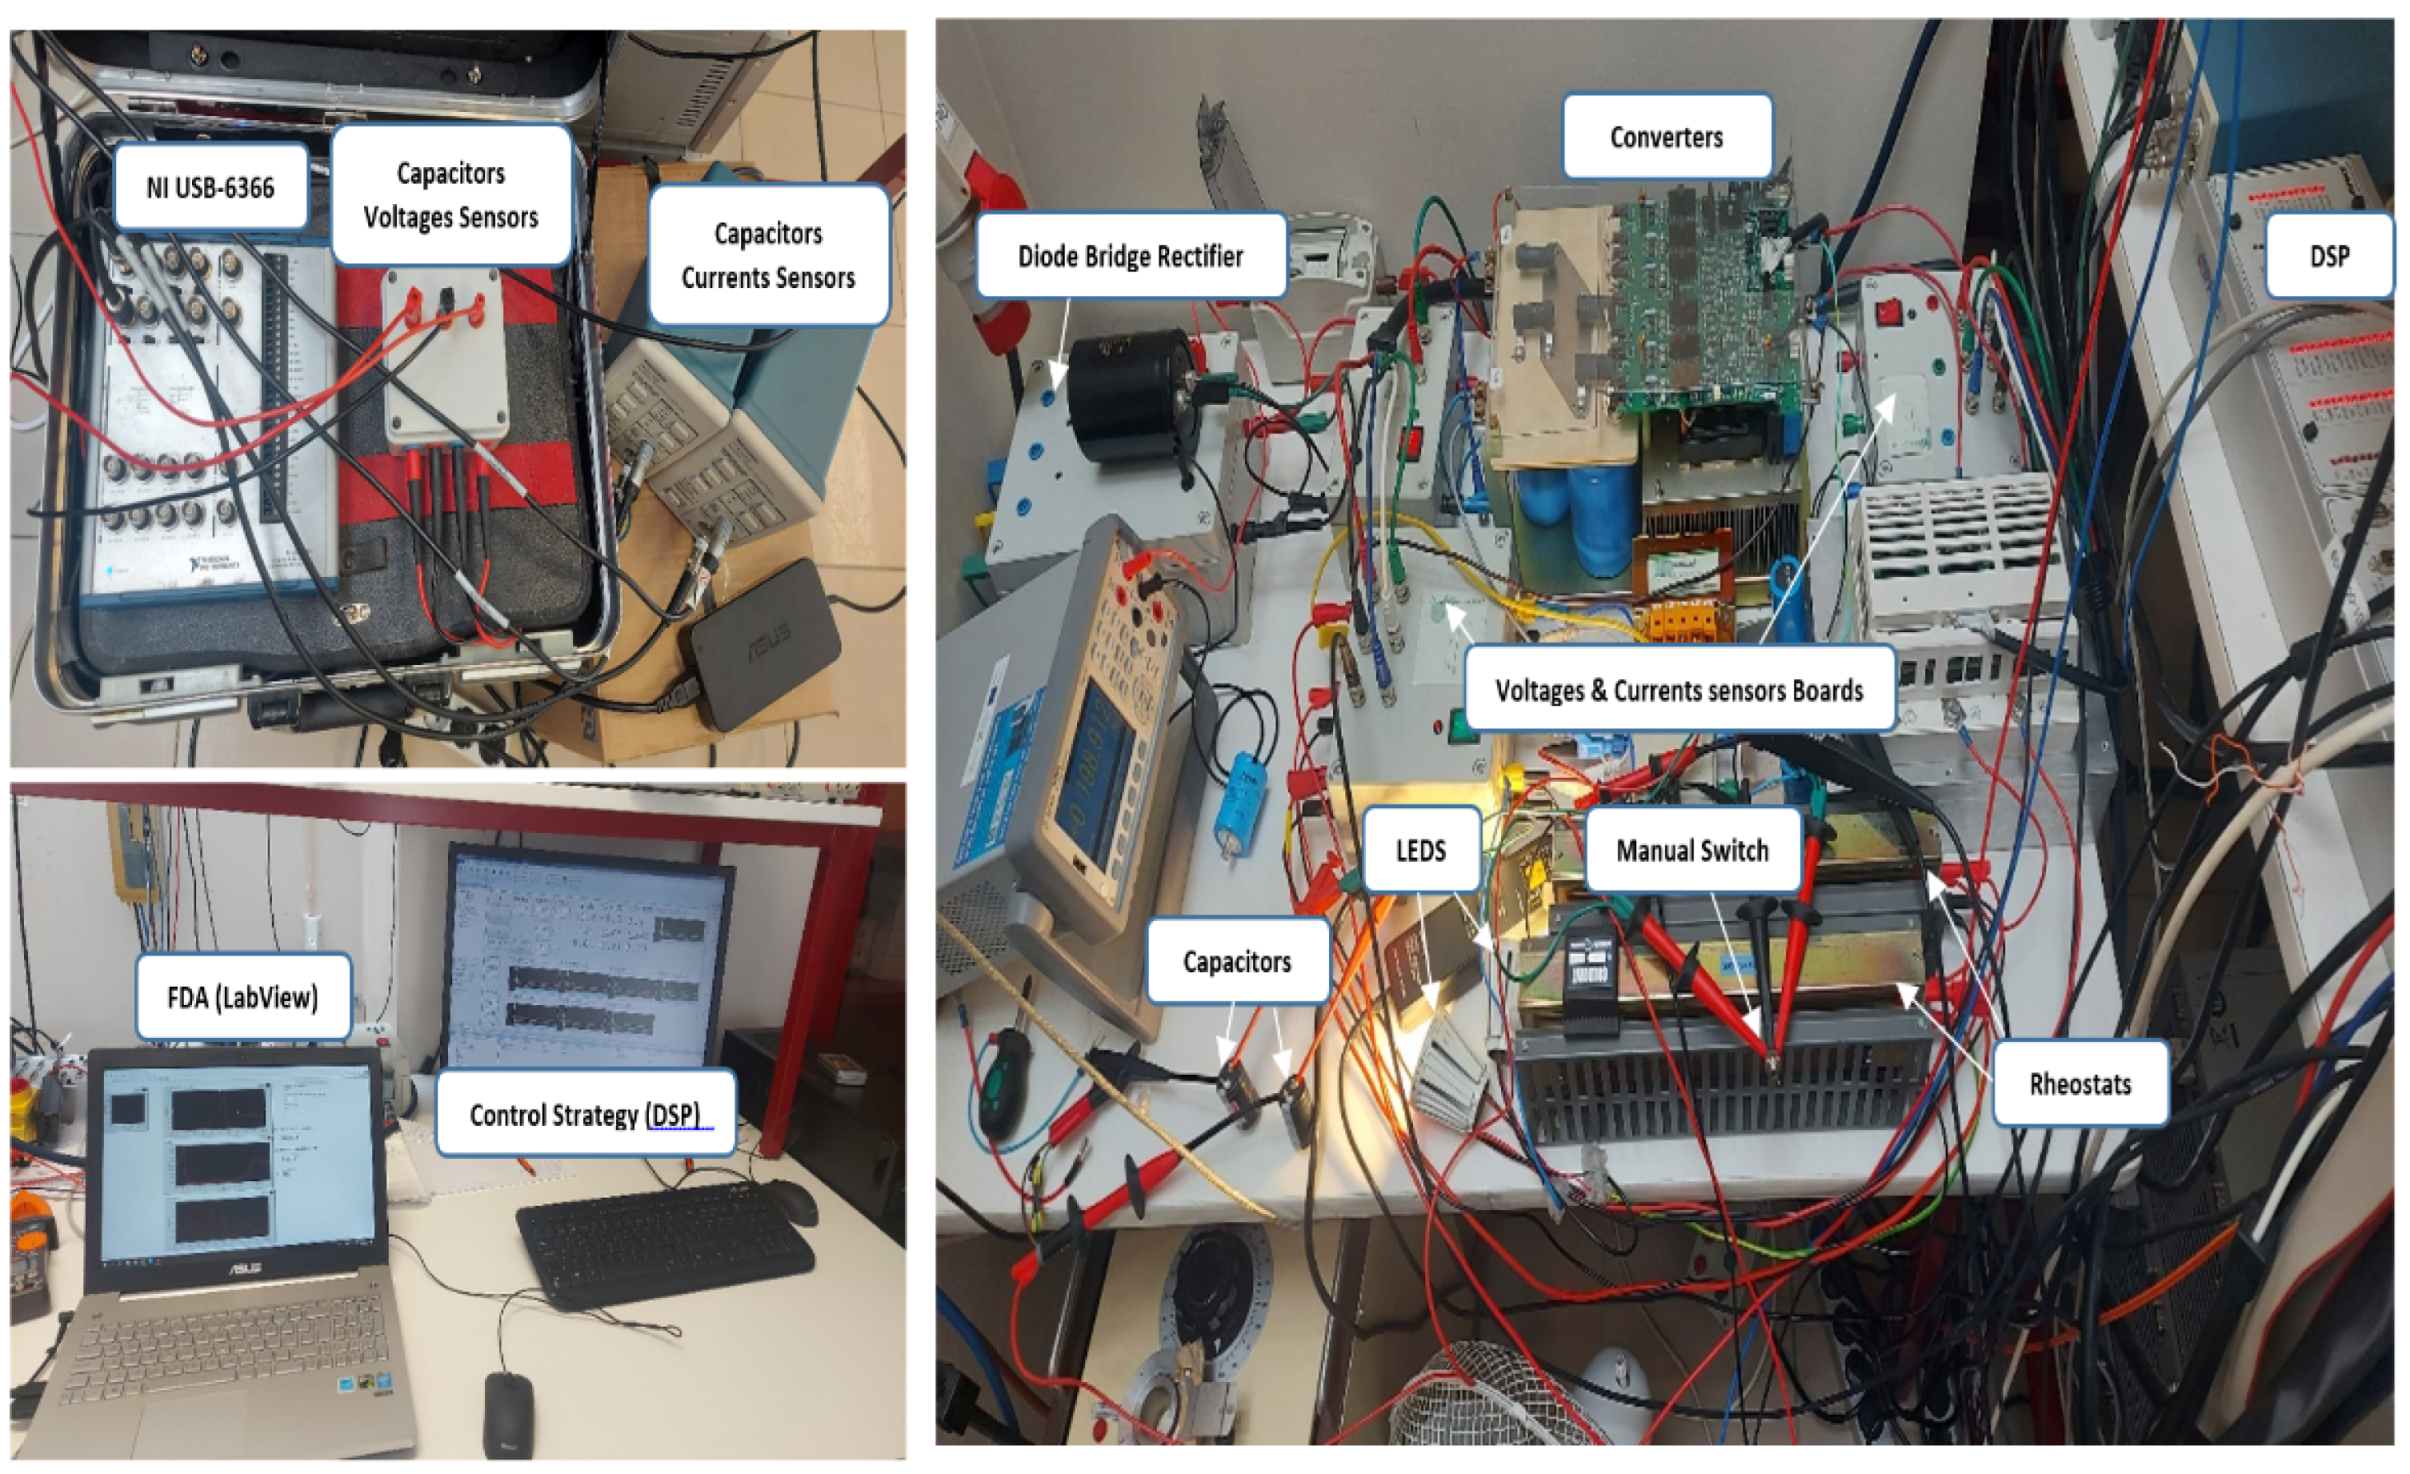
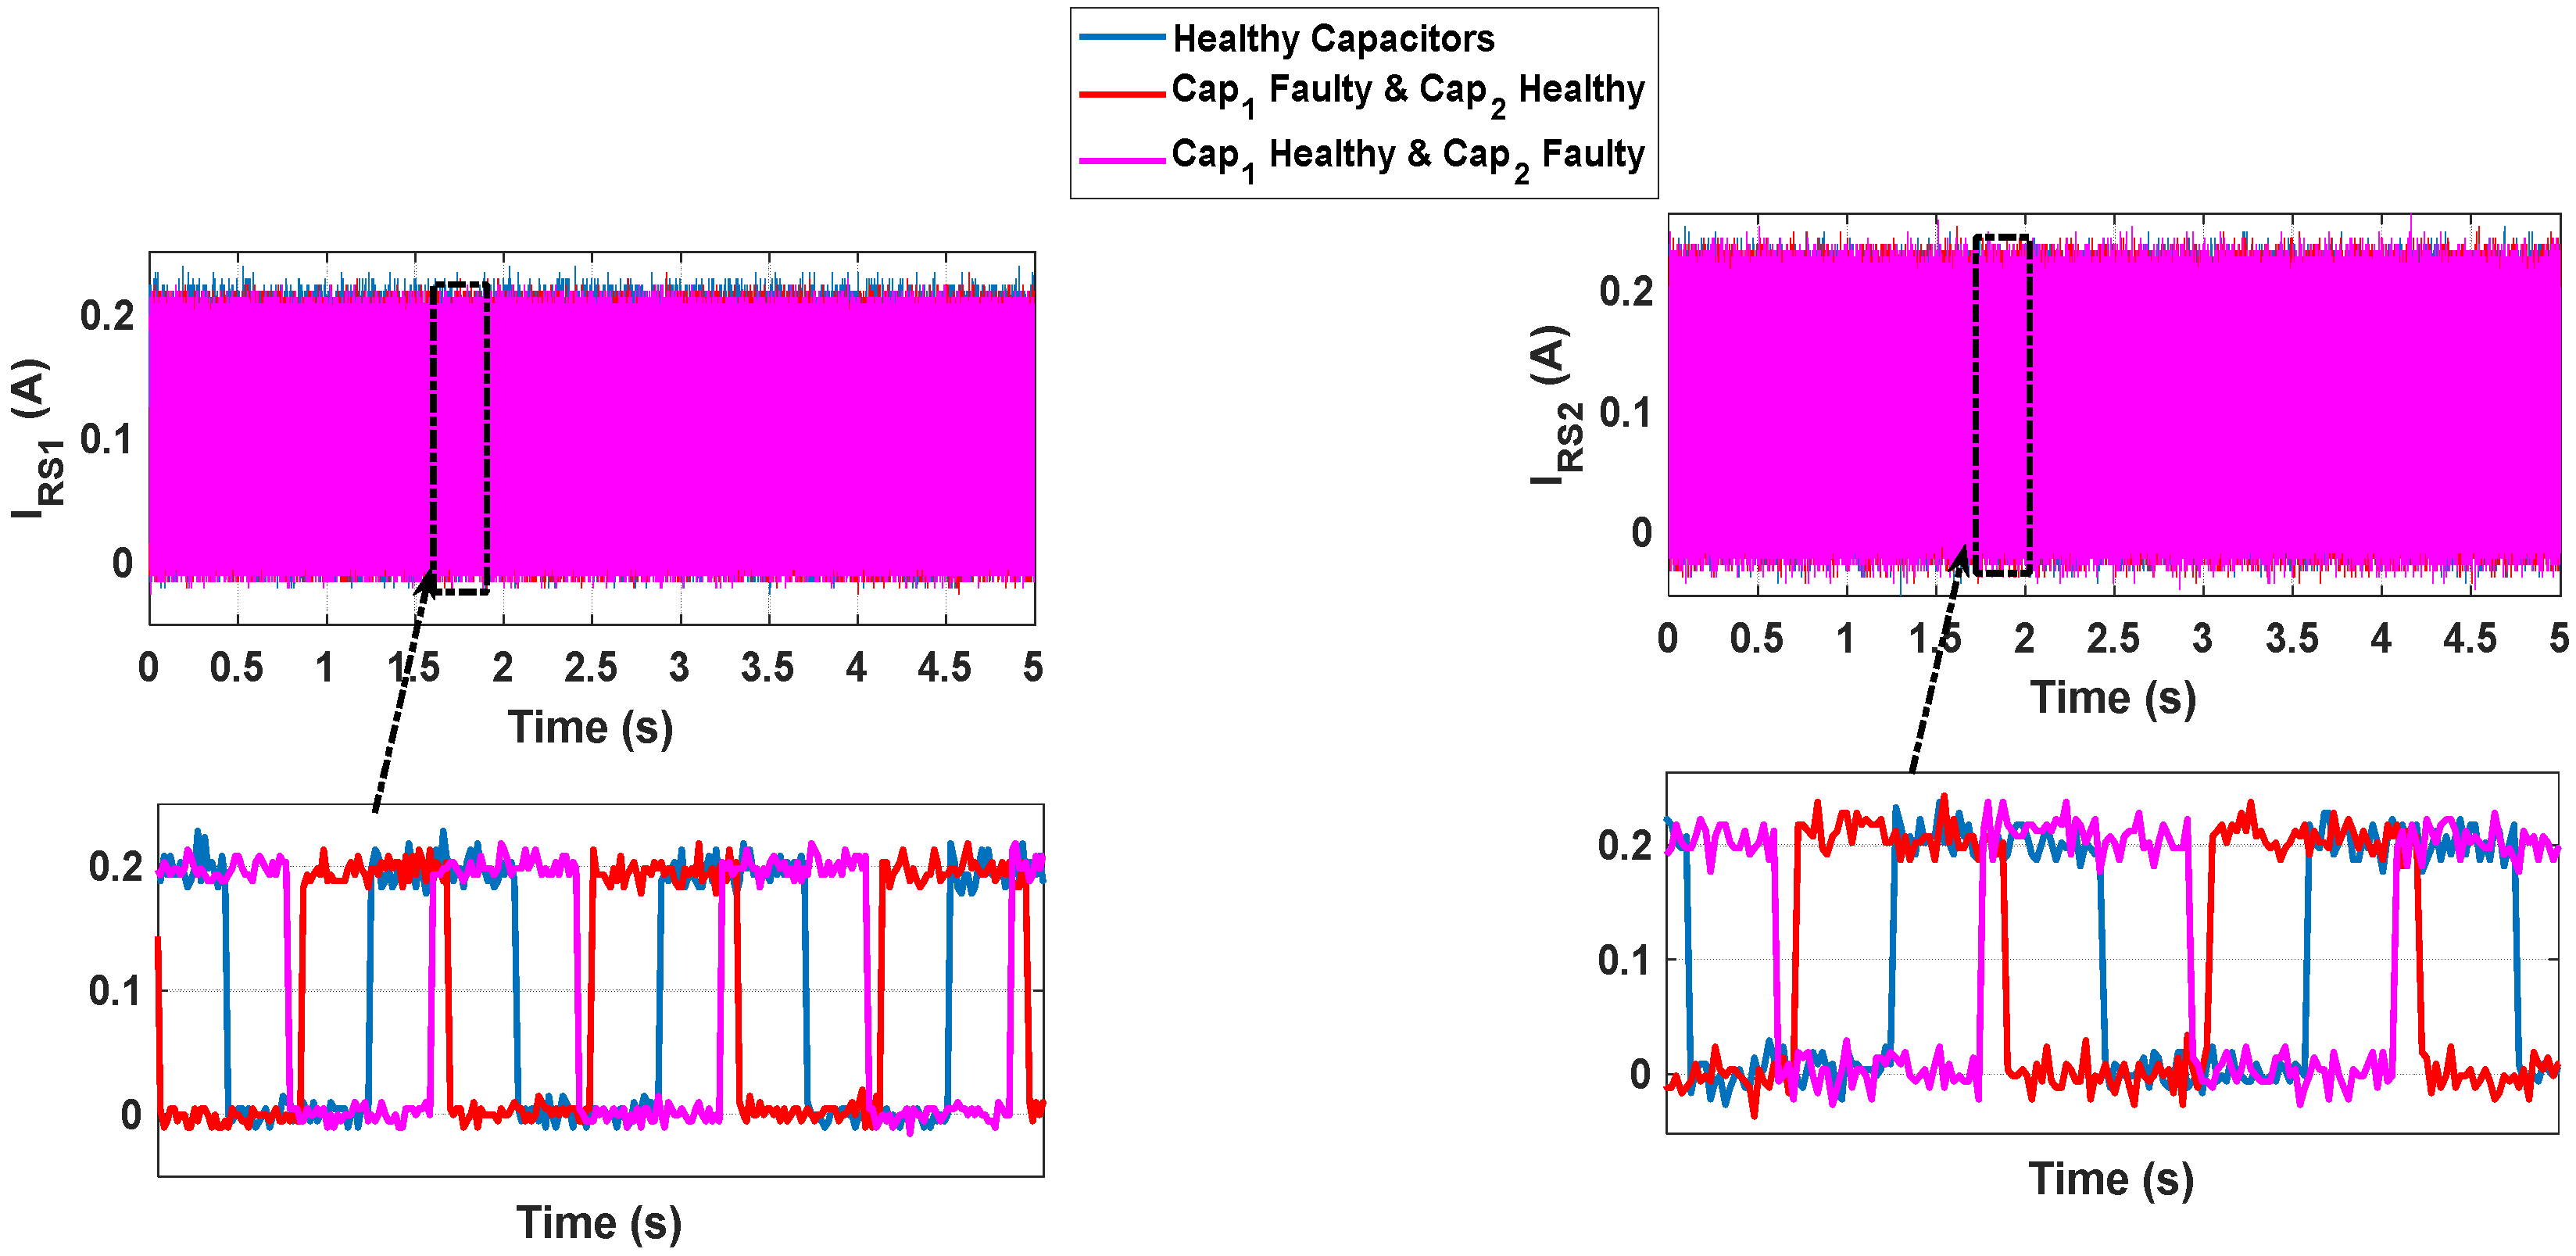
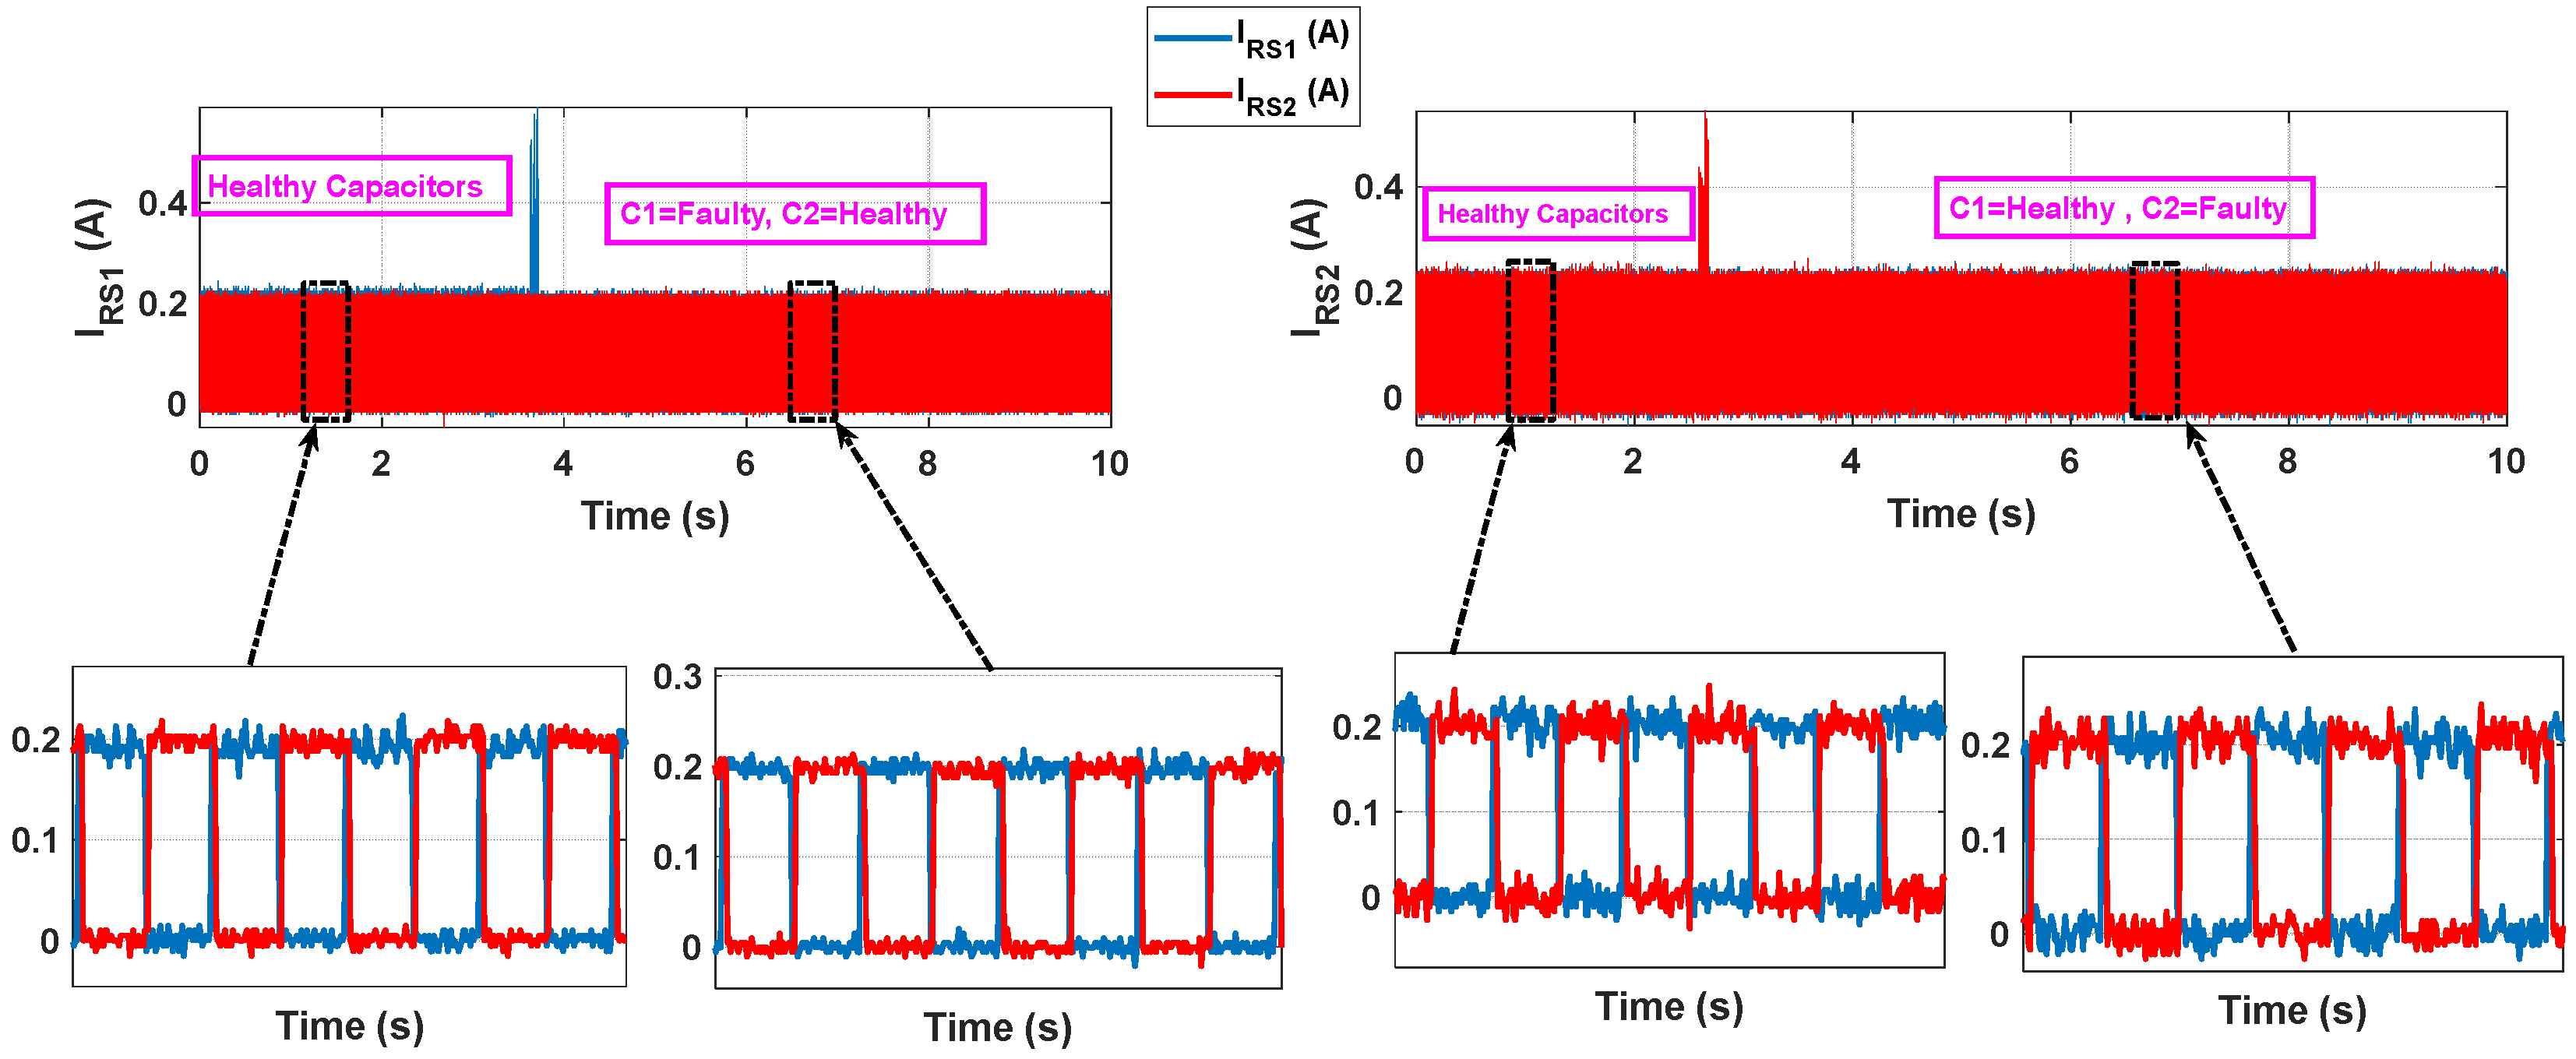
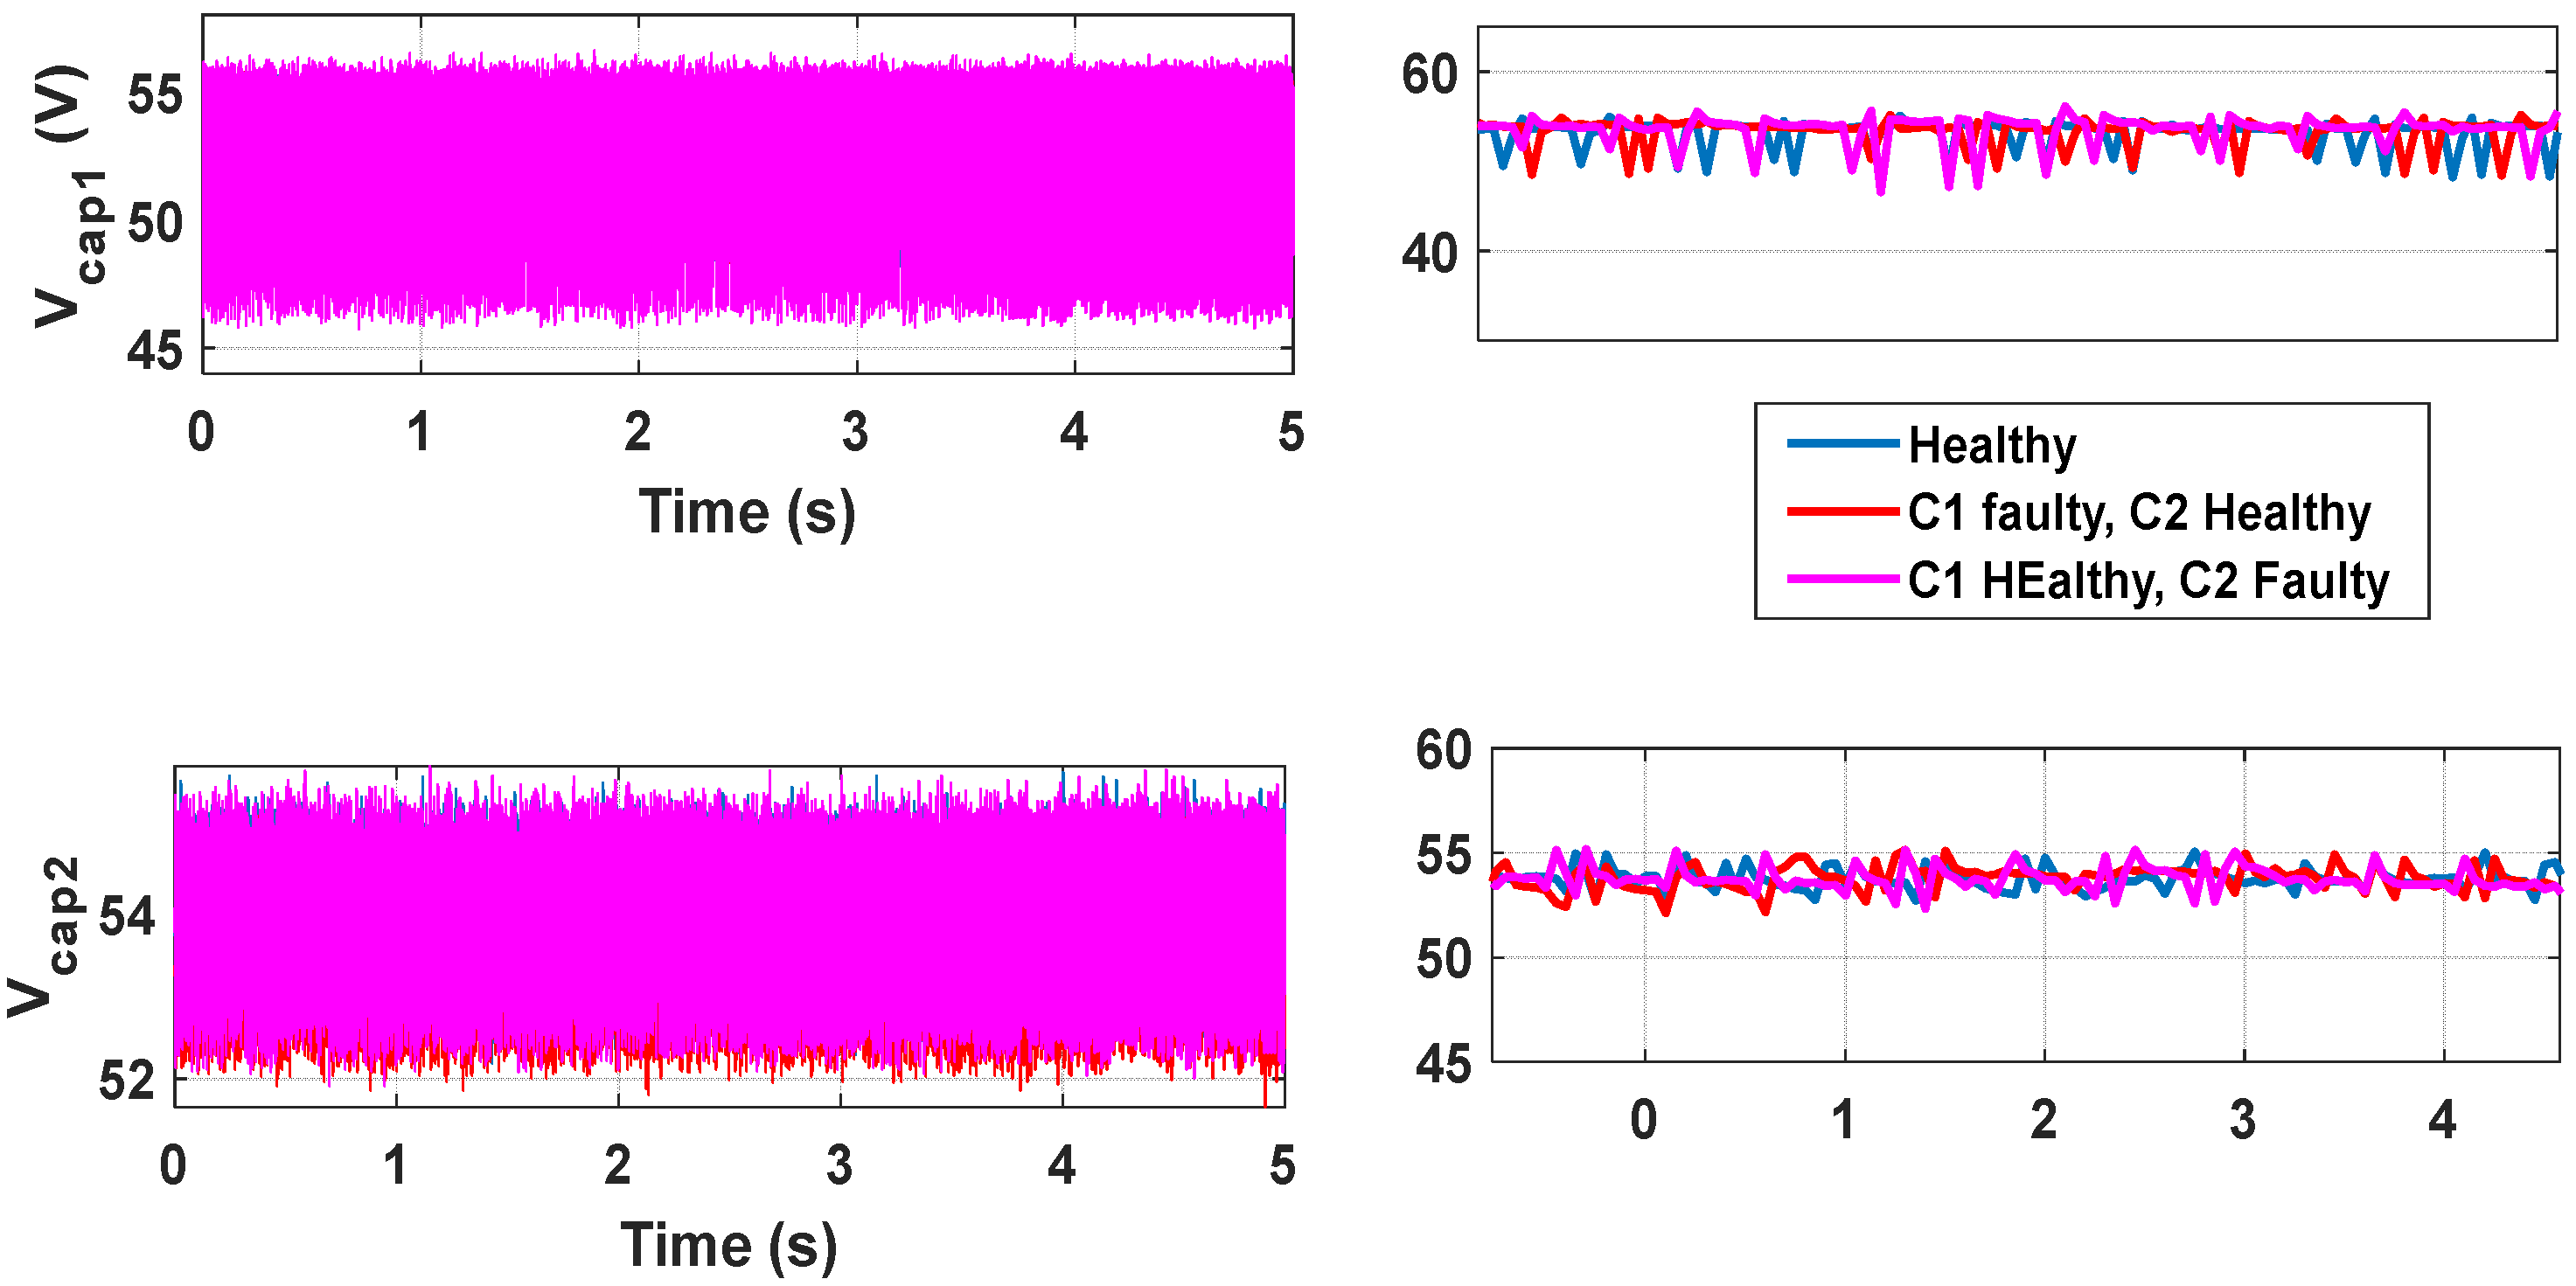
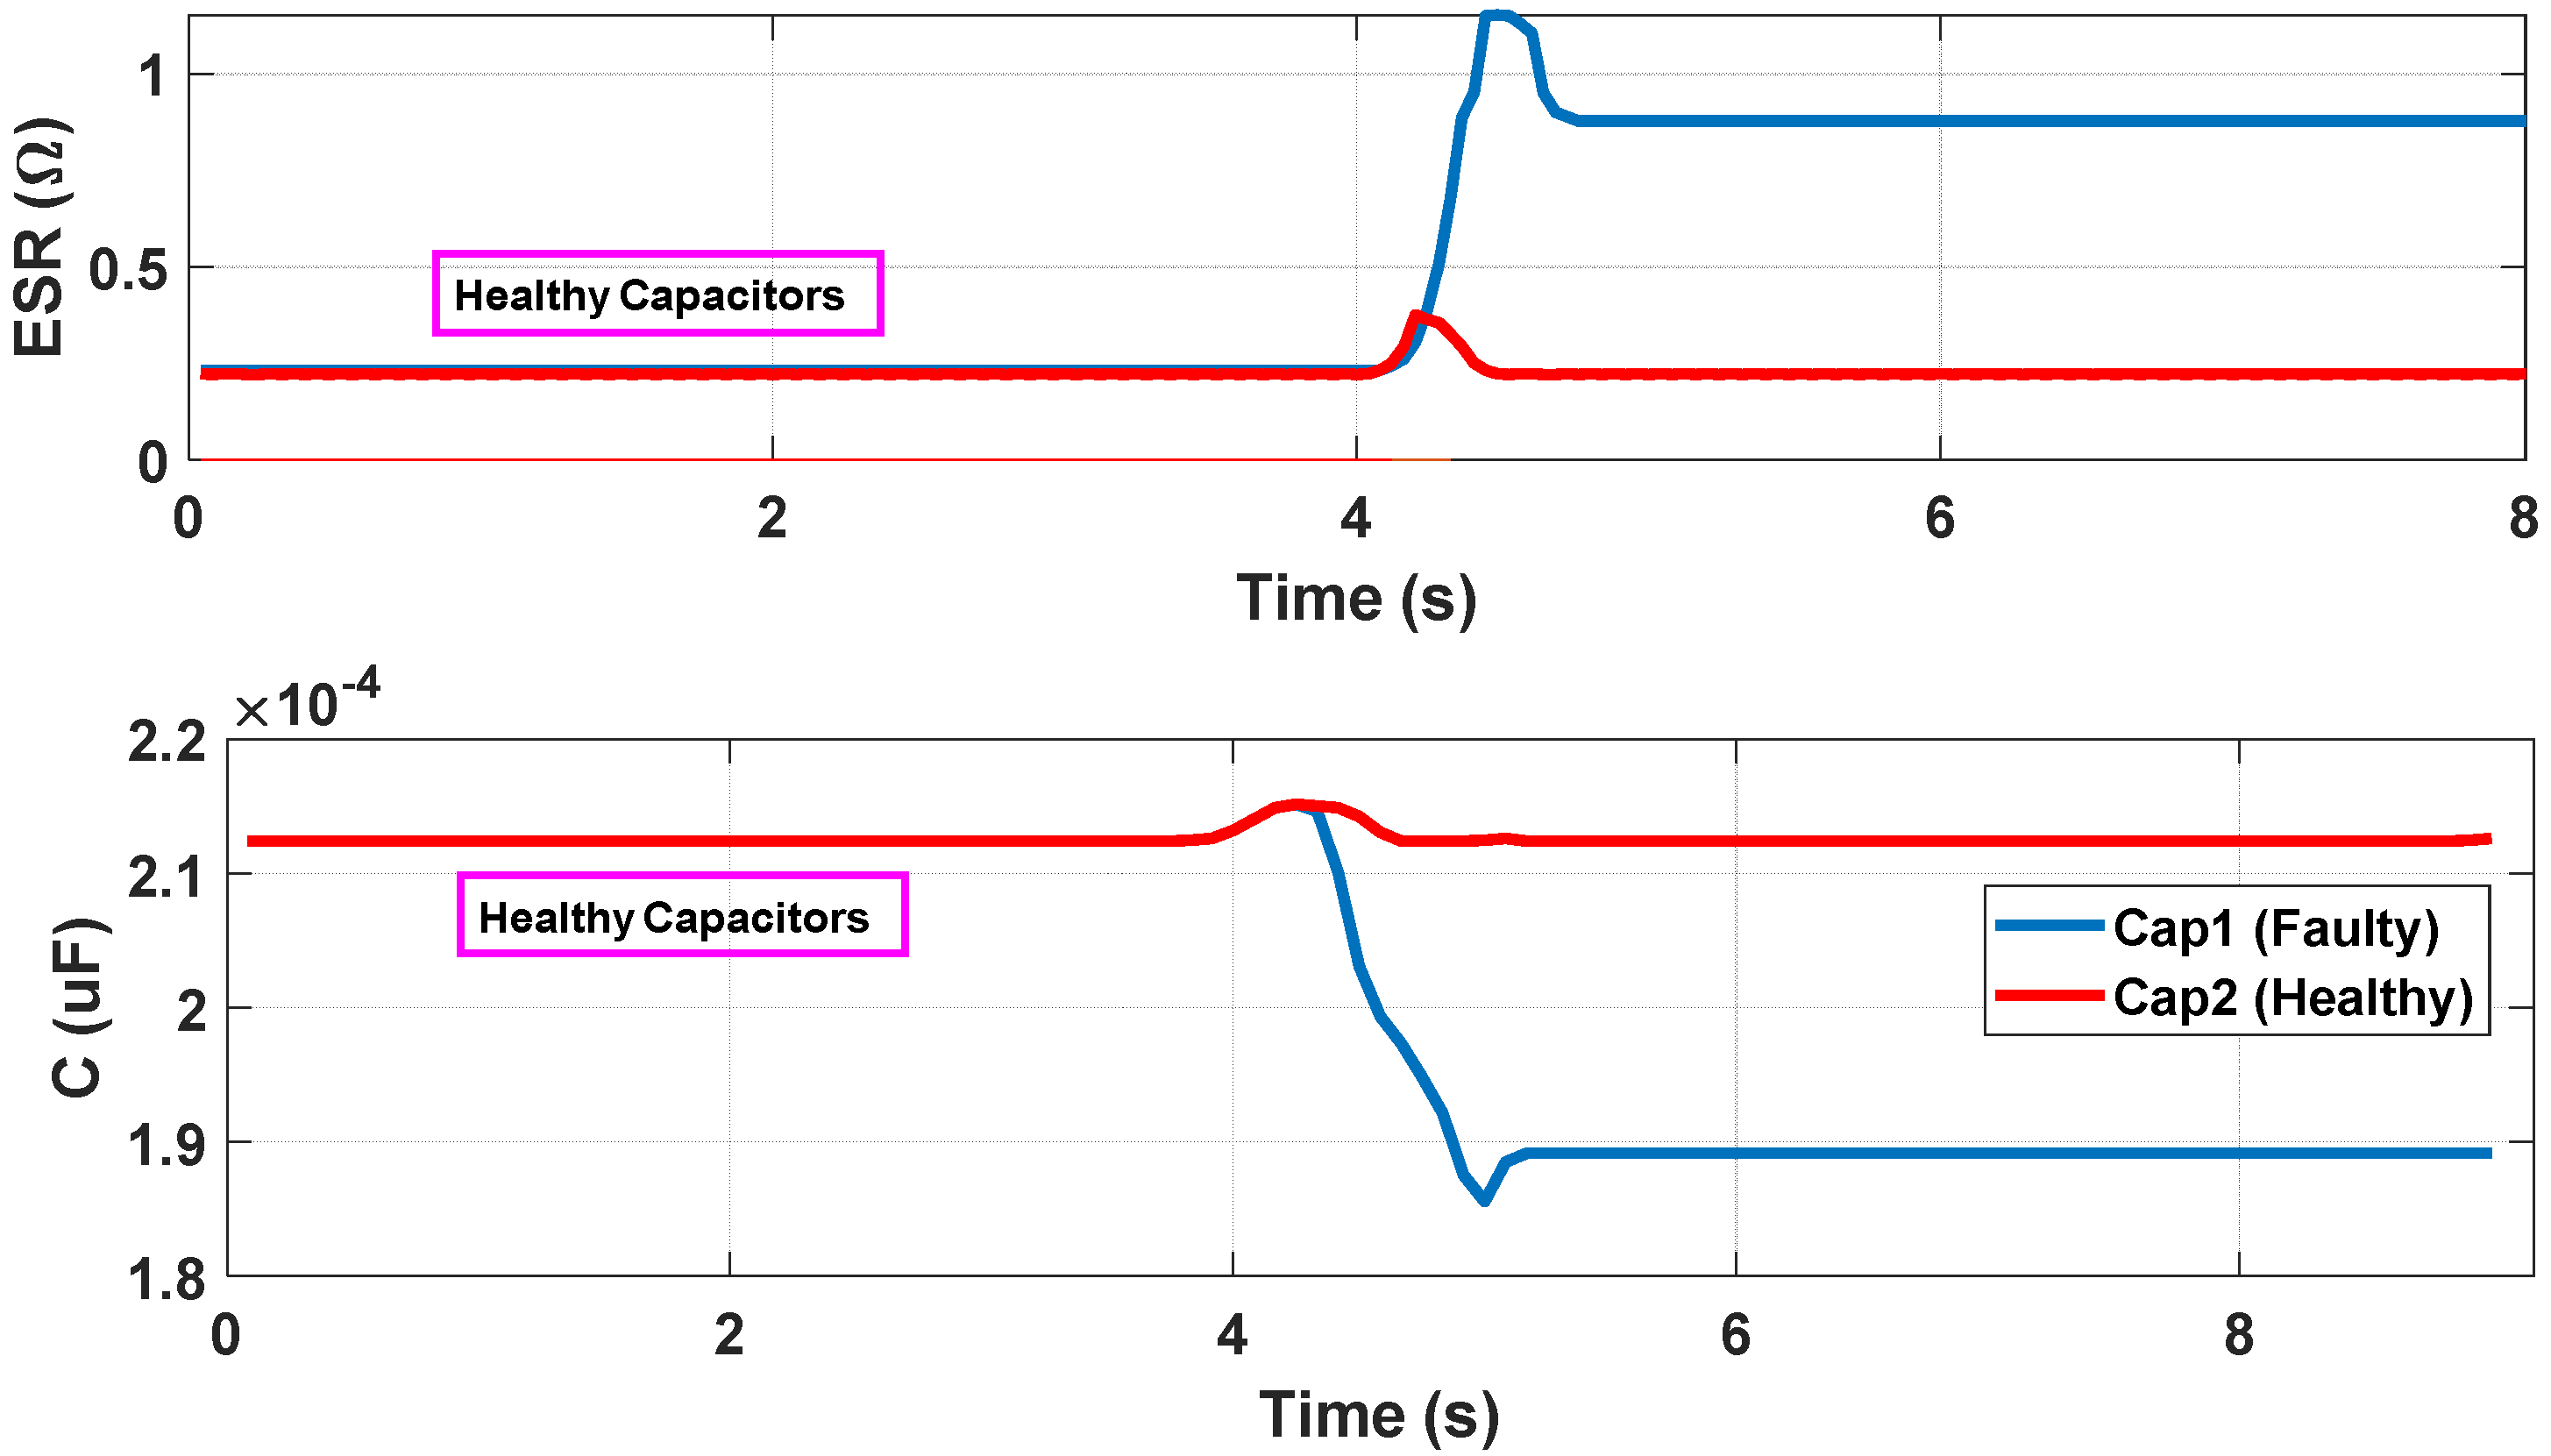
3. Experimental Results
- Control part, performed by the dSPACE DS1103 board, operating with a sampling time of 25 μs.
- Fault-detection part, performed by the acquisition card, using LabVIEW.
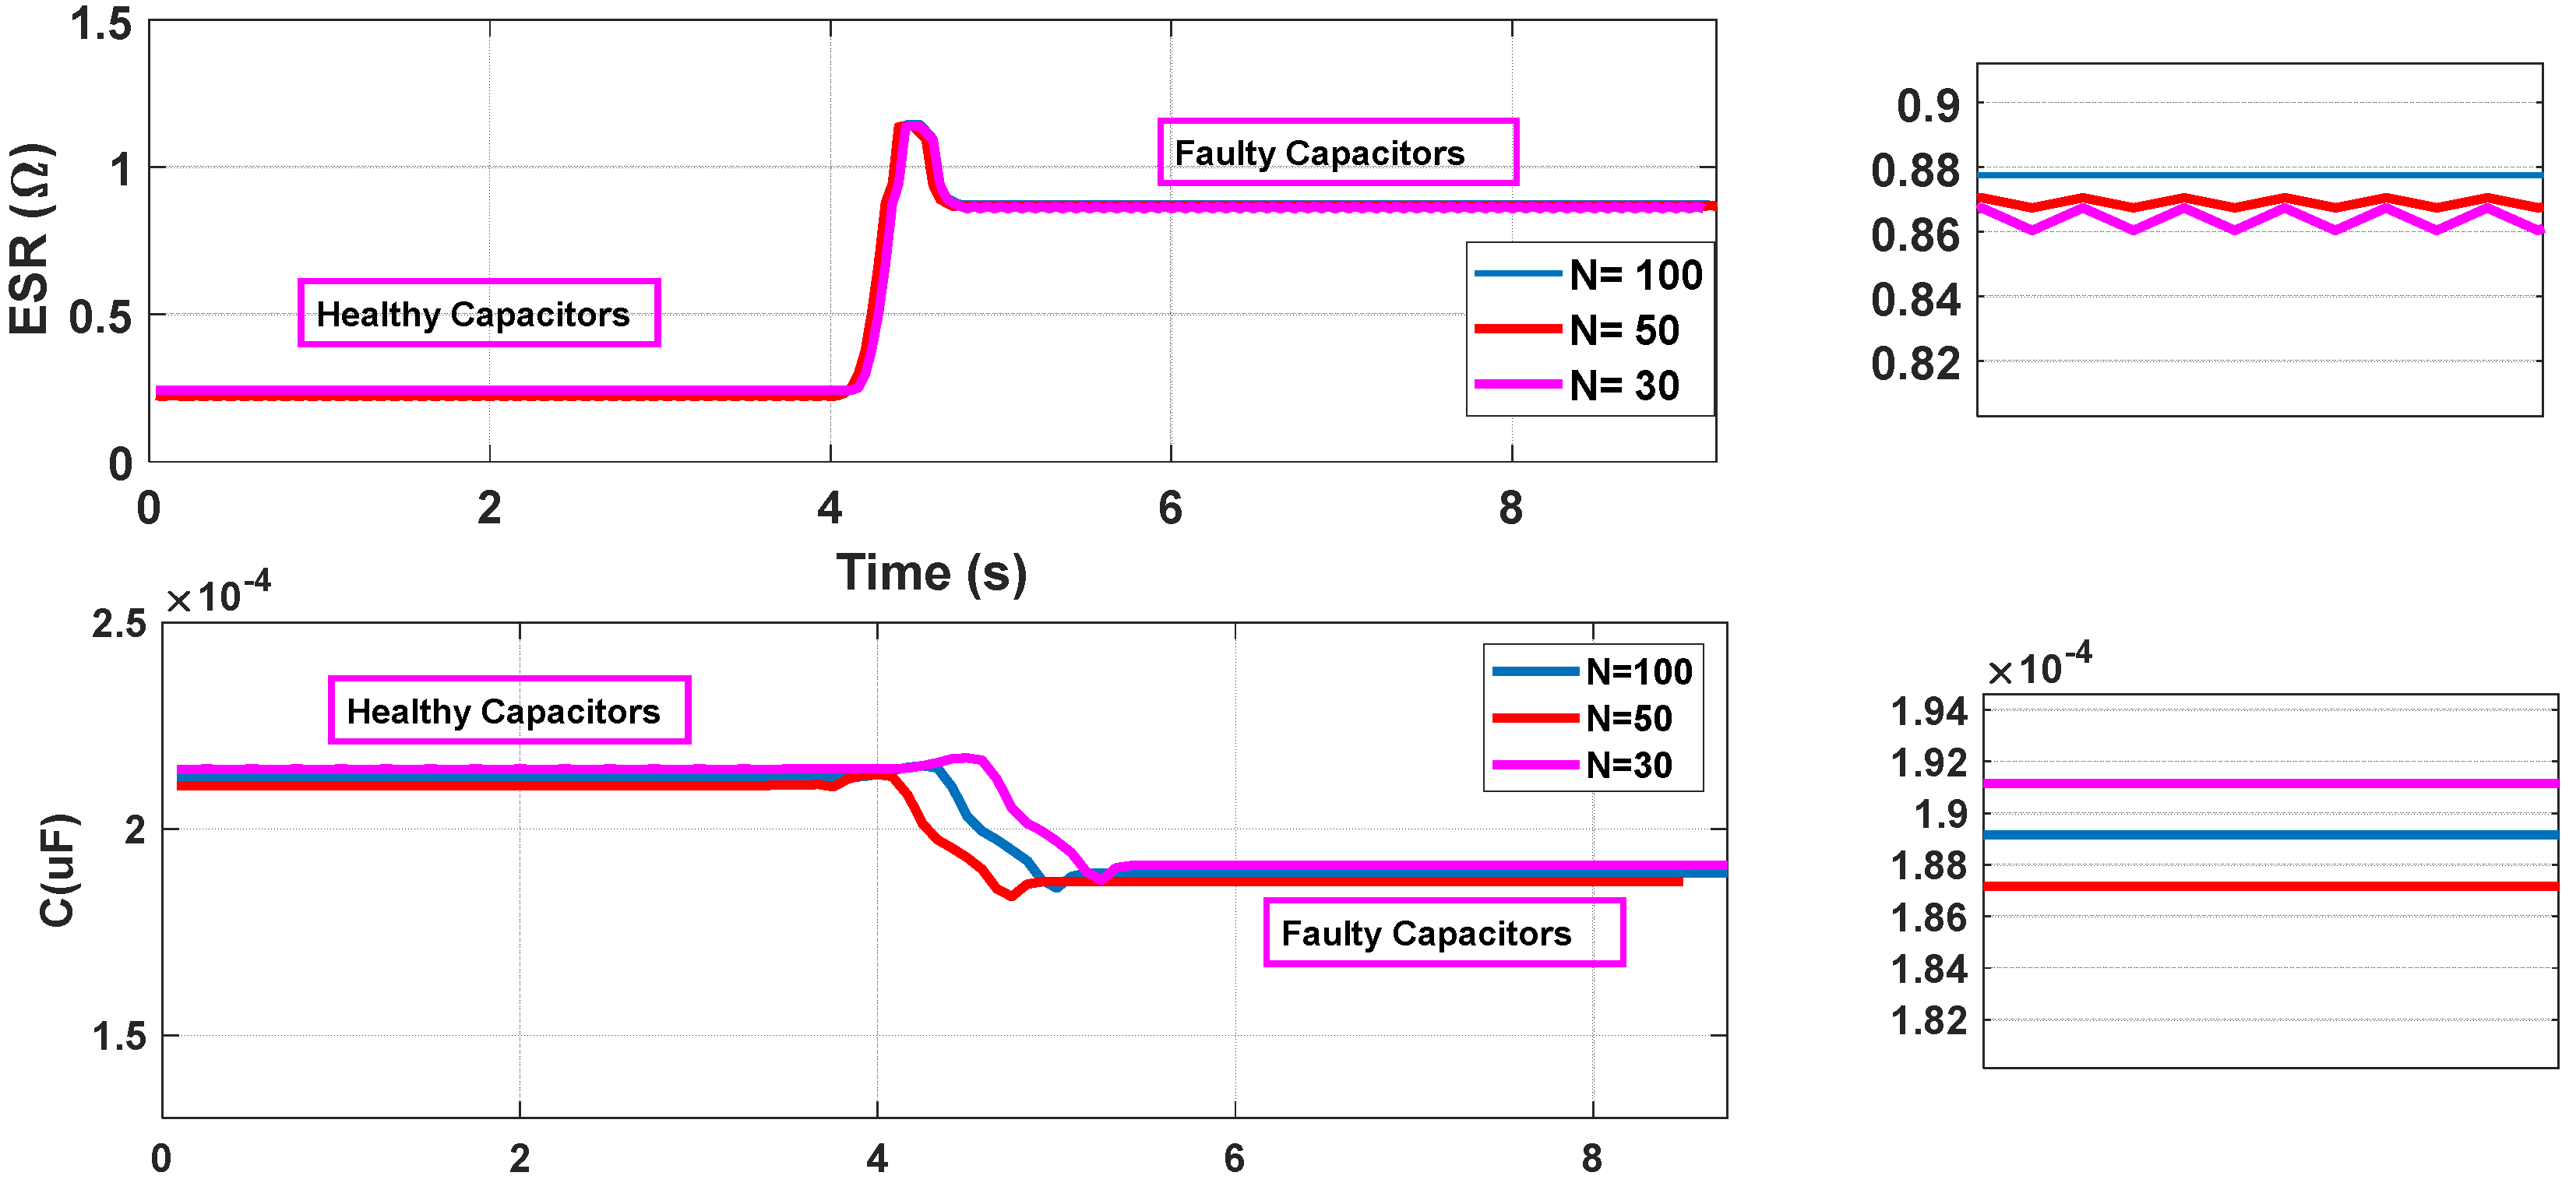
Effect of the Number of Treated Samples
4. Conclusions
- The proposed calculation of the AECs’ parameters is simple, and it is inductance-independent.
- The proposed method can be applied in both AC-DC and DC-DC conversion schemes.
- The results show the ability of the proposed STLSP method to continuously evaluate the electrolytic capacitor state, with an estimation accuracy almost equal to 5%, which allows the detection of potential capacitor faults and, consequently, the avoidance of total system failure.
- The ability to predict the ESR and C is unaffected by the number of processed data samples N.
- The adopted fault-tolerant LED driver architecture has no effect on the performance of the proposed fault diagnosis technique.
Author Contributions
Funding
Institutional Review Board Statement
Informed Consent Statement
Data Availability Statement
Conflicts of Interest
References
- Zhao, Z.; Davari, P.; Lu, W.; Wang, H.; Blaabjerg, F. An Overview of Condition Monitoring Techniques for Capacitors in DC-Link Applications. IEEE Trans. Power Electron. 2021, 36, 3692–3716. [Google Scholar] [CrossRef]
- Wu, Y.; Du, X. A VEN Condition Monitoring Method of DC-Link Capacitors for Power Converters. IEEE Trans. Ind. Electron. 2019, 66, 1296–1306. [Google Scholar] [CrossRef]
- Miao, W.; Liu, X.; Lam, K.H.; Pong, P.W.T. Condition Monitoring of Electrolytic Capacitors in Boost Converters by Magnetic Sensors. IEEE Sens. J. 2019, 19, 10393–10402. [Google Scholar] [CrossRef]
- Sundararajan, P.; Sathik, M.H.M.; Sasongko, F.; Tan, C.S.; Tariq, M.; Simanjorang, R. Online Condition Monitoring System for DC-Link Capacitor in Industrial Power Converters. IEEE Trans. Ind. Appl. 2018, 54, 4775–4785. [Google Scholar] [CrossRef]
- Amaral, A.M.R.; Cardoso, A.J.M. On-line fault detection of aluminium electrolytic capacitors, in step-down DC–DC converters, using input current and output voltage ripple. IET Power Electron. 2012, 5, 315–322. [Google Scholar] [CrossRef]
- Bento, F.; Cardoso, A.J.M. Fault-Tolerant LED Lighting Systems Featuring Minimal Loss of Luminous Flux. IEEE IEEE Trans. Ind. Appl. 2020, 56, 4309–4318. [Google Scholar] [CrossRef]
- Bento, F.; Cardoso, A.J.M. Comprehensive survey and critical evaluation of the performance of state-of-the-art LED drivers for lighting systems. Chin. J. Electr. Eng. 2021, 7, 21–36. [Google Scholar] [CrossRef]
- Patterson, B.T. DC, come home: DC microgrids and the birth of the “enernet”. IEEE Power Energy Mag. 2012, 10, 60–69. [Google Scholar] [CrossRef]
- Yang, W.-H.; Yang, H.-A.; Huang, C.-J.; Chen, K.-H.; Lin, Y.-H. A High-Efficiency Single-Inductor Multiple-Output Buck-Type LED Driver With Average Current Correction Technique. IEEE Trans. Power Electron. 2018, 33, 3375–3385. [Google Scholar] [CrossRef]
- Cheng, H.L.; Chang, Y.N.; Yen, H.C.; Hua, C.C.; Su, P.S. An Interleaved Flyback-Typed LED Driver with ZVS and Energy Recovery of Leakage Inductance. IEEE Trans. Power Electron. 2019, 34, 4497–4508. [Google Scholar] [CrossRef]
- Zhou, R.; Yeung, R.S.C.; Chan, J.Y.C.; Tse, N.C.F.; Chung, H.S.H. Switched-Capacitor-Based Current Compensator for Mitigating the Effect of Long Cable between PWM Driver and LED Light Source. IEEE Trans. Power Electron. 2018, 33, 6171–6186. [Google Scholar] [CrossRef]
- Menke, M.F.; Duranti, J.P.; Roggia, L.; Bisogno, F.E.; Tambara, R.V.; Seidel, Á.R. Analysis and Design of the LLC LED Driver Based on State-Space Representation Direct Time-Domain Solution. IEEE Trans. Power Electron. 2020, 35, 12686–12701. [Google Scholar] [CrossRef]
- Zeng, J.; Liu, F.; Liu, J.; Cheng, K.W.E. A Flexible Mode Electrolytic Capacitor-Free LED Driver with High Efficiency Over a Wide Range of Input Voltage. IEEE Trans. Power Electron. 2020, 35, 8490–8500. [Google Scholar] [CrossRef]
- Liu, X.; Li, X.; Zhou, Q.; Xu, J. Flicker-Free Single Switch Multi-String LED Driver with High Power Factor and Current Balancing. IEEE Trans. Power Electron. 2019, 34, 6747–6759. [Google Scholar] [CrossRef]
- Yu, Y.; Zhou, T.; Zhu, M.; Xu, D. Fault diagnosis and life prediction of dc-link aluminum electrolytic capacitors used in three-phase ac/dc/ac converters. In Proceedings of the 2012 Second International Conference on Instrumentation, Measurement, Computer, Communication and Control, Harbin, China, 8–10 December 2012; pp. 825–830. [Google Scholar]
- Ahmad, M.W.; Agarwal, N.; Kumar, P.N.; Anand, S. Low-Frequency Impedance Monitoring and Corresponding Failure Criteria for Aluminum Electrolytic Capacitors. IEEE Trans. Power Electron. 2017, 64, 5657–5666. [Google Scholar] [CrossRef]
- Amaral, A.M.R.; Cardoso, A.J.M. A Simple Offline Technique for Evaluating the Condition of Aluminum–Electrolytic–Capacitors. IEEE Trans. Ind. Electron. 2009, 56, 3230–3237. [Google Scholar] [CrossRef]
- Hannonen, J.; Honkanen, J.; Ström, J.P.; Kärkkäinen, T.; Räisänen, S.; Silventoinen, P. Capacitor Aging Detection in a DC–DC Converter Output Stage. IEEE Trans. Ind. Appl. 2016, 52, 3224–3233. [Google Scholar] [CrossRef]
- Agarwal, N.; Ahmad, M.W.; Anand, S. Quasi-Online Technique for Health Monitoring of Capacitor in Single-Phase Solar Inverter. IEEE Trans. Power Electron. 2017, 33, 5283–5291. [Google Scholar] [CrossRef]
- Yao, K.; Li, H.; Li, L.; Guan, C.; Li, L.; Zhang, Z.; Chen, J. A Noninvasive Online Monitoring Method of Output Capacitor’s C and ESR for DCM Flyback Converter. IEEE Trans. Power Electron. 2018, 34, 5748–5763. [Google Scholar] [CrossRef]
- Yao, K.; Cao, C.; Yang, S. Noninvasive Online Condition Monitoring of Output Capacitor’s ESR and C for a Flyback Converter. IEEE Trans. Instrum. Meas. 2017, 66, 3190–3199. [Google Scholar] [CrossRef]
- Prasanth, S.; Halick, M.; Sathik, M.; Sasongko, F.; Seng, T.C.; Yaxin, P.; Simanjorang, R. Condition Monitoring of Electrolytic Capacitor based on ESR Estimation and Thermal Impedance model using Improved Power Loss Computation. In Proceedings of the 2018 International Power Electronics Conference (IPEC-Niigata 2018-ECCE Asia), Niigata, Japan, 20–24 May 2018; pp. 416–421. [Google Scholar]
- Meng, J.; Chen, E.-X.; Ge, S.-J. Online E-Cap Condition Monitoring Method Based on State Observer. In Proceedings of the 2018 IEEE International Power Electronics and Application Conference and Exposition (PEAC), Shenzhen, China, 4–7 November 2018; pp. 1–6. [Google Scholar]
- Ren, L.; Gong, C.; Zhao, Y. An Online ESR Estimation Method for Output Capacitor of Boost Converter. IEEE Trans. Power Electron. 2019, 34, 10153–10165. [Google Scholar] [CrossRef]
- Ronanki, D.; Williamson, S.S. Quasi-Online Low-Frequency Impedance Monitoring Scheme for Submodule Capacitors in Modular Multilevel Converters. In Proceedings of the 2019 IEEE Applied Power Electronics Conference and Exposition (APEC), Anaheim, CA, USA, 17–21 March 2019; pp. 83–90. [Google Scholar]
- Li, C.; Yu, Y.; Yang, Z.; Liu, Q.; Peng, X. ESR Estimation for Aluminum Electrolytic Capacitor of Power Electronic Converter Based on Compressed Sensing and Wavelet Transform. IEEE Trans. Ind. Electron. 2021, 69, 1948–1957. [Google Scholar] [CrossRef]
- Laadjal, K.; Sahraoui, M.; Cardoso, A.J.M. On-Line Fault Diagnosis of DC-Link Electrolytic Capacitors in Boost Converters Using the STFT Technique. IEEE Trans. Power Electron. 2021, 36, 6303–6312. [Google Scholar] [CrossRef]
- Laadjal, K.; Bento, F.; Jlassi, I.; Cardoso, A.J.M. Online Condition Monitoring of Electrolytic Capacitors in DC-DC Interleaved Boost Converters, Adopting a Model-Free Predictive Controller. In Proceedings of the 2021 IEEE 15th International Conference on Compatibility, Power Electronics and Power Engineering (CPE-POWERENG), Florence, Italy, 14–16 July 2021; pp. 1–6. [Google Scholar]
- Laadjal, K.; Sahraoui, M.; Cardoso, A.J.M.; Amaral, A.M.R. Online Estimation of Aluminum Electrolytic-Capacitor Parameters Using a Modified Prony’s Method. IEEE Trans. Ind. Appl. 2018, 54, 4764–4774. [Google Scholar] [CrossRef]
- Cardoso, A.J.M. Diagnosis and Fault Tolerance of Electrical Machines, Power Electronics and Drives (Energy Engineering); The Institution of Engineering and Technology (IET): London, UK, 2018; ISBN 978-1-78561-531-3. [Google Scholar]
- Ahmad, M.W.; Agarwal, N.; Anand, S. Online Monitoring Technique for Aluminum Electrolytic Capacitor in Solar PV-Based DC System. IEEE Trans. Ind. Electron. 2016, 63, 7059–7066. [Google Scholar] [CrossRef]
- Li, S.; Guo, Y.; Tan, S.C.; Hui, S.Y.R. An Off-line Single-Inductor Multiple-Output LED Driver with High Dimming Precision and Full Dimming Range. IEEE Trans. Power Electron. 2017, 32, 4716–4727. [Google Scholar] [CrossRef]


| Parameter | Nomenclature | Value |
|---|---|---|
| Input voltage | Vin | 200 V |
| Inductance | L | 10 mH |
| Capacitance | C1…n | 220 μF |
| No. of LEDs per fixture (connected in series) | m | 15 |
| No. of LED fixtures | n | 2 |
| LED fixture nominal voltage | Vnnom | 48 V |
| LED fixture nominal current | Innom | 0.22 A |
| LED fixture nominal power | Pnnom | 11 W |
| Time-sharing frequency | ft | 5 kHz |
| Dimming frequency | fdim | 600 Hz |
| Cap1 | Cap2 | Faulty Cap | |
|---|---|---|---|
| 0.2128 | 0.2209 | 0.8500 | |
| 209.41 | 208.87 | 185.80 |
| Healthy | Faulty | |||||
|---|---|---|---|---|---|---|
| Cap1 | Cap2 | Error (%) | Cap1 | Error (%) | ||
| Cap1 | Cap2 | |||||
| 0.221 | 0.232 | 3.69 | 4.80 | 0.8775 | 2.13 | |
| ) | 212.15 | 212.35 | 1.29 | 1.64 | 189.1 | 1.73 |
| Number of Treated Samples (N) | 30 | 50 | 100 |
|---|---|---|---|
| ESR (Ω) | 0.2309 | 0.228 | 0.221 |
| Error (%) | 5.01 | 4.59 | 1.36 |
| C (µF) | 213.7 | 213 | 212.4 |
| Error (%) | 2.05 | 1.71 | 1.43 |
Publisher’s Note: MDPI stays neutral with regard to jurisdictional claims in published maps and institutional affiliations. |
© 2022 by the authors. Licensee MDPI, Basel, Switzerland. This article is an open access article distributed under the terms and conditions of the Creative Commons Attribution (CC BY) license (https://creativecommons.org/licenses/by/4.0/).
Share and Cite
Laadjal, K.; Bento, F.; Cardoso, A.J.M. On-Line Diagnostics of Electrolytic Capacitors in Fault-Tolerant LED Lighting Systems. Electronics 2022, 11, 1444. https://doi.org/10.3390/electronics11091444
Laadjal K, Bento F, Cardoso AJM. On-Line Diagnostics of Electrolytic Capacitors in Fault-Tolerant LED Lighting Systems. Electronics. 2022; 11(9):1444. https://doi.org/10.3390/electronics11091444
Chicago/Turabian StyleLaadjal, Khaled, Fernando Bento, and Antonio J. Marques Cardoso. 2022. "On-Line Diagnostics of Electrolytic Capacitors in Fault-Tolerant LED Lighting Systems" Electronics 11, no. 9: 1444. https://doi.org/10.3390/electronics11091444