
Research on a User-Centered Evaluation Model for Audience Experience and Display Narrative of Digital Museums


Abstract
:1. Introduction
2. Literature Review
2.1. Digital Museum and Culture
2.2. Museum Website Quality Model
2.3. The New Museum Concept
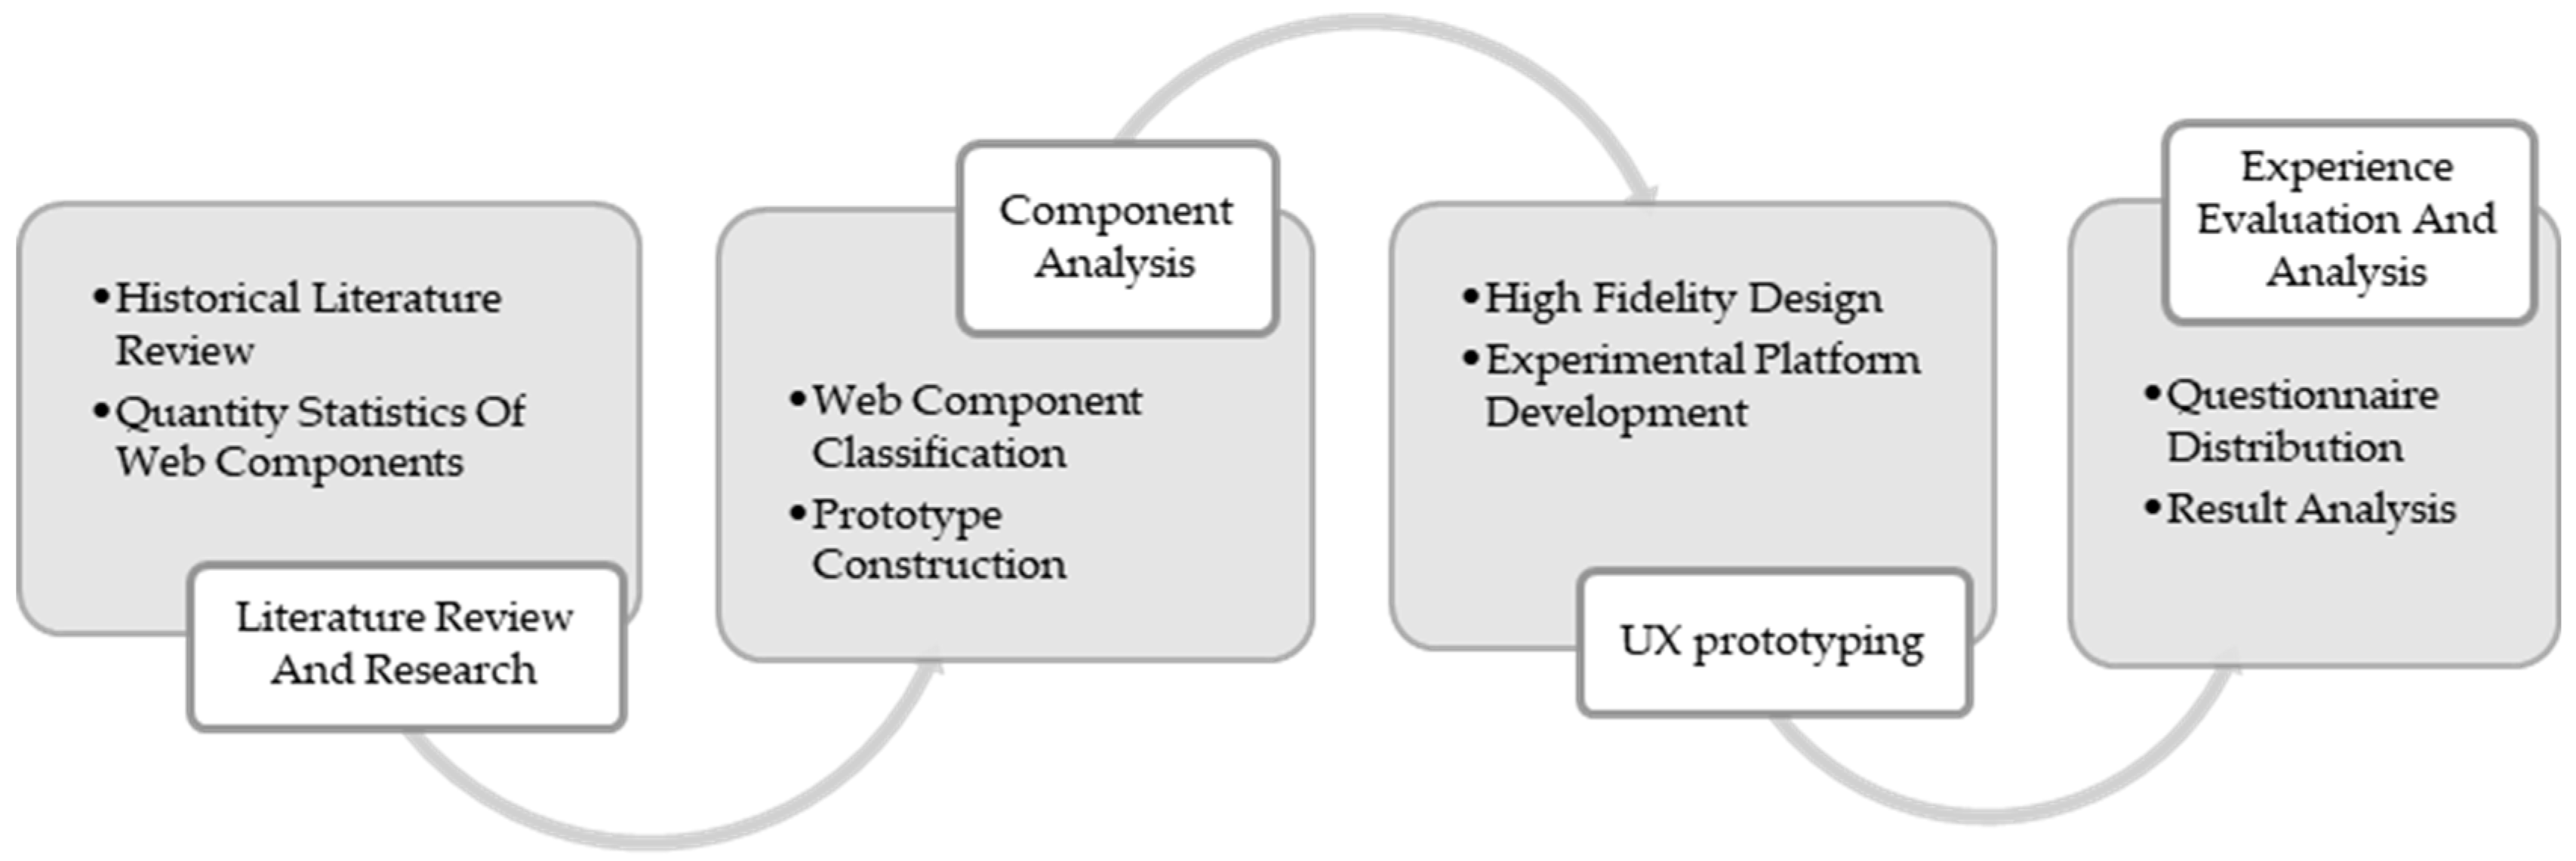
3. Methodology
3.1. Research Framework and Hypothesis
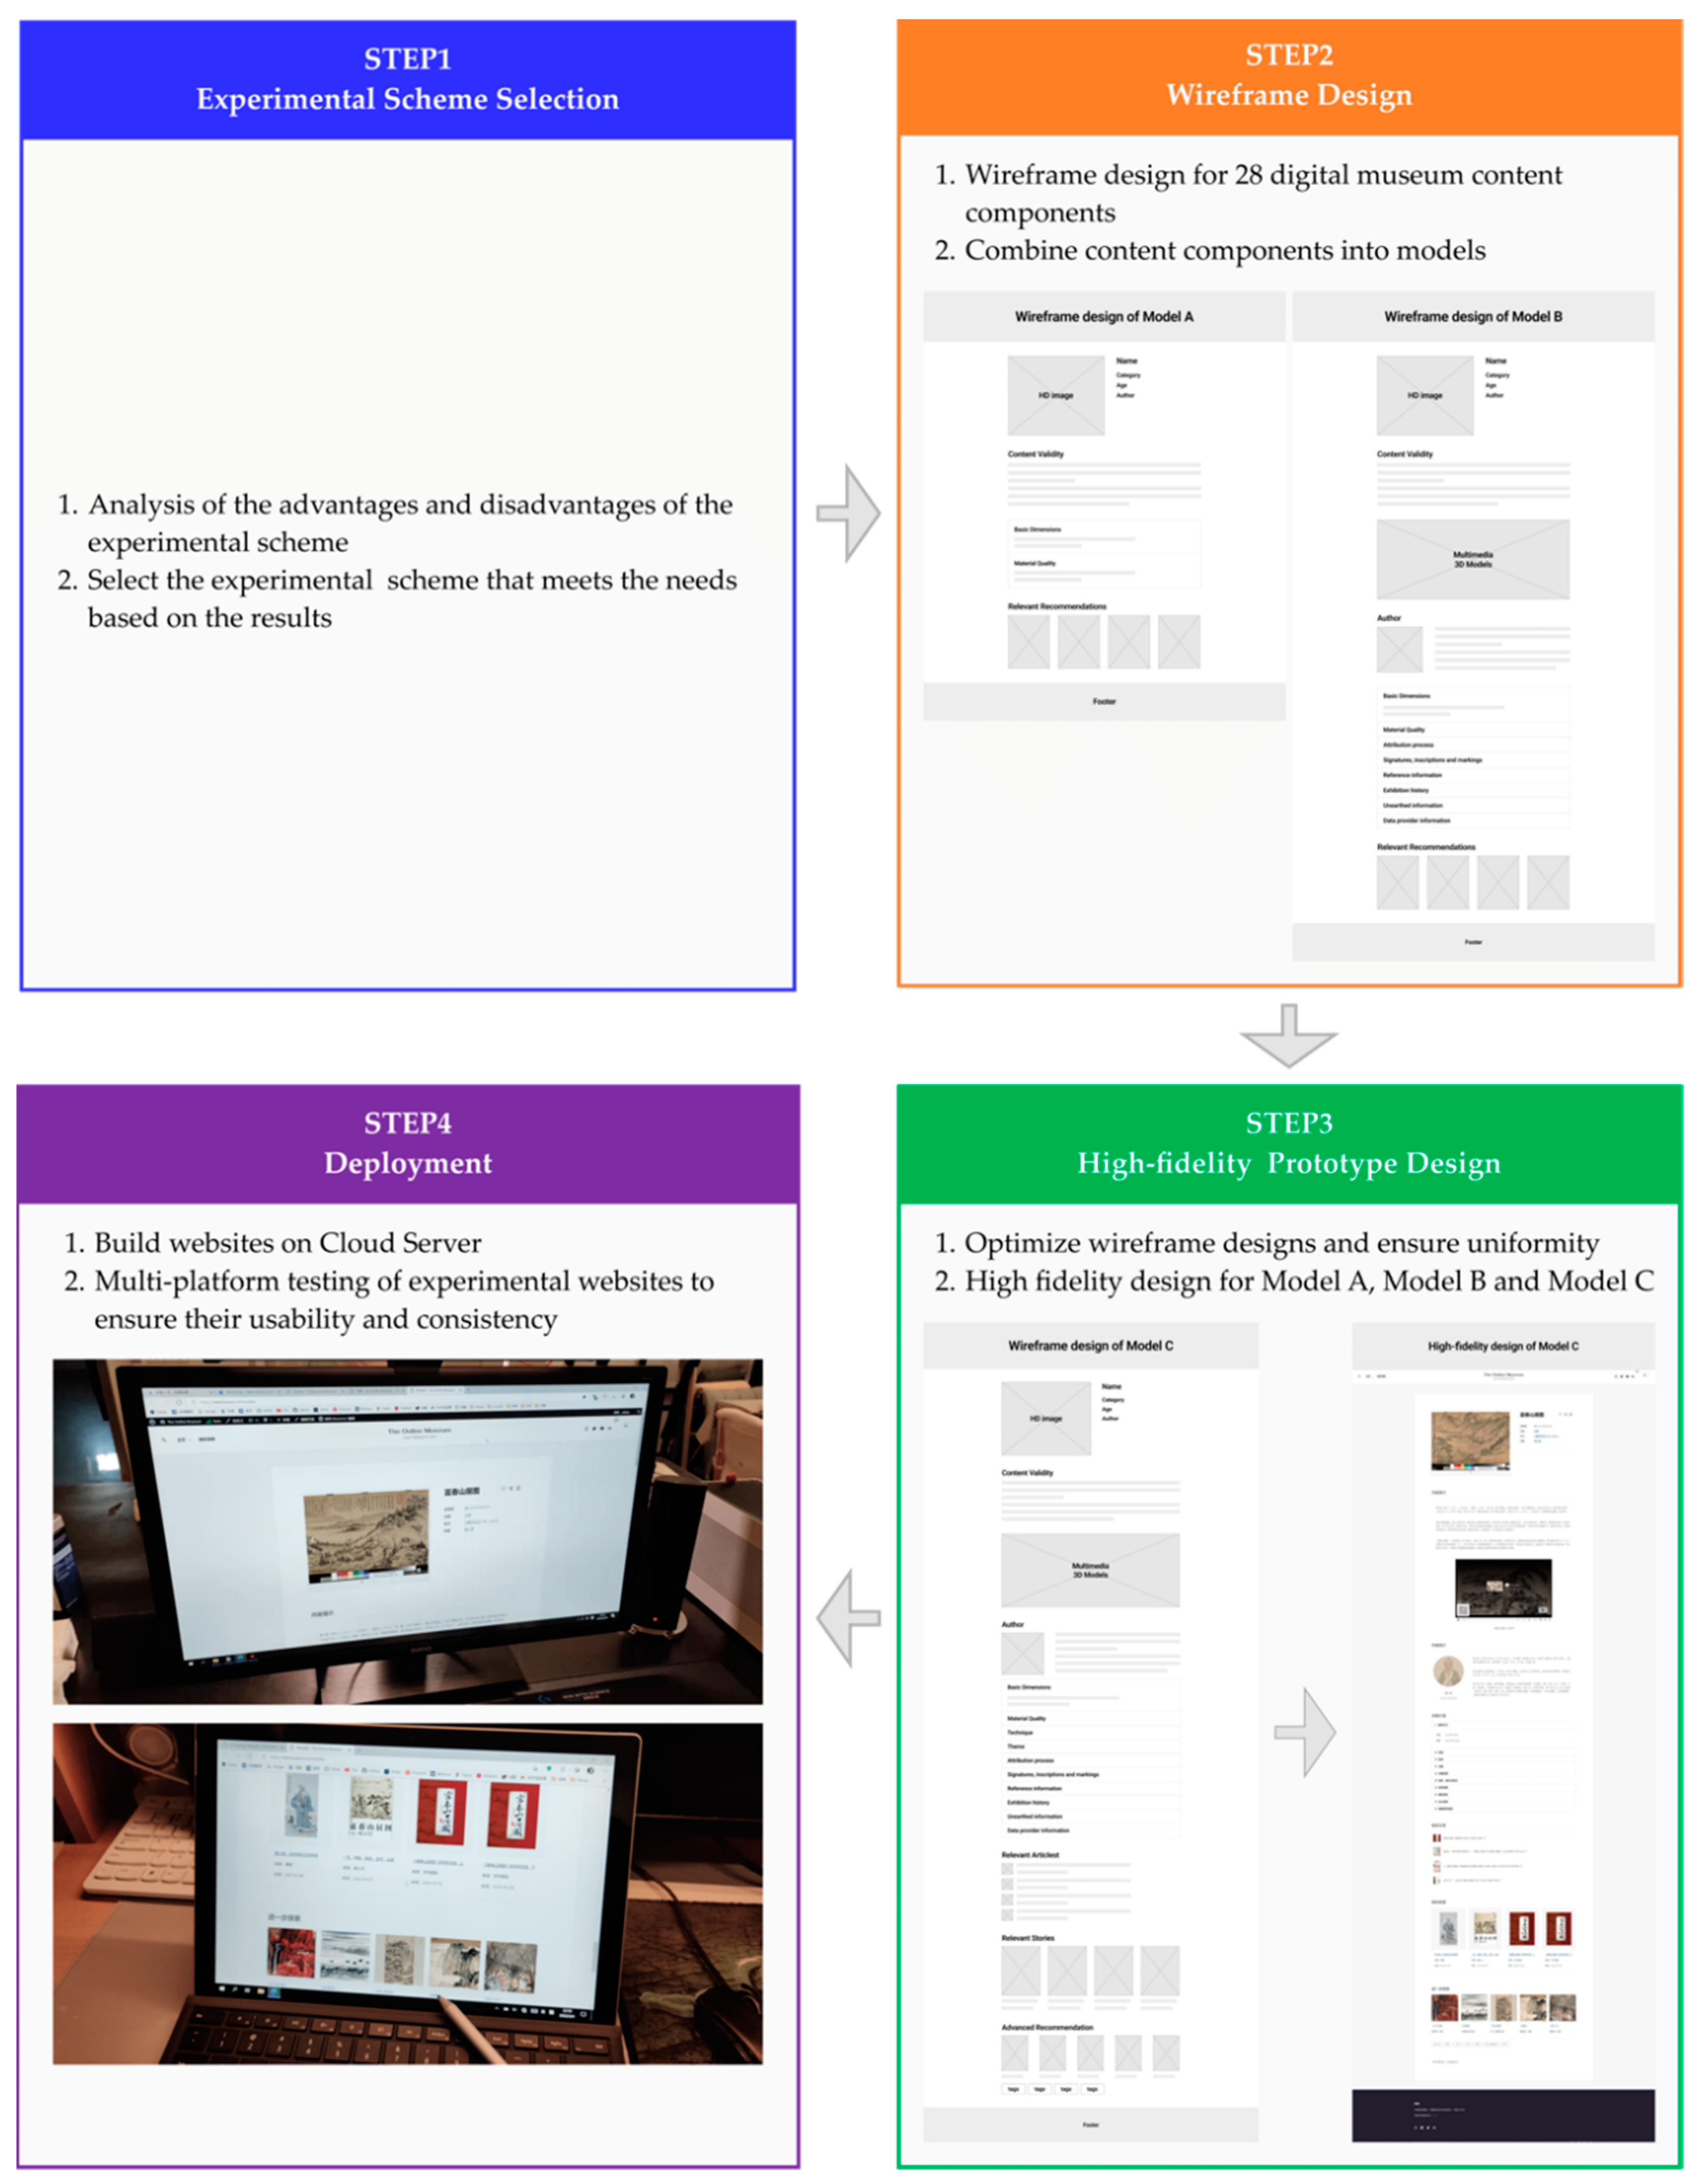
3.2. Experimental Platform Design and Implementation
- (1)
- Experimental scheme selection
- (2)
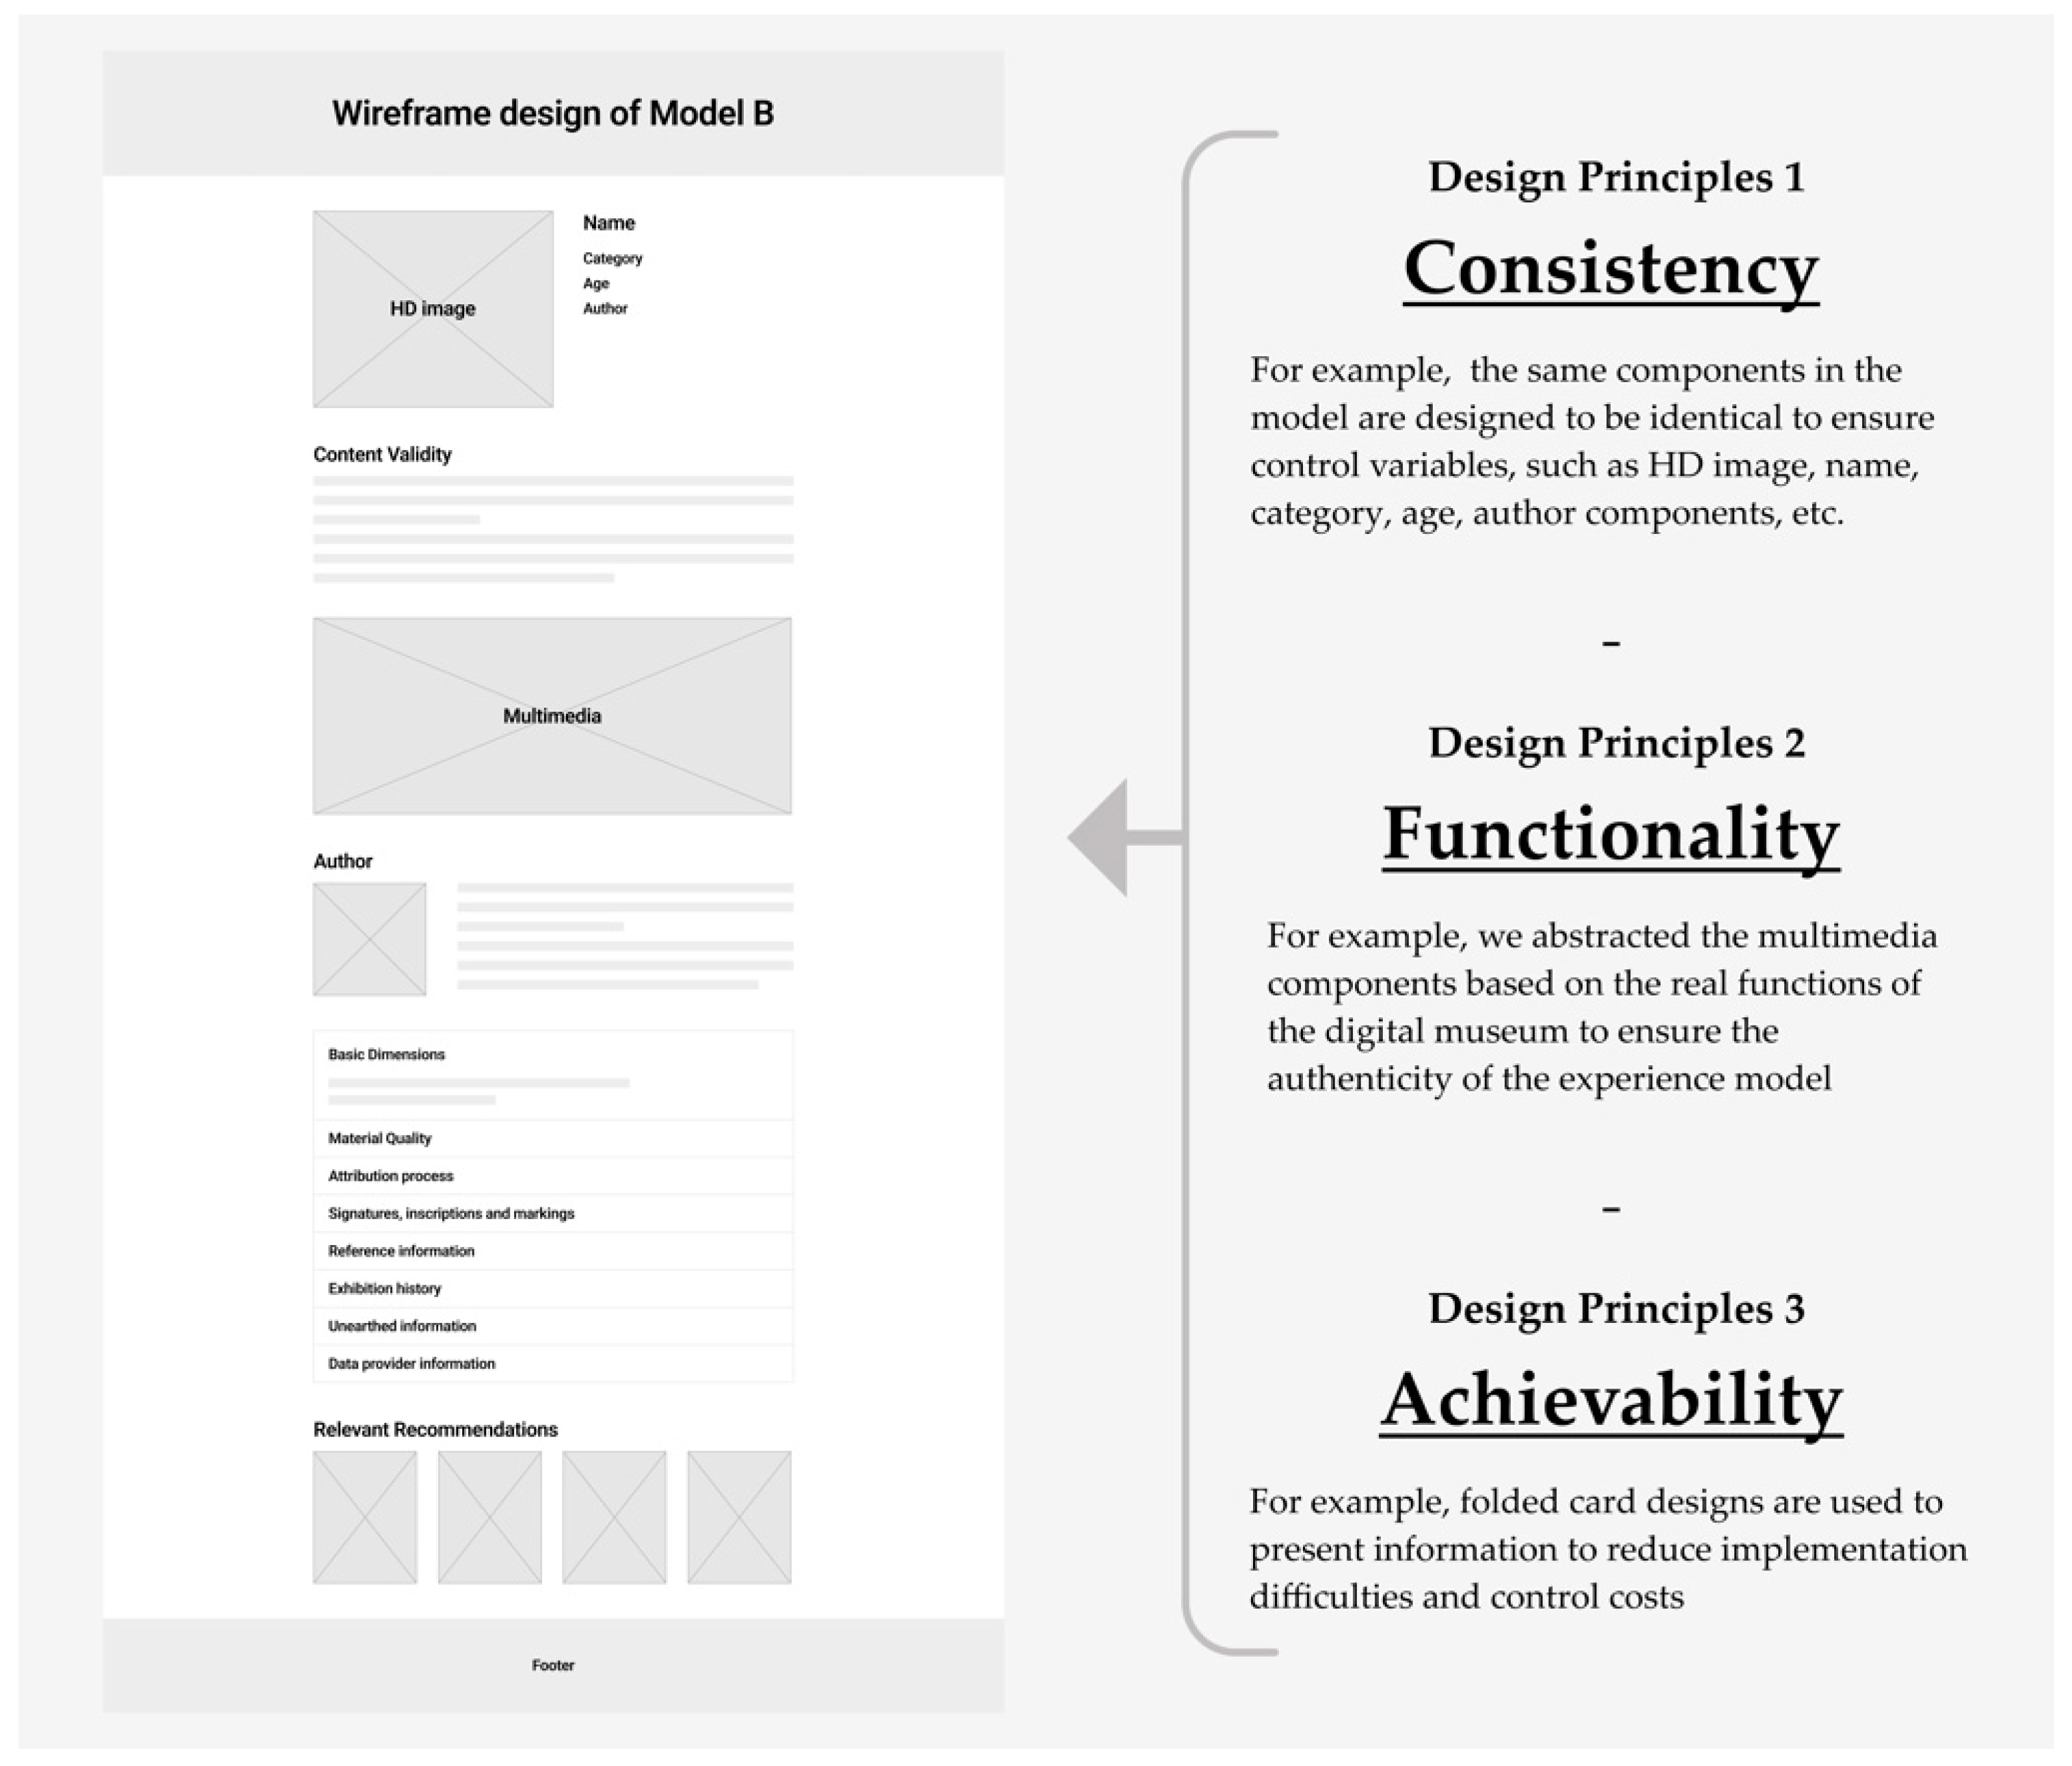
- Wireframe design
- (3)
- High-fidelity prototyping and implementation
- (4)
- Deployment
3.3. Measurement
3.4. Sampling Method
4. Results
4.1. Respondents’ Profile
4.2. Data Analysis and Hypothesis Validation
5. Discussion
Author Contributions
Funding
Institutional Review Board Statement
Informed Consent Statement
Data Availability Statement
Conflicts of Interest
References
- National Museum of China. 2019 Data Report of China National Museum; National Museum of China: Beijing, China, 2020; Available online: http://www.chnmuseum.cn/zx/gbxw/202001/t20200123_191603.shtml (accessed on 17 January 2022).
- National Museum of China. 2020 Data Report of China National Museum; National Museum of China: Beijing, China, 2021; Available online: http://www.chnmuseum.cn/zx/gbxw/202103/t20210329_249281.shtml (accessed on 17 January 2022).
- Pesce, D.; Neirotti, P.; Paolucci, E. When culture meets digital platforms: Value creation and stakeholders’ alignment in big data use. Curr. Issues Tour. 2018, 22, 1883–1903. [Google Scholar] [CrossRef]
- Chen, T.-L.; Lai, W.-C.; Yu, T.-K. Participating in Online Museum Communities: An Empirical Study of Taiwan’s Undergraduate Students. Front. Psychol. 2021, 11, 565075. [Google Scholar] [CrossRef] [PubMed]
- Lin, A.C.; Fernandez, W.D.; Gregor, S. Understanding web enjoyment experiences and informal learning: A study in a museum context. Decis. Support Syst. 2012, 53, 846–858. [Google Scholar] [CrossRef]
- Chong, C.; Smith, D. Interactive Learning Units on Museum Websites. J. Mus. Educ. 2017, 42, 169–178. [Google Scholar] [CrossRef] [Green Version]
- LoIacono, E.T.; Watson, R.T.; Goodhue, D.L. WebQual: An Instrument for Consumer Evaluation of Web Sites. Int. J. Electron. Commer. 2007, 11, 51–87. [Google Scholar] [CrossRef]
- Agarwal, R.; Venkatesh, V. Assessing a Firm’s Web Presence: A Heuristic Evaluation Procedure for the Measurement of Usability. Inf. Syst. Res. 2002, 13, 168–186. [Google Scholar] [CrossRef] [Green Version]
- Taormina, F.; Baraldi, S.B. Museums and digital technology: A literature review on organizational issues. Eur. Plan. Stud. 2022, 30, 1–19. [Google Scholar] [CrossRef]
- García-Martín, I.; Ortega-Mohedano, F.; Pérez-Peláez, M.E. Communication and Cultural Spaces in times of COVID-19. Vivat Acad. 2021, 24, 21–43. [Google Scholar]
- Grincheva, N. Cultural diplomacy under the “digital lockdown”: Pandemic challenges and opportunities in museum diplomacy. Place Branding Public Dipl. 2021, 18, 8–11. [Google Scholar] [CrossRef]
- Bekele, M.K.; Pierdicca, R.; Frontoni, E.; Malinverni, E.S.; Gain, J. A Survey of Augmented, Virtual, and Mixed Reality for Cultural Heritage. J. Comput. Cult. Herit. 2018, 11, 7. [Google Scholar] [CrossRef]
- Elfarargy, M.; Rizq, A. VirMuF: The Virtual Museum Framework. Scalable Comput. Prac. Exp. 2018, 19, 175–180. [Google Scholar] [CrossRef] [Green Version]
- Garlandini, A. Museums and Heritage in the digital age. The challenge of cultural change and technological innovation. SCIRES-IT-Sci. Res. Inf. Technol. 2021, 11, 11–18. [Google Scholar]
- Lo Presti, O. COVID-19 and the cultural life of older people. Mus. Manag. Curatorship 2021, 37, 1–11. [Google Scholar] [CrossRef]
- Mihelj, S.; Leguina, A.; Downey, J. Culture is digital: Cultural participation, diversity and the digital divide. N. Media Soc. 2019, 21, 1465–1485. [Google Scholar] [CrossRef] [Green Version]
- Massi, M.; Turrini, A. Virtual proximity or physical distance? Digital transformation and value co-creation in COVID-19 times. Cap. Cult. 2020, 11, 177–195. [Google Scholar] [CrossRef]
- Villaespesa, E. Museum Collections and Online Users: Development of a Segmentation Model for the Metropolitan Museum of Art. Visit. Stud. 2019, 22, 233–252. [Google Scholar] [CrossRef]
- Sylaiou, S.; Kasapakis, V.; Gavalas, D.; Dzardanova, E. Avatars as storytellers: Affective narratives in virtual museums. Pers. Ubiquitous Comput. 2020, 24, 829–841. [Google Scholar] [CrossRef]
- Walsh, D.; Hall, M.M.; Clough, P.; Foster, J. Characterising online museum users: A study of the National Museums Liverpool museum website. Int. J. Digit. Libr. 2020, 21, 75–87. [Google Scholar] [CrossRef] [Green Version]
- Dragićević Šešić, M.; Stefanović, M. The Ethics and Aesthetics of Museum Practices in Serbia during the Pandemic and the Digital Turn. IPSI Trans. Intern. Res. 2021, 17, 34–44. [Google Scholar]
- Wu, Y.; Jiang, Q.; Ni, S.; Liang, H.E. Critical Factors for Predicting Users’ Acceptance of Digital Museums for Experience-Influenced Environments. Information 2021, 12, 426. [Google Scholar] [CrossRef]
- Fanez-Ivanovici, M.; Panà, M.C. From Culture to Smart Culture. How digital transformations enhance citizens’ well-being through better cultural accessibility and inclusion. IEEE Access 2020, 8, 37988–38000. [Google Scholar] [CrossRef]
- Daniela, L. Virtual Museums as Learning Agents. Sustainability 2020, 12, 2698. [Google Scholar] [CrossRef] [Green Version]
- Chu, J.H.; Mazalek, A. Embodied Engagement with Narrative: A Design Framework for Presenting Cultural Heritage Artifacts. Multimodal Technol. Interact. 2019, 3, 1. [Google Scholar] [CrossRef] [Green Version]
- Jimenez-Barreto, J.; Campo-Martinez, S. Destination website quality, users’ attitudes and the willingness to participate in online co-creation experiences. Eur. J. Manag. Bus. Econ. 2018, 27, 26–41. [Google Scholar] [CrossRef] [Green Version]
- Mohd-Any, A.A.; Winklhofer, H.; Ennew, C. Measuring Users’ Vale experience on a travel website (e-value): What value is Cocreated by the user? J. Travel Res. 2015, 54, 496–510. [Google Scholar] [CrossRef]
- Jiang, Z.; Wang, W.; Tan, B.C.; Yu, J. The Determinants and Impacts of Aesthetics in Users’ First Interaction with Websites. J. Manag. Inf. Syst. 2016, 33, 229–259. [Google Scholar] [CrossRef]
- Visinescu, L.L.; Sidorova, A.; Jones, M.C.; Prybutok, V.R. The influence of website dimensionality on customer experiences, perceptions and behavioral intentions: An exploration of 2D vs. 3D web design. Inf. Manag. 2015, 52, 1–17. [Google Scholar] [CrossRef]
- Pallud, J.; Straub, D. Effective Website Design for Experience-Influenced Environments: The Case of High Culture Museums. Inf. Manag. 2014, 51, 359–373. [Google Scholar] [CrossRef]
- Kim, H.; Niehm, L.S. The Impact of Website Quality on Information Quality, Value, and Loyalty Intentions in Apparel Retailing. J. Interact. Mark. 2009, 23, 221–233. [Google Scholar] [CrossRef]
- Garcia-Madariaga, J.; Virto, N.R.; López, M.F.B.; Manzano, J.A. Optimizing website quality: The case of two superstar museum websites. Int. J. Cult. Tour. Hosp. Res. 2019, 13, 16–36. [Google Scholar] [CrossRef]
- Fortier, A.; Ménard, E. What do museum website users expect from linked open data? In Challenges and Opportunities for Knowledge Organization in the Digital Age; Ergon-Verlag: Wurzburg, Germany, 2018. [Google Scholar]
- Hu, K.Y. On the exhibition interpretation of “post Museum”. Southeast Cult. 2017, 4, 1–7. [Google Scholar] [CrossRef]


| No. | Museum Name | Number of Components | Number of Components Containing Hyperlinks |
|---|---|---|---|
| 1 | Beijing National Palace Museum | 14 | 5 |
| 2 | National Museum of China | 10 | 2 |
| 3 | Digital Dunhuang | 8 | 3 |
| 4 | Nanjing Museum | 9 | 3 |
| 5 | Sanxingdui Museum | 8 | 2 |
| 6 | Suzhou Museum | 10 | 2 |
| 7 | Taipei National Palace Museum | 15 | 5 |
| 8 | Chengdu Jinsha Site Museum | 5 | 1 |
| 9 | Hunan Provincial Museum | 10 | 3 |
| 10 | Shandong Museum | 10 | 2 |
| 11 | Louvre | 16 | 6 |
| 12 | The Metropolitan Museum of Art | 19 | 7 |
| 13 | Hermitage Museum | 12 | 6 |
| 14 | The British Museum | 21 | 9 |
| 15 | Art Institute Chicago | 16 | 7 |
| 16 | Kyoto National Museum | 12 | 4 |
| 17 | National Gallery of Art | 13 | 4 |
| 18 | Europeana | 16 | 8 |
| 19 | Google art and culture | 19 | 11 |
| 20 | The Prado Museum | 18 | 11 |
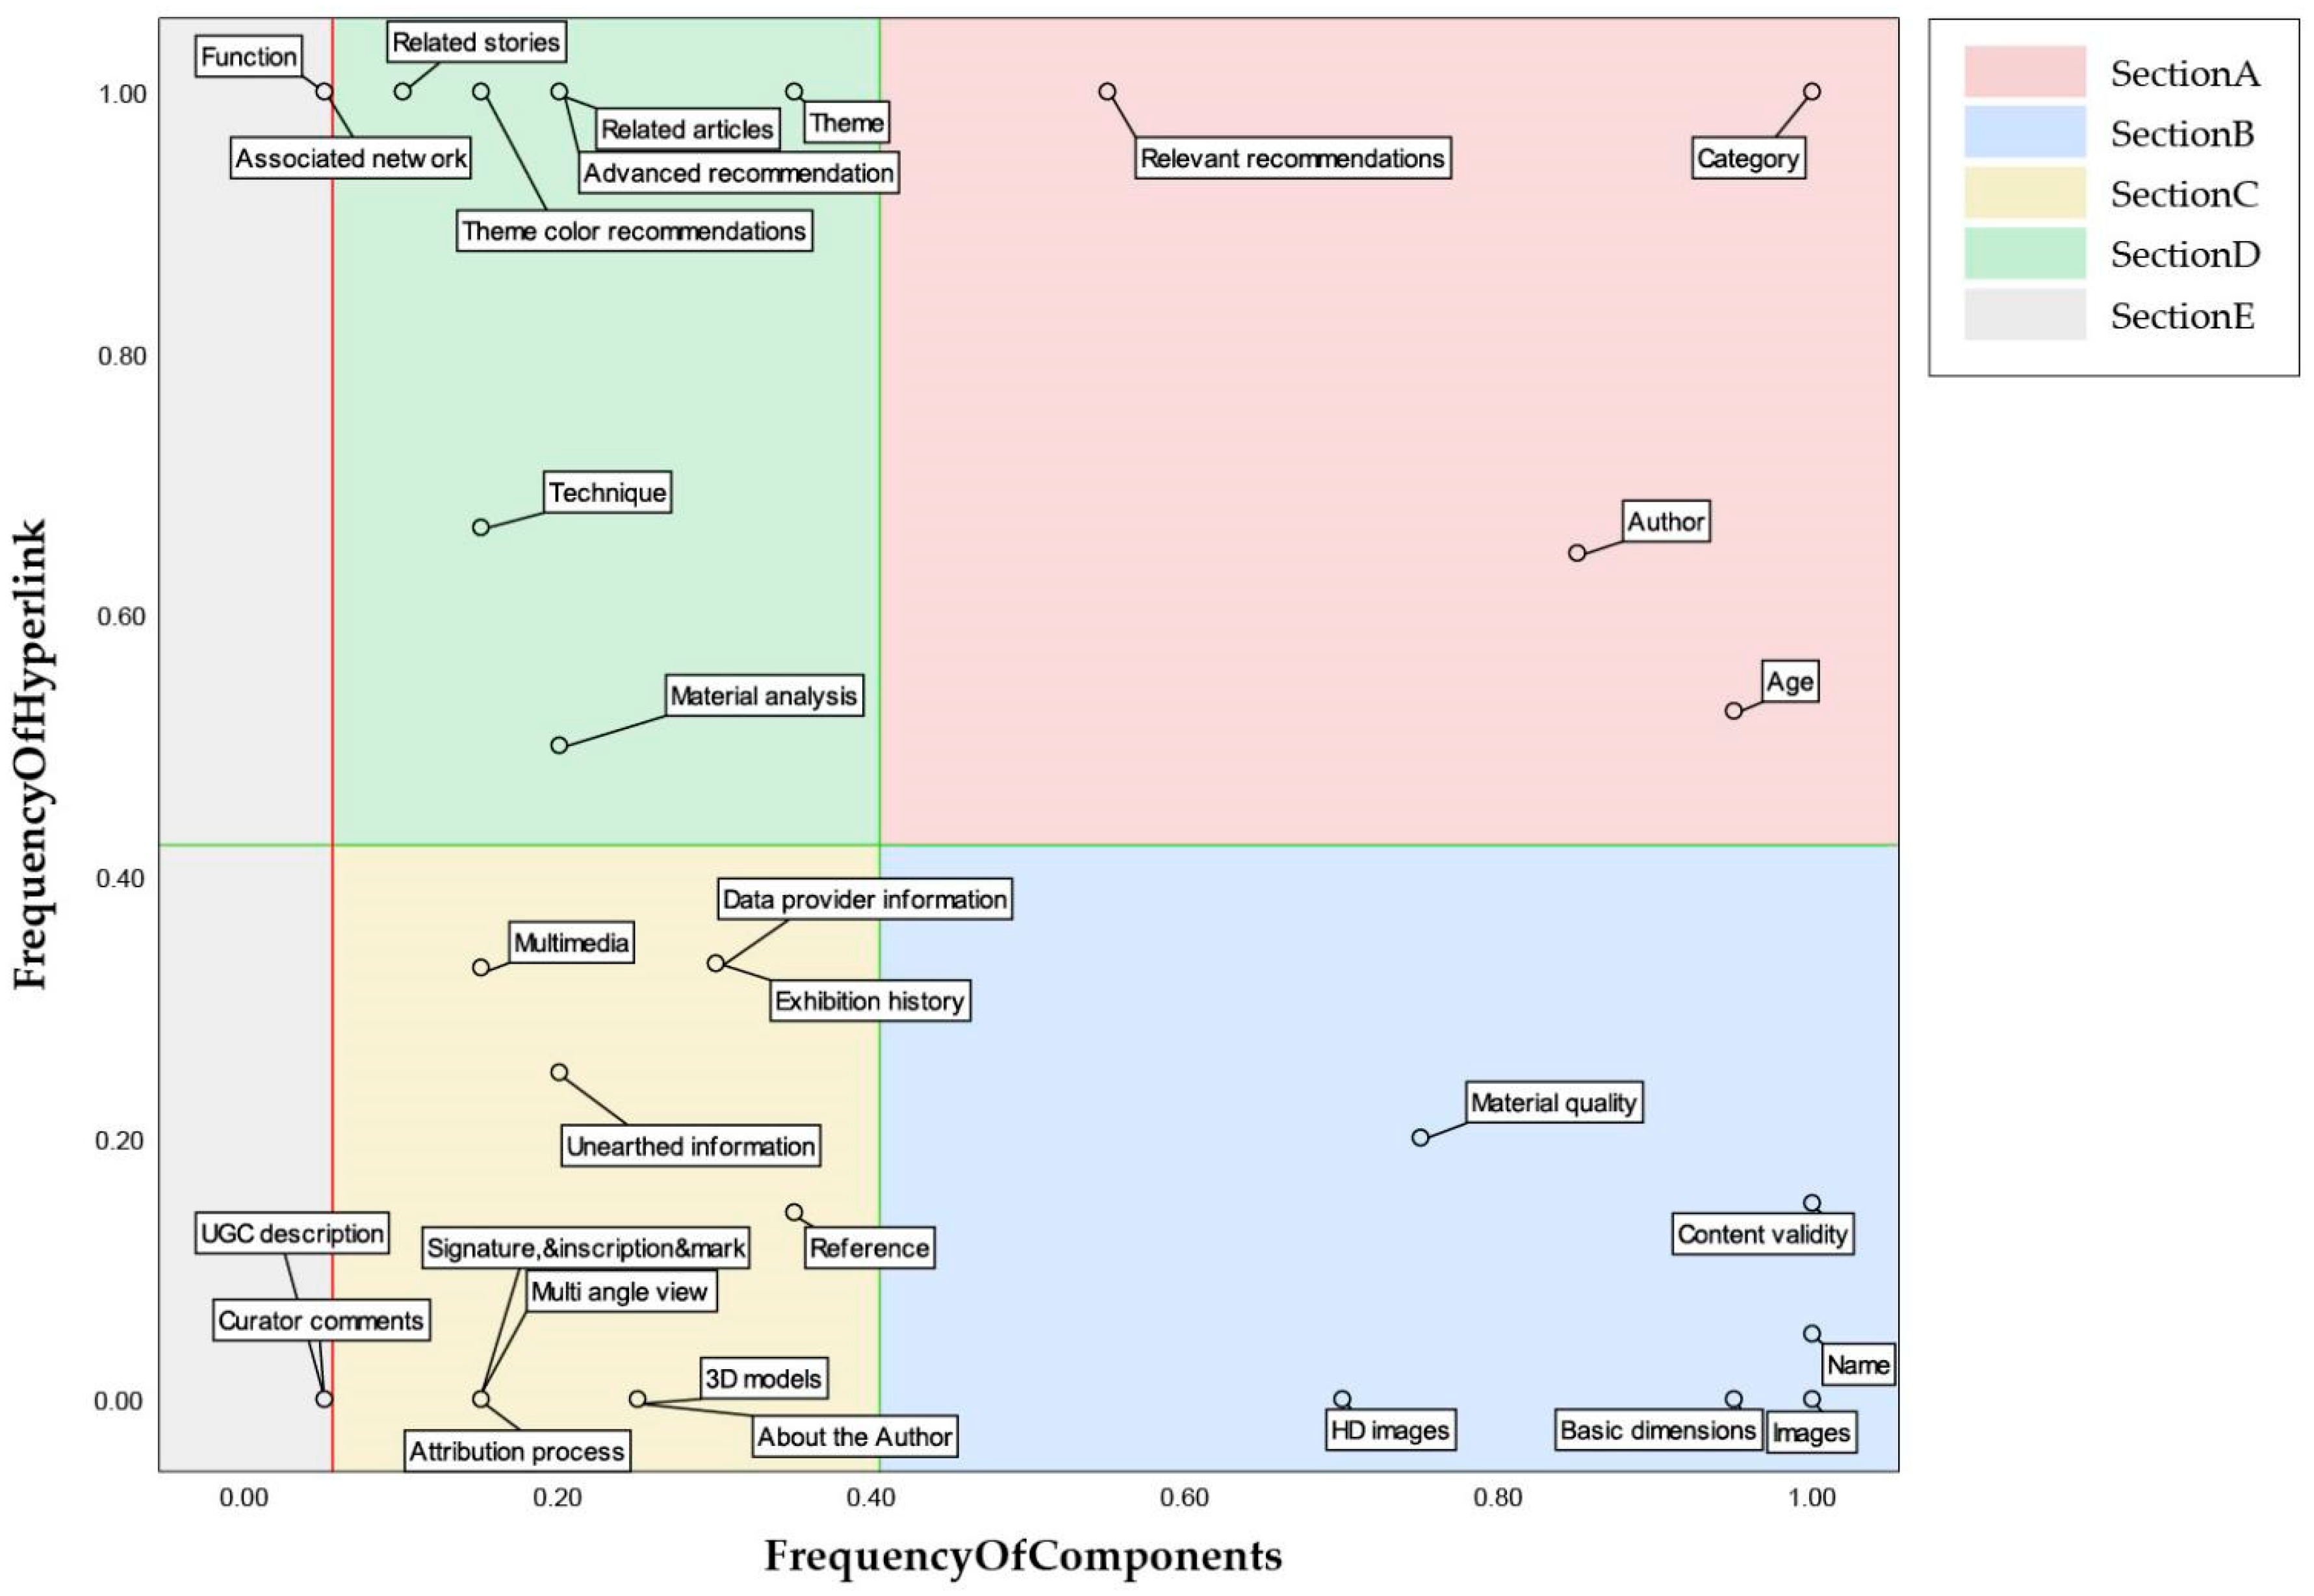
| Axis | Title | Mean | SD. |
|---|---|---|---|
| X | FrequencyOfComponents | 0.4048 | 0.3496 |
| Y | FrequencyOfHyperlink | 0.4235 | 0.4207 |
| Options | Advantages | Disadvantages |
|---|---|---|
| Direct access | No development barrier | Difficult to control variables |
| Paper prototype | Fast production and low cost | Unable to restore the real visit scenario |
| Prototype software | Low-cost web interaction | Off-line access only |
| Prototype website | Balanced between effectiveness and cost | Server and domain name required |
| Complete websites | Completely simulates the real situation | High cost and long production cycle |
| Questions | Model A | Model B | Model C | |||
|---|---|---|---|---|---|---|
| Mean | SE. | Mean | SE. | Mean | SE. | |
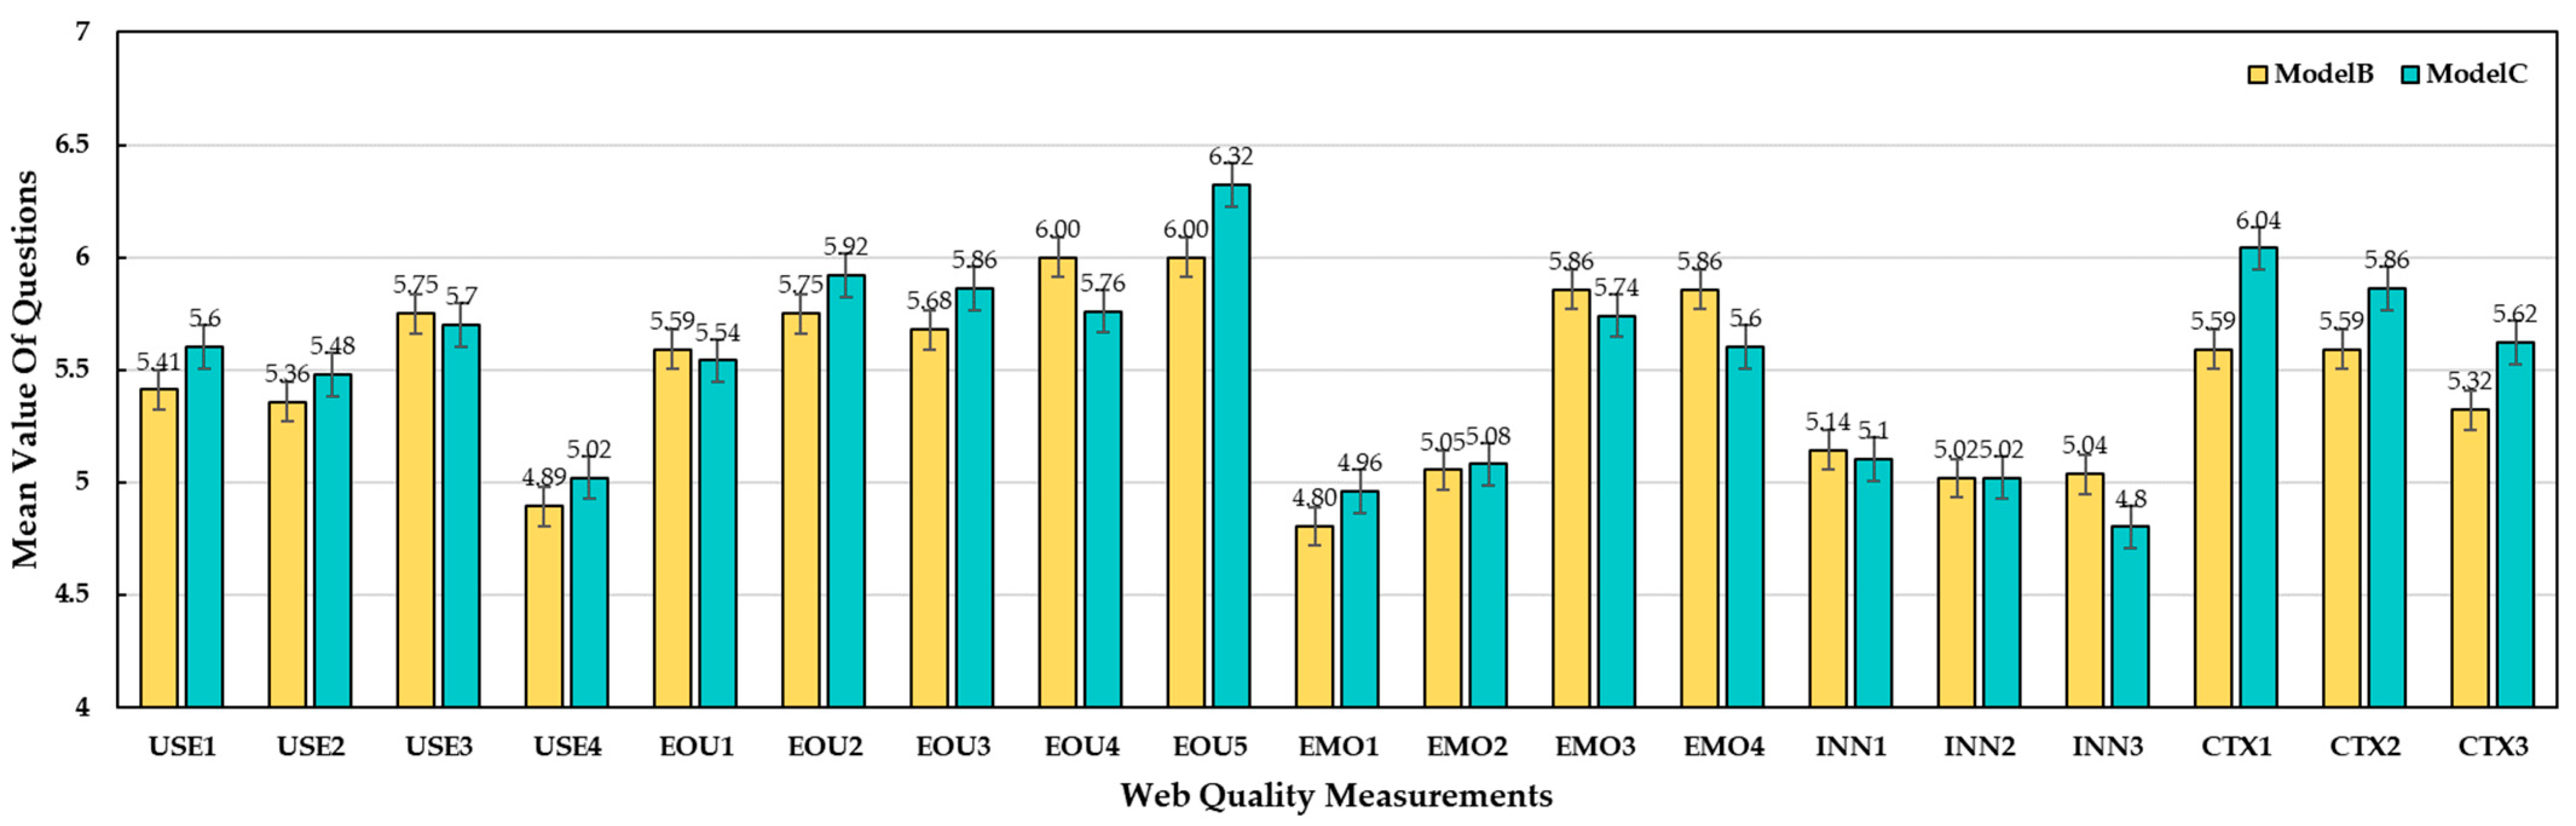
| Usefulness (USE) | ||||||
| The website provides the appropriate breadth and depth of content. | 5.52 | 0.17 | 5.41 | 0.16 | 5.6 | 0.18 |
| The website provides timely and innovative information. | 5.35 | 0.23 | 5.36 | 0.18 | 5.48 | 0.17 |
| The content of the webpage meets my need for information on exhibits. | 5.81 | 0.19 | 5.75 | 0.18 | 5.7 | 0.16 |
| Customized information on the website meets my individual needs. | 5.03 | 0.21 | 4.89 | 0.17 | 5.02 | 0.18 |
| Ease Of Use (EOU) | ||||||
| I can achieve the desired goal quickly during use. | 5.55 | 0.21 | 5.59 | 0.18 | 5.54 | 0.18 |
| The website is well structured and organized. | 6.16 | 0.15 | 5.75 | 0.17 | 5.92 | 0.14 |
| I received clear results and clear feedback during my visit. | 6.03 | 0.21 | 5.68 | 0.18 | 5.86 | 0.14 |
| The content presented is easy to read and understand. | 6.32 | 0.14 | 6.00 | 0.15 | 5.76 | 0.13 |
| The operation is intuitive and easy to understand. | 6.32 | 0.16 | 6.00 | 0.15 | 6.32 | 0.14 |
| Emotion (EMO) | ||||||
| Completing online exploration gives me a sense of achievement. | 5.19 | 0.25 | 4.80 | 0.19 | 4.96 | 0.19 |
| The content and storyline of the website aroused my interest. | 5.03 | 0.25 | 5.05 | 0.18 | 5.08 | 0.18 |
| I believe the content of the website is reliable and trustworthy. | 6.42 | 0.14 | 5.86 | 0.17 | 5.74 | 0.17 |
| When visiting, I can actively control the rhythm of the information presented. | 5.90 | 0.18 | 5.86 | 0.15 | 5.6 | 0.17 |
| Innovation (INN) | ||||||
| The website design is innovative. | 5.16 | 0.21 | 5.14 | 0.20 | 5.1 | 0.20 |
| The content information presented is innovative. | 5.16 | 0.24 | 5.02 | 0.17 | 5.02 | 0.18 |
| The presentation and interaction of content are innovative. | 5.00 | 0.25 | 5.04 | 0.19 | 4.8 | 0.18 |
| Context (CTX) | ||||||
| The website provides rich extended knowledge and contextual information. | 5.77 | 0.18 | 5.59 | 0.16 | 6.04 | 0.13 |
| The website broadens the understanding of the background and context of the exhibits. | 5.84 | 0.15 | 5.59 | 0.17 | 5.86 | 0.17 |
| I found a wealth of contextual content in the exhibit. | 5.68 | 0.16 | 5.32 | 0.17 | 5.62 | 0.17 |
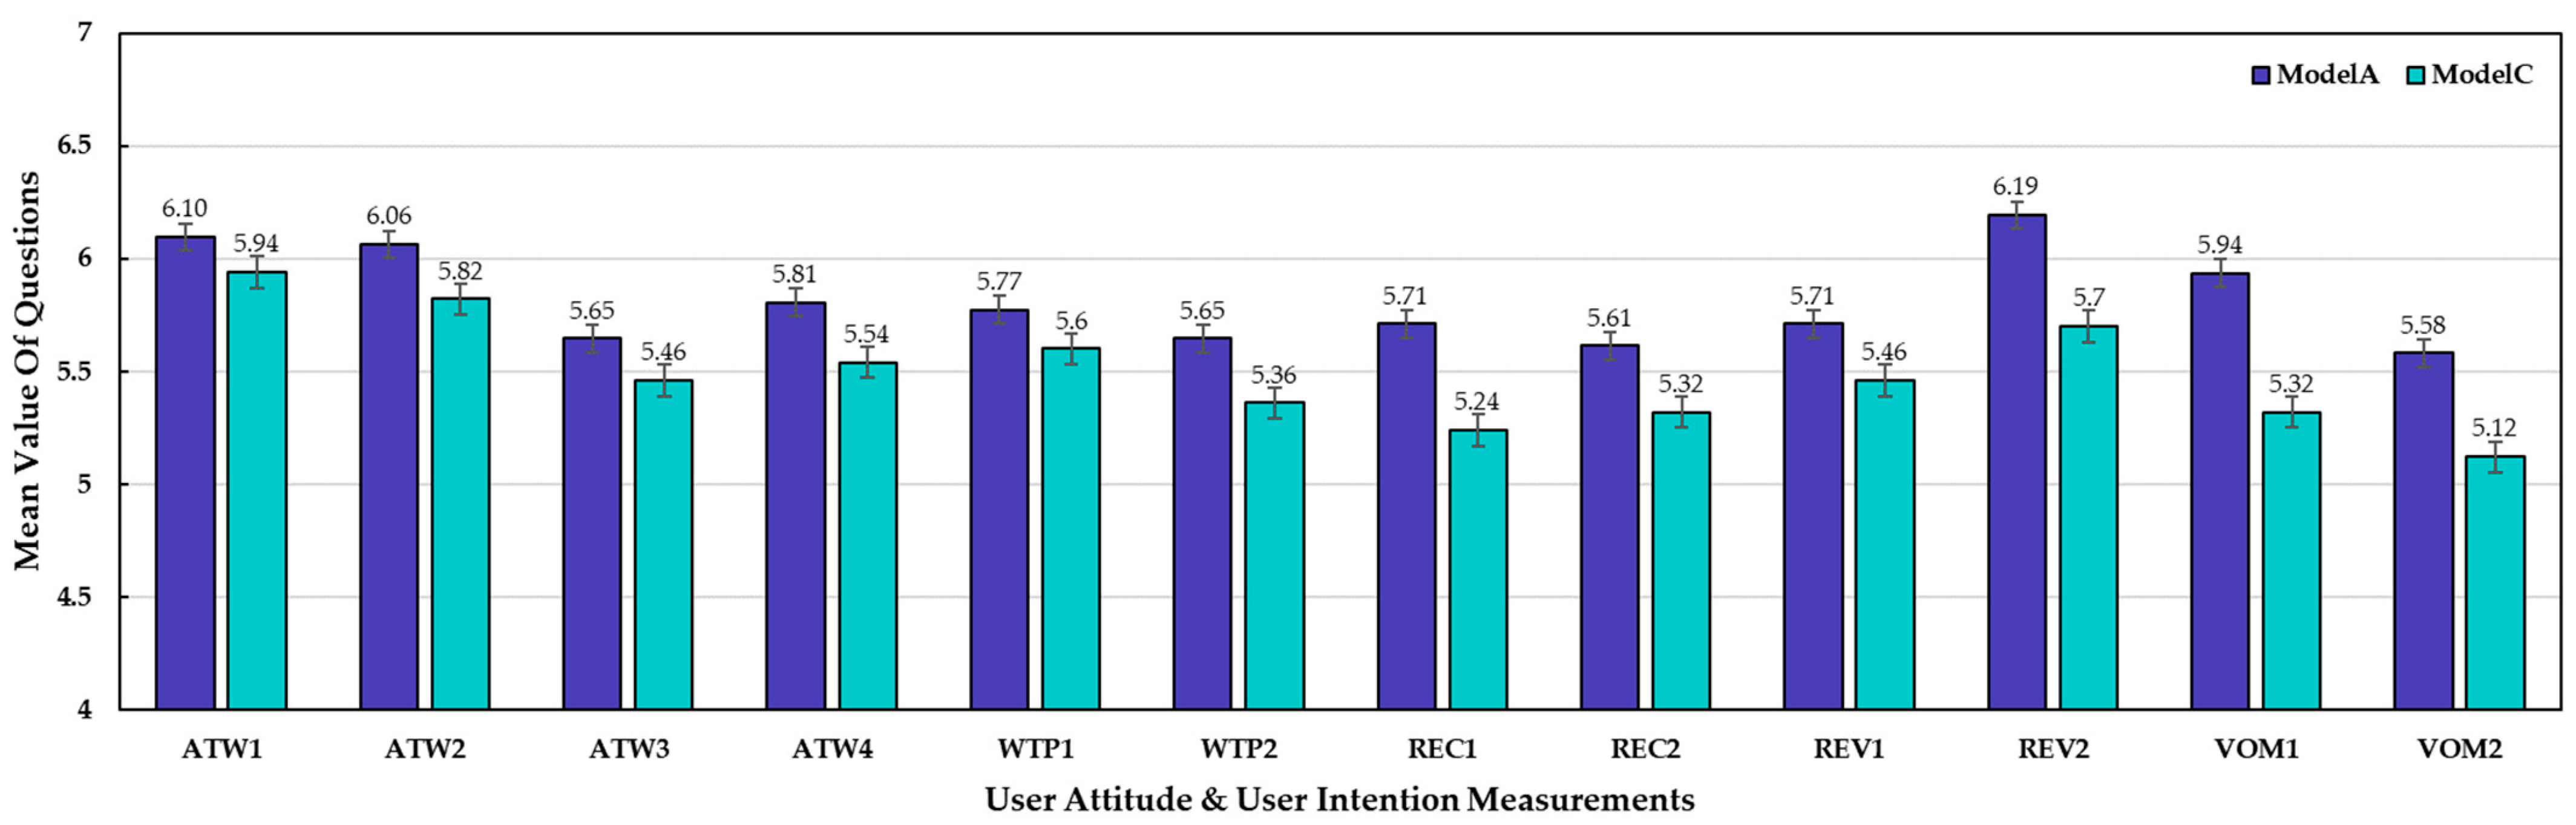
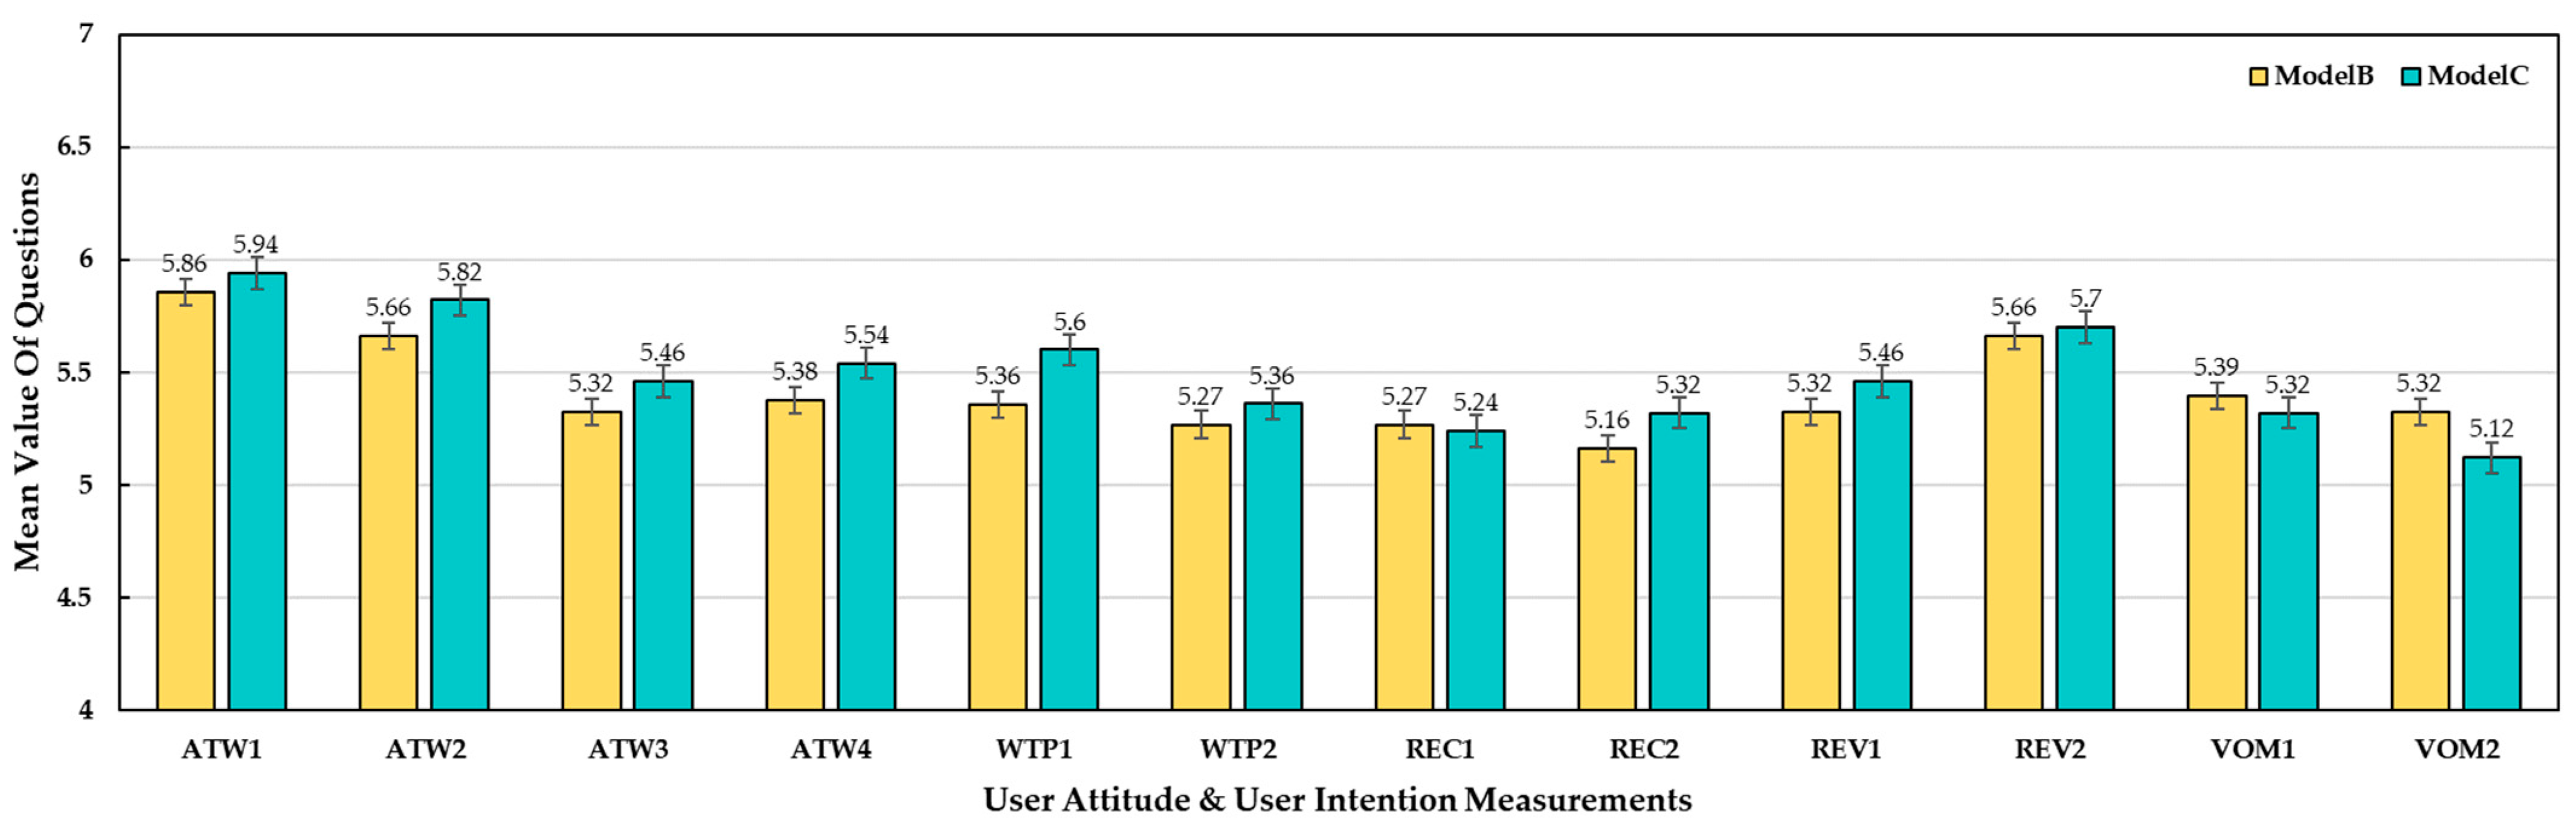
| User Attitude (ATT) | ||||||
| I will give positive feedback about this visit experience. | 6.10 | 0.17 | 5.86 | 0.16 | 5.94 | 0.14 |
| I think the experience of this visit was pleasant. | 6.06 | 0.17 | 5.66 | 0.18 | 5.82 | 0.17 |
| I think the journey of this visit was enjoyable. | 5.65 | 0.22 | 5.32 | 0.17 | 5.46 | 0.16 |
| I found this visit to be a valuable experience. | 5.81 | 0.20 | 5.38 | 0.18 | 5.54 | 0.18 |
| Willingness to Participate (WTP) | ||||||
| Given a chance, I would like to participate in the museum’s online community and activities. | 5.77 | 0.24 | 5.36 | 0.16 | 5.6 | 0.18 |
| I would like to like, retweet, favorite, and comment on exhibits that interest me on the site. | 5.65 | 0.23 | 5.27 | 0.19 | 5.36 | 0.19 |
| Willingness to Recommend (REC) | ||||||
| I would recommend this online museum to others. | 5.71 | 0.26 | 5.27 | 0.20 | 5.24 | 0.18 |
| I would like to share this positive experience with my friends. | 5.61 | 0.28 | 5.16 | 0.20 | 5.32 | 0.17 |
| Willingness to Revisit (REV) | ||||||
| I would like to revisit this online museum in the future. | 5.71 | 0.26 | 5.32 | 0.19 | 5.46 | 0.16 |
| If necessary, I will choose to visit this online museum. | 6.19 | 0.15 | 5.66 | 0.17 | 5.7 | 0.16 |
| Willingness to Visit Offline Museum (VOM) | ||||||
| I would like to visit the corresponding offline Museum. | 5.94 | 0.22 | 5.39 | 0.18 | 5.32 | 0.18 |
| This visit made me interested in the corresponding offline Museum. | 5.58 | 0.27 | 5.32 | 0.18 | 5.12 | 0.18 |
| Background | Catagory | Frequency | Percentage (%) |
|---|---|---|---|
| Gender | Male | 84 | 61.32 |
| Female | 53 | 38.69 | |
| Age | ≤18 | 13 | 9.5 |
| 19–22 | 78 | 56.93 | |
| 23–30 | 44 | 32.12 | |
| 31–45 | 2 | 1.5 | |
| ≥46 | 0 | 0 | |
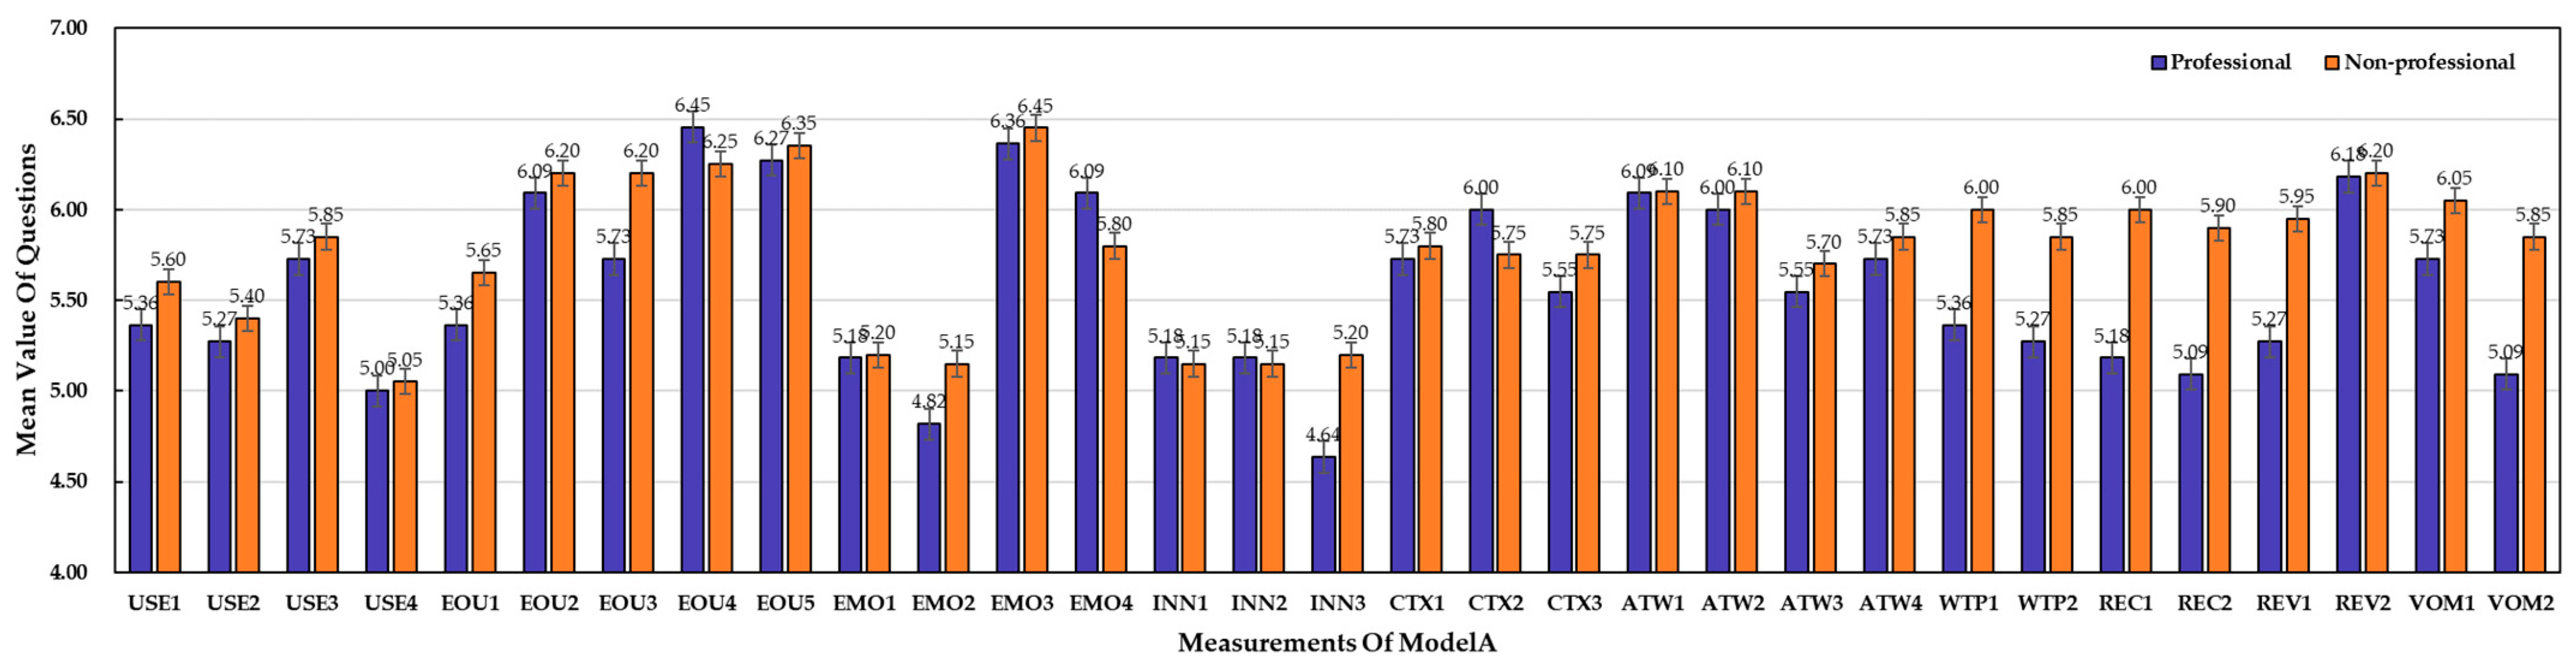
| Professional | Yes | 58 | 42.34 |
| No | 79 | 57.66 | |
| Visit frequency of online museum (per year) | 0 | 65 | 47.45 |
| ≤3 | 63 | 45.99 | |
| 4–11 | 8 | 5.8 | |
| ≥12 | 1 | 0.7 | |
| Visit frequency of offline museum (per year) | 0 | 22 | 16.06 |
| ≤3 | 89 | 64.96 | |
| 4–11 | 25 | 18.25 | |
| ≥12 | 1 | 0.7 |
Publisher’s Note: MDPI stays neutral with regard to jurisdictional claims in published maps and institutional affiliations. |
© 2022 by the authors. Licensee MDPI, Basel, Switzerland. This article is an open access article distributed under the terms and conditions of the Creative Commons Attribution (CC BY) license (https://creativecommons.org/licenses/by/4.0/).
Share and Cite
Meng, L.; Liu, Y.; Li, K.; Lyu, R. Research on a User-Centered Evaluation Model for Audience Experience and Display Narrative of Digital Museums. Electronics 2022, 11, 1445. https://doi.org/10.3390/electronics11091445
Meng L, Liu Y, Li K, Lyu R. Research on a User-Centered Evaluation Model for Audience Experience and Display Narrative of Digital Museums. Electronics. 2022; 11(9):1445. https://doi.org/10.3390/electronics11091445
Chicago/Turabian StyleMeng, Lei, Yuan Liu, Kaiwen Li, and Ruimin Lyu. 2022. "Research on a User-Centered Evaluation Model for Audience Experience and Display Narrative of Digital Museums" Electronics 11, no. 9: 1445. https://doi.org/10.3390/electronics11091445