Article

Integrated Electro-Thermal Model for Li-Ion Battery Packs

Department of Electronics, Information and Bioengineering, Politecnico di Milano, 20133 Milan, Italy
*
Author to whom correspondence should be addressed.
Electronics 2022, 11(10), 1537; https://doi.org/10.3390/electronics11101537
Submission received: 1 April 2022 / Revised: 28 April 2022 / Accepted: 9 May 2022 / Published: 11 May 2022

Abstract

:
Lithium-ion battery is considered one of the most attractive energy storage systems for electric vehicles. However, one of its main drawbacks is the sensitivity to temperature. In a battery pack composed of lithium-ion batteries, during the charge/discharge operations, the temperature gradually increases, especially in the batteries positioned in the central part of the battery pack. This leads the central batteries to age faster and exposes them to the risk of a thermal runaway. In order to mitigate these problems, thermal management systems are needed. However, for the implementation of the control, it is important to know the temperature distribution inside the whole pack. In this paper, an integrated electro-thermal model capable of estimating the thermal behavior of each battery cell, composing the battery pack, only knowing the total current and ambient temperature, is proposed and analyzed. The proposed model was tuned and validated by means of experimental results. The circuital approach used in this model gives good results with a low degree of complexity.

1. Introduction

Lithium-ion batteries (LiBs) are nowadays considered the best solution as a storage system for electric vehicles, thanks to their high specific energy and power density and long lifespan [1]. In traction applications, the storage system needs to guarantee a high range and ensure certain acceleration performances. Therefore, both the energy and the power of the battery are of paramount importance and a quite large battery pack composed of many cells arranged in series and parallel to each other is needed. The dimension of the battery pack and the connection of many cells lead to some problems such as the temperature increase in the inner cells and unbalancing among the cells themselves [2]. The former is very critical because the high temperature is one of the strongest conditions for batteries. Moreover, above a certain temperature, a thermal runaway can happen, which makes the battery catch fire and explode. To avoid the aforementioned conditions, it is extremely important to properly control the battery pack. For this purpose, usually, a battery management system (BMS) is implemented that checks the battery parameters and controls the battery operations. However, due to the limitations of the measurement system, not all cell measurements are always available. Therefore, a battery model should be implemented in the BMS that is able to precisely predict the needed variables. This model should predict both the thermal and electrical parameters of the battery.
Several studies can be found in the literature that model the thermal and electrical behavior of the single cell and the battery pack with different perspectives and approaches. The approaches to defining a model can be either physical, empirical, or circuital [3]. All these approaches have their strengths and weaknesses. The physical approach is very accurate and detailed but normally leads to very complex models that require a high computational cost. On the other hand, empirical models are very simple and fast but less accurate. The circuital approach is a good tradeoff between accuracy and computational cost, making it a good candidate for BMSs.
The electrical behavior of the lithium-ion batteries can be modeled with a voltage source in series with an impedance. The voltage source represents the open-circuit voltage, which mainly depends on the state of charge (SOC) of the battery. The series impedance in the simplest model is just an ohmic resistance [4]. However, this model is not able to predict the dynamic behavior of the battery. To overcome this issue, in [5], different RC parallel branches are added to the model to take into account the relaxation effect, while in [6] the RC parallel branches are combined with a Warburg impedance to model the slow dynamic related to the ion diffusion process. In general, these kinds of electric model, with a different number of RC parallel branches, are known as Thevenin electric models [3]. The larger the number of RC branches the wider the frequency range and accuracy of the dynamic behavior modeled. Based on the aim of the application and desired accuracy, it is possible to choose a different number of RC branches.
Regarding the thermal behavior, the same elements used in the electrical model can be used. Thermal resistances, thermal capacitances, and heat sources are combined to predict the temperature of the cells. The authors of [7] developed a simple thermal model for a cylindrical lithium-ion cell, where the parameters of the model were determined using a thermocouple inserted into the cell (measuring the internal temperature) and another thermocouple put on the surface of the cell. The proposed model is able to reproduce the thermal behavior of the internal temperature of the battery cell. In [8], the authors used the Foster network to model the thermal behavior of a battery thermal system. The Foster network is composed of several RC parallel branches, similar to the Thevenin electric model, in series with a lumped heat source. The authors showed that the Foster network produces equivalent results to the ones obtained from computational fluid dynamic simulations but in much less time. Moreover, this model can be easily integrated with a battery electric circuit model. Nevertheless, differently from the classical thermal circuit models, where the thermal resistances and thermal capacitances have a physical meaning and are connected to each other according to the topology of the system modeled, in the Foster network they are connected in a fixed way regardless of the physical topology of the battery cell. On the other hand, they do not have a physical meaning but just represent the transfer function of the battery system. This implies a more difficult tuning of the parameters and makes the adaptation of the model to other kind of cells complex.
The electrical and thermal behaviors of the batteries are correlated. On one side, the internal battery resistance leads to joule losses that generate heat. On the other hand, this internal resistance changes as a function of the temperature [9]. To have a precise estimation is then important for combining the two models, especially for the modeling of a battery pack, where the temperature of the most inner cells is very critical. In [10], the electrical behavior of the battery during discharge is described by the Thevenin equivalent circuit model, while the energy conservation equation is implemented to solve the thermal problem. This model can estimate the heat generation inside the cell by calculating the contribution due to joule losses and the reversible contribution due to entropic variation of the electrochemical reaction. However, it needs a 3D simulation tool to compute the temperature distribution inside the battery pack. A 3D electrothermal model for a big battery pack is also proposed in [11]. The high computational required power makes them difficult to implement onboard. The authors of [12] developed a circuital thermal model that evaluates the temperature of the battery pack, through which it is possible to control the cells. However, it only takes into account the temperature of the entire pack and not that of the single cells. In [13], a power input electrothermal model that predicts the dynamic response of a single cylindrical battery cell and captures the changes in surface temperature is proposed. The authors of [14] developed a simple model for a battery pack composed of cylindrical lithium-ion cells, which uses a lookup table to evaluate the parameters based on the operating conditions, suitable to be implemented in a microcontroller. A lumped electrothermal model is proposed in [15] for a prismatic cell, which can represent the behavior in charge and discharge through the use of some diodes. The model is very simple and can easily be extended to a battery pack but it does not consider the longitudinal heat flux inside the cell. The authors of [16] developed an integrated electro-thermal model for a single pouched lithium ion cell using a circuital approach. This model is very simple and reliable at representing the behavior of a single pouch-cell. Nevertheless, it cannot be used to simulate a battery pack since it does not allow us to model the heat exchange between adjacent cells inside the same battery pack.
In this paper, an integrated electro-thermal model of a battery pack build with pouch cells is proposed. This model, based only on the knowledge of the current exchanged by the battery with the external circuit, can predict the heat generation, heat dissipation, and the temperature behavior of all the cells composing the battery pack. This model is completely modular and can be used for battery packs composed by a general number of cells. All the parameters of the model are related to the physical characteristics of the cell (e.g., the dimensions) and can be tuned by simple experimental tests. The model, tuned using tests on a single cell and on a three cells battery pack, is validated by means of experimental tests on a ten cells battery pack showing a maximum error in predicting the external temperatures of the pack of 2 K degrees. Moreover, the model can be used to predict the temperatures of all the inner cells. Most inner cells are expected to be the hottest since they do not have any heat exchange with the environment. Predicting their temperature allows us to better estimate the aging and the performance of the battery pack.
The paper is organized as follows. Section 2 is devoted to the description of the model. In Section 3 the experimental procedures, setups, and results for the estimation of the model parameters are described. Results from numerical simulations and experimental tests are presented and analyzed in Section 4. Finally, conclusions are drawn in Section 5.

2. Battery Model

The battery pack under study is composed by Lithium Nickel Manganese Cobalt Oxide (NMC) Li-ion pouch batteries with the specification reported in Table 1. The analyzed ten cells battery pack is shown in Figure 1.
As reported in [16], the proposed model is composed of three different sub-models: electrical, thermal, and heat generation models. The heat generation is continuously distributed in the cell and the heat exchange with the environment is also distributed along the external surface. Nevertheless, the proposed model is based on lumped parameters. For this reason, considering the size of the cell, the heat generation has been concentrated in only two points, as shown in Figure 2 and in Figure 3. The heat generated in each one of the two points is related to the losses associated with the resistors around the heat generator (see Figure 2). The set of resistors and the heat generator is indicated as “mesh” in this paper. On the basis of the cell dimensions, the number of used meshes can change. In this paper a 2-meshes model is considered.

2.1. Electrical Model

The same electrical model deployed in [16] was used in this work. Since the aim of this study is to provide a model that predicts the thermal behavior of the battery pack, and the electrical time constant of the battery cell is significantly smaller than the thermal one; for the electrical aspects it is enough to reproduce the steady-state behavior. Therefore, no electrical capacitances are considered. Differently from the model proposed in [16], the electrical model, in addition to the internal electric resistance Rs, is composed of an open circuit voltage E, which depends on the SOC. This can be useful for the battery pack because it is possible to take into account different internal voltages of the cells. According to the number of chosen meshes, two in this case, the electric resistance is spatially distributed over the cell forming two circuits loops (Figure 2). The electrical behavior is considered uniform along the height (i.e., dimension H in Figure 3 and Figure 4) and therefore the electrical circuit is planar and can be represented in the plane L-W (i.e., length-width). The resistances Re, represented in the figure, are extensive parameters proportional to the path length. Given the size of the considered cell, all the resistance branches in the figure are equal since they refer to the same length paths of the current. The branch resistance Re can be calculated as a function of the series resistance Rs as:
R e = 15 11 R s .
Generally, the battery internal resistance depends on the working conditions of the battery, such as the temperature and the SOC. In this model, only the temperature dependence is considered, since it is generally higher than the dependence on the SOC [17].

2.2. Thermal Model

The heat flux is considered uniform along the W (i.e., width) dimension because of the almost planar shape of the cell. For this reason, the thermal model lays on the L-H (i.e., length-height) plane as illustrated in Figure 3. The thermal model of the single Li-ion cell (Figure 3) is also composed of two meshes, which are related to the electrical meshes. Each of them contains one lumped heat source, one vertical branch of thermal resistances Rth,1, and one thermal capacitance Cth. The two branches are connected with a longitudinal thermal resistance Rth,2. Rth,a and Rth,L are the thermal resistances referring to the heat flux exchange with the ambient. They are related to the blue and green surfaces in Figure 4. In [16], only the upper and bottom surfaces were taken into account for the heating exchange with the ambient (blue surface). In this work, to improve the thermal model, the side surfaces are also considered. The heat exchange with ambient is by convection, therefore Rth,a and Rth,L can be calculated as in [16]:
R t h , a = 1 h S u p
R t h , L = 1 h S l a t ,
where h is the convection heat transfer coefficient and Sup and Slat are the surfaces as reported in Figure 4.
The contact between two cells of the battery pack is modeled as shown in Figure 5. In cell-to-cell contact, the heat flux exchanged between two cells passes through the contact thermal resistance Rth,c. The part of the heat that is exchanged to the ambient passes through Rth,L.
The whole model of the battery pack is obtained by connecting two ambient exchange models placed on the sides to a sequence of battery cell and cell-to-cell contact models, according to the number of cells, as highlighted in Figure 5.

2.3. Heat Generation Model

According to [18], the total heat flux generated Qtot is composed of two contributions: the irreversible heat component and the reversible one. The irreversible heat flux component Qirr is associated with the joule losses, while the reversible heat flux component Qrev is related to the polarization effect of the chemical reactions inside the battery. In particular, it is related to the entropy change and represents the electric power associated with the variation of the open-circuit voltage E as a function of the surface temperature Ts of the battery. The total heat flux generated can be calculated as in [16]:
Q t o t = Q i r r + Q r e v = R s i 2 T s E T s i ,
where i is the total battery current.
By considering the electrical model in Figure 2 and the thermal model in Figure 3, the heat flux produced by the two lumped sources Qa and Qb is:
{ Q a = ( 2 R e i 1 2 ) + ( R e i 3 2 ) + ( 1 2 R e i 4 2 ) + T 13 E T 13 ( 2 i 1 + i 3 + i 4 2 ) Q b = ( 2 R e i 2 2 ) + ( R e i 2 2 ) + ( 1 2 R e i 4 2 ) + T 24 E T 24 ( 2 i 2 + i 2 + i 4 2 ) ,
where T13 and T24 are the averages between T1 and T3 and between T2 and T4 respectively.

3. Parameter Characterization and Test Setup

Different experimental tests were performed to obtain the electric parameters of the electrical model, the thermal parameters of the battery cell model, the thermal parameters of the ambient exchange model, the thermal parameters of the cell-to-cell contact model, and the entropy change behavior of the heat generation model.
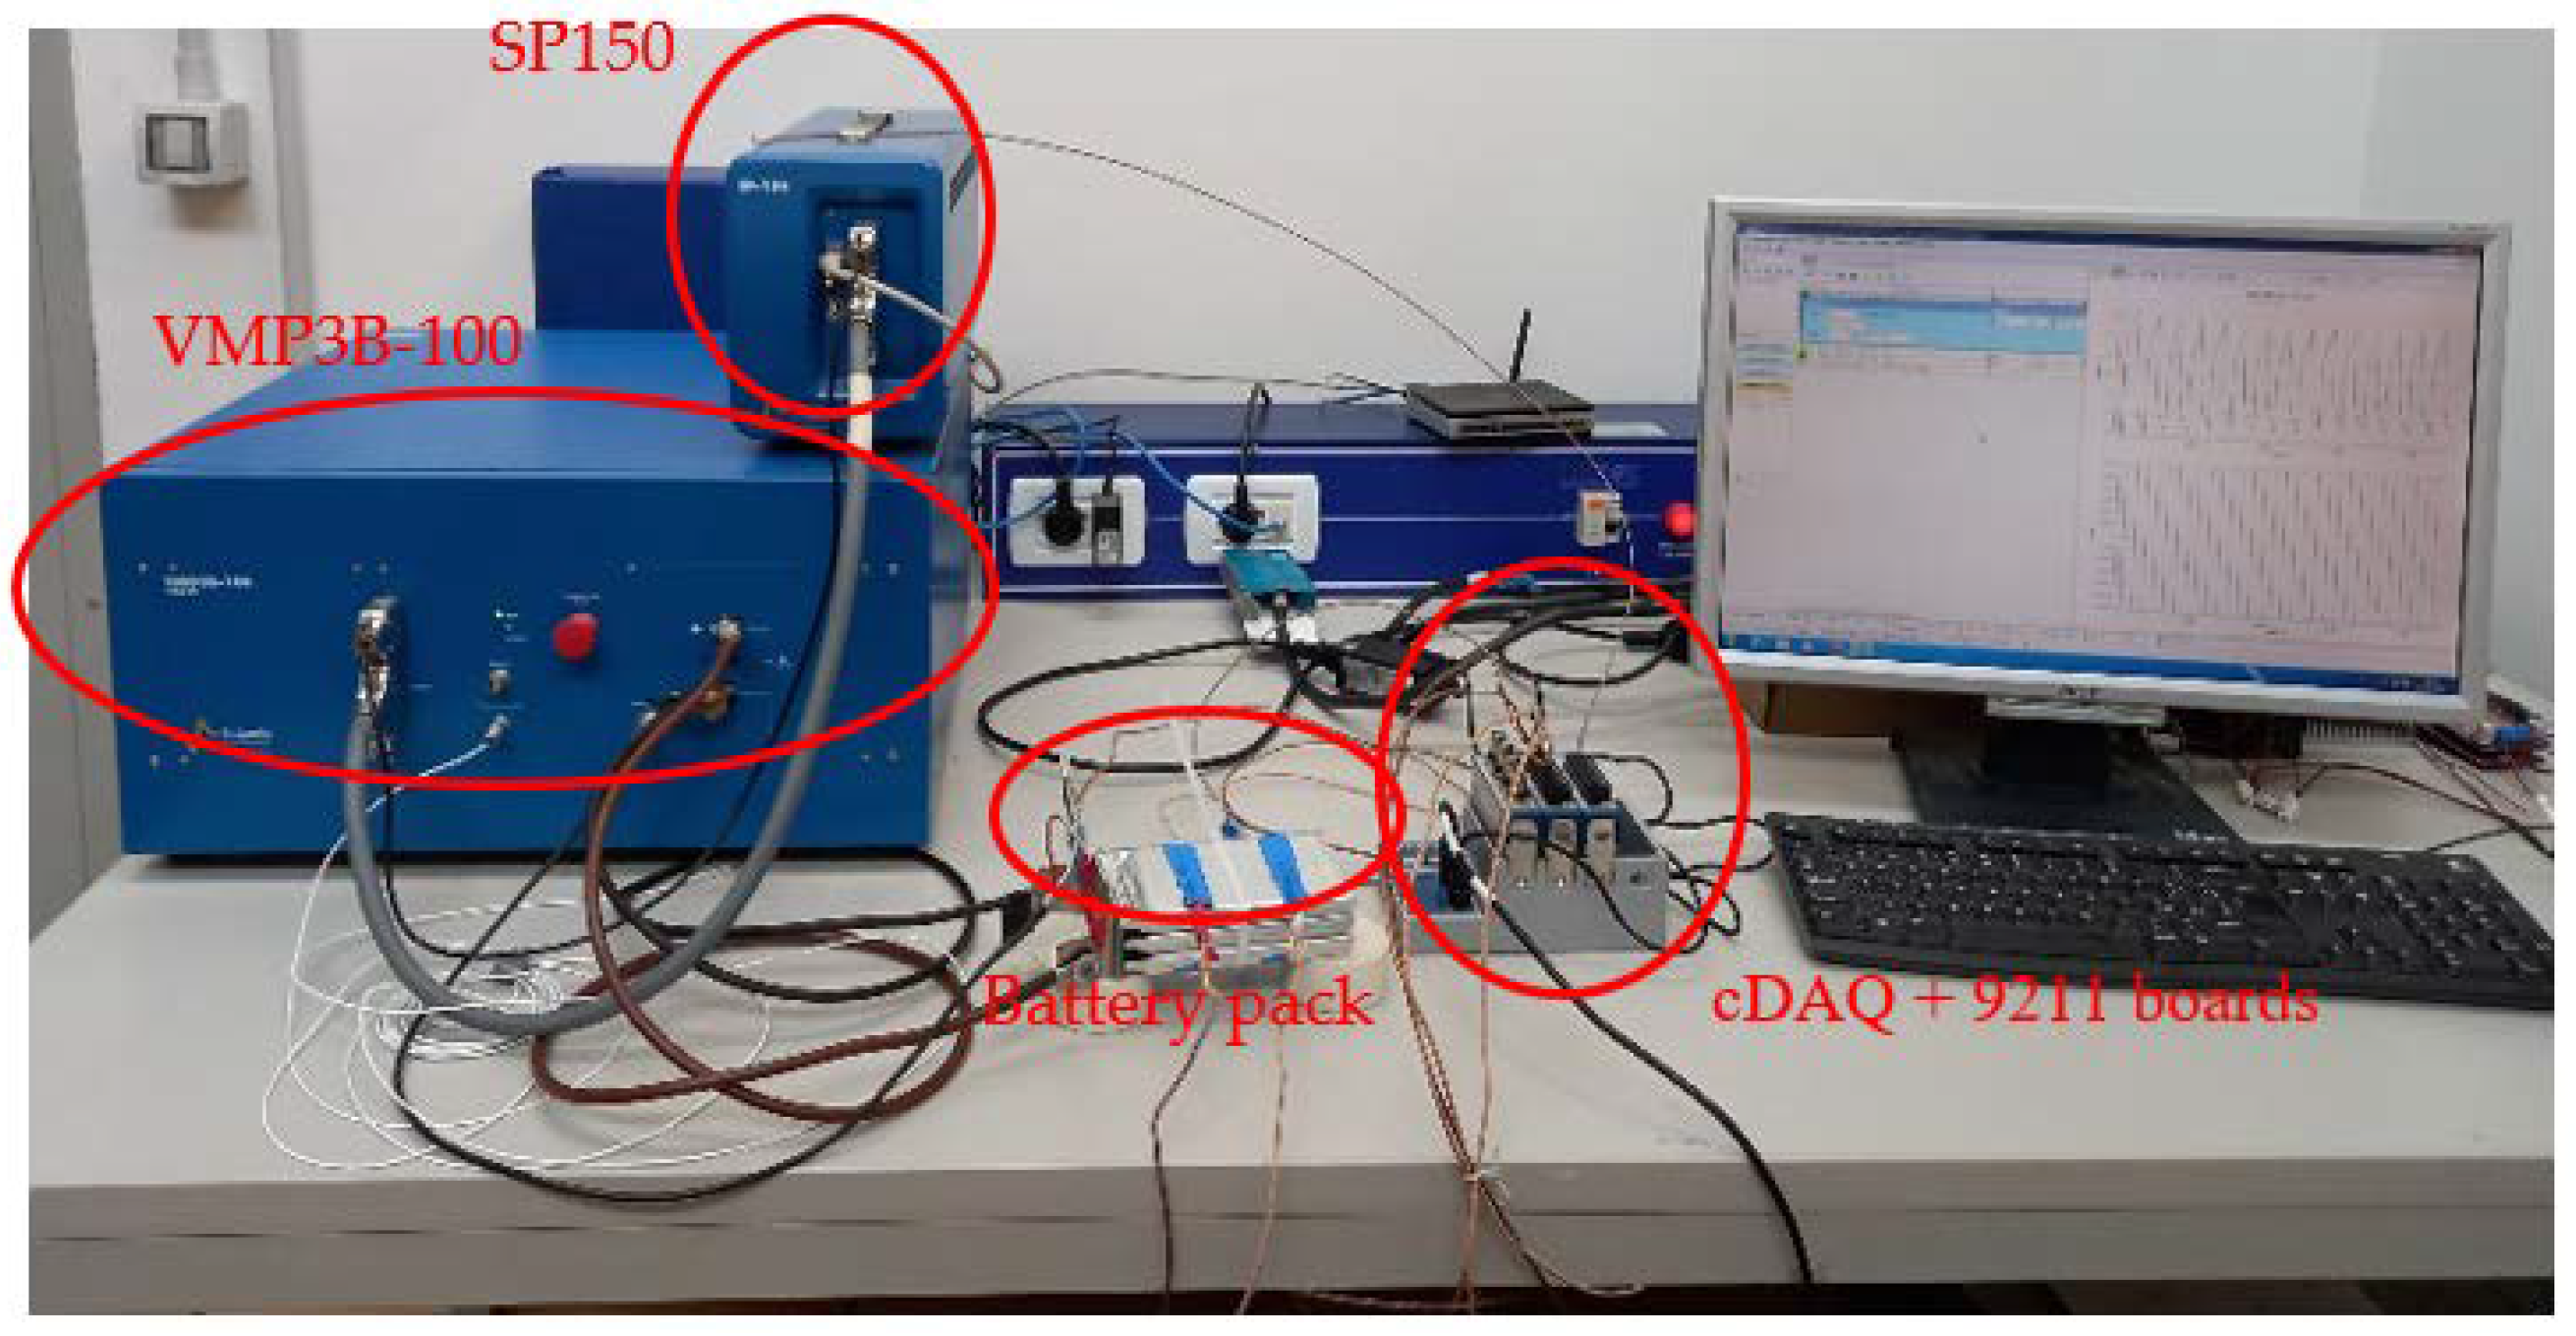
The test setup is constituted by a potentiostat (SP-150) coupled with a booster (VMP3B-100) manufactured by Bio-logic, which is used to control the current exchanged by the Li-ion battery pack (or cell) under testing. Both the devices are controlled by a PC using the EC-Lab software.
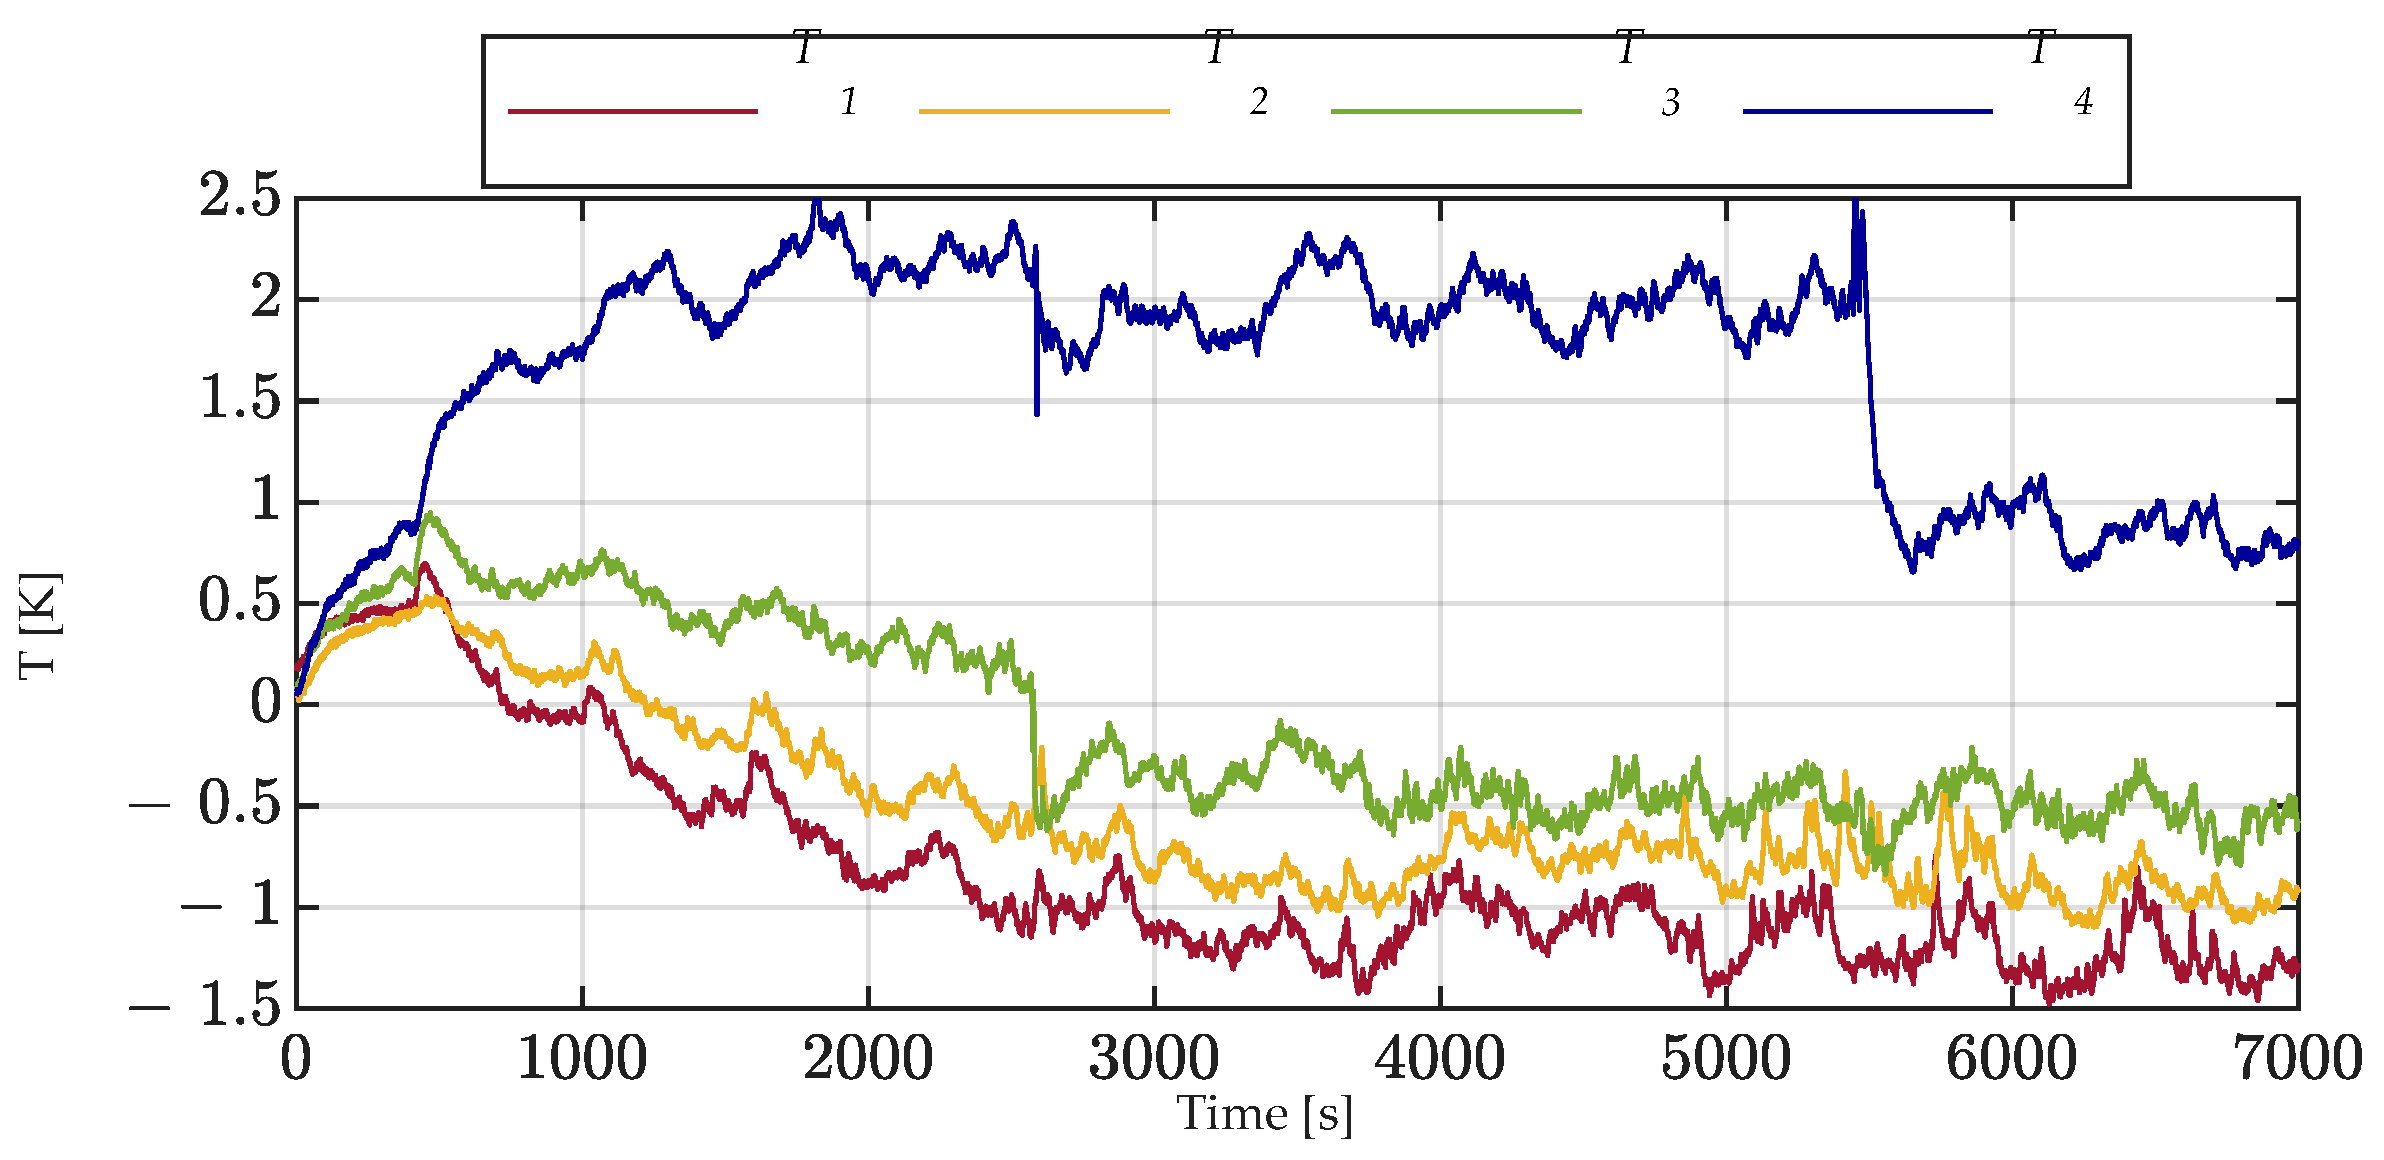
In order to acquire the temperatures, four type-K thermocouples are connected to the battery pack (or cell) under testing to measure the four temperatures considered in the model. In particular, for the single-cell test, the four thermocouples were used to measure T1, T2, T3, and T4 at four points on the surface of the single cell (
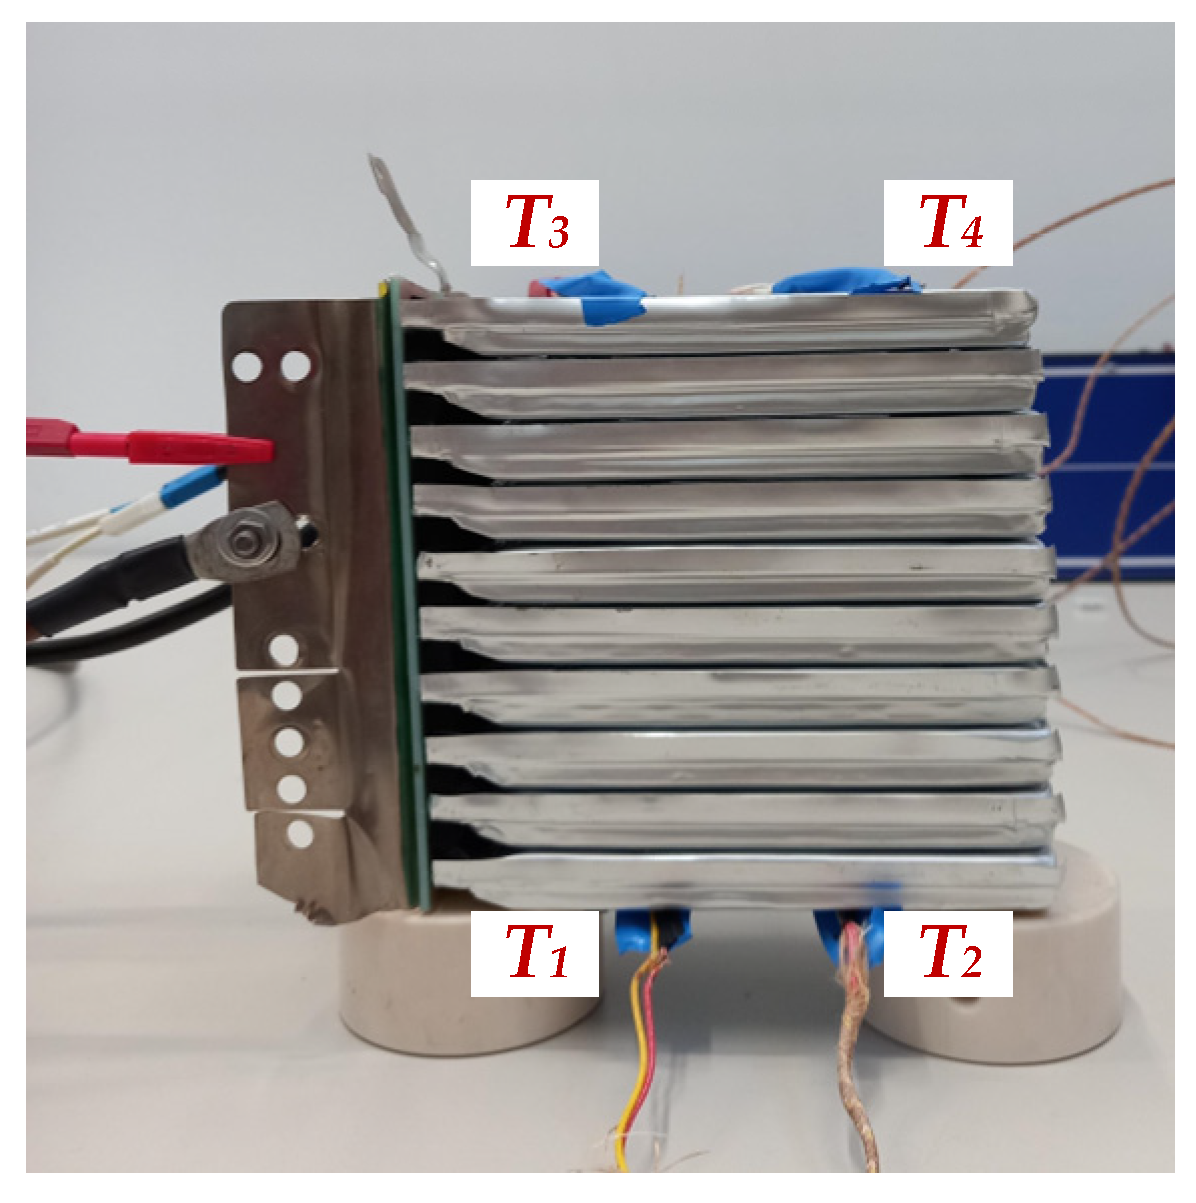
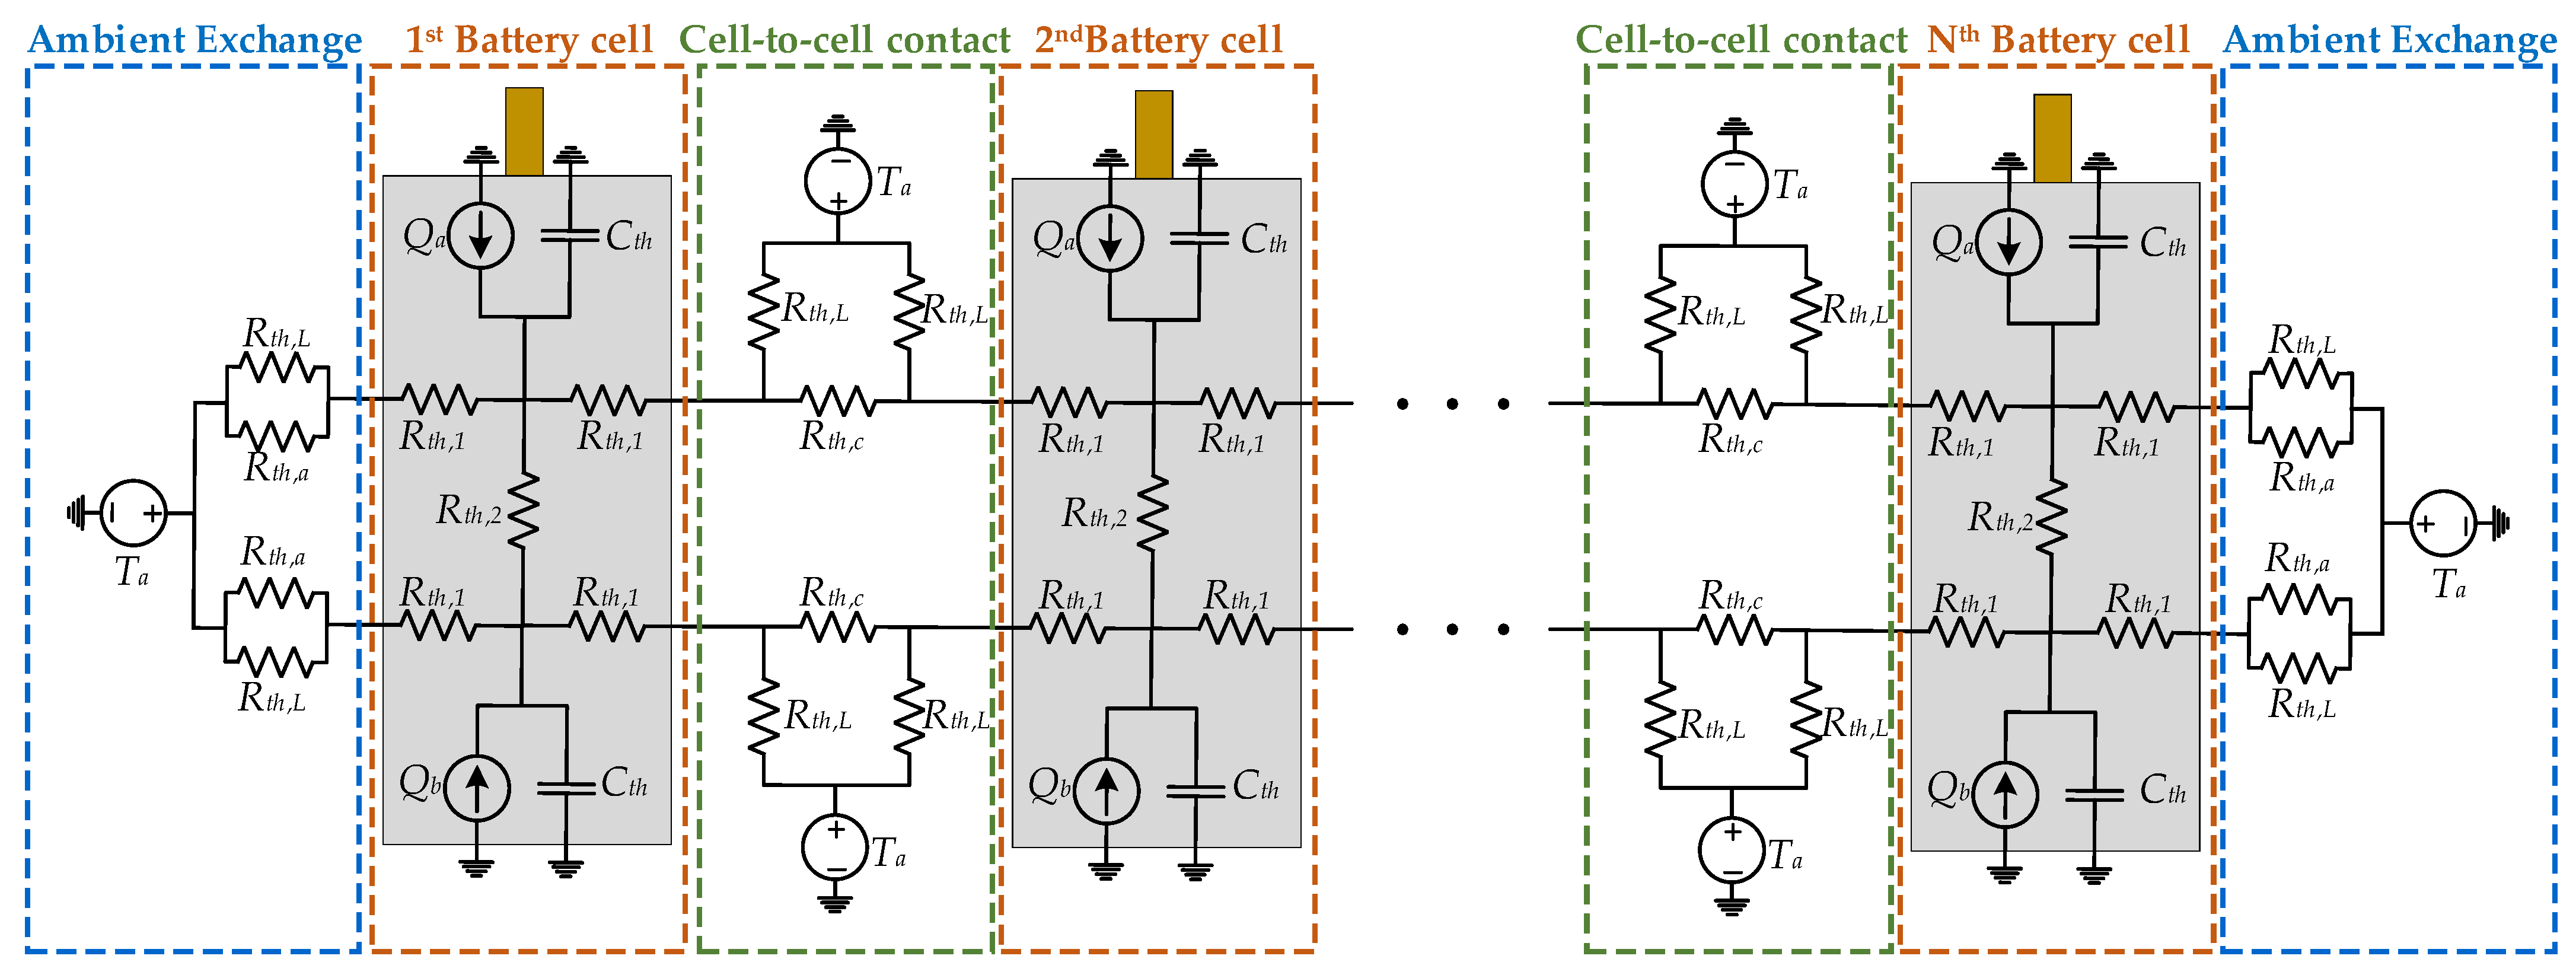
Figure 3) while for the tests on the battery packs (three cells and ten cells) the same four thermocouples were used to measure the temperature at four points on the external cells of the battery pack (Figure 1). Moreover, a fifth thermocouple was used to measure the ambient temperature in all the tests. The signals of the thermocouples were acquired using two National Instrument 9211 modules connected to a cDAQ-9174 and logged with a simple Labview program. The whole test setup is shown in Figure 6 for the test with the three-cells pack and the accuracy of the instrumentation is reported in Table 2.

3.1. Electric Resistance Characterization of the Single Cell

The electric resistance of the single battery cell was measured by performing galvanostatic electrochemical impedance spectroscopy (GEIS) at different temperatures. The GEISs were done from 0.01 Hz to 10 kHz. The value of the dc resistance was taken as indicated in [19]. Hence, the temperature dependence of the internal resistance Rs is expressed with the following exponential function:
R s ( T ) = k 1 e k 2 ( T 273.15 ) + k 3 ,
where k1 = 34 mΩ, k2 = −0.0719 1/°C, and k3 = 0.167 mΩ.

3.2. Thermal Resistance Characterization of the Single Cell

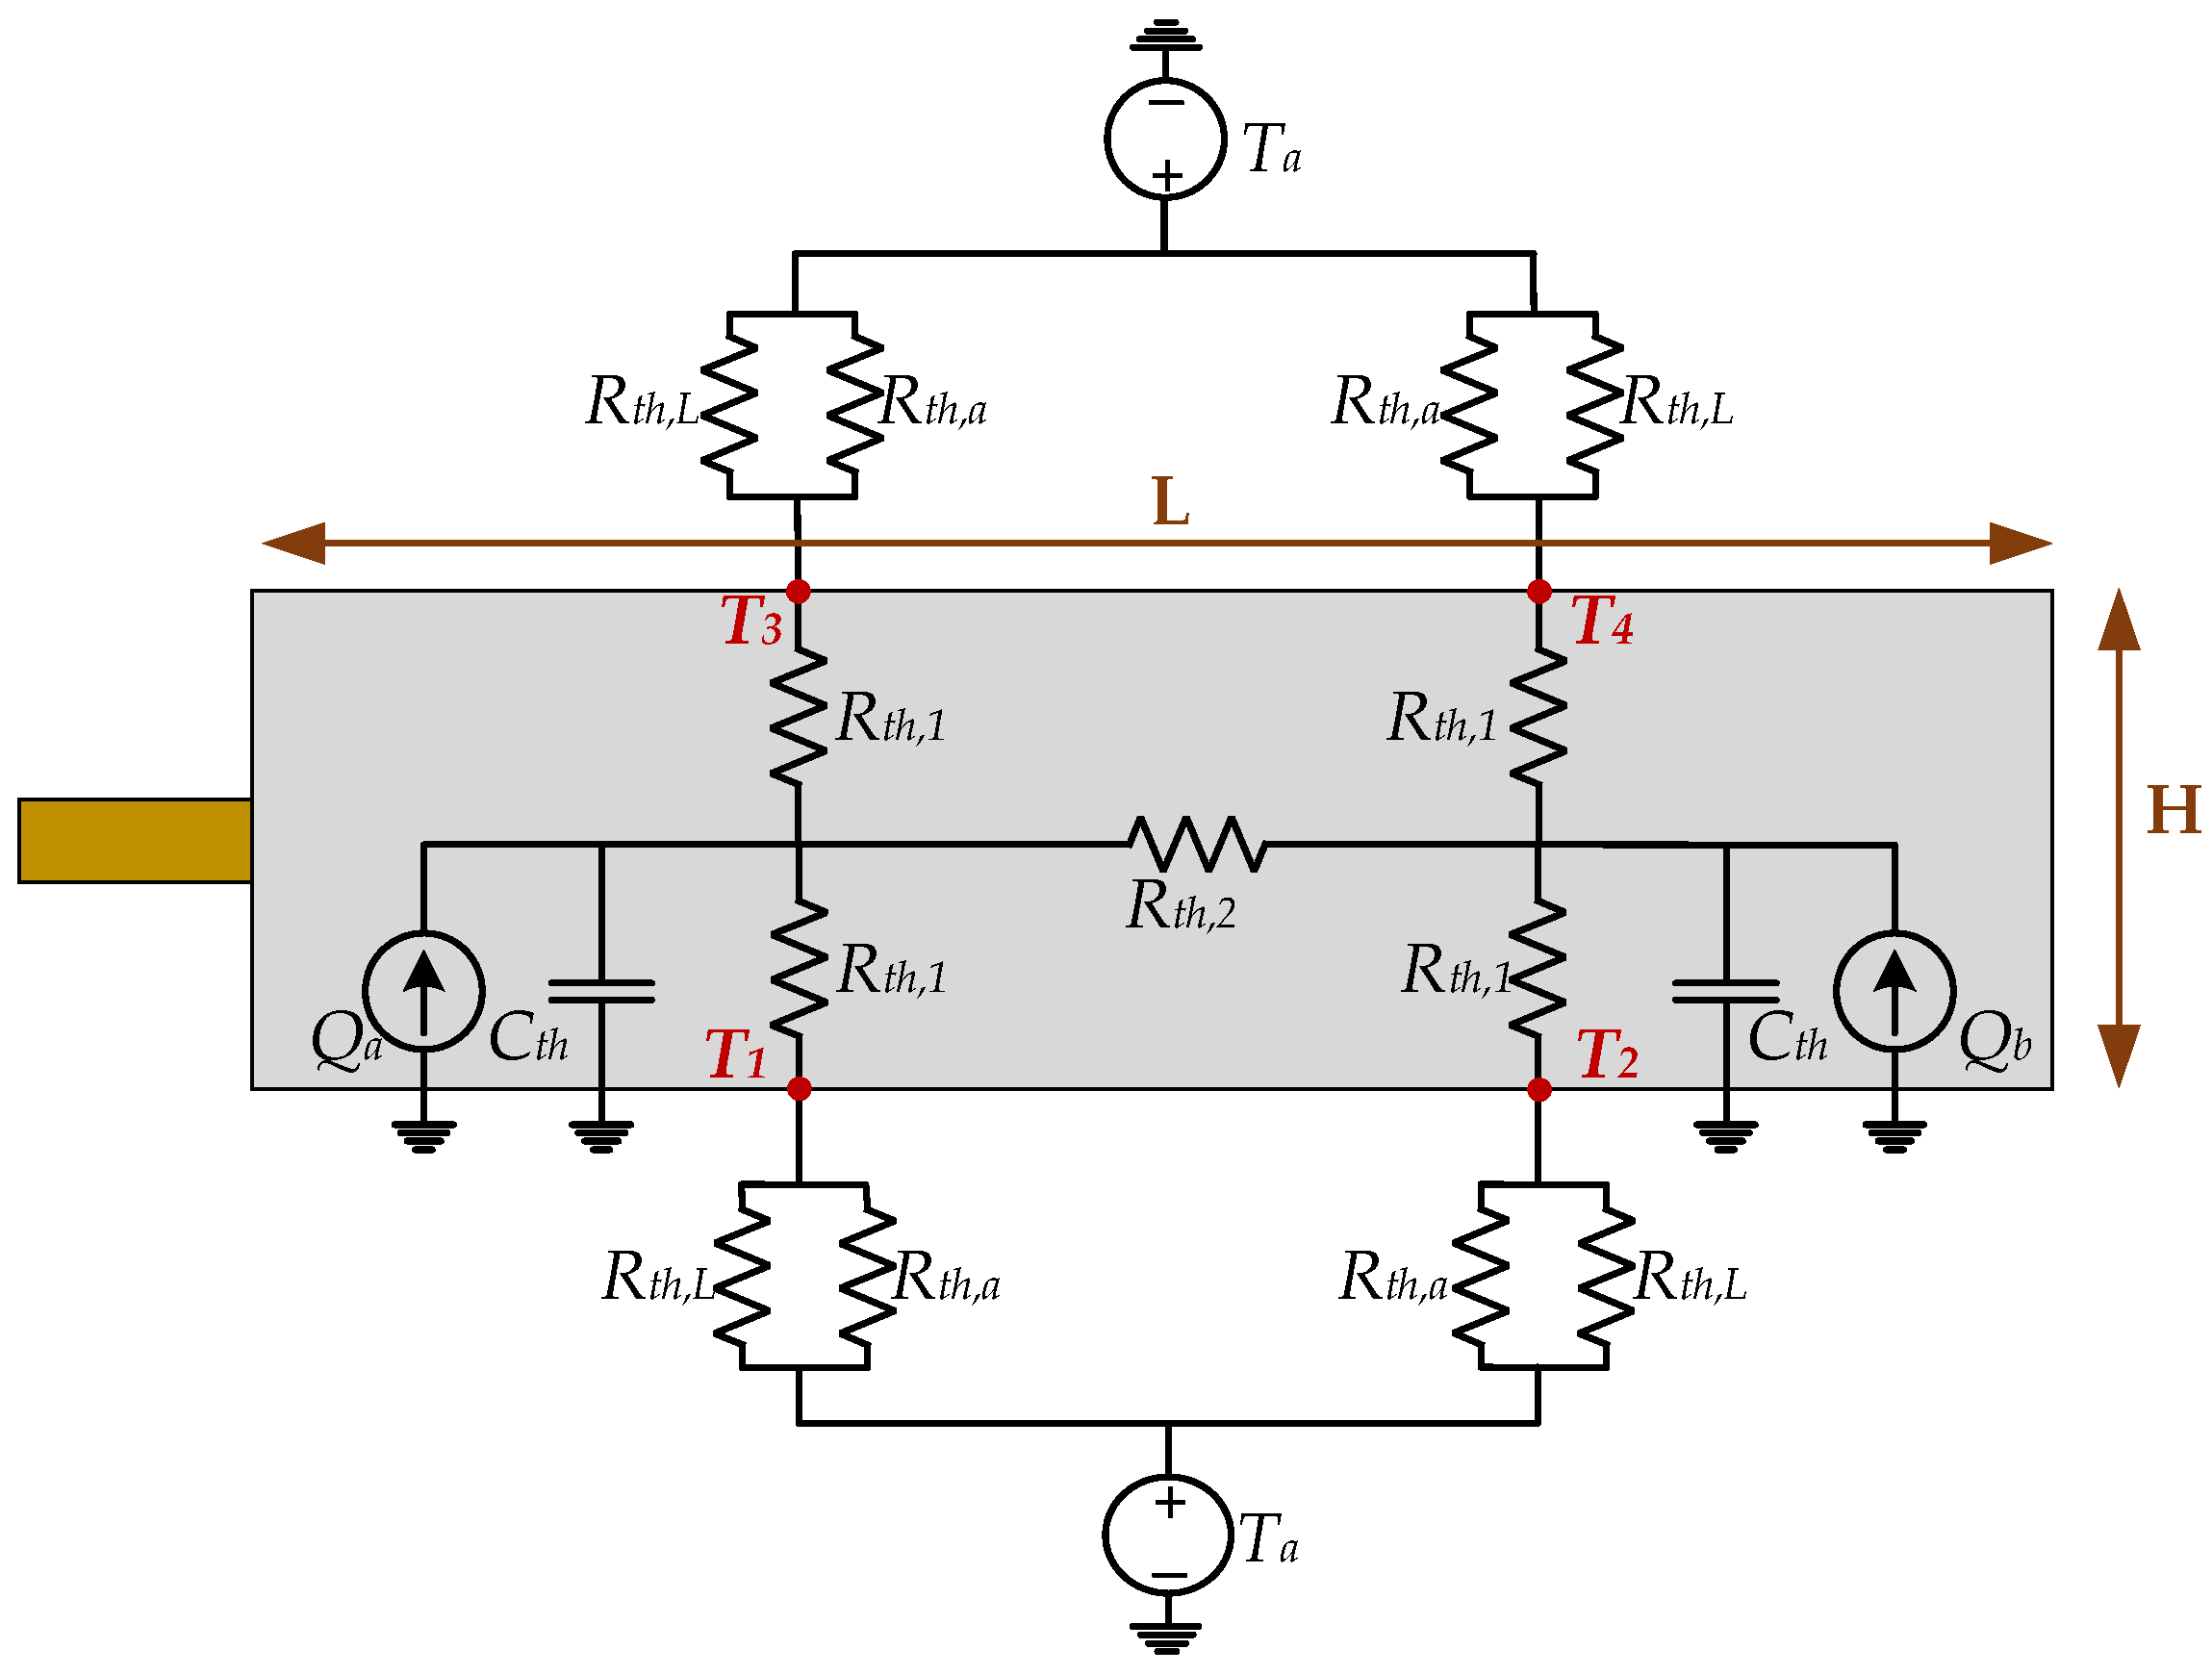
For the thermal resistances characterization of the single battery cell and the evaluation of the ambient exchange resistances, the test was performed by injecting a current of 20 A (2C) in the battery cell, until the thermal steady-state was reached. To avoid the battery being fully charged before the thermal steady-state was reached, charging and discharging cycles of five minutes at constant current rates were performed. The temperature was measured in four different points of the battery cell, T1, T2, T3, and T4 as indicated in Figure 3. It is worth noting that the cell was horizontally positioned, and T1 and T2 were measured below the cell, while T3 and T4 above. T1 and T3 were closer to the current collectors. The ambient temperature (
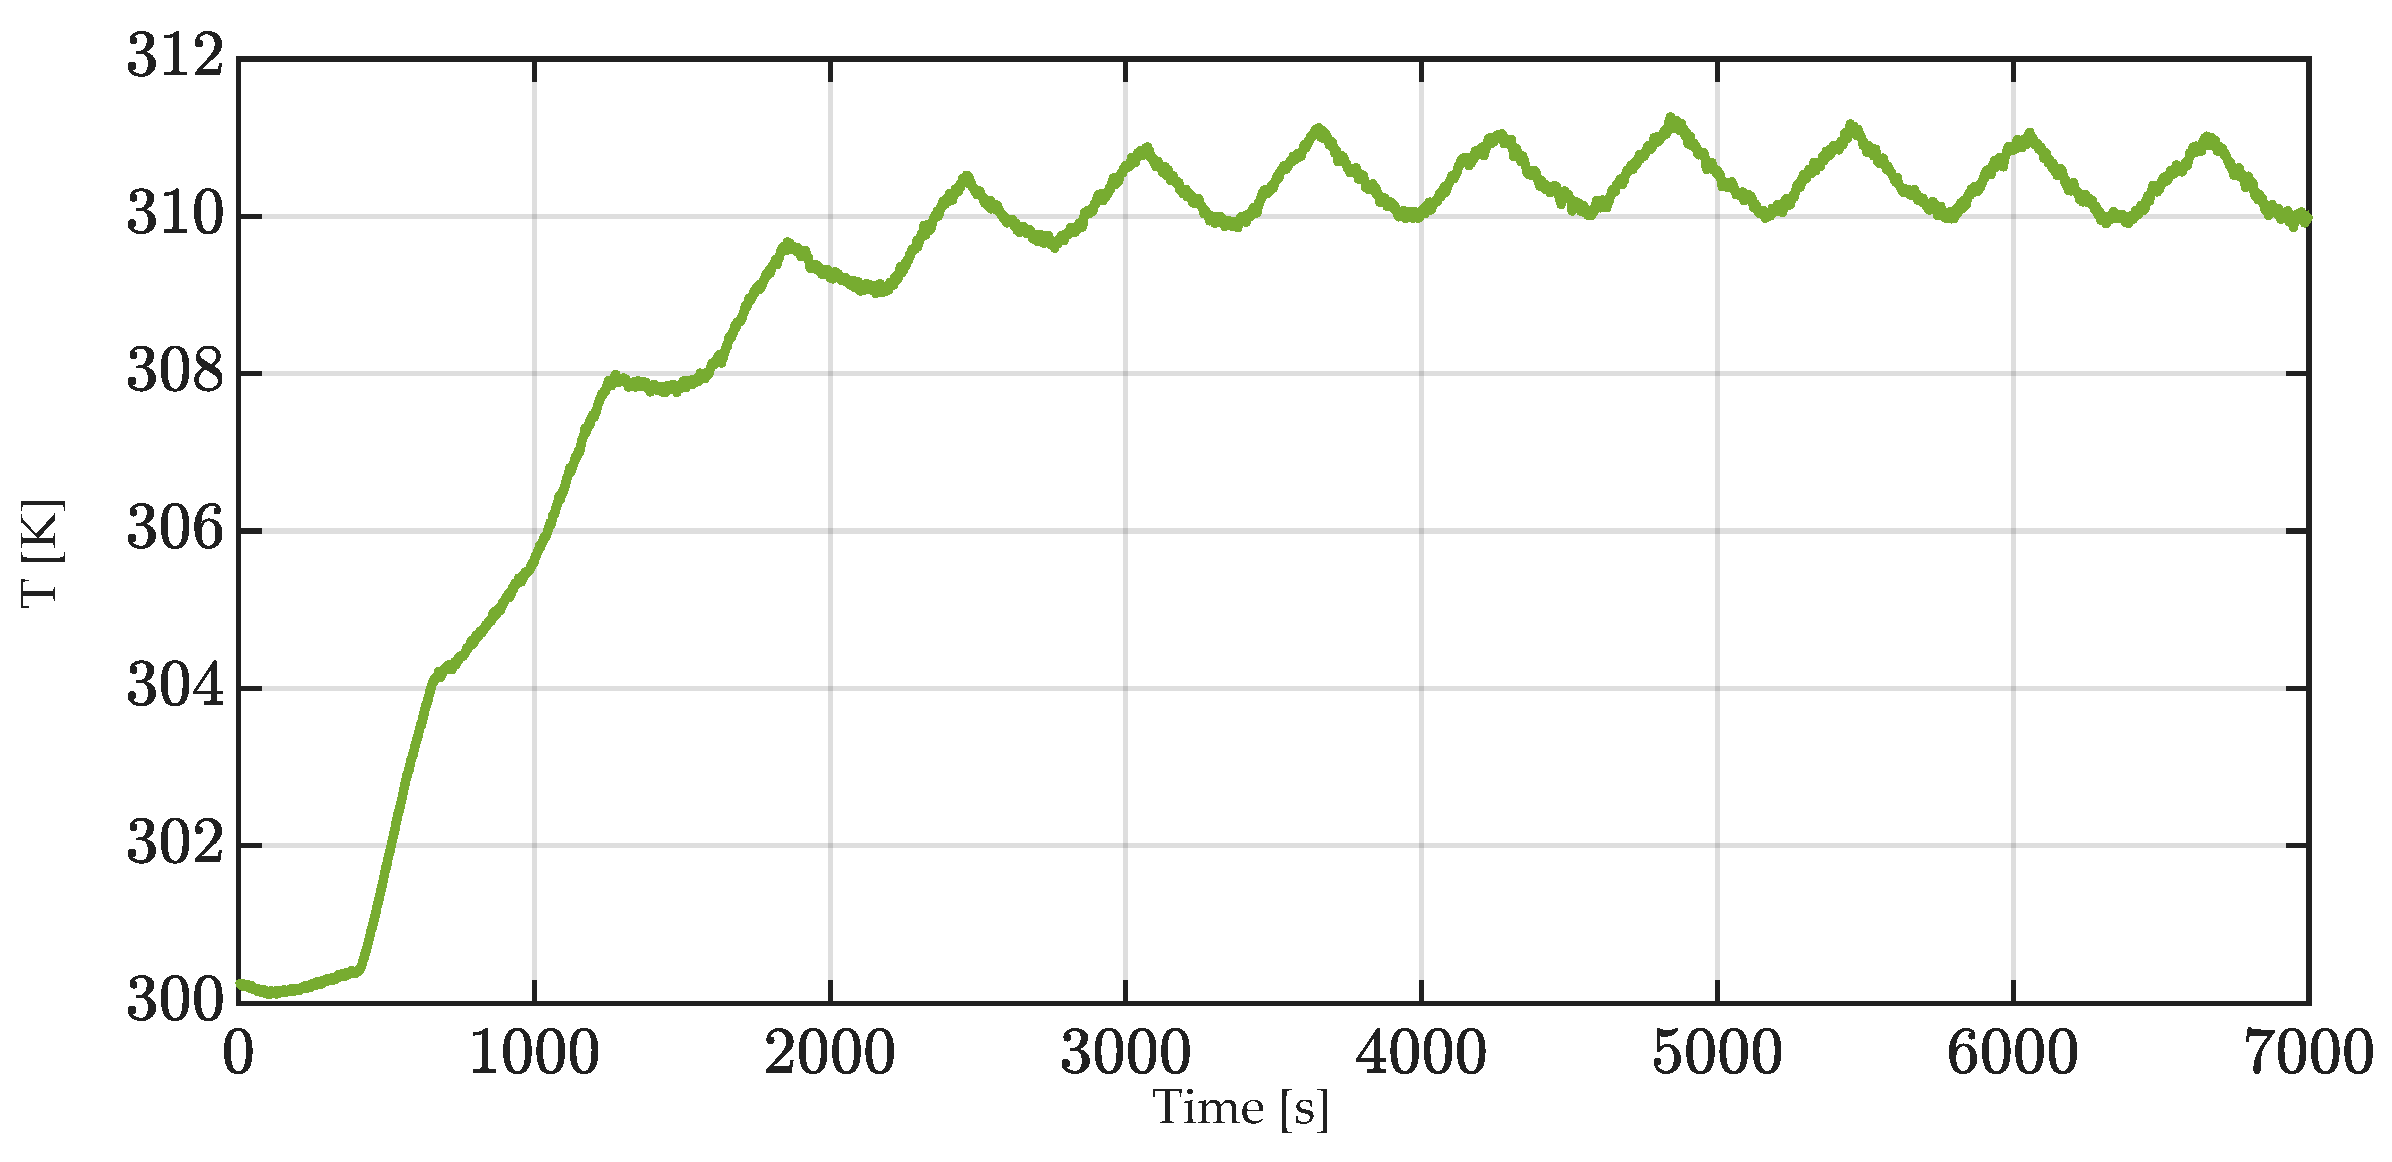
Ta) was also acquired. The trend of the measured temperature (T3) is depicted in Figure 7. The ripple in the temperature is due to the reversible heat flux component. During the charging phase, the chemical reaction taking place in the battery is endothermic, while during the discharge phase, an exothermic reaction takes place. By applying a mobile-window average zero-phase filter, the temperature ripple was eliminated obtaining the steady-state values listed in Table 3.
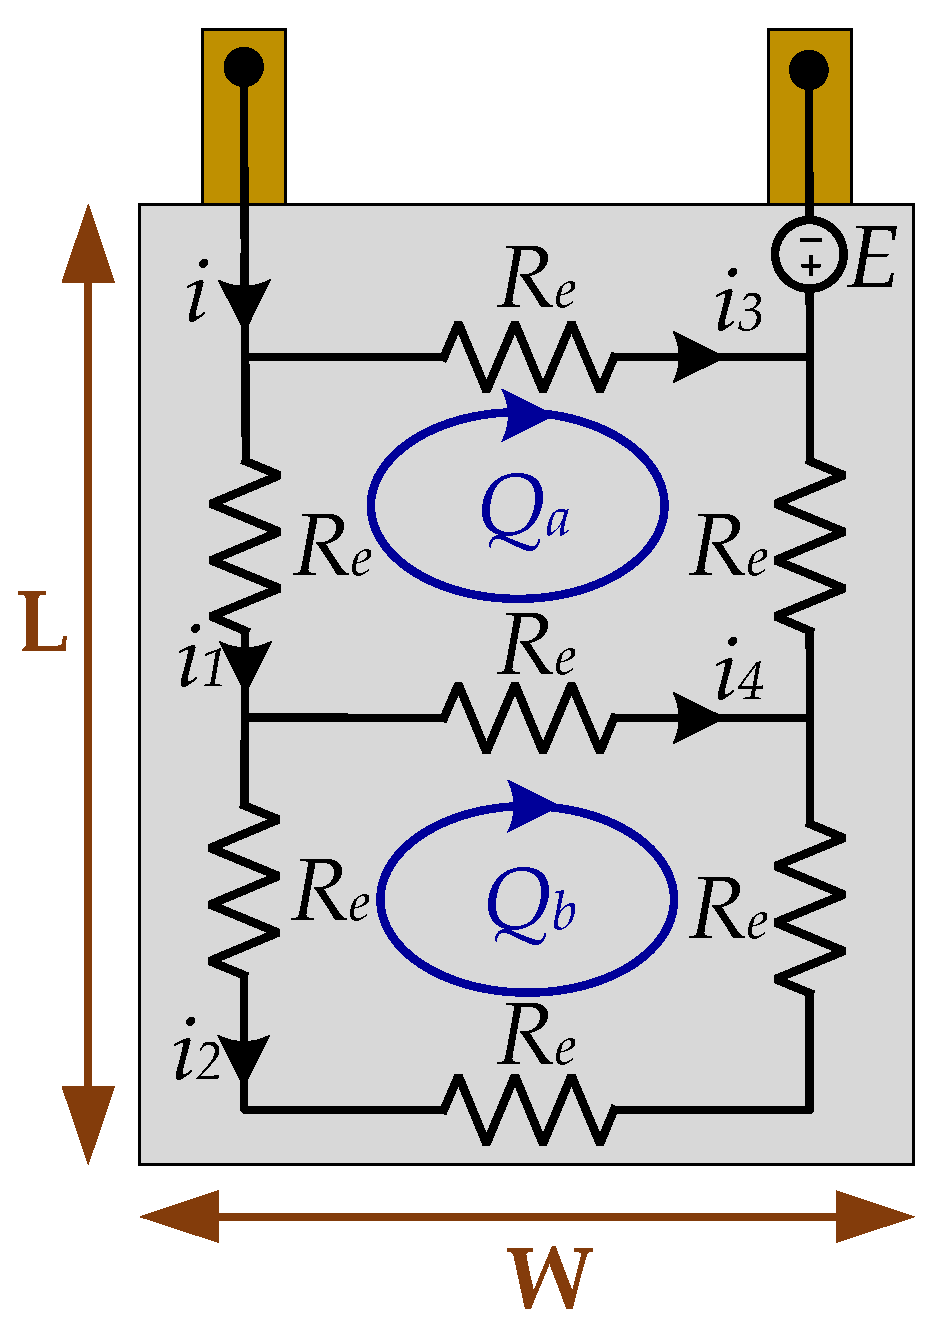
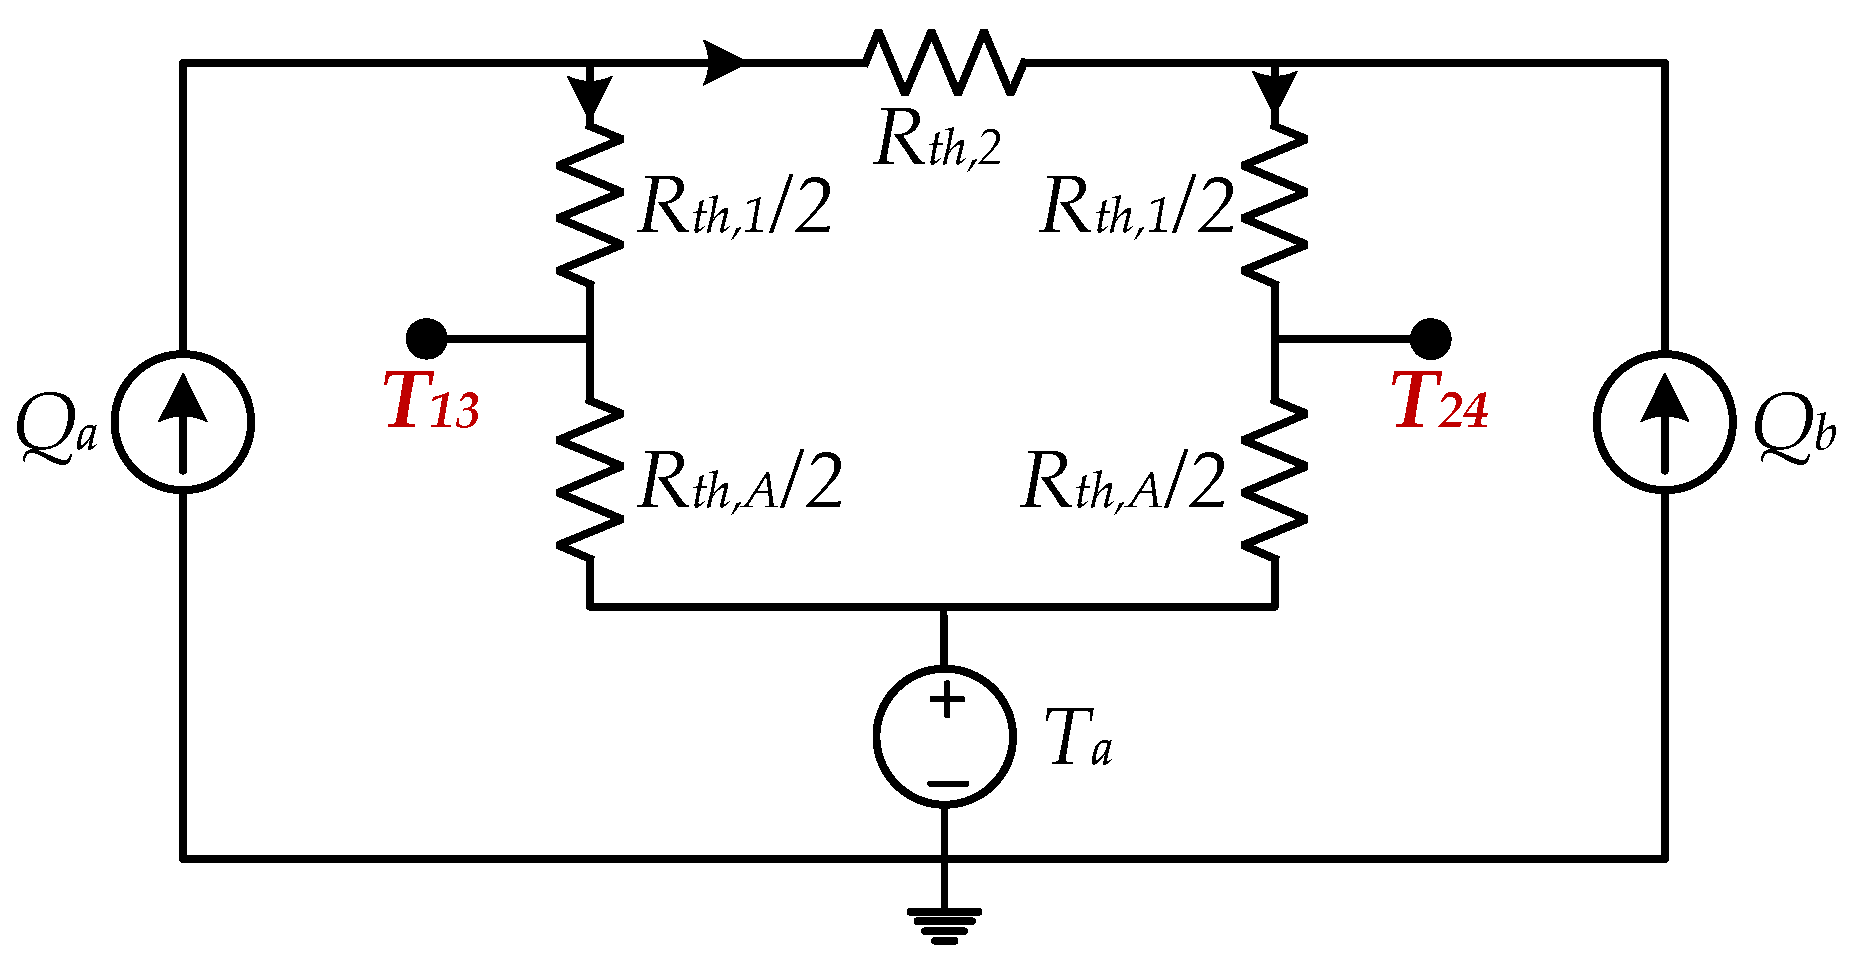
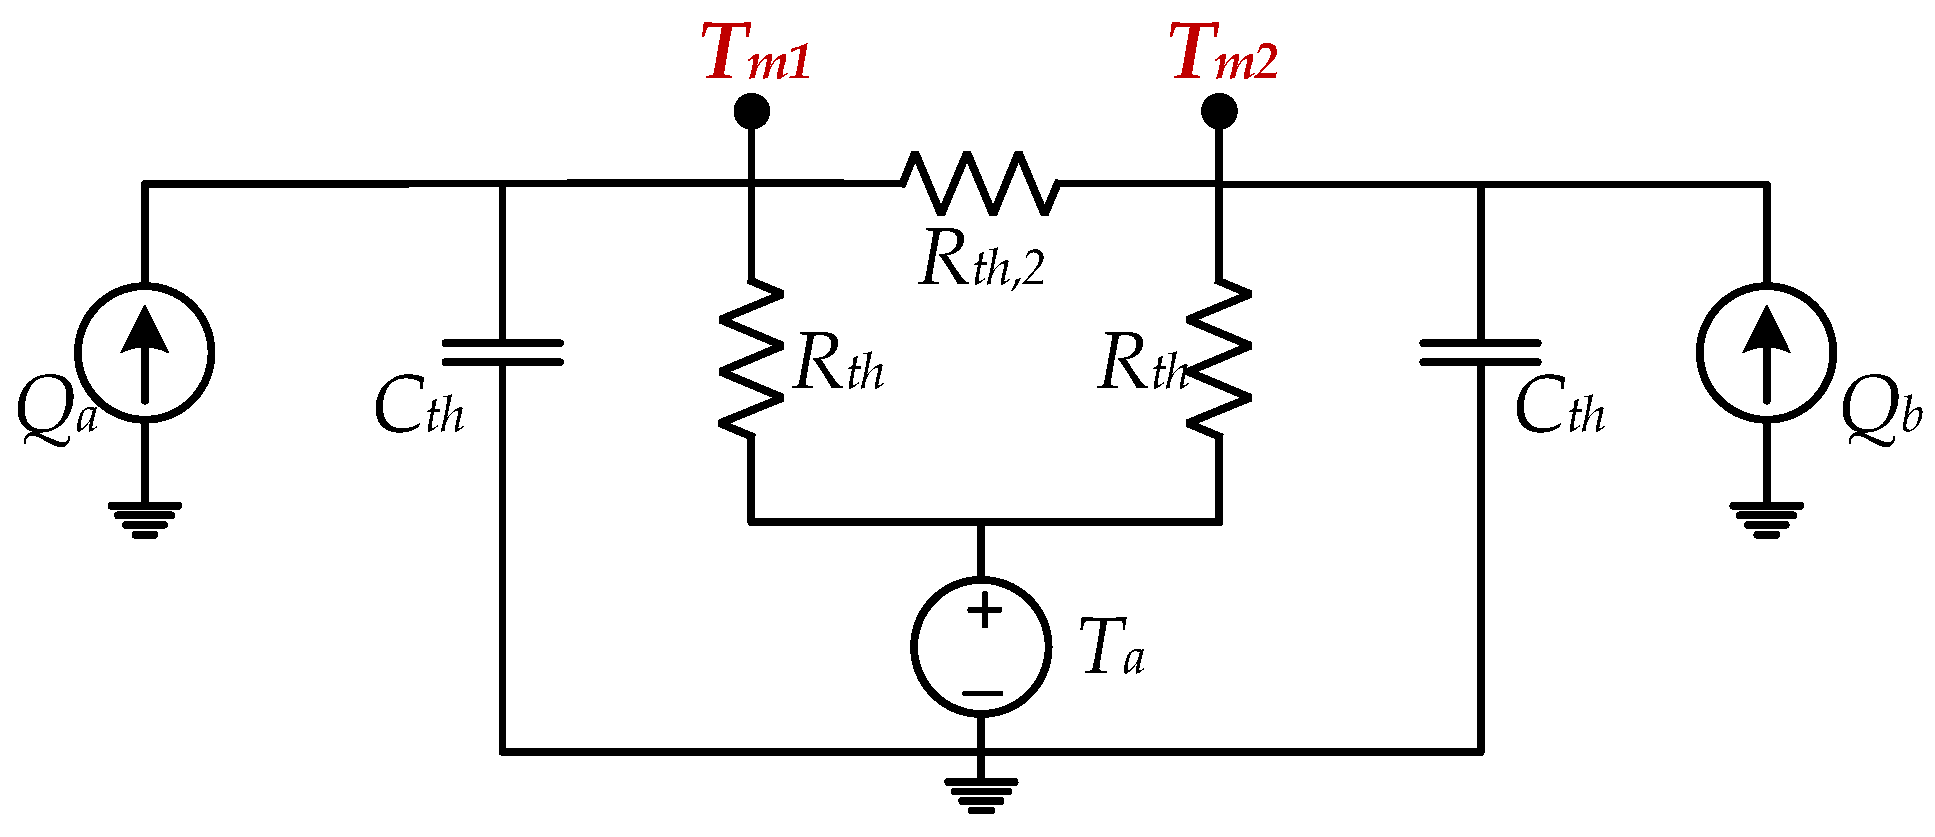
To calculate the thermal resistances, the system is considered at steady state. Therefore, the circuit in Figure 3 was simplified as reported in Figure 8, where Rth,A is the parallel between Rth,a and Rth,L, and T13 and T24 are defined as stated above. By solving this circuit, all the thermal resistances were retrieved. Their values are listed in 
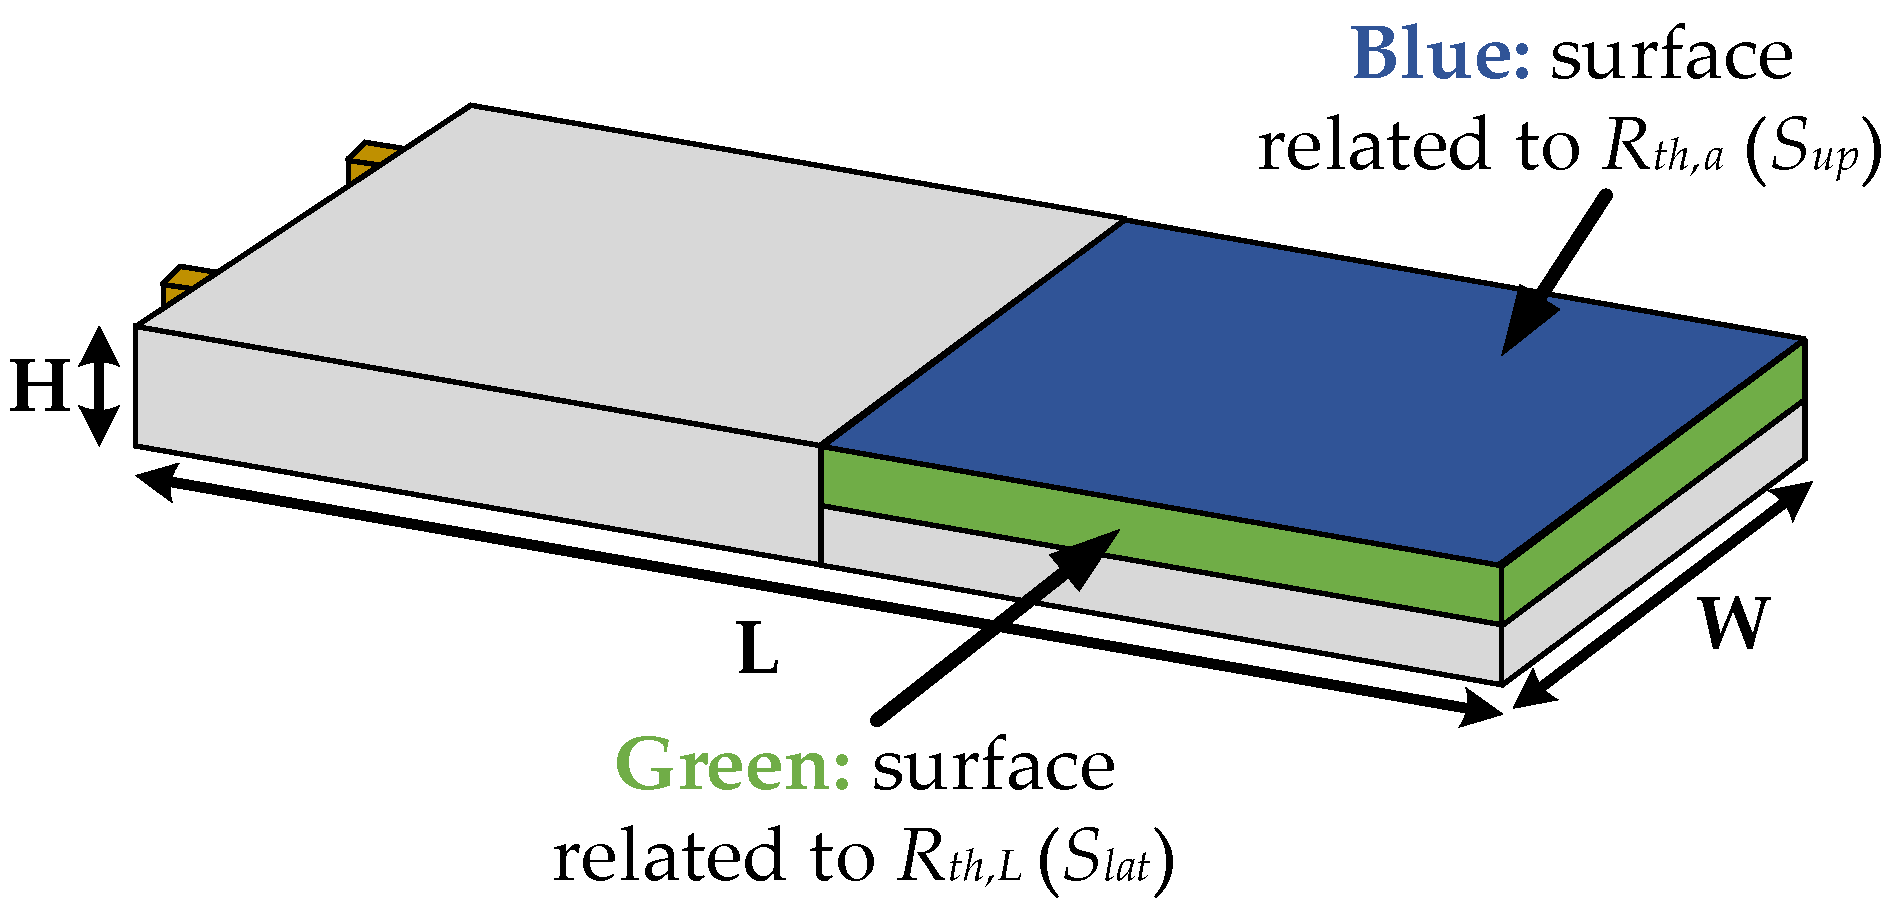
Table 4. According to the expressions (2) and (3), the values of Rth,a and Rth,L are obtained for a convection heat transfer coefficient h = 6.76 W/m2K, which is in the range indicated in [20] for free air. Theoretically, the value of h for upper and lower surfaces should be different. However, the surface of the battery is very small, and the calculation of h cannot be carried out using the empirical formulae [21], because it is outside of the validity range. For this reason, the value was considered as reported above.

3.3. Thermal Capacitance Characterization of the Single Cell

After estimating the thermal resistances, the calculation of the thermal capacity Cth was performed. In this test, the single battery cell was subjected to five minutes of charge/discharge cycles of 10 A (1C) until the thermal steady state was reached. Figure 9 shows the simplified thermal circuit where Rth was calculated as follows:
R t h = R t h , 1 2 + R t h , A 2 .
The circuit in Figure 9 is a second-order system. The eigenvalues λ1 and λ2 of the system are:
{ λ 1 = 1 C t h R t h λ 2 = 2 R t h + R t h , 2 C t h R t h R t h , 2 .
The general solution for the second order system is:
T ( t ) = a e λ 1 t + b e λ 2 t + c ,
where a, b and c depend on both the initial conditions and the values of the inputs; however, they are not of interest. The eigenvalue λ1 is associated with the self-dynamic of the capacitors. In fact, if the two heat sources were equal, there would not be heat flux through thermal resistance Rth,2. So, the equivalent circuit degenerates into two equal first-order circuits where the time constant is equal to 1/λ1. On the other hand, λ2 is associated with the mutual dynamic among the two capacitors, i.e., the influence of one capacitor on the other one and vice versa. Since the cell is almost uniformly heated in this test, this kind of mutual dynamics is not so visible. Hence, only λ1 is used for estimating
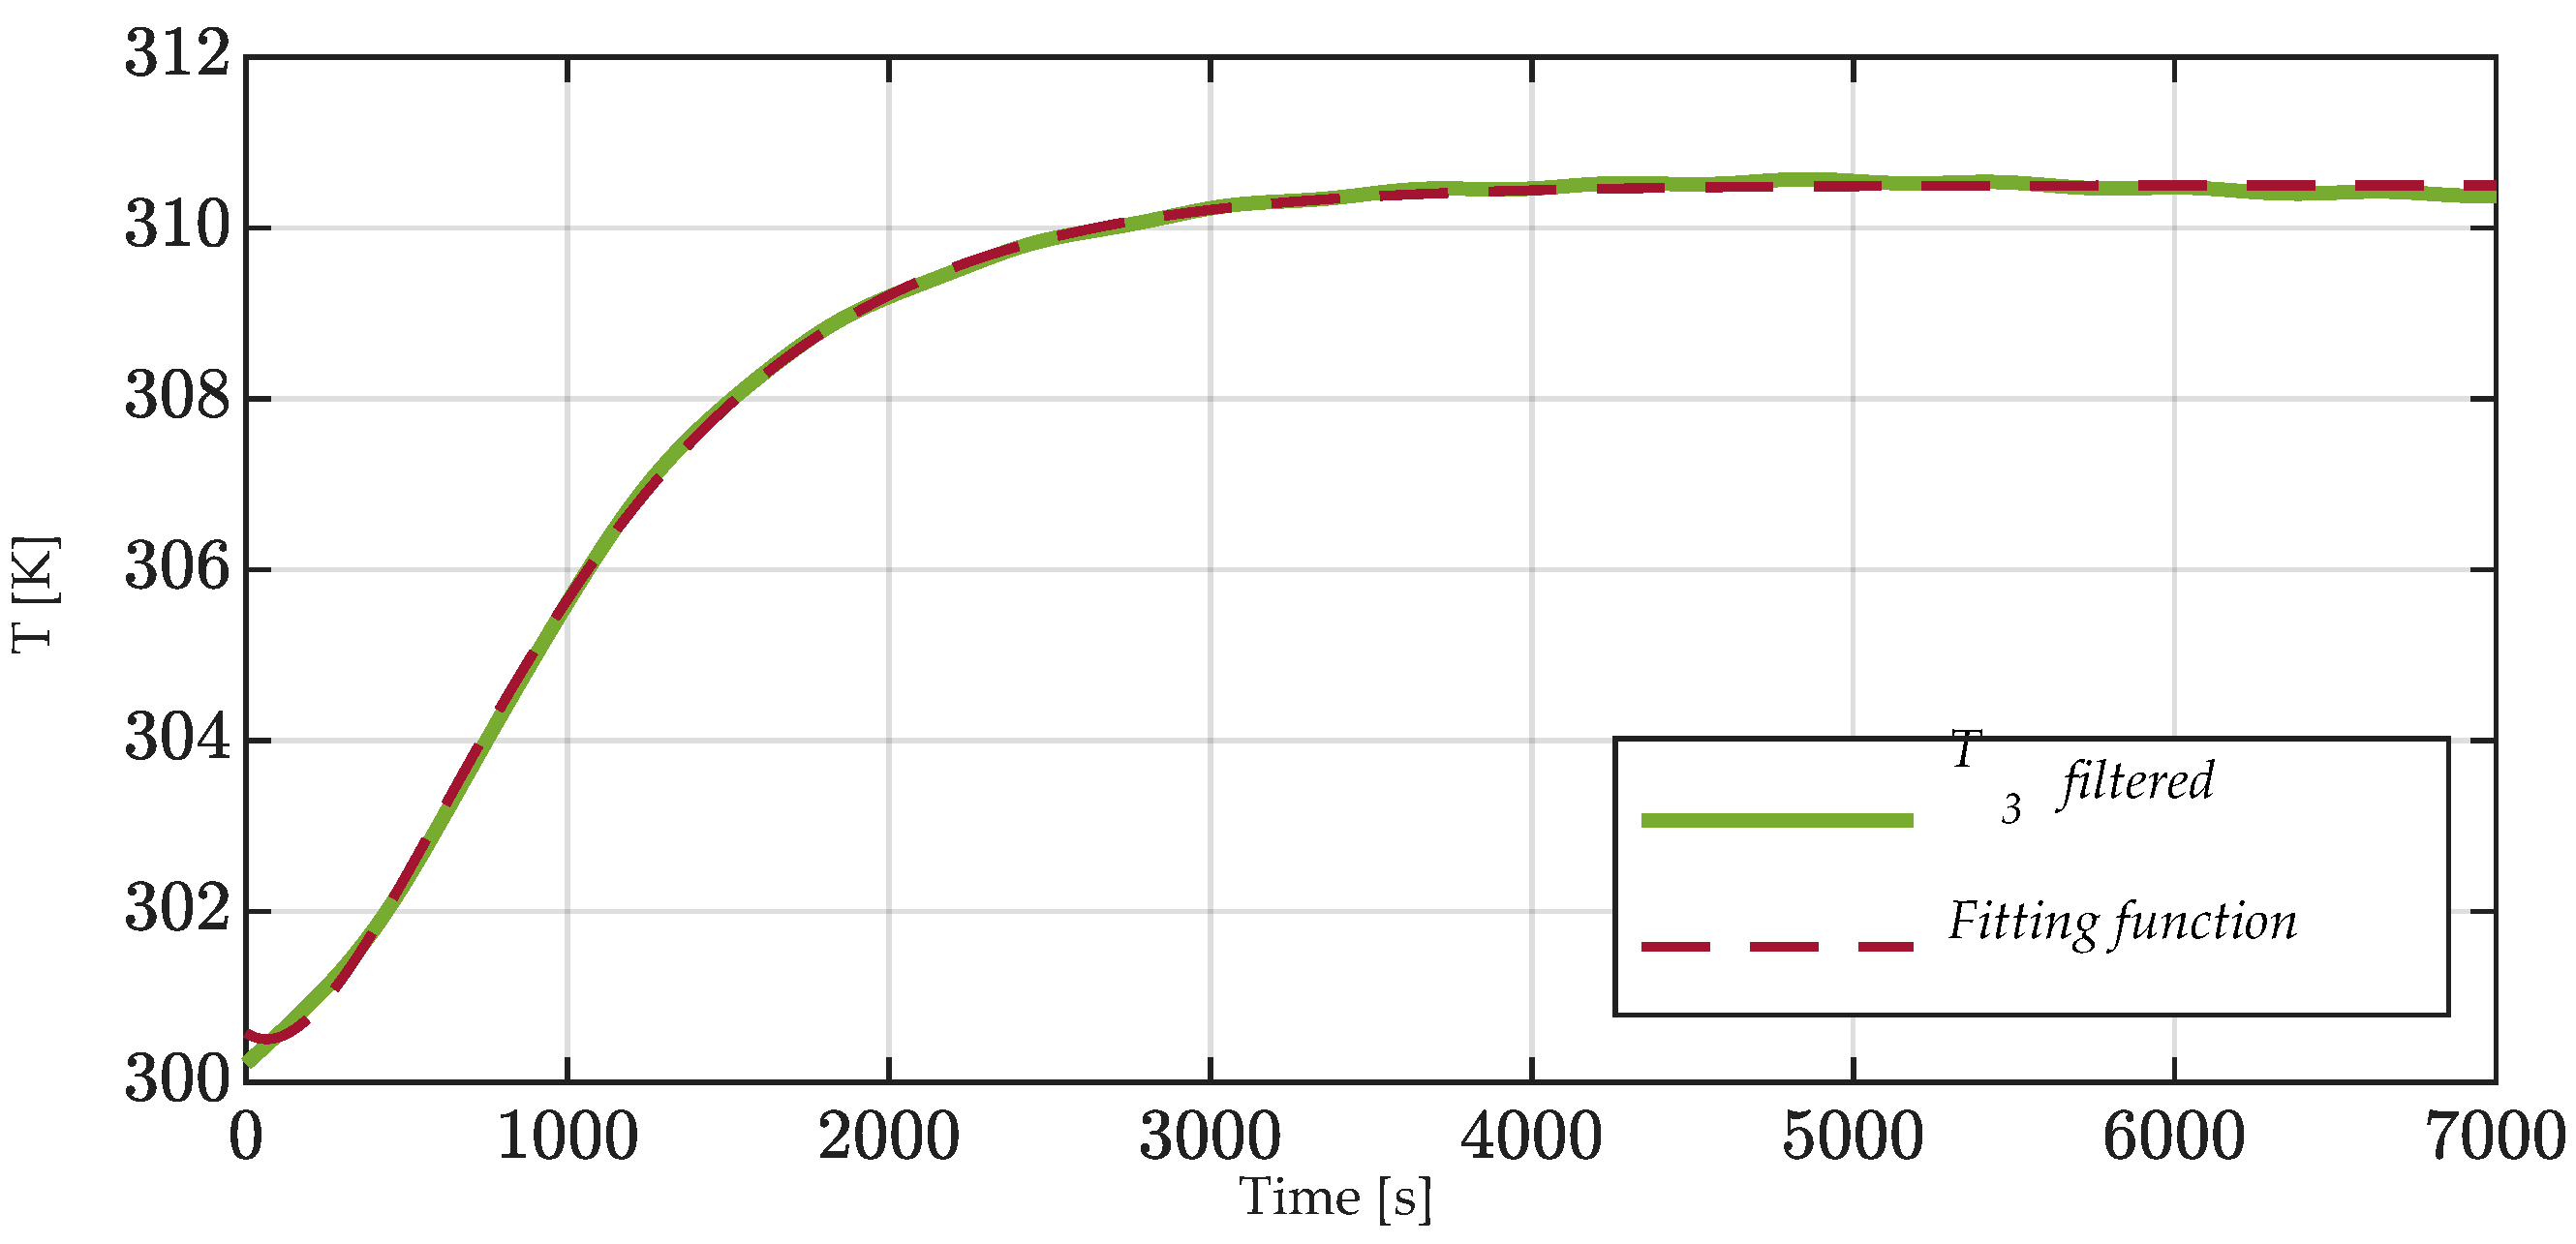
 Cth.
Finally, by fitting (9) on the filtered temperature T3, the value of the evaluable eigenvalue is λ1 = −0.0009 s−1. The filtered temperature and the fitting function are shown in Figure 10. The value of Cth is retrieved and reported in Table 4.

3.4. Entropy Change Characterization of the Single Cell

As explained in [2], it is possible to estimate the entropy coefficient (i.e., the term ∂E/∂Ts in (5)) as a function of the SOC. By looking at the shape of oscillations in Figure 7, it is possible to estimate the function:
E T s = k 4 ( k 5 S O C ) 2 .
The parameters k4 and k5 are k4 = 0.00035 V/K and k5 = 0.12 respectively. The SOC in (10) is expressed in per unit.

3.5. Thermal Resistance Characterization of the Battery Pack

The value of the contact thermal resistance between two battery cells Rth,c was investigated in a similar way. A three-cell battery pack was excited with a current of 45 A with charging/discharging cycles of five minutes until the thermal steady-state was reached. The steady-state values are listed in Table 5. Considering the circuit at steady state, the only unknown quantity is Rth,c. Therefore, by adopting a trial-and-error procedure, Rth,c was found, and its value is reported in Table 4.

4. Results and Validation

The tuning procedure was completed using the tests of the single cell and of the three cells pack. Indeed, the single cell allows us to determine all the internal parameters of the single cell and the parameters of the heat exchange with the air. Additionally, the test with the three cells pack allows us to determine the thermal conduction resistance of the contact between two adjacent cells in a pack. To extend the model to an n-cells pack (with n > 3), no other parameters are necessary. For this reason, the model was tested on a ten cells pack to highlight the robustness of the proposed model when the number of cells is different from 3 (for which the tuning was done). To validate the proposed model, different currents were tested. In the following, at first the results of the tests on a single cell and on a three cells battery pack are reported. These tests are the ones used to tune the parameters and, therefore, they cannot be considered a real validation of the model. For this reason, an additional test was performed on a ten cells battery pack, demonstrating the very good performance of the model in representing a general battery pack composed of any number of cells.

4.1. Single Cell

The single cell used for the parameter identification was cycled, in addition to 20 A, also at 10 A and 15 A. For all tests, the error of the simulation is under 1.5 K. The error is calculated as follows:
e r r o r = T s i m u l a t e d T m e a s u r e d .
Figure 11 reports the results for the test performed at 10 A, while in Figure 12 the errors are shown. Figure 13 and Figure 14 show the results and the error of the test performed at 15 A, while in Figure 15 and Figure 16 the results and the error of the test performed at 20 A are depicted.

4.2. Three Cells Battery Pack

The three cells battery pack was tested with a current of 30 A (1C), 45 A (1.5C), and 60 A (2C). The pack is horizontally positioned, and the cells are one over the other. Results and the errors of the 30 A test are reported in Figure 17 and Figure 18, respectively. In Figure 19, Figure 20, Figure 21 and Figure 22 the results and the errors of the test at 45 A and 60 A are depicted. All the simulations give an error below 2.5 K. The worst result is shown for T4 in the case of 60 A, this is due to a partial disconnection of the thermocouple during the test. Around 5500 s the thermocouple was reconnected and the error decreases.

4.3. Ten Cells Battery Pack

The ten cells battery pack was cycled with a current of 70 A (0.7C) and the results are shown in Figure 23. The model underestimates the temperatures of the lower cell and overestimates the temperature of the highest one. This is because the model is symmetrical and does not consider the difference between the upper and the lower ambient exchange resistances. However, the model gives results very close to the experimental ones and the error is below 2 K (Figure 24).
As stated in Section 1, the aim of the proposed model is to estimate the temperature of the inner cells. Therefore, the validated model was used to simulate the battery pack under a current of 200 A (2C). Figure 25 shows the temperature (T1) of the cells at the thermal steady state (after 150 min). The temperature distribution is symmetrical with respect to the central cell of the battery pack. The external cells exchange heat with the environment (i.e., the air) and are, therefore, colder. On the contrary, most inner cells, being the furthest away from the heat exchange, are the hottest ones. This happens in all the battery packs that are not provided with internal pipelines for cooling. It is worth noting that most inner cells age faster, due to the higher temperature, and this reduces the lifetime and the performance of the battery pack. The knowledge of this overtemperature, made possible by using this model, is very important for estimating the lifetime of a battery pack. In the tested ten cells battery pack, the inner cells reach a temperature 5 K higher than the external ones. The higher the number of cells in the pack, the higher the temperature difference will be. This highlights the importance of predicting the temperature of the single cells. Indeed, this information could be very useful for limiting the pack performance or for changing its design to have a flatter temperature distribution among the cells.

5. Conclusions

The temperature distribution among the cells of a battery pack is an important problem not completely addressed in the recent literature. Indeed, in a battery pack, the different position of the packed cells implies different heat exchange and, consequently, different temperatures of the cell. The knowledge of the cell temperature is important for the optimal use of the battery pack.
In this paper, an integrated electro-thermal model for a lithium-ion N-cells battery pack was proposed. This model was tuned for an NMC battery pack; however, by following the proposed procedure, it is possible to also tune the model for different kinds of batteries. Indeed, the proposed methodology is not related to the chemistry of the cell, but it only relies on the geometry of the system. For this reason, this method is also applicable to other types of batteries, but only for pouch cells. The proposed model is very simple, adaptable to battery packs with any number of cells and is capable of predicting the temperature distribution among the cells of the battery pack based only on the knowledge of the total current of the pack. It can also be used to predict the current sharing among the cells to calculate the aging of the different cells.
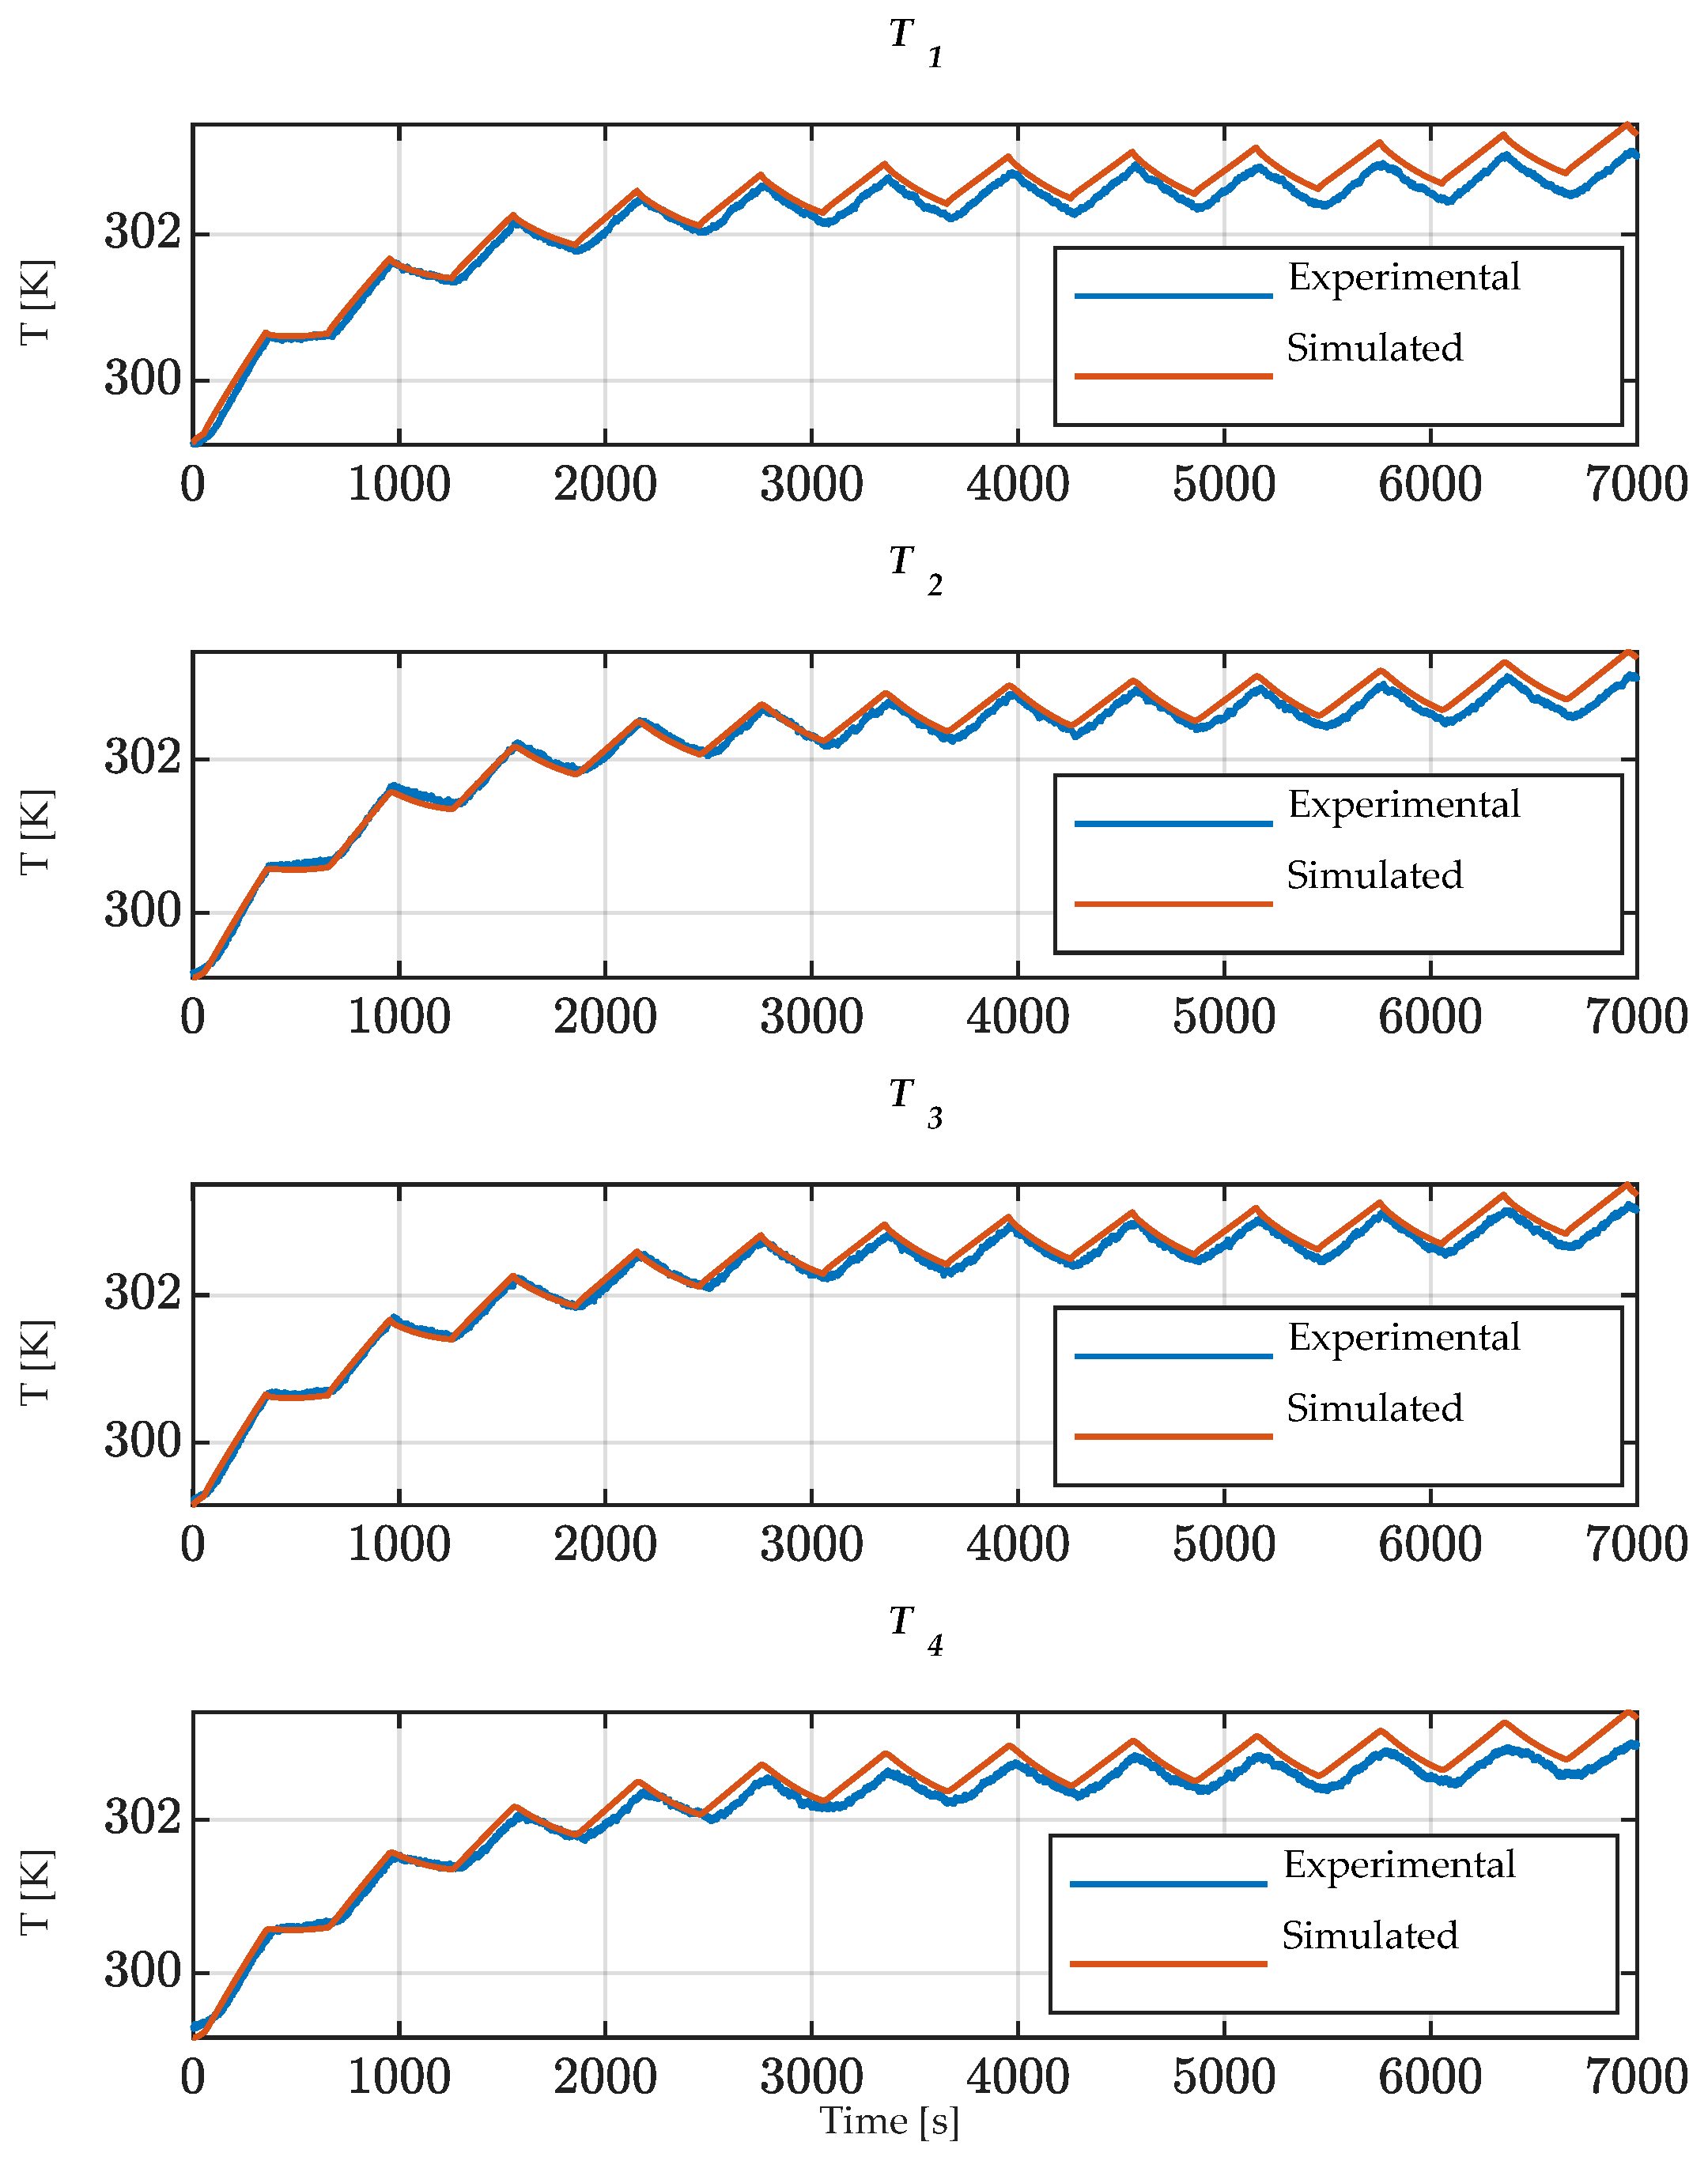
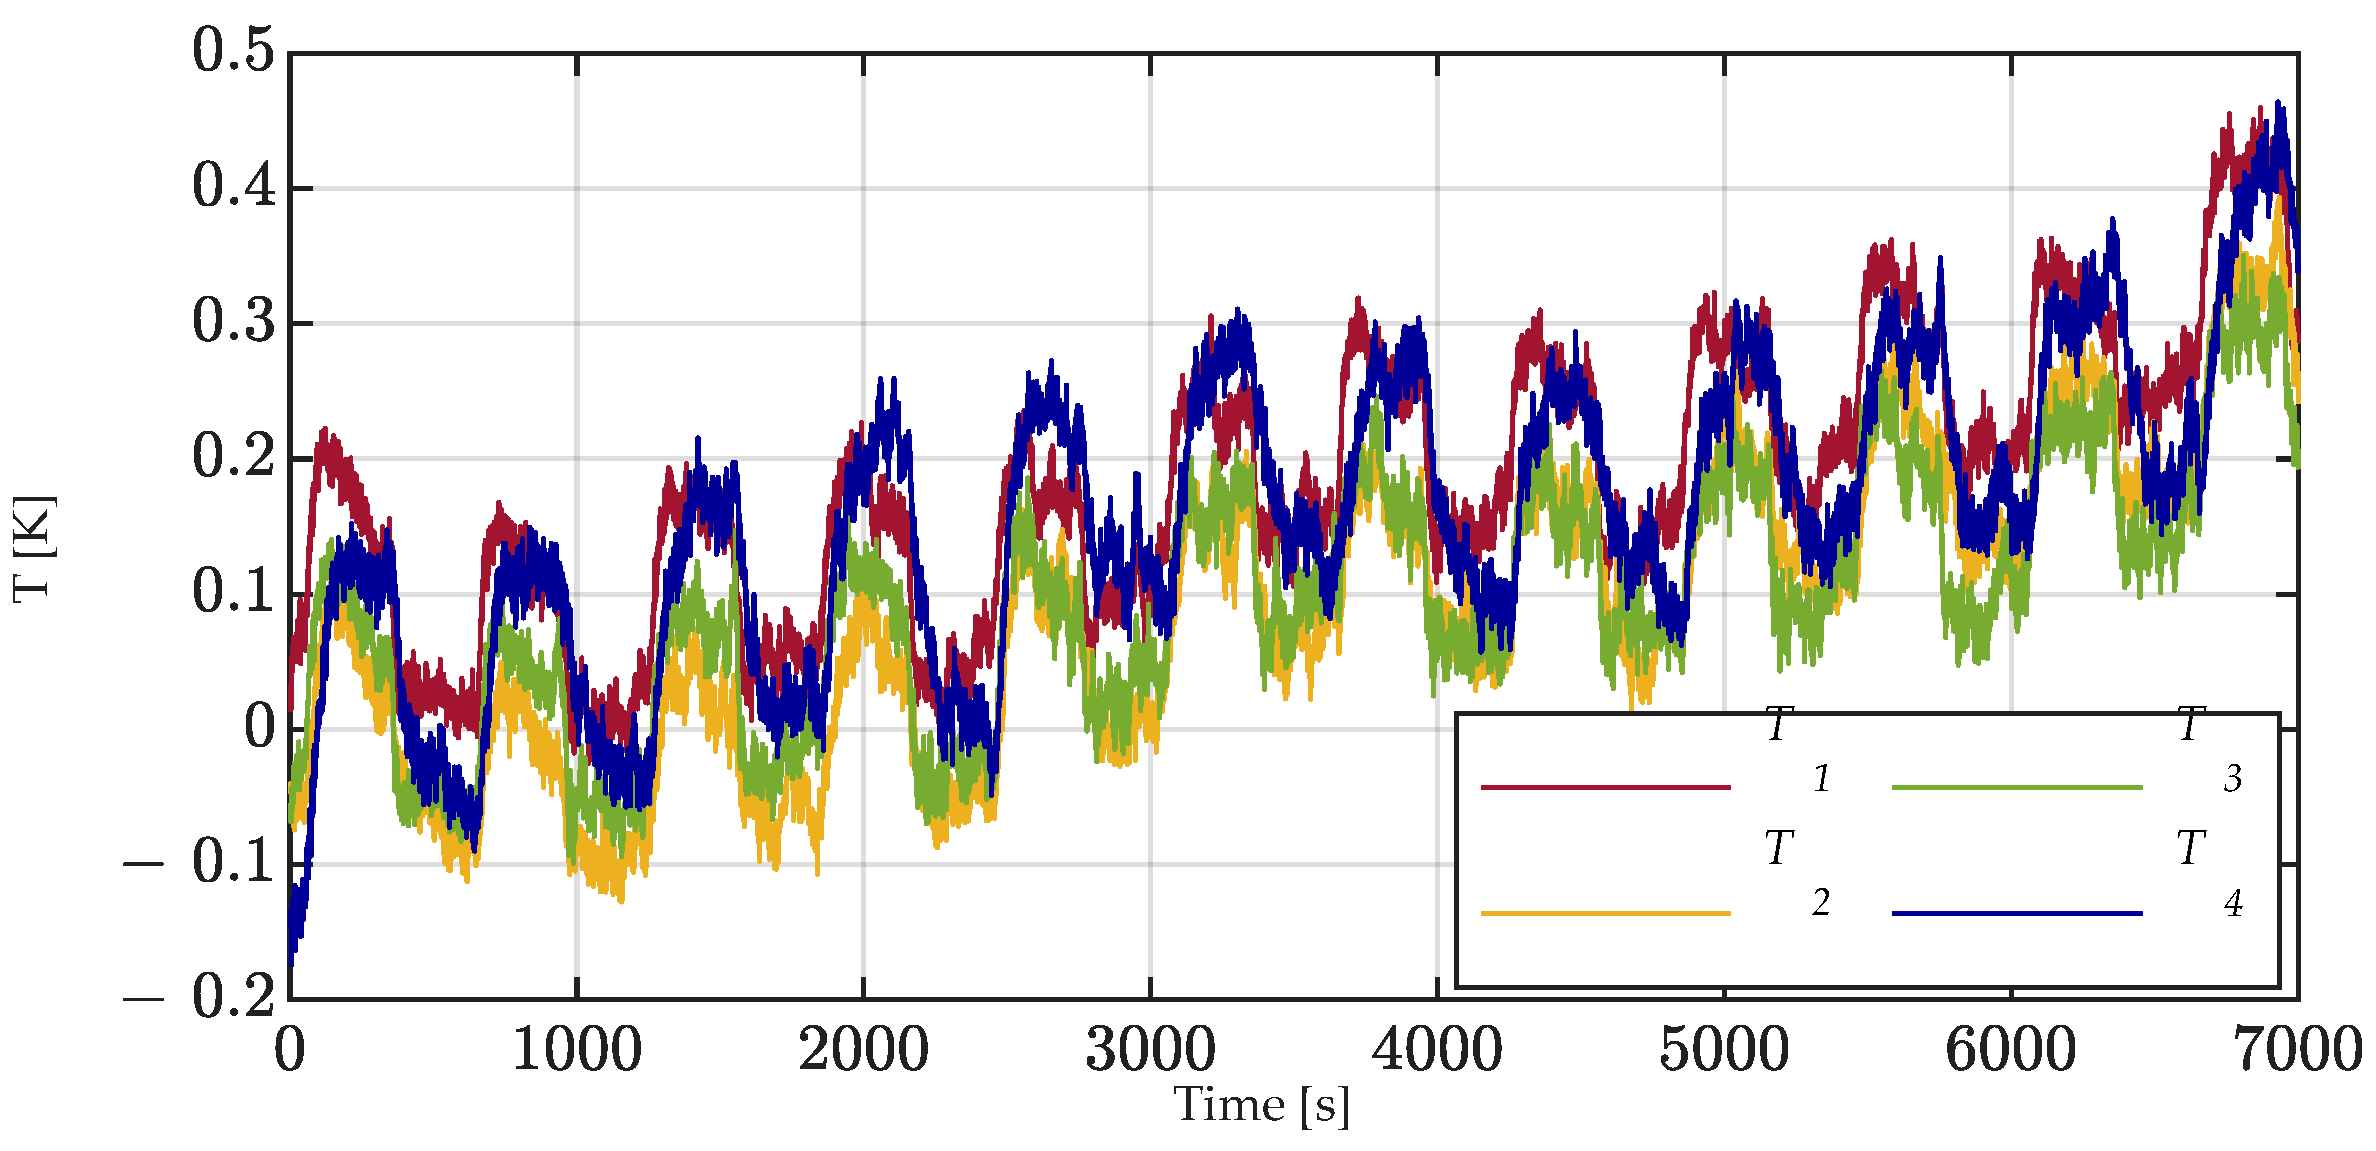
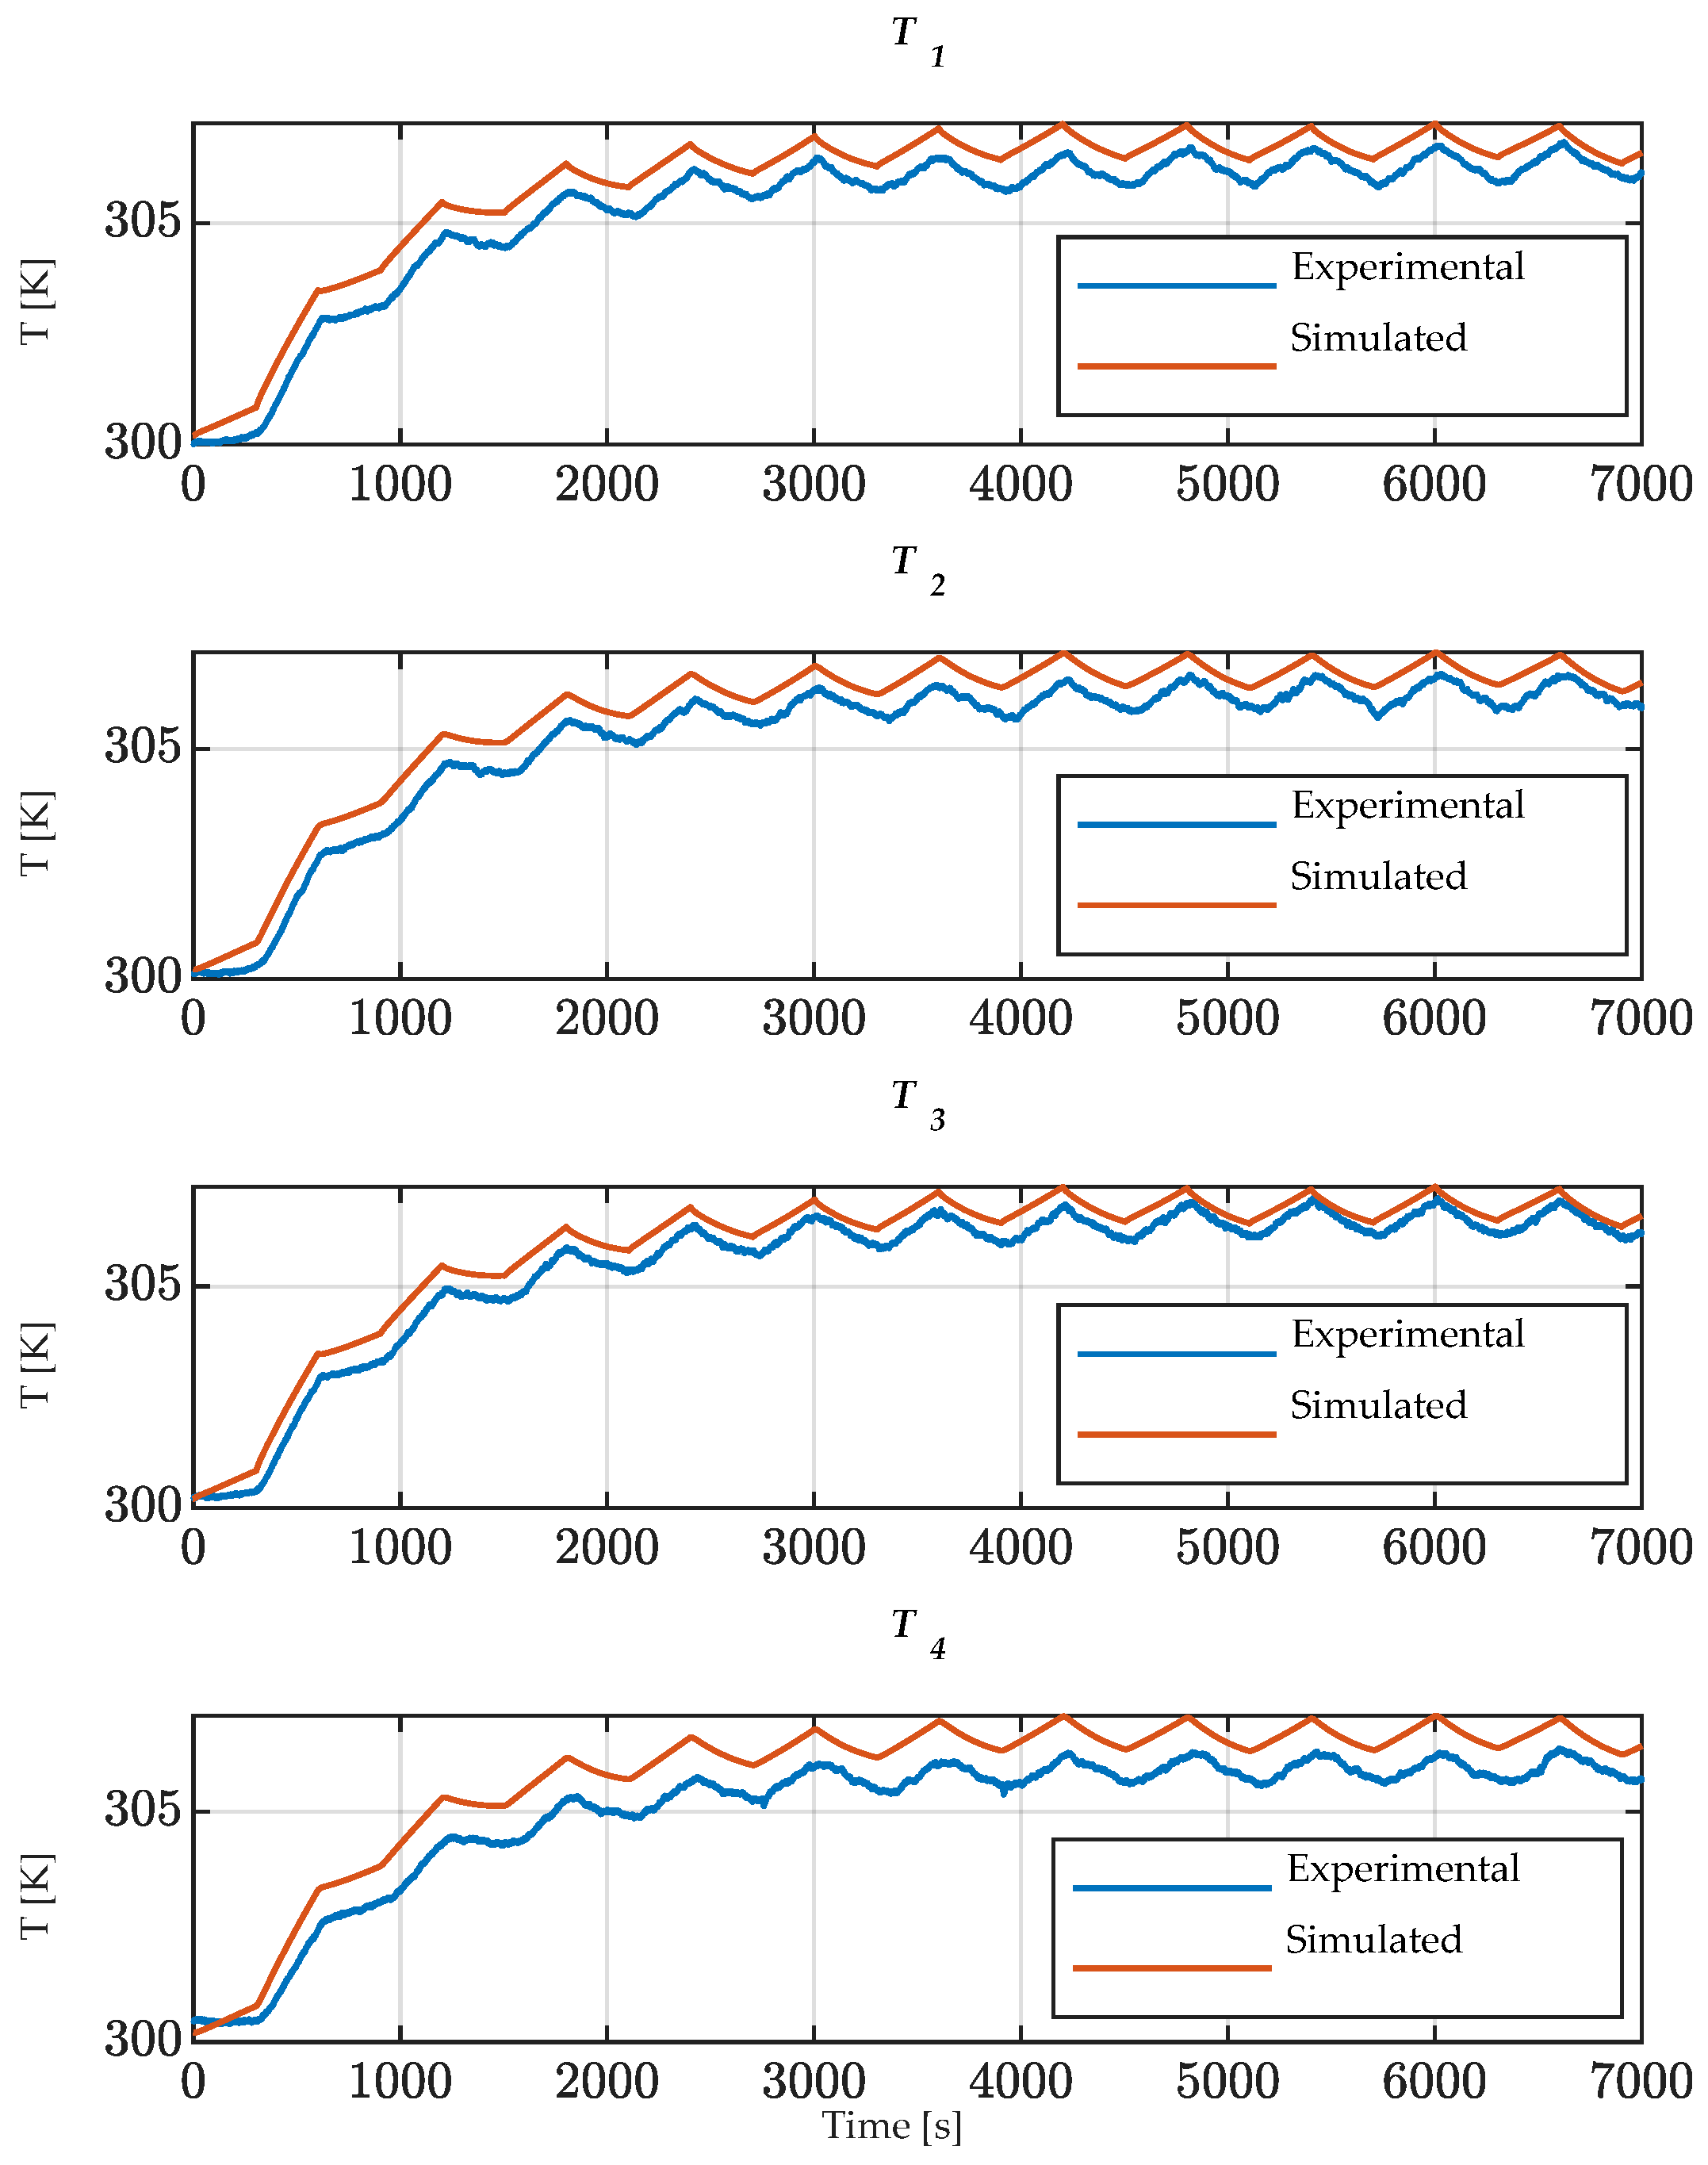
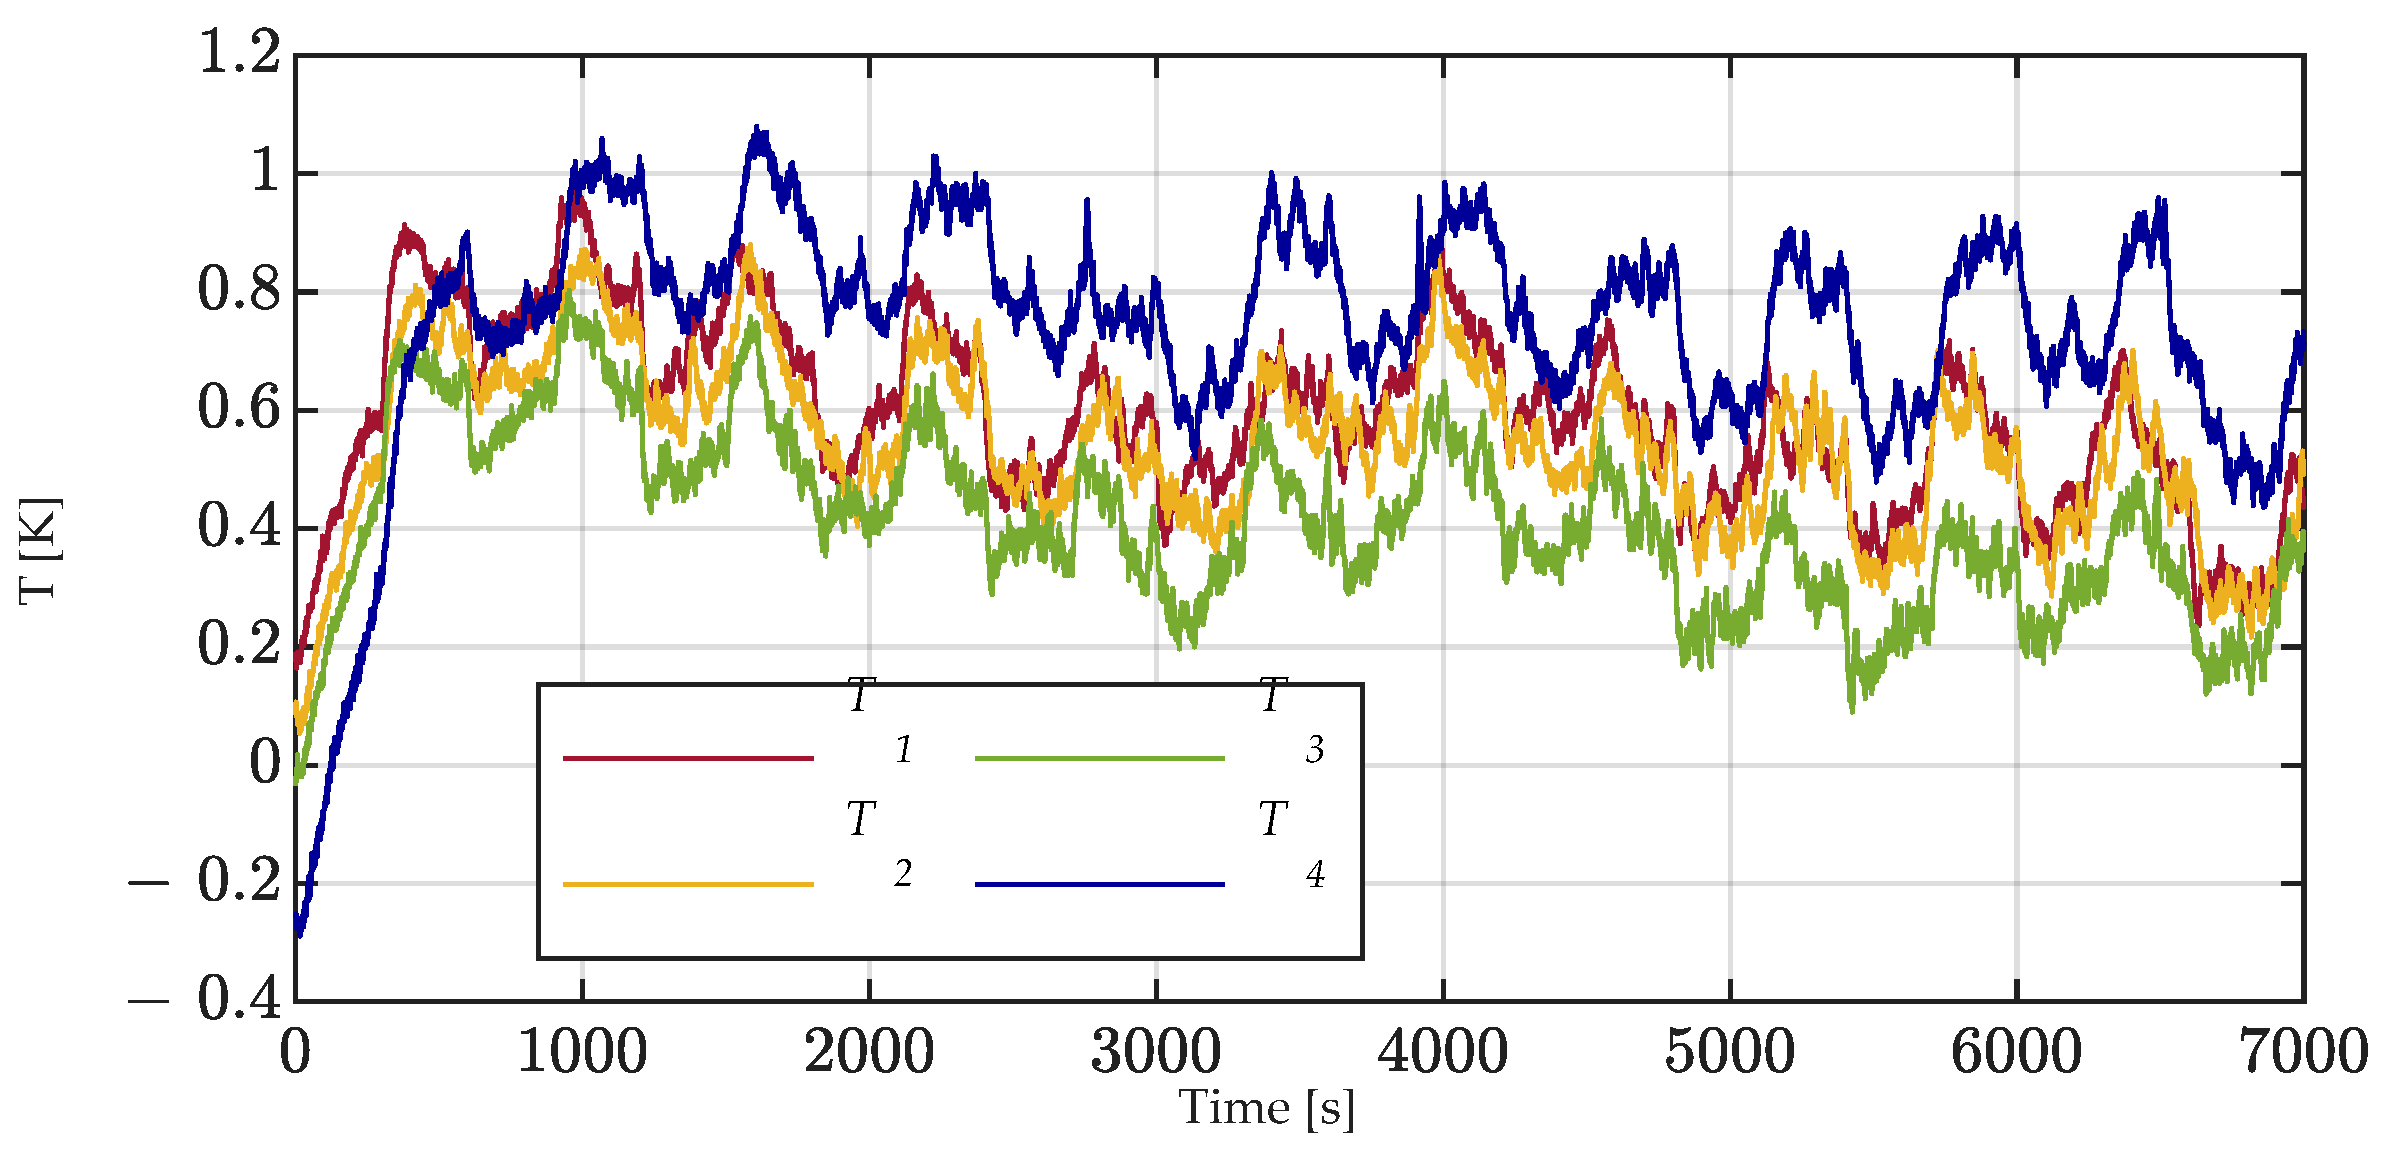
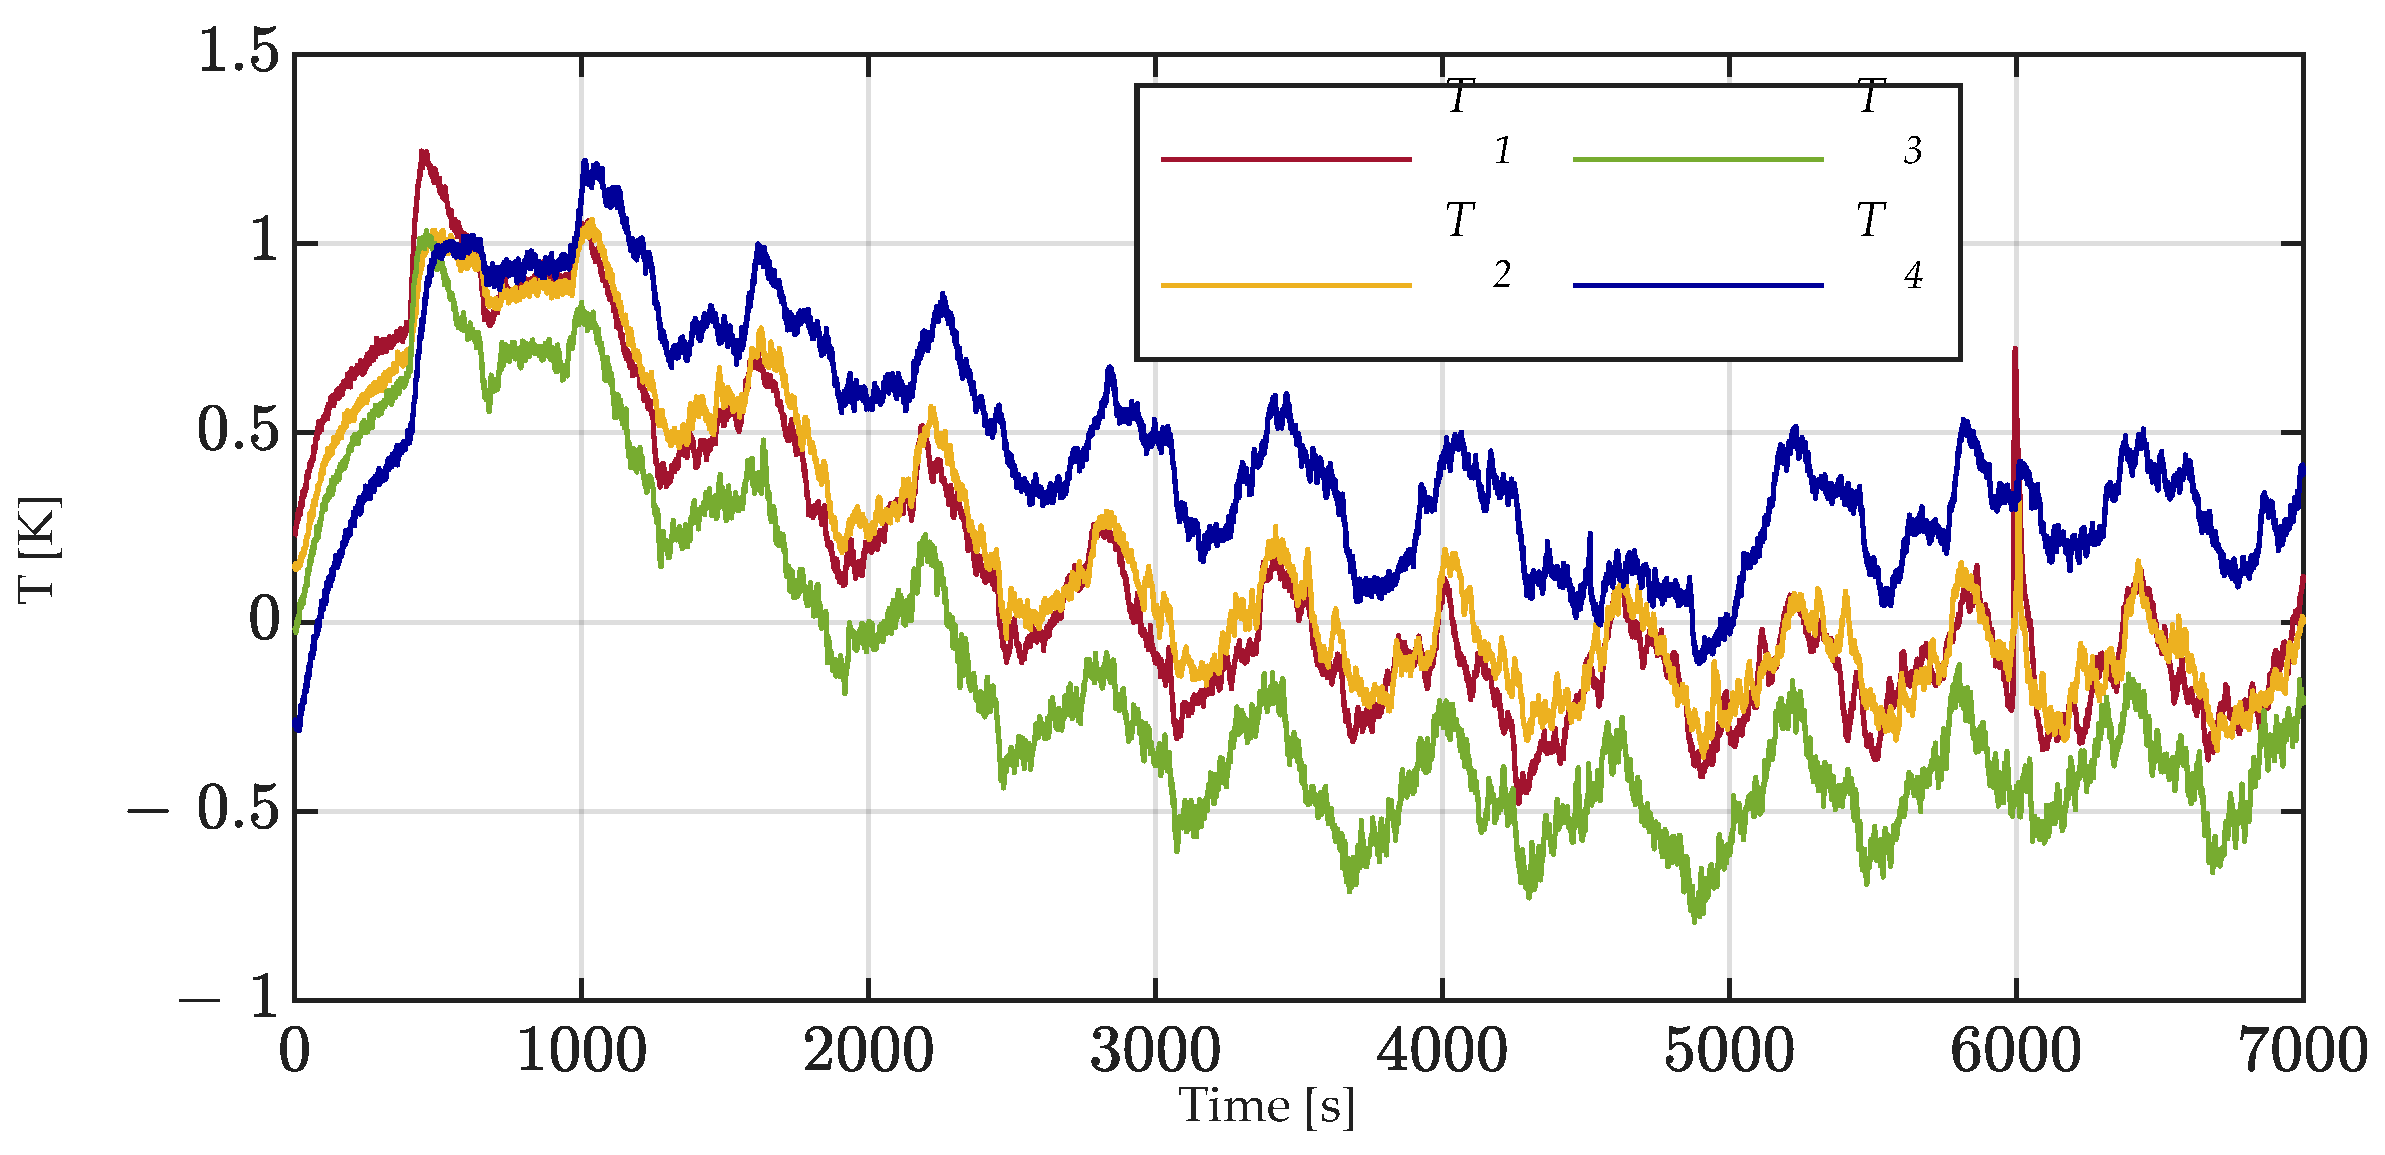
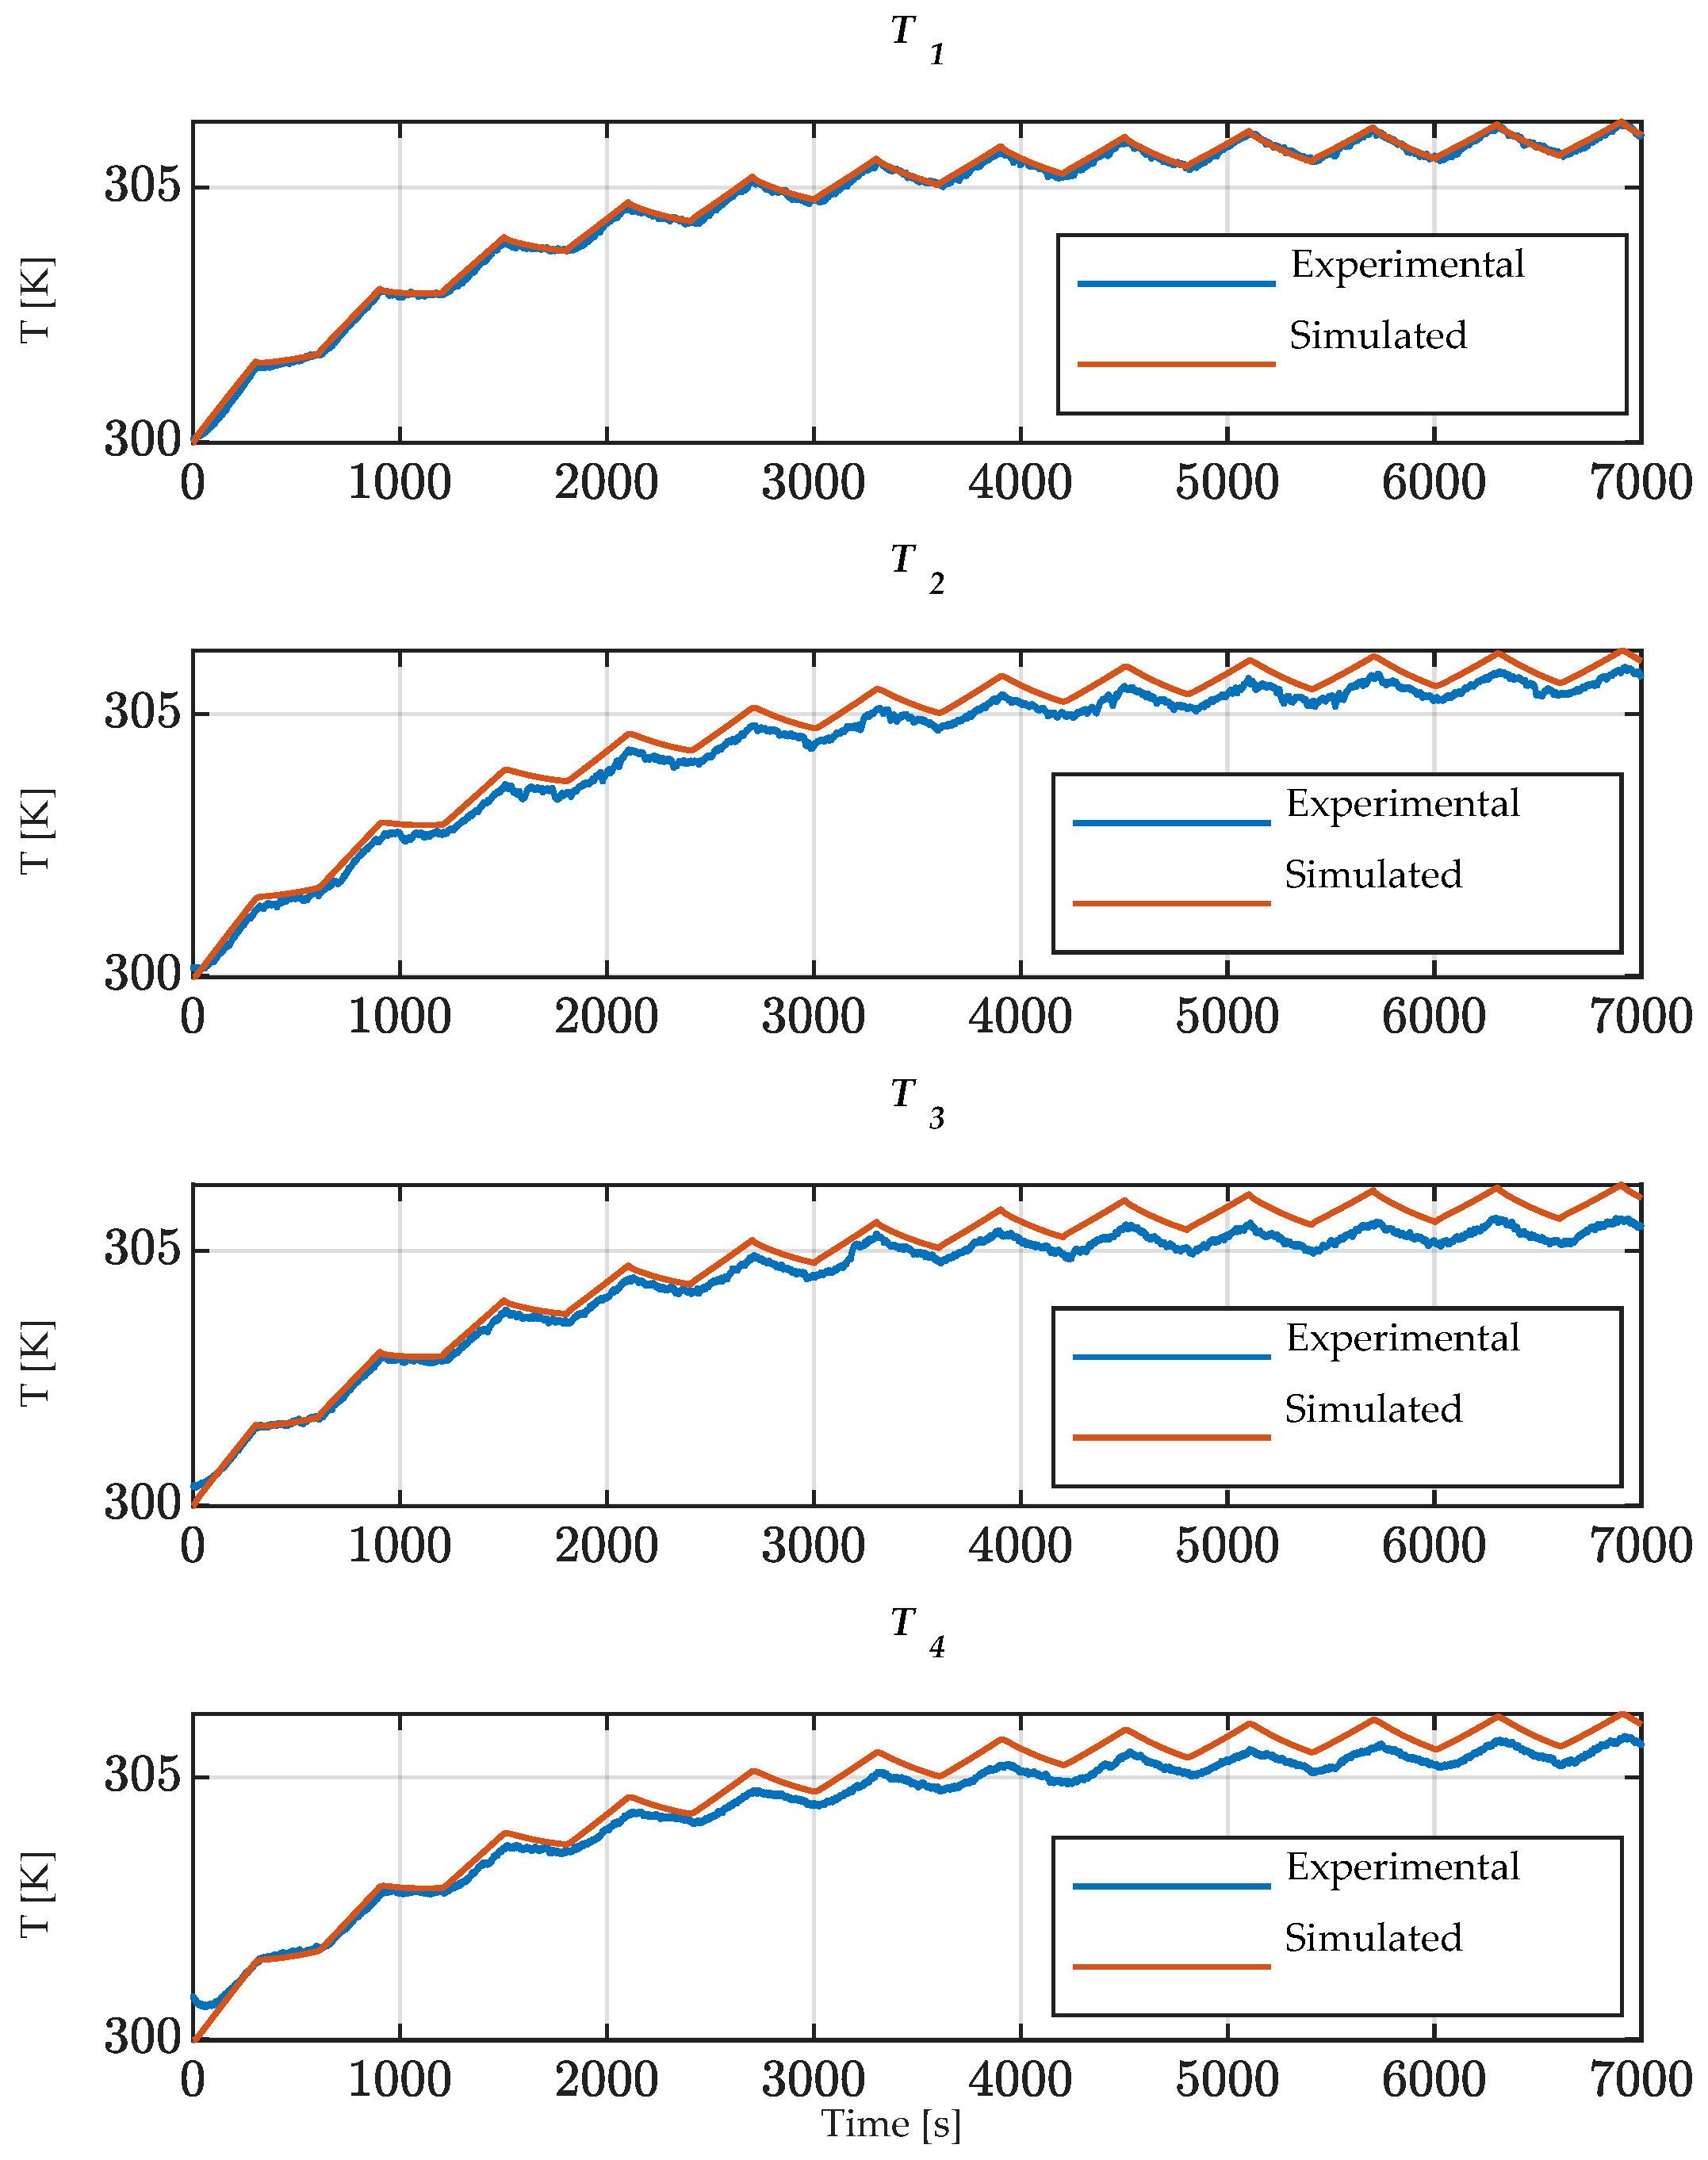
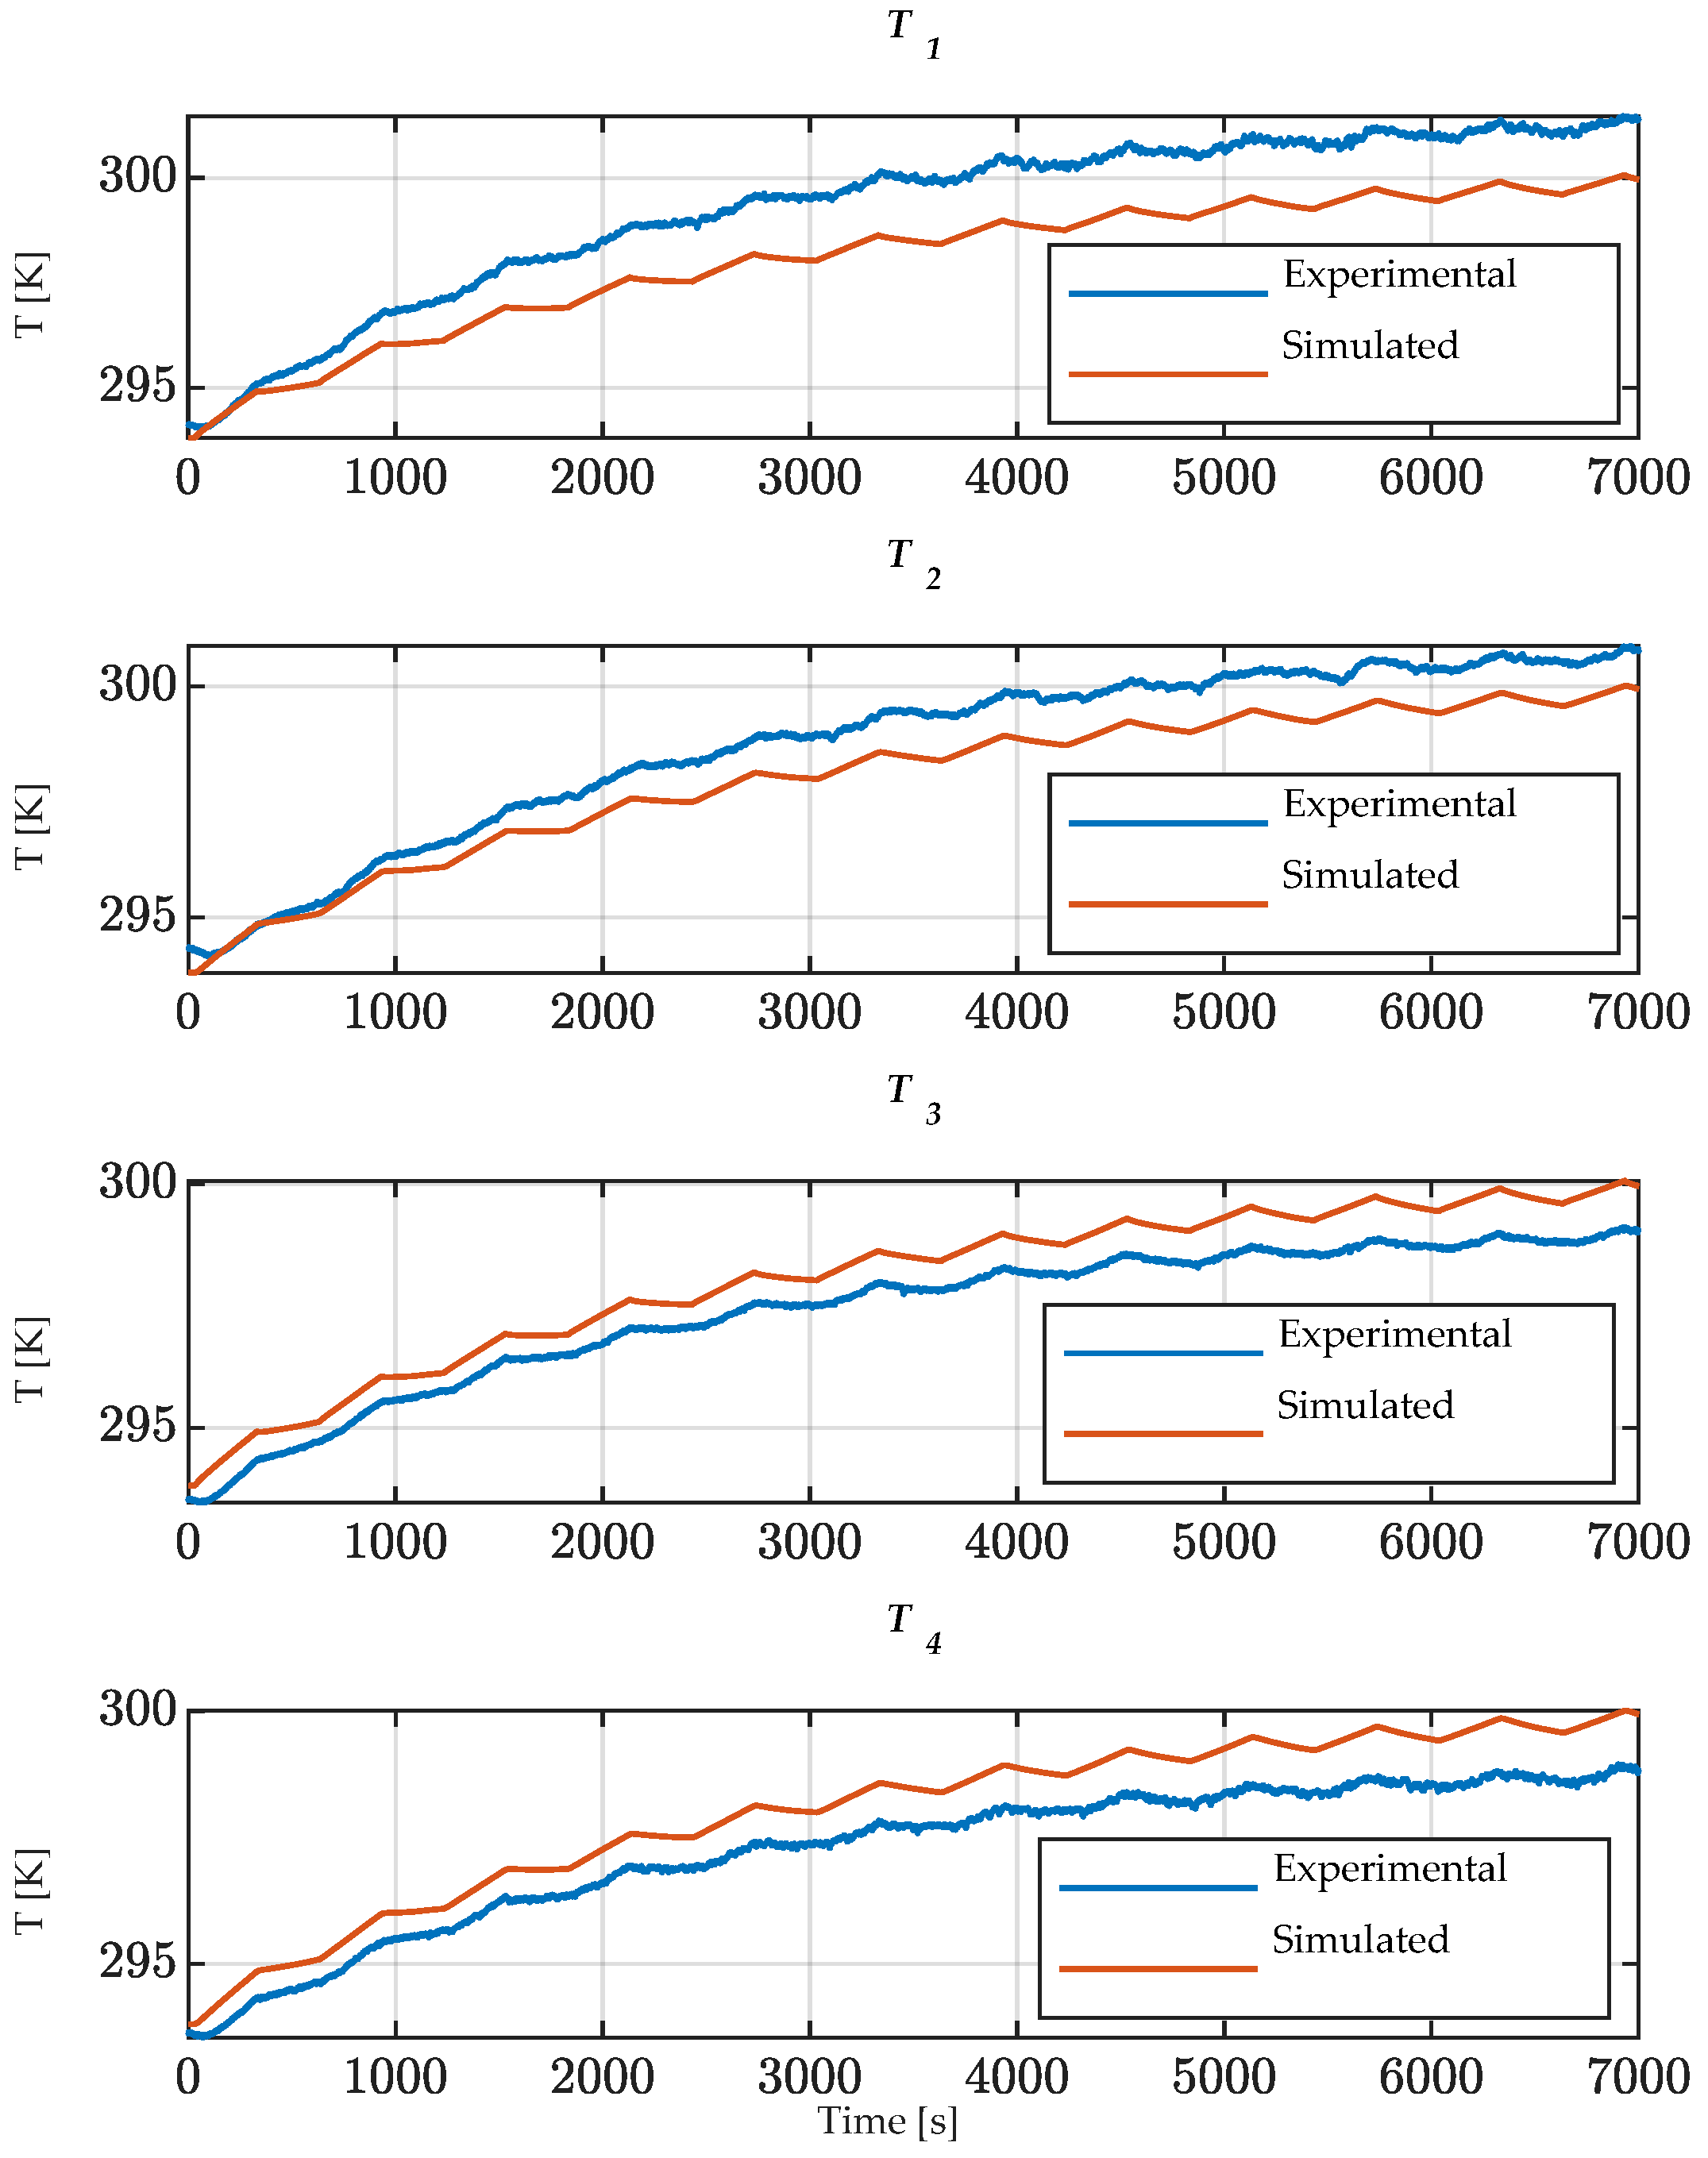
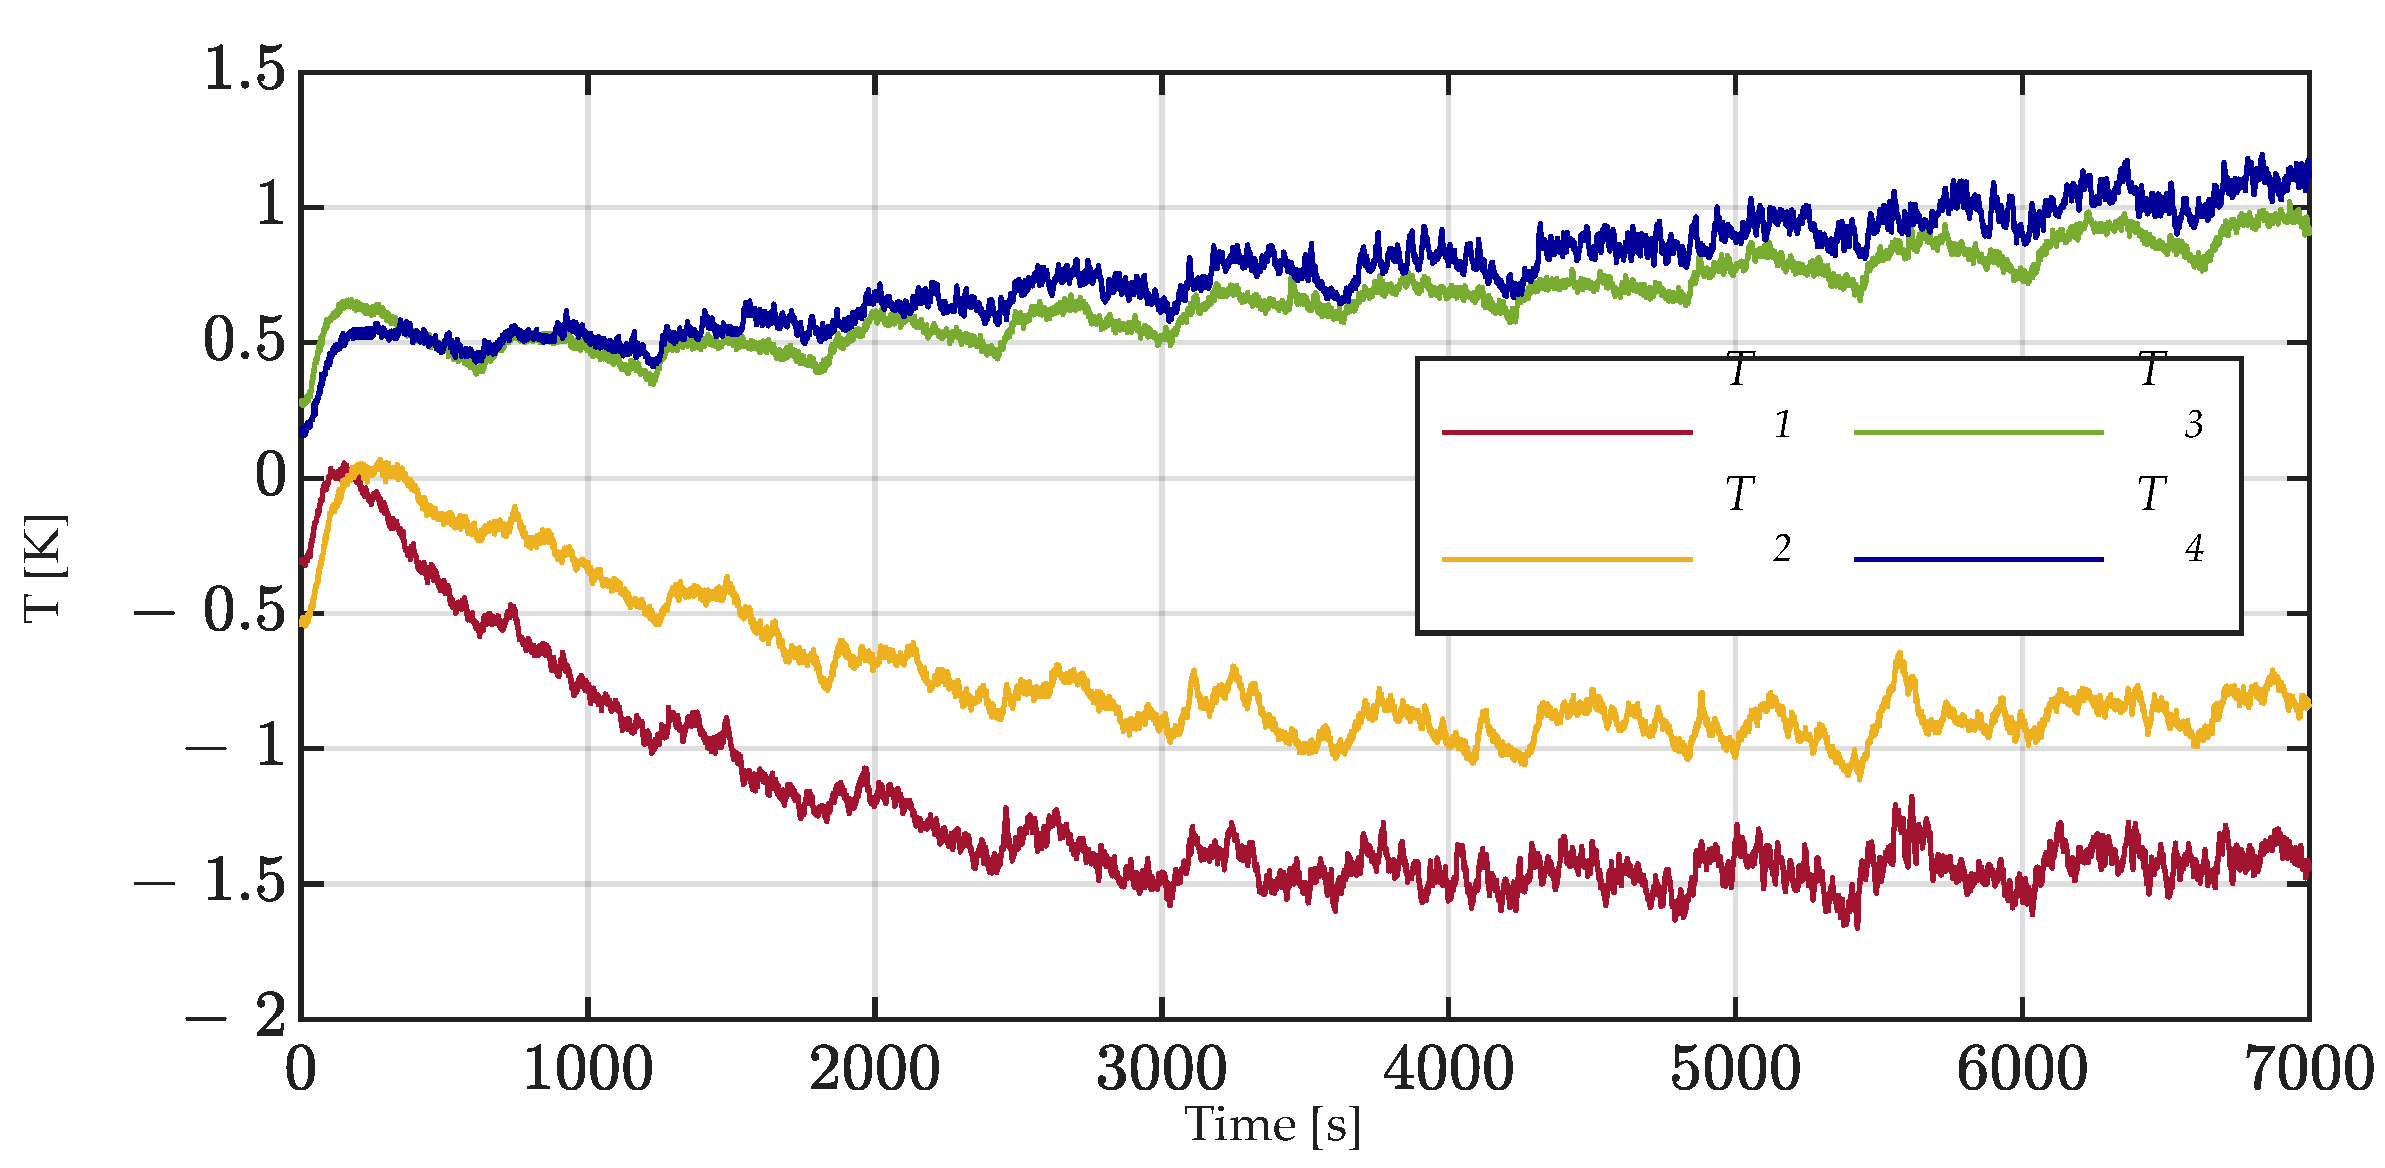
The proposed model was tuned and validated, by means of several experimental tests performed on NMC pouch cells, under different working conditions and with a different number of cells in the pack. The results show a very good accuracy of the model that is capable of predicting the temperature trend with an error lower than 2 K when compared with the measured temperature. Differently from other available models in the literature, this model takes into consideration the non-uniform distribution of the current among the cells and inside every single cell.
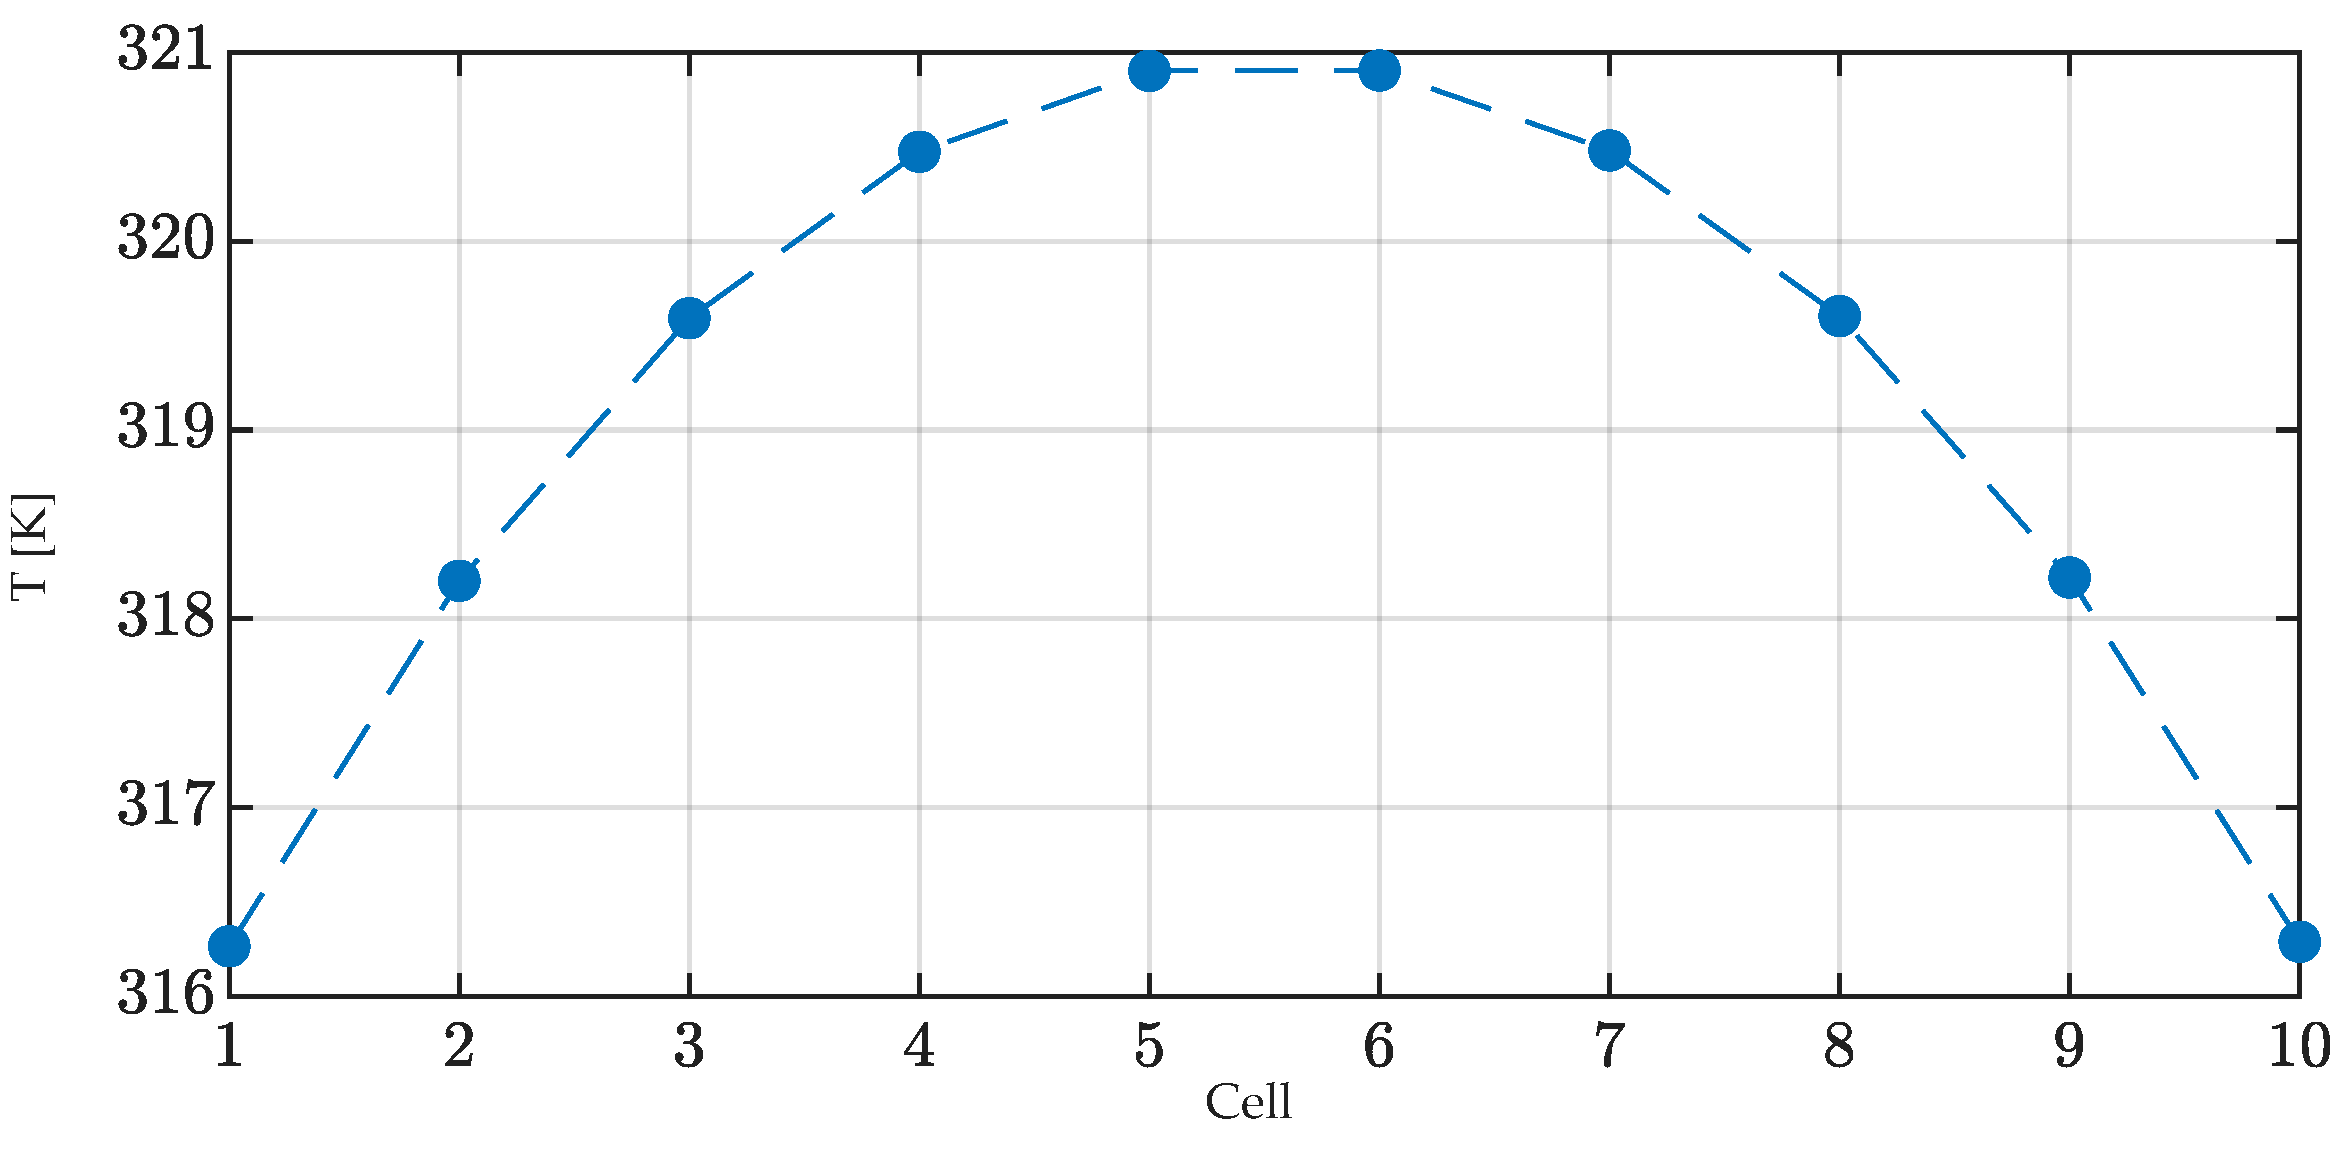
The validated model was used to predict the temperature of the inner cells when the battery pack is subjected to a 2C current. As expected, the temperature distribution is symmetrical with respect to the central cell, which is the warmest. In particular, for the tested battery pack, the inner cells show a temperature 5 K higher than the external ones. This would lead to very different aging of the cells that, in turn, would lead to the end of the life of the battery pack. This result can be important for designing new battery packs or BMS in which the temperature difference among the cells is reduced.

Author Contributions

Conceptualization, S.B. and L.P.; methodology, S.B., S.C. and L.P.; software, S.C. and P.M.; validation, S.C. and P.M.; formal analysis, S.B., S.C. and P.M.; investigation, S.C. and L.P.; resources, L.P.; data curation, S.C. and P.M.; writing—original draft preparation, S.C. and P.M.; writing—review and editing, S.B. and L.P.; visualization, S.B.; supervision, L.P.; project administration, L.P.; funding acquisition, L.P. All authors have read and agreed to the published version of the manuscript.

Funding

This research received no external funding.

Conflicts of Interest

The authors declare no conflict of interest.

Nomenclature

RsElectrical series resistance
EOpen circuit voltage
ReBranch electrical resistance
Rth,1Vertical thermal resistance
Rth,2Longitudinal thermal resistance
Rth,aAmbient exchange thermal resistance (related to upper and lower surfaces)
Rth,LAmbient exchange thermal resistance (related to lateral surface)
CthThermal capacitance
hConvection heat flux coefficient
SlatLateral surface
SupUpper surface
Rth,cCell-to-cell contact thermal resistance
QtotTotal generated heat flux
QirrIrreversible heat flux component
QrevReversible heat flux component
TsBattery surface temperature
iTotal battery current
TaAmbient temperature
Rth,AAmbient exchange thermal resistance
RthEquivalent thermal resistance of vertical branch (parallel between Rth,A and Rth,1)
T1,T2,T3,T4Temperature measured at the surface of the cell or of the battery pack
i1,i2,i3,i4Current in the electrical branches inside the cell
Qa,QbHeat generated inside the cell
TsimulatedTemperature at the surface of the cell simulated by the model
TmeasuredMeasured temperature at the surface of the cell

References

  1. Pelletier, S.; Jabali, O.; Laporte, G.; Veneroni, M. Battery degradation and behaviour for electric vehicles: Review and numerical analyses of several models. Transp. Res. Part B Methodol. 2017, 103, 158–187. [Google Scholar] [CrossRef]
  2. Jossen, A.; Späth, V.; Döring, H.; Garche, J. Reliable battery operation—A challenge for the battery management system. J. Power Sources 1999, 84, 283–286. [Google Scholar] [CrossRef]
  3. Barcellona, S.; Piegari, L. Lithium Ion Battery Models and Parameter Identification Techniques. Energies 2017, 10, 2007. [Google Scholar] [CrossRef] [Green Version]
  4. Kim, Y.-H.; Ha, H.-D. Design of interface circuits with electrical battery models. IEEE Trans. Ind. Electron. 1997, 44, 81–86. [Google Scholar] [CrossRef]
  5. Zhang, H.; Chow, M.-Y. Comprehensive dynamic battery modeling for PHEV applications. In Proceedings of the IEEE PES General Meeting, Minneapolis, MN, USA, 25–29 July 2010; pp. 1–6. [Google Scholar]
  6. Zhang, S.S.; Xu, K.; Jow, T.R. Electrochemical impedance study on the low temperature of Li-ion batteries. Electrochim. Acta 2004, 49, 1057–1061. [Google Scholar] [CrossRef]
  7. Forgez, C.; Vinh Do, D.; Friedrich, G.; Morcrette, M.; Delacourt, C. Thermal modeling of a cylindrical LiFePO4/graphite lithium-ion battery. J. Power Sources 2010, 195, 2961–2968. [Google Scholar] [CrossRef]
  8. Botte, G.G.; Johnson, B.A.; White, R.E. Influence of Some Design Variables on the Thermal Behavior of a Lithium-Ion Cell. J. Electrochem. Soc. 1999, 146, 914–923. [Google Scholar] [CrossRef]
  9. Momma, T.; Matsunaga, M.; Mukoyama, D.; Osaka, T. Ac impedance analysis of lithium ion battery under temperature control. J. Power Sources 2012, 216, 304–307. [Google Scholar] [CrossRef]
  10. Rizzello, A.; Scavuzzo, S.; Ferraris, A.; Airale, A.G.; Carello, M. Electrothermal Battery Pack Model for Automotive Application: Design and Validation. In Proceedings of the 2020 AEIT International Conference of Electrical and Electronic Technologies for Automotive (AEIT AUTOMOTIVE), Turin, Italy, 18–20 November 2020; pp. 1–6. [Google Scholar]
  11. Lin, C.; Cui, C.; Xu, X. Lithium-ion battery electro-thermal model and its application in the numerical simulation of short circuit experiment. In Proceedings of the 2013 World Electric Vehicle Symposium and Exhibition (EVS27), Barcelona, Spain, 17–20 November 2013; pp. 1–8. [Google Scholar]
  12. Murashko, K.; Wu, H.; Pyrhonen, J.; Laurila, L. Modelling of the battery pack thermal management system for Hybrid Electric Vehicles. In Proceedings of the 2014 16th European Conference on Power Electronics and Applications, Lappeenranta, Finland, 26–28 August 2014; pp. 1–10. [Google Scholar]
  13. Huang, B.; Hu, M.; Chen, L.; Jin, G.; Liao, S.; Fu, C.; Wang, D.; Cao, K. A Novel Electro-Thermal Model of Lithium-Ion Batteries Using Power as the Input. Electronics 2021, 10, 2753. [Google Scholar] [CrossRef]
  14. Gao, Z.; Chin, C.; Woo, W.; Jia, J. Integrated Equivalent Circuit and Thermal Model for Simulation of Temperature-Dependent LiFePO4 Battery in Actual Embedded Application. Energies 2017, 10, 85. [Google Scholar] [CrossRef] [Green Version]
  15. Orcioni, S.; Buccolini, L.; Ricci, A.; Conti, M. Lithium-ion Battery Electrothermal Model, Parameter Estimation, and Simulation Environment. Energies 2017, 10, 375. [Google Scholar] [CrossRef] [Green Version]
  16. Barcellona, S.; Piegari, L. Integrated electro-thermal model for pouch lithium ion batteries. Math. Comput. Simul. 2021, 183, 5–19. [Google Scholar] [CrossRef]
  17. Hande, A. Internal battery temperature estimation using series battery resistance measurements during cold temperatures. J. Power Sources 2006, 158, 1039–1046. [Google Scholar] [CrossRef]
  18. Schuster, E.; Ziebert, C.; Melcher, A.; Rohde, M.; Seifert, H.J. Thermal behavior and electrochemical heat generation in a commercial 40 Ah lithium ion pouch cell. J. Power Sources 2015, 286, 580–589. [Google Scholar] [CrossRef]
  19. Waag, W.; Käbitz, S.; Sauer, D.U. Experimental investigation of the lithium-ion battery impedance characteristic at various conditions and aging states and its influence on the application. Appl. Energy 2013, 102, 885–897. [Google Scholar] [CrossRef]
  20. Kosky, P.; Balmer, R.; Keat, W.; Wise, G. Exploring Engineering; Elsevier: Amsterdam, The Netherlands, 2013; ISBN 9780124158917. [Google Scholar]
  21. Inzoli, F.; Dassù, G. La Convezione Naturale; CUSL: Milan, Italy, 2003; ISBN 8881321750. [Google Scholar]
Figure 1. Ten-cells battery pack with the indication of the thermocouples positioning.
Electronics 11 01537 g001
Figure 2. Electrical model.
Electronics 11 01537 g002
Figure 3. Thermal model.
Electronics 11 01537 g003
Figure 4. Battery cell.
Electronics 11 01537 g004
Figure 5. N-cell thermal model.
Electronics 11 01537 g005
Figure 6. Test setup with the three cells battery pack.
Electronics 11 01537 g006
Figure 7. Temperature T3 trend during thermal characterization test.
Electronics 11 01537 g007
Figure 8. Simplified steady state thermal circuit.
Electronics 11 01537 g008
Figure 9. Simplified thermal circuit.
Electronics 11 01537 g009
Figure 10. Filtered temperature and fitting function.
Electronics 11 01537 g010
Figure 11. Thermocouples results for the single cell test at 10 A.
Electronics 11 01537 g011
Figure 12. Error test single cell 10 A.
Electronics 11 01537 g012
Figure 13. Thermocouples results for the single cell test at 15 A.
Electronics 11 01537 g013
Figure 14. Error test single cell 15 A.
Electronics 11 01537 g014
Figure 15. Thermocouples results for the single cell test at 20 A.
Electronics 11 01537 g015
Figure 16. Error test single cell 20 A.
Electronics 11 01537 g016
Figure 17. Thermocouples result for the three cells test at 30 A.
Electronics 11 01537 g017
Figure 18. Error test three cells 30 A.
Electronics 11 01537 g018
Figure 19. Thermocouples results for the three cells test at 45 A.
Electronics 11 01537 g019
Figure 20. Error test three cells 45 A.
Electronics 11 01537 g020
Figure 21. Thermocouples result for the three cells tests at 60 A.
Electronics 11 01537 g021
Figure 22. Error test three cells 60 A.
Electronics 11 01537 g022
Figure 23. Thermocouples result for the ten cells test at 70 A.
Electronics 11 01537 g023
Figure 24. Error test ten cells 70 A.
Electronics 11 01537 g024
Figure 25. Simulated inner cell temperature (T1) at steady state.
Electronics 11 01537 g025
Table 1. Battery cell specification.
ParameterValue [Units]
Nominal capacity10 [Ah]
Nominal voltage3.7 [V]
Size LxWxH132 × 65.5 × 12.7 [mm]
Table 2. Instrumentation accuracy.
DeviceAccuracy [Units]
Potentiostat SP-150±0.8 [mA] and 10 [mV]
Booster VMP3B-100±0.2 [A] and 5 [mV]
Type K thermocouples±2.2 [°C]
National instruments 92112.11 [°C]
cDAQ-917450 [ppm]
Table 3. Steady state temperature test 20 A.
T1T2T3T4Ta
310.4 K310.2 K310.5 K309.5 K300.5 K
Table 4. Model parameters.
ParameterValue [Units]
Rth,10.0267 [K/W]
Rth,20.277 [K/W]
Rth,a34.204 [K/W]
Rth,L117.902 [K/W]
Cth79.165 [J/K]
Rth,c5 [K/W]
Table 5. Steady state temperature test 45 A.
T1T2T3T4Ta
311.6 K311 K310.9 K309.8 K300.5 K
Publisher’s Note: MDPI stays neutral with regard to jurisdictional claims in published maps and institutional affiliations.

