
Research of Hand–Eye System with 3D Vision towards Flexible Assembly Application


Abstract
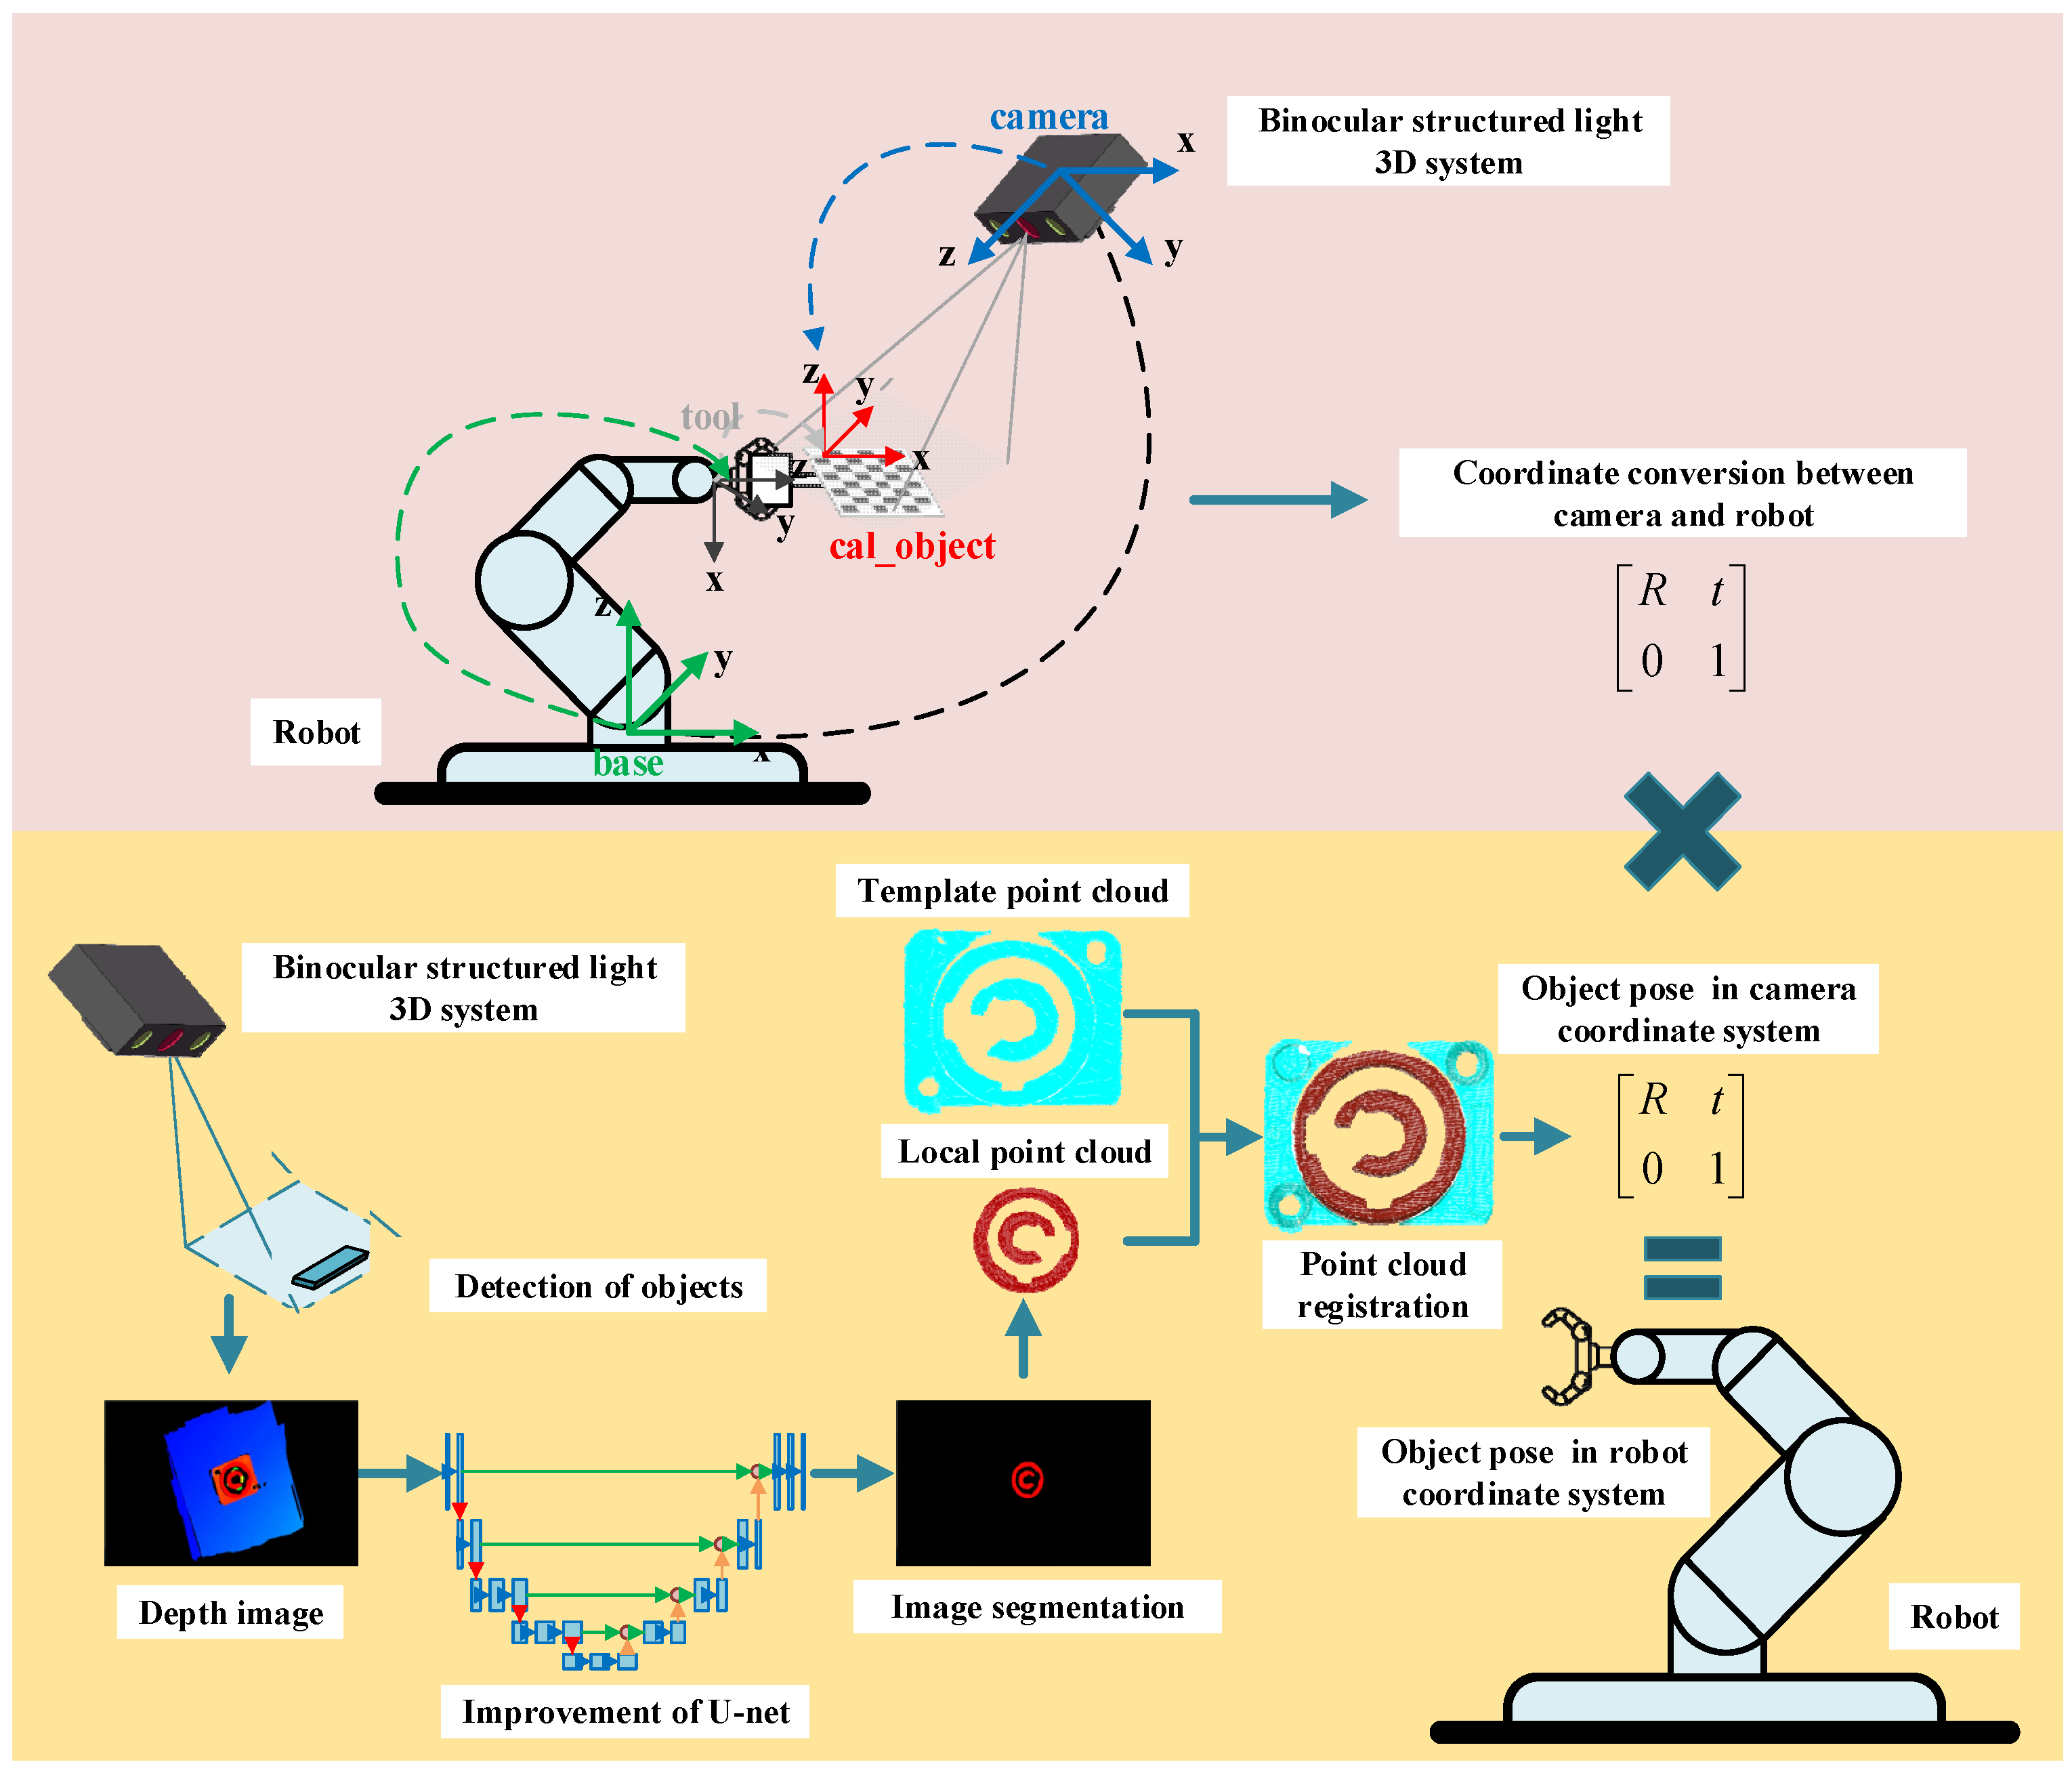
:1. Introduction
- A hand–eye calibration optimization method based on hand–eye data filtering is proposed to improve the accuracy of hand–eye calibration;
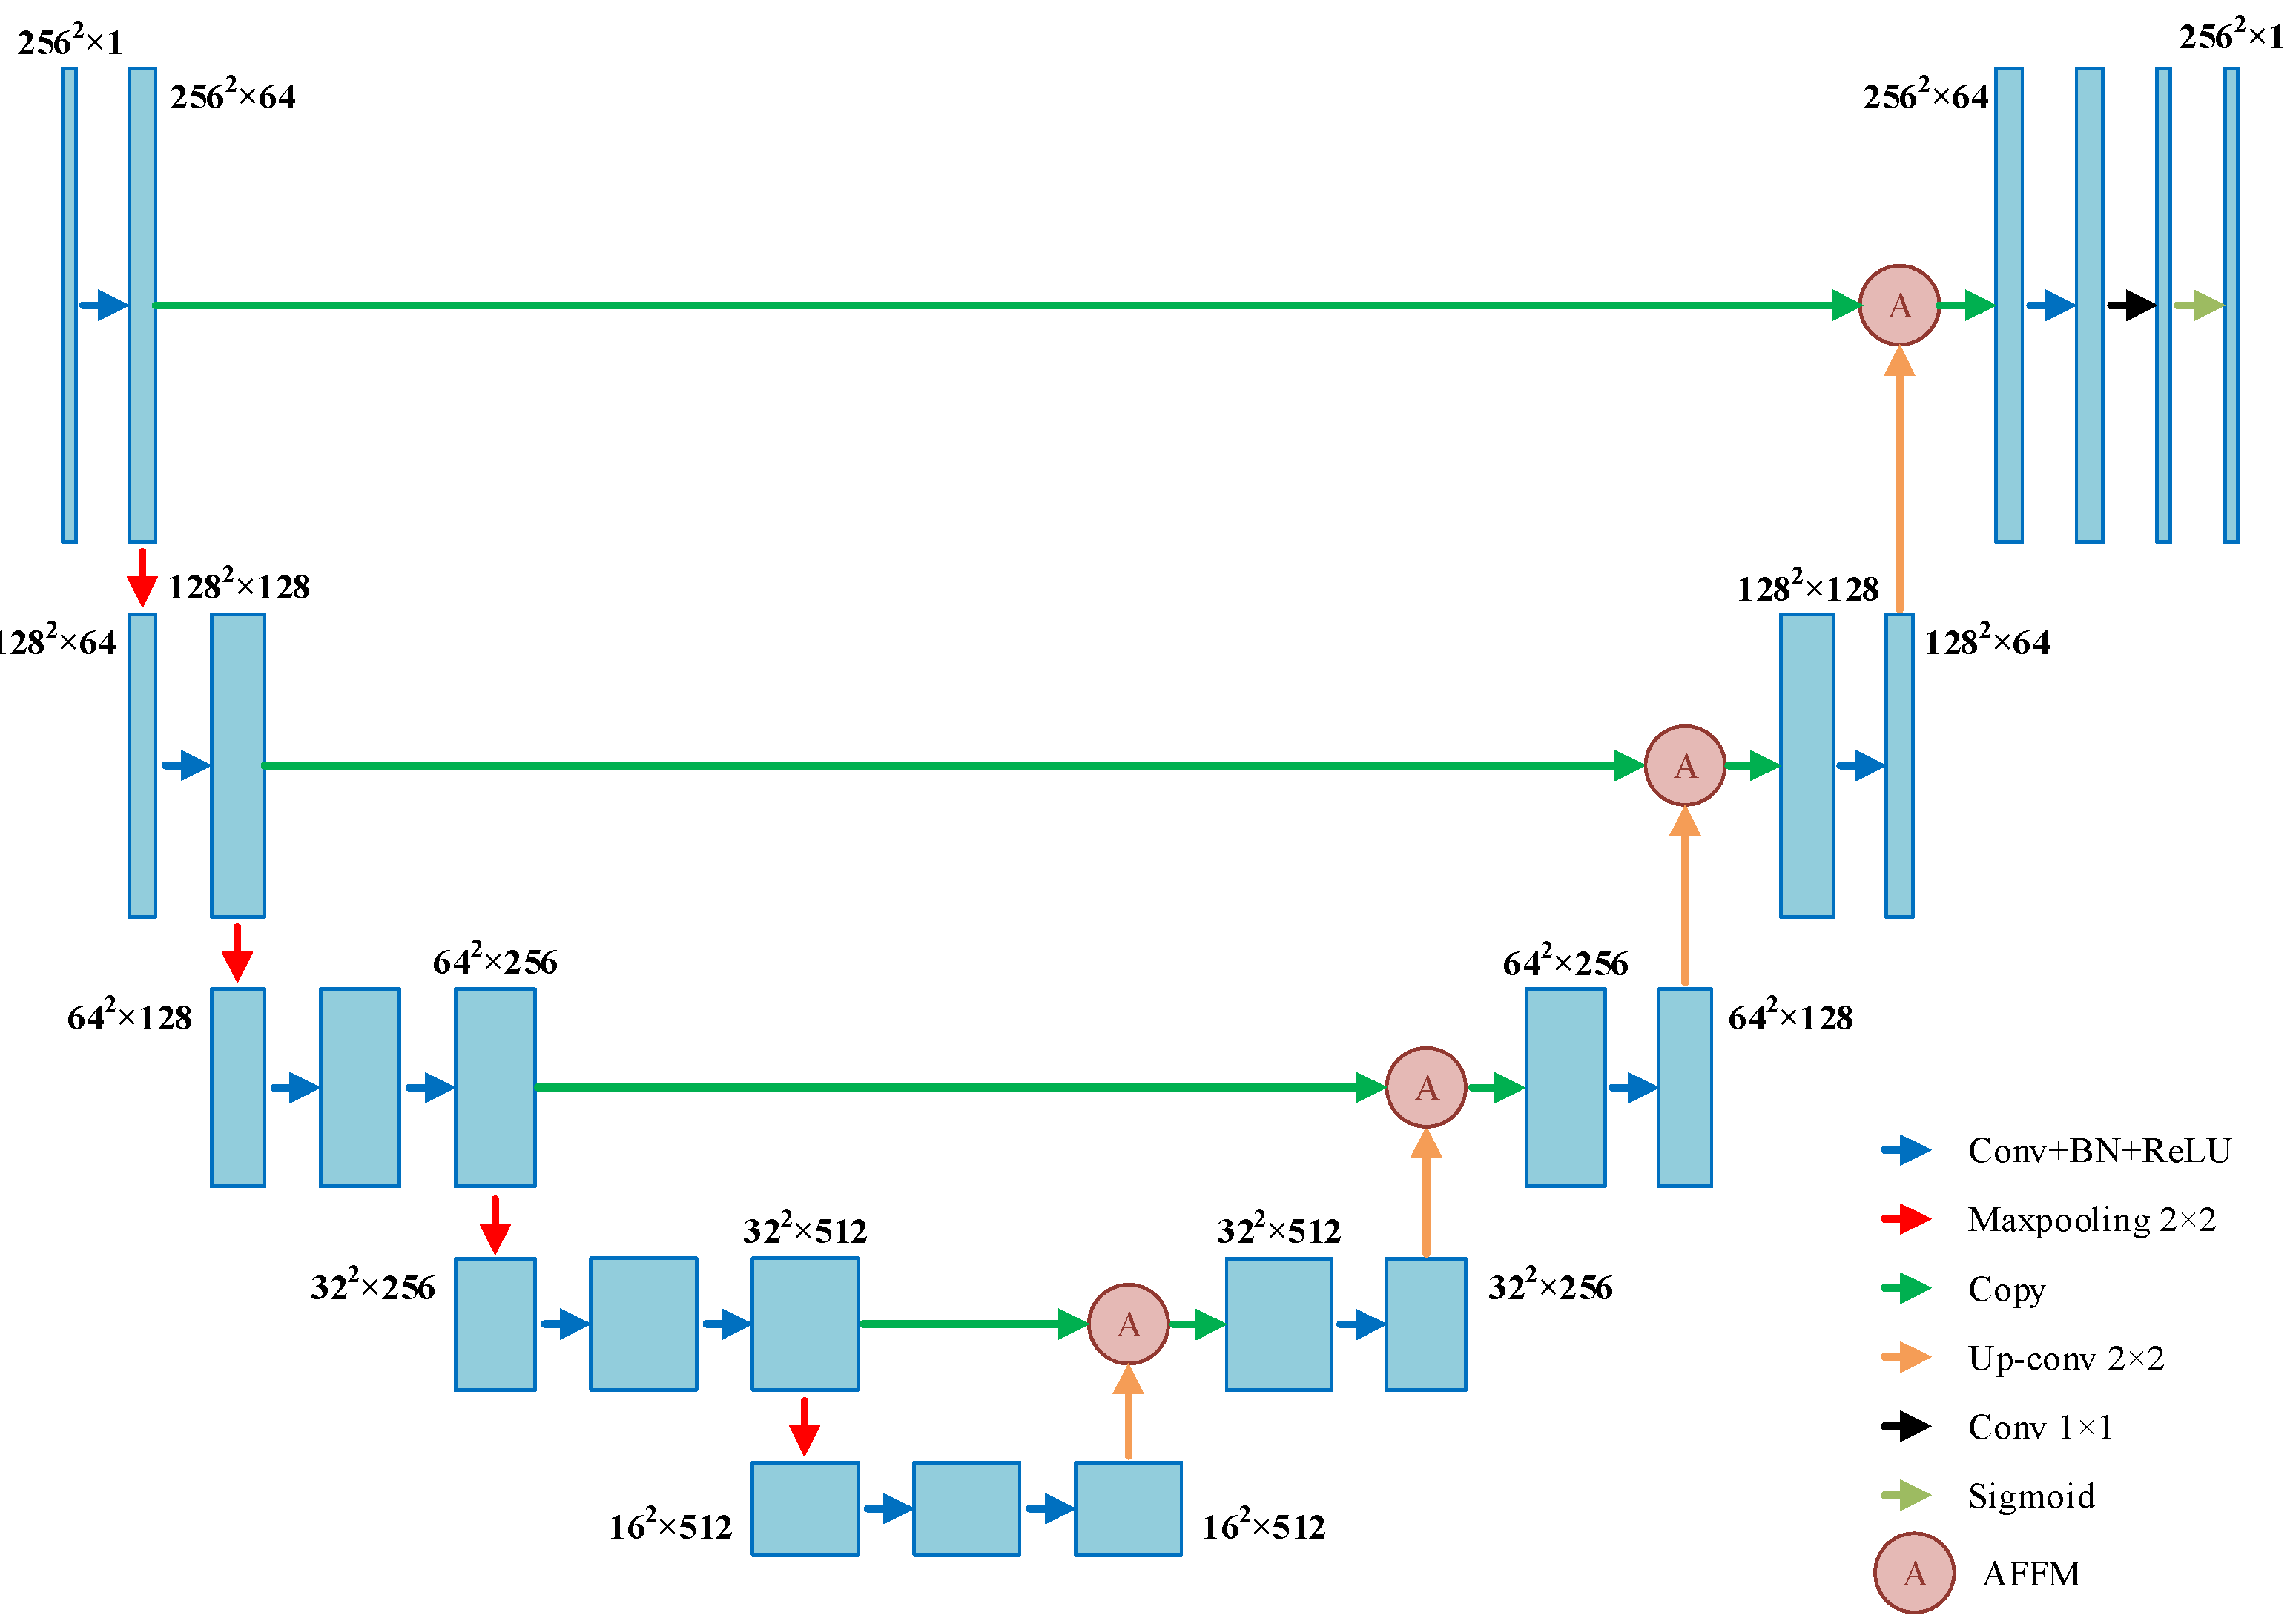
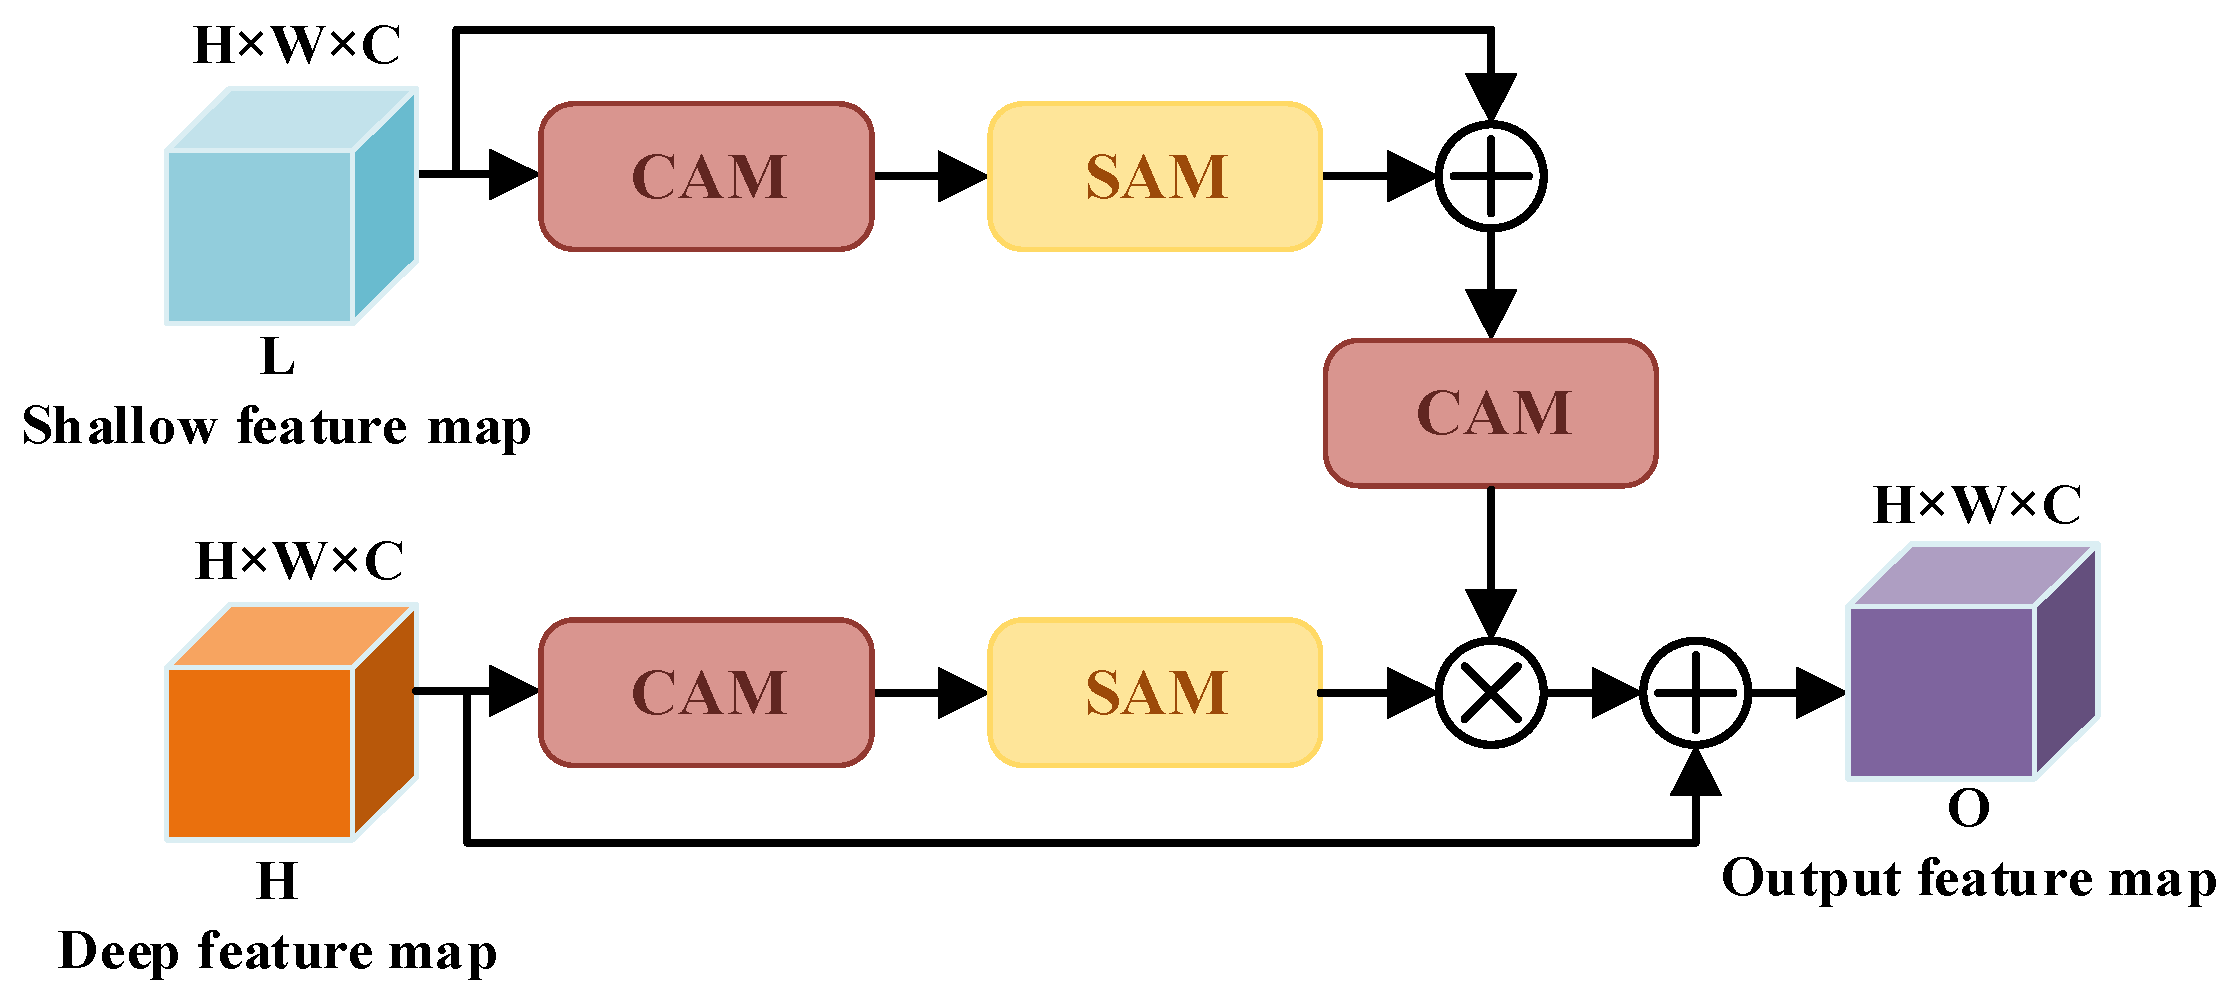
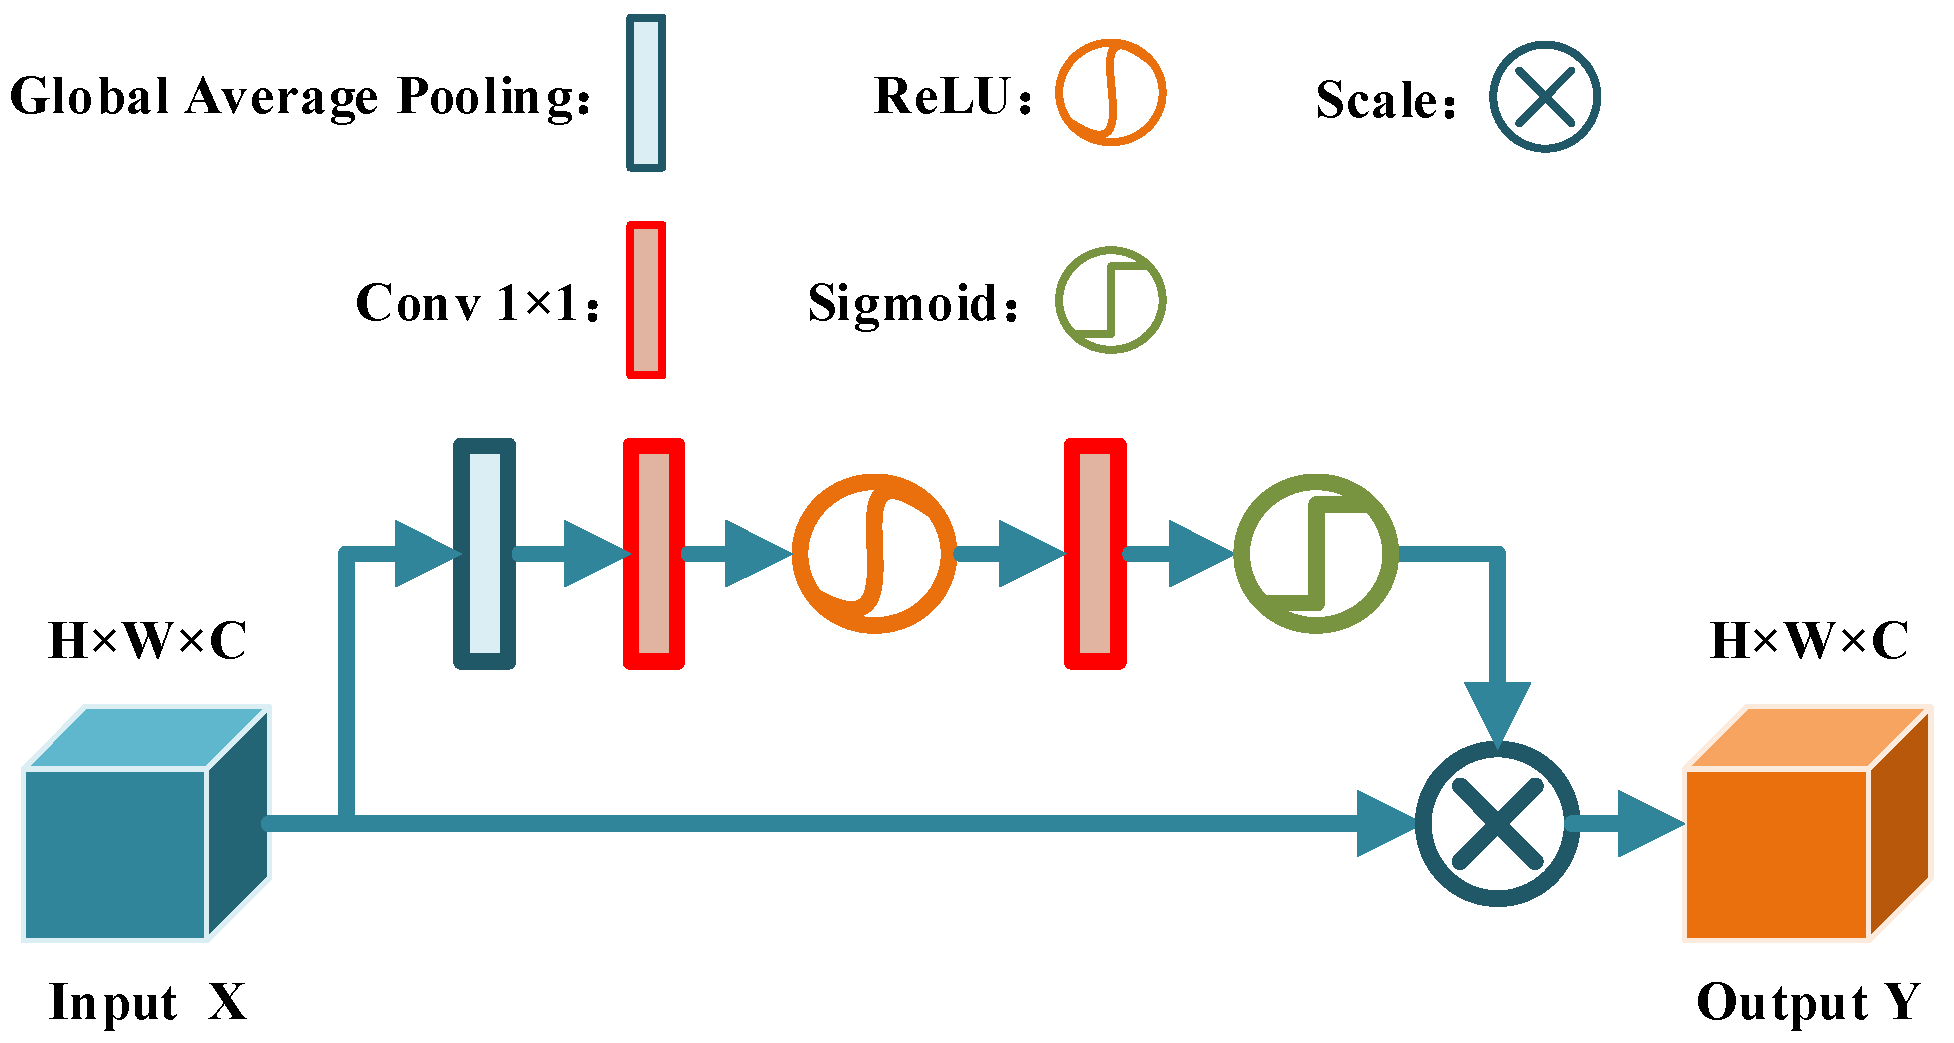
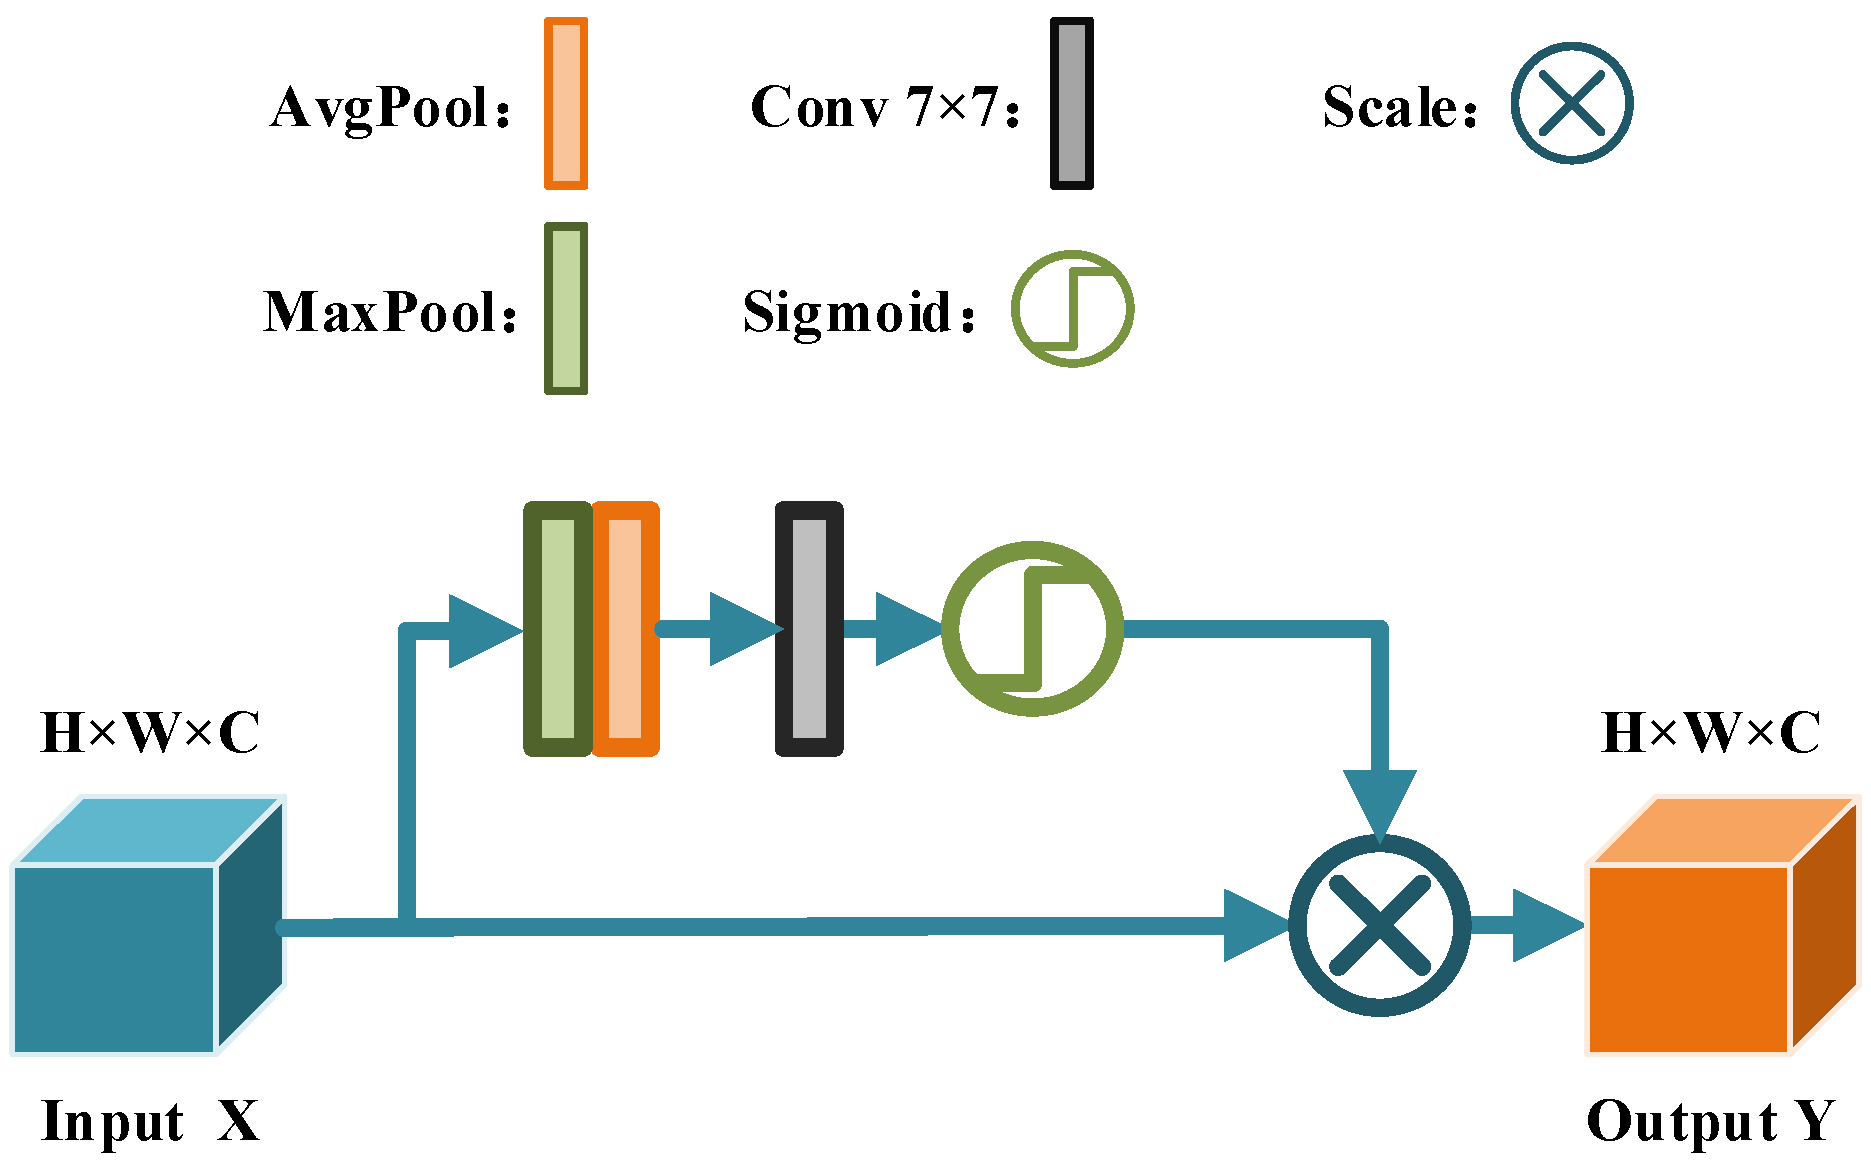
- An improved U-net segmentation method is proposed to accurately segment the depth image and achieve fast and accurate segmentation of point cloud;
- The point cloud registration strategy of “SAC-IA coarse registration-ICP fine registration” is adopted to achieve the target pose acquisition.
2. Optimization of Hand–Eye Calibration Based on Data Filtering
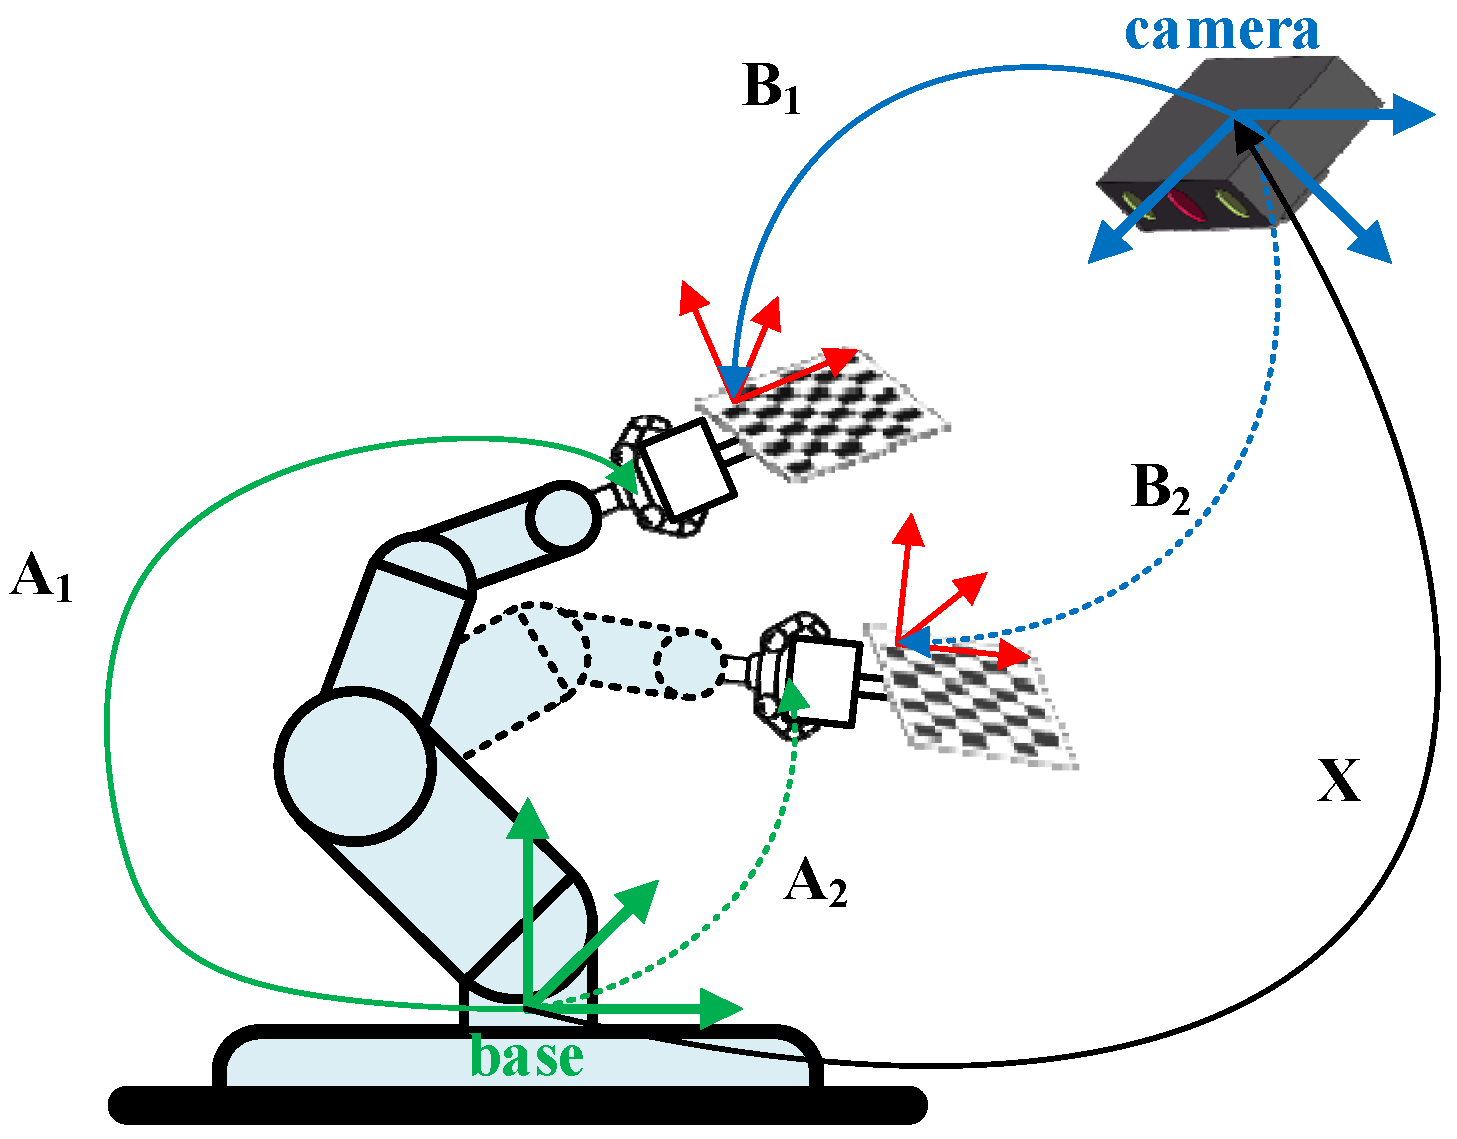
2.1. Mathematical Model and Error Analysis of Hand–Eye Calibration
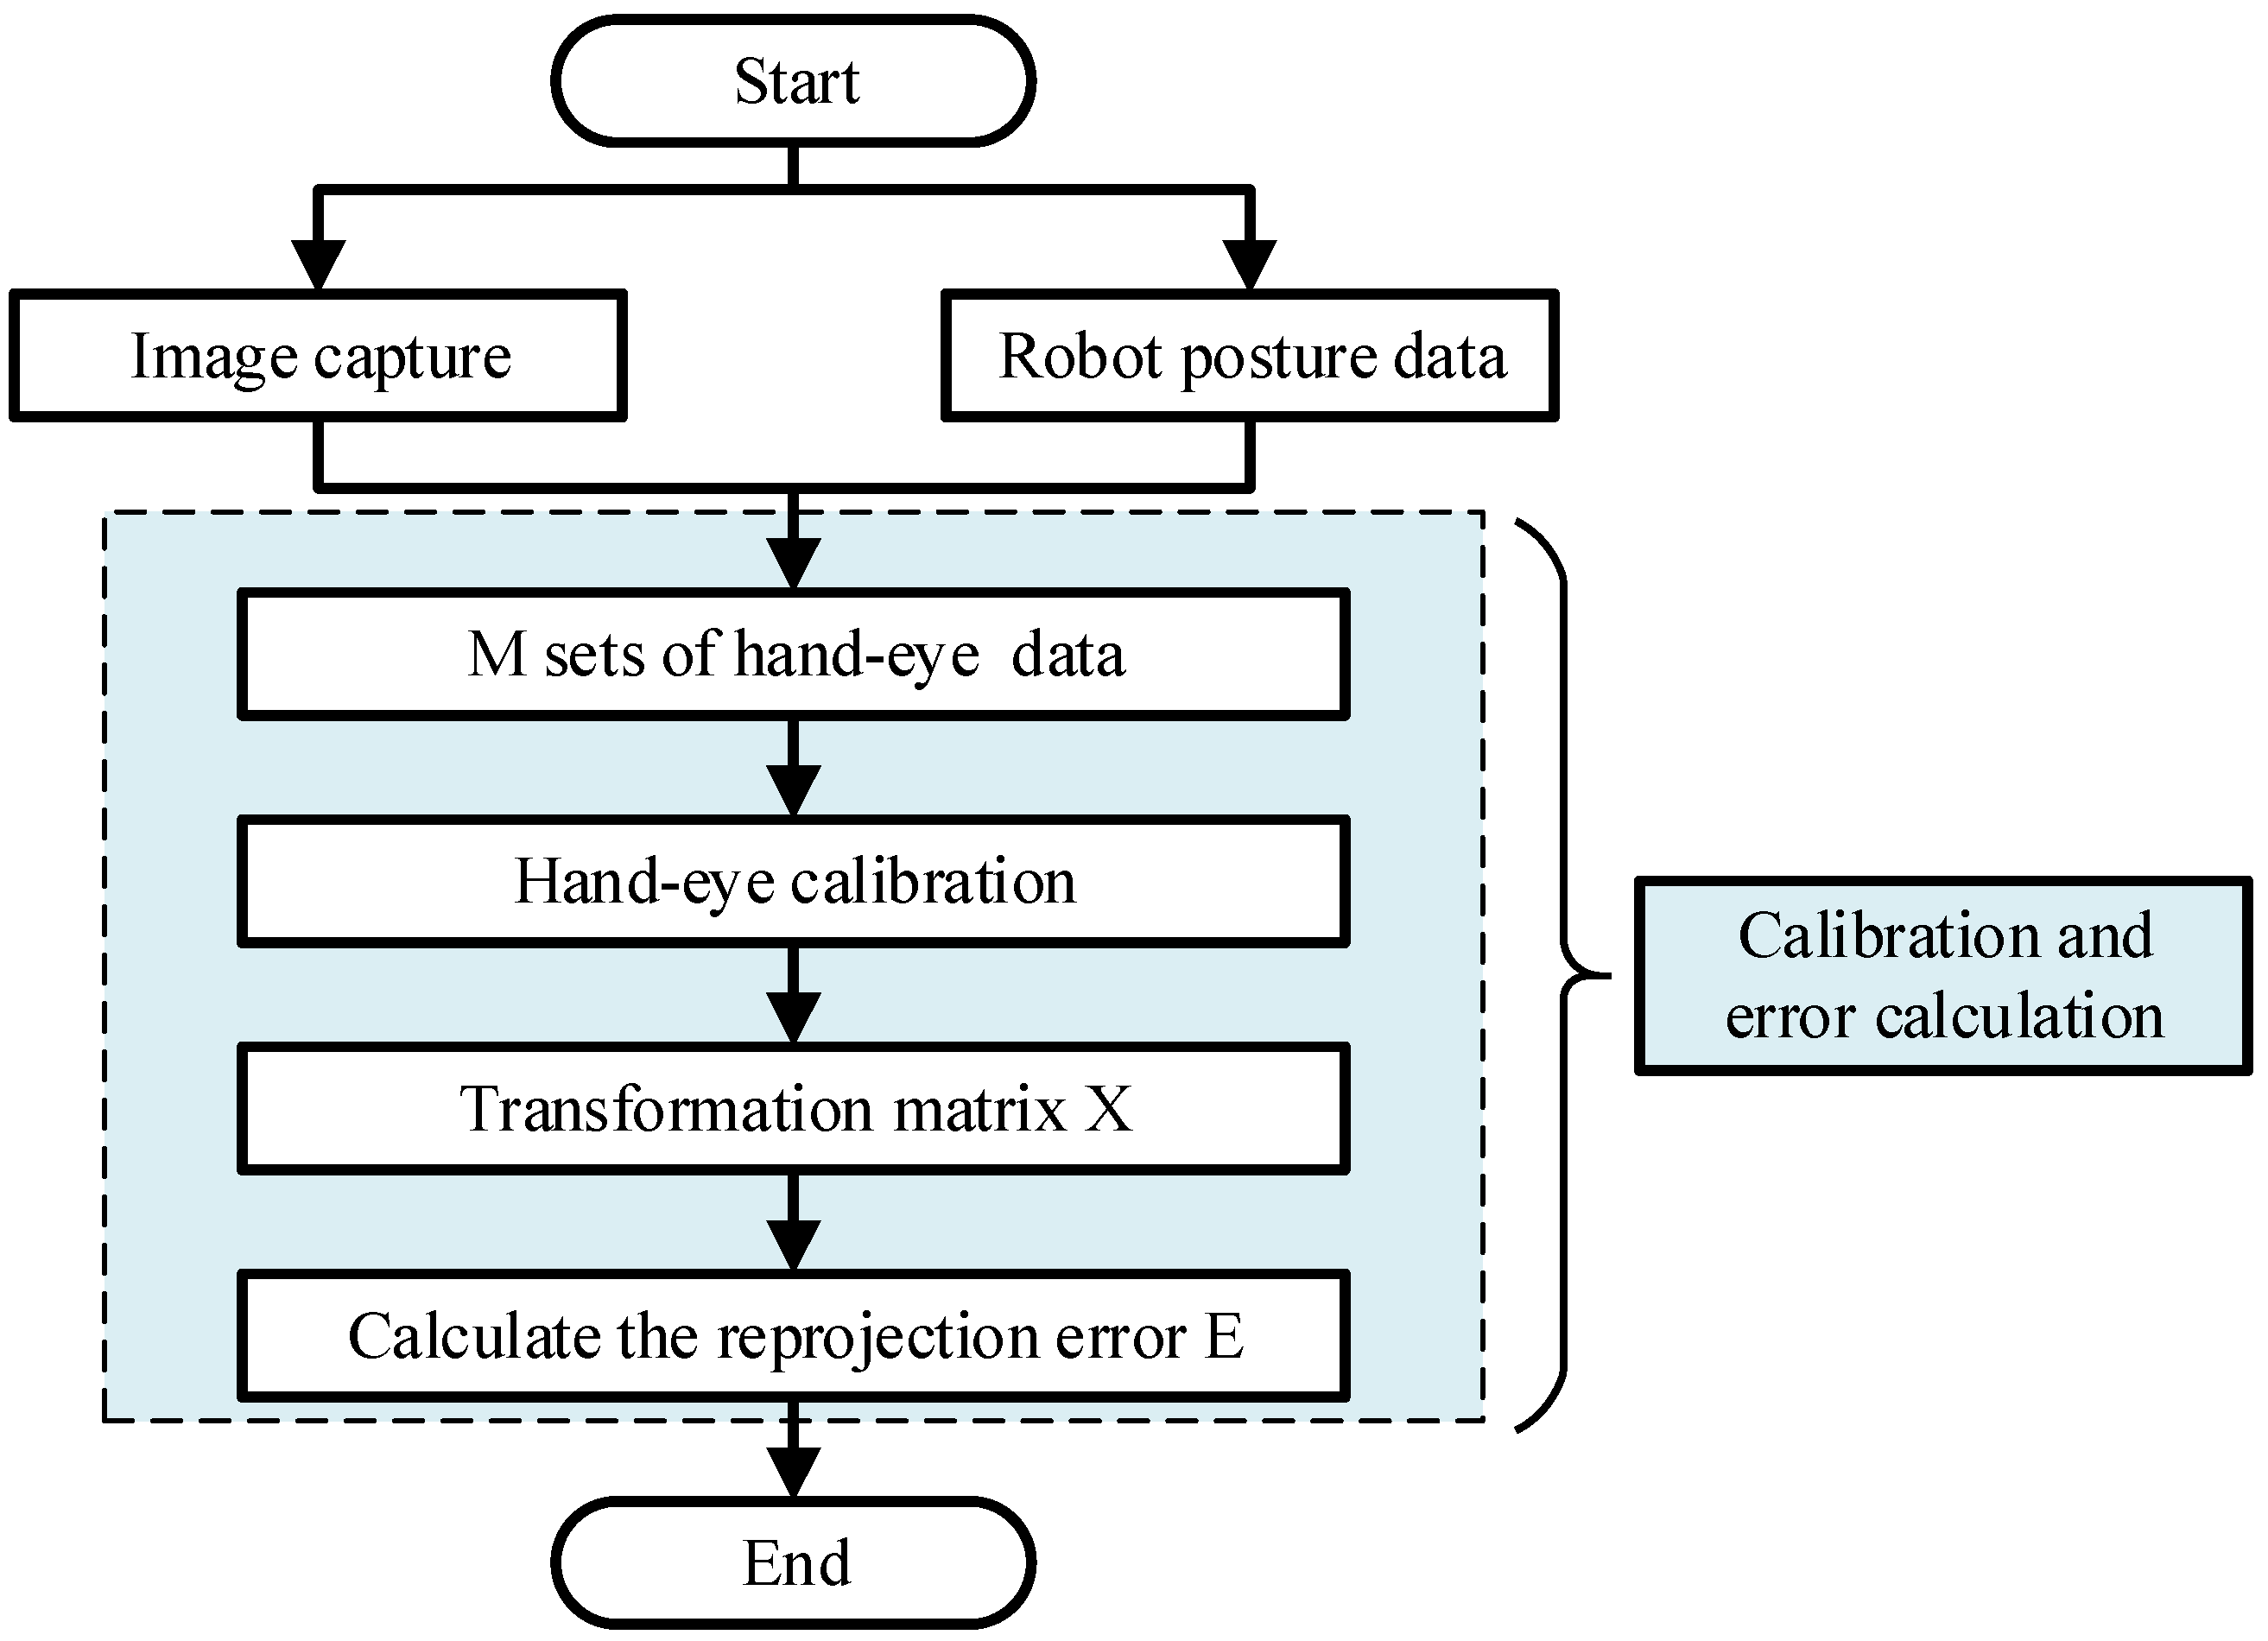
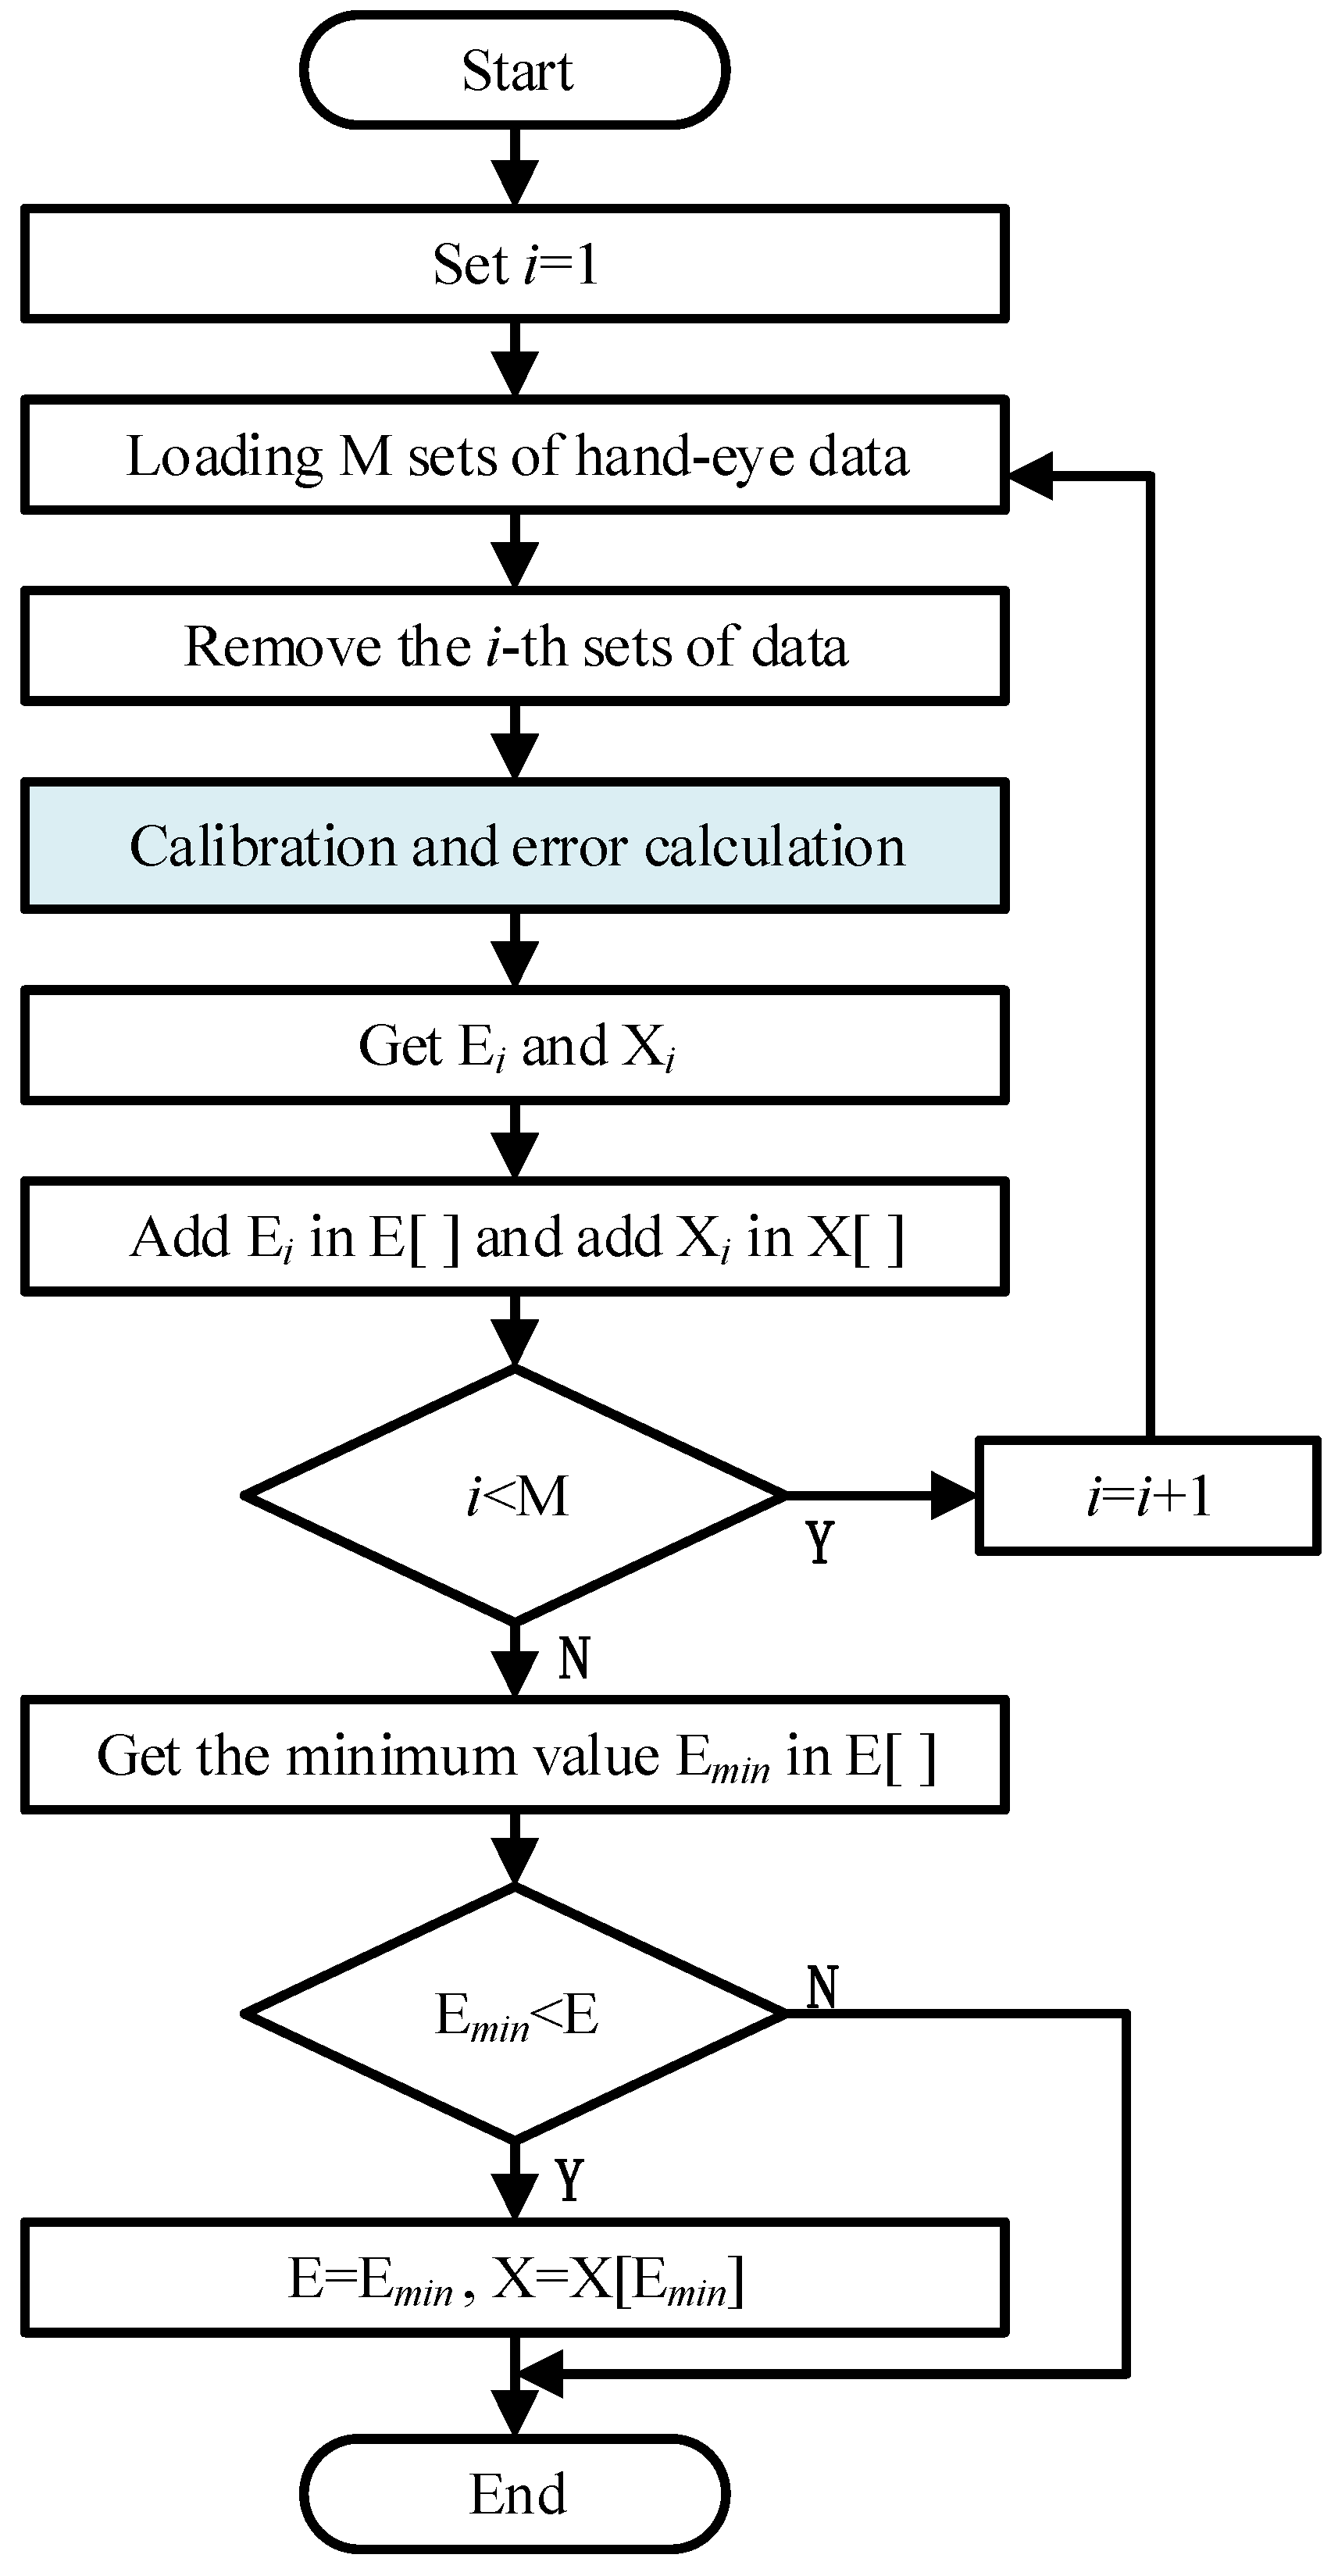
2.2. Hand–Eye Calibration Optimization Based on Data Filtering
3. Object Recognition and Pose Estimation
3.1. Object Segmentation and Recognition Based on Improved U-Net
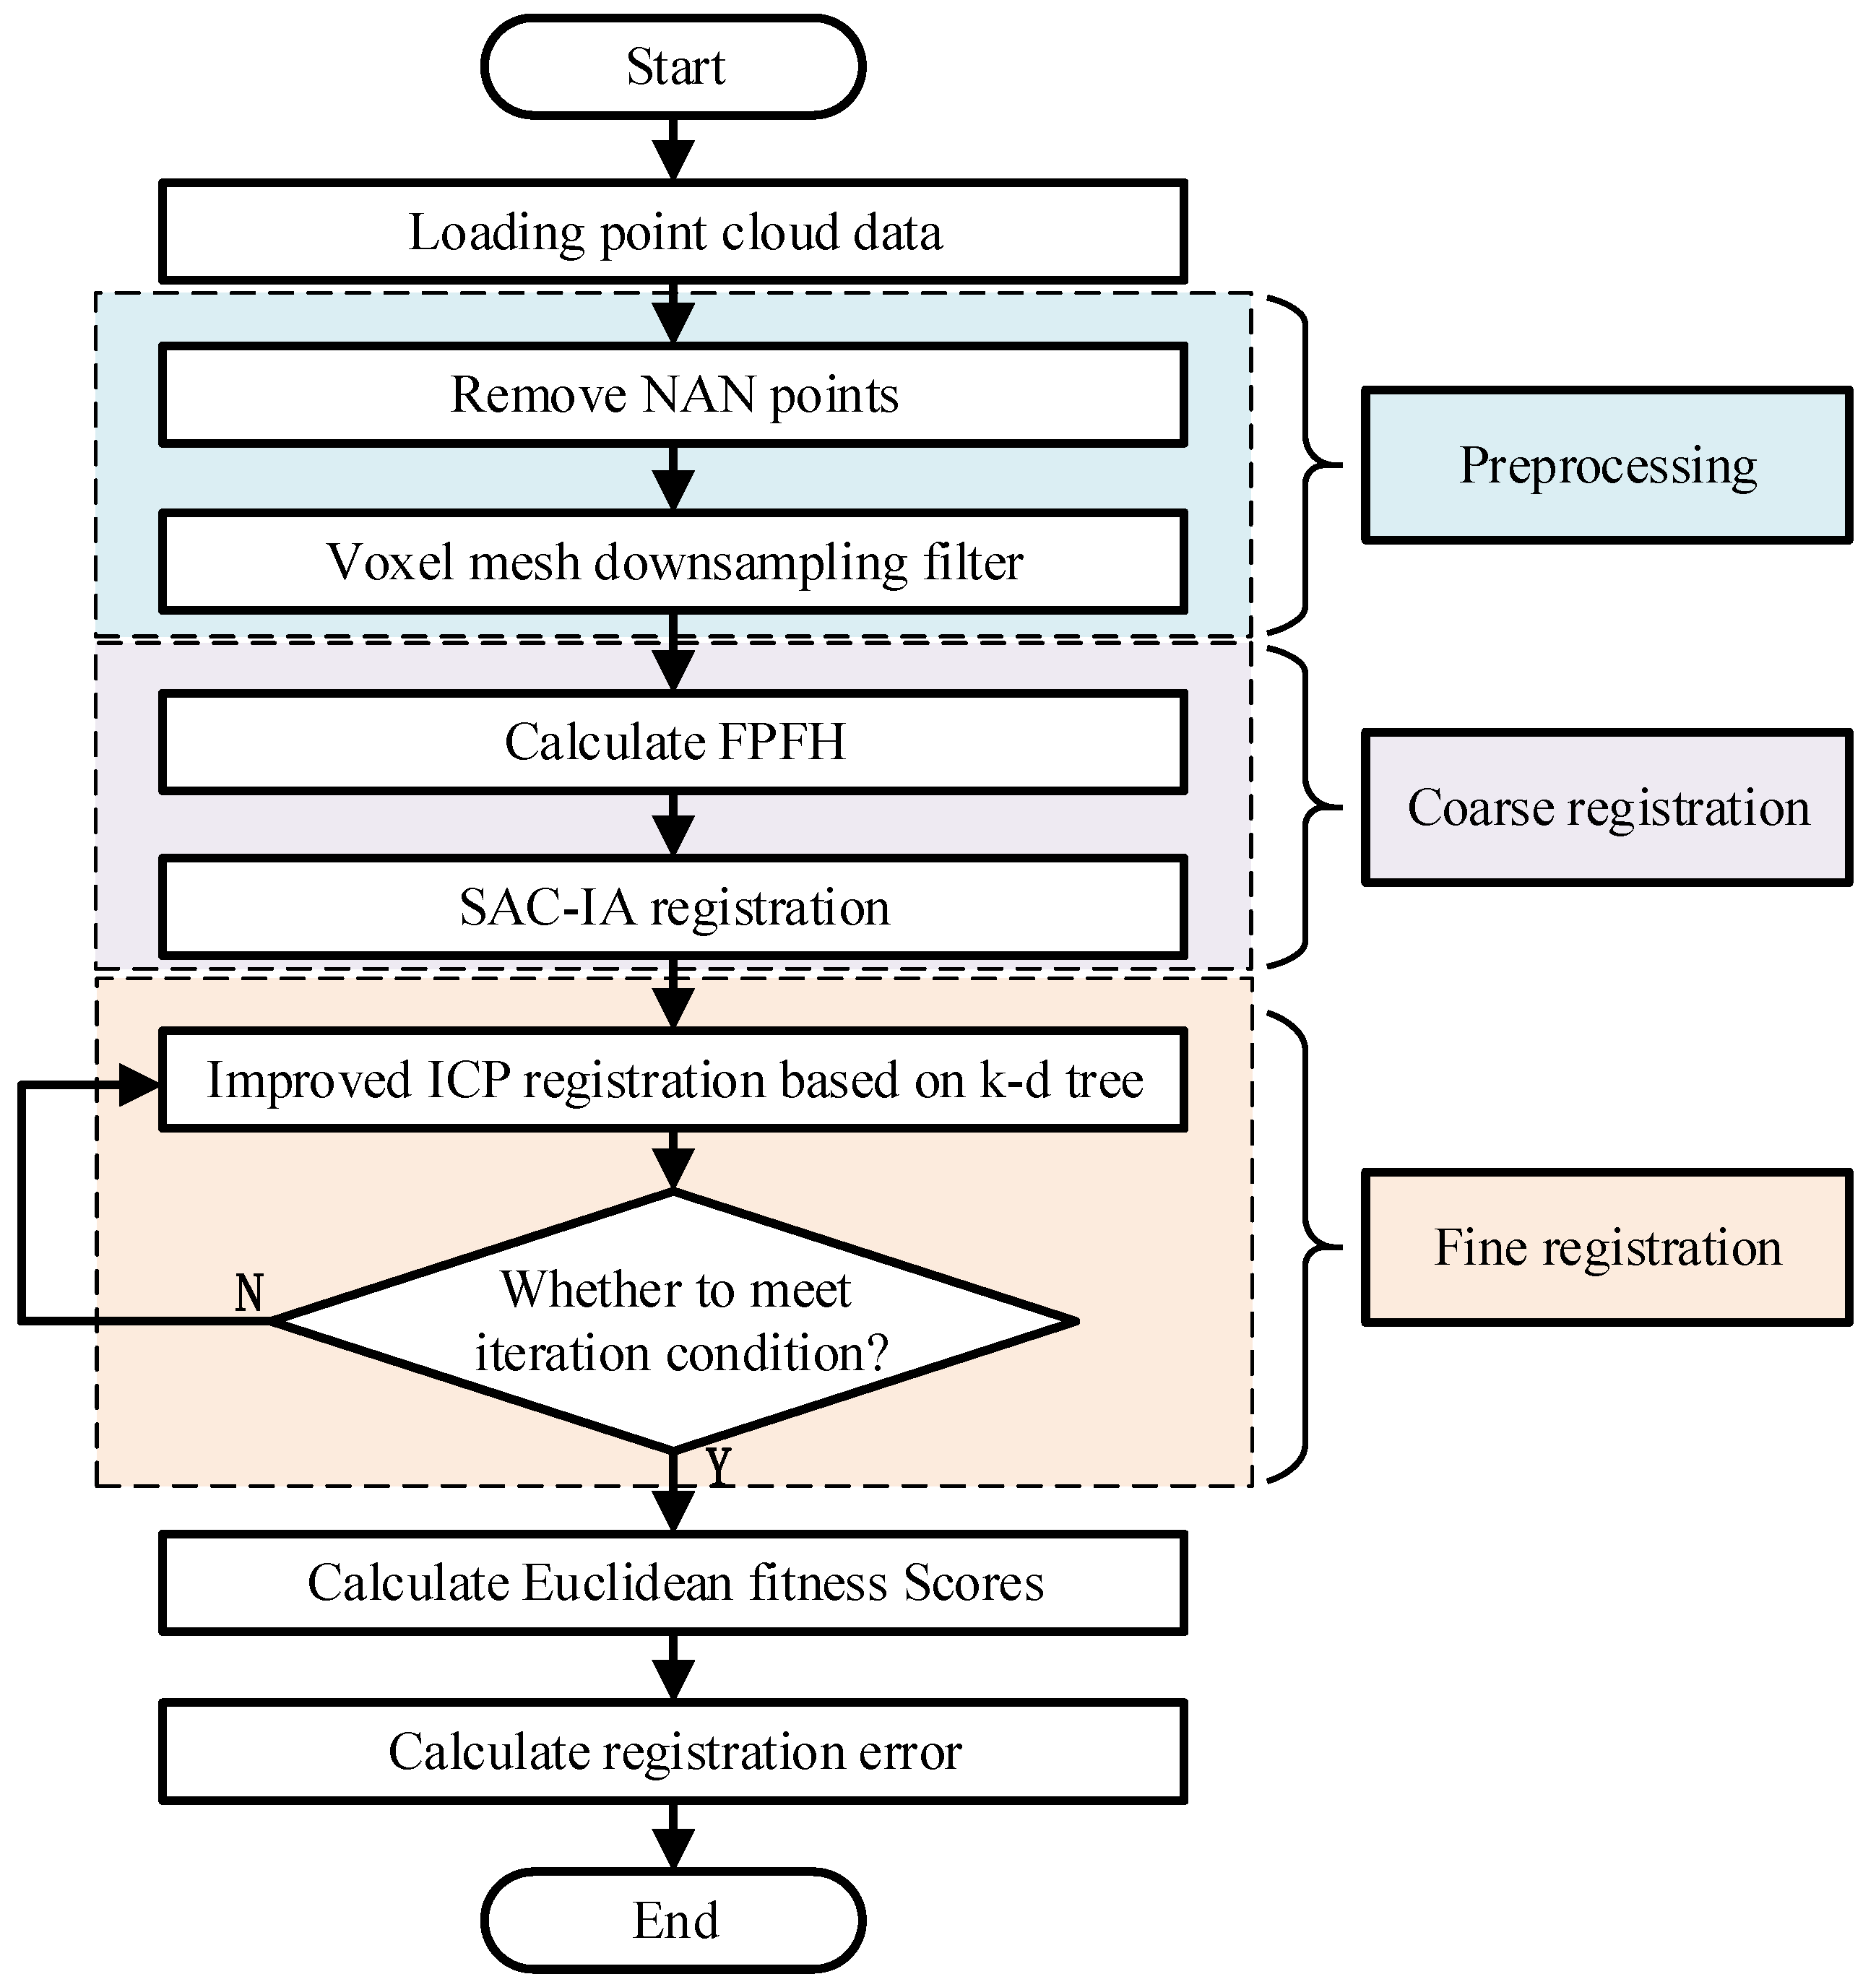
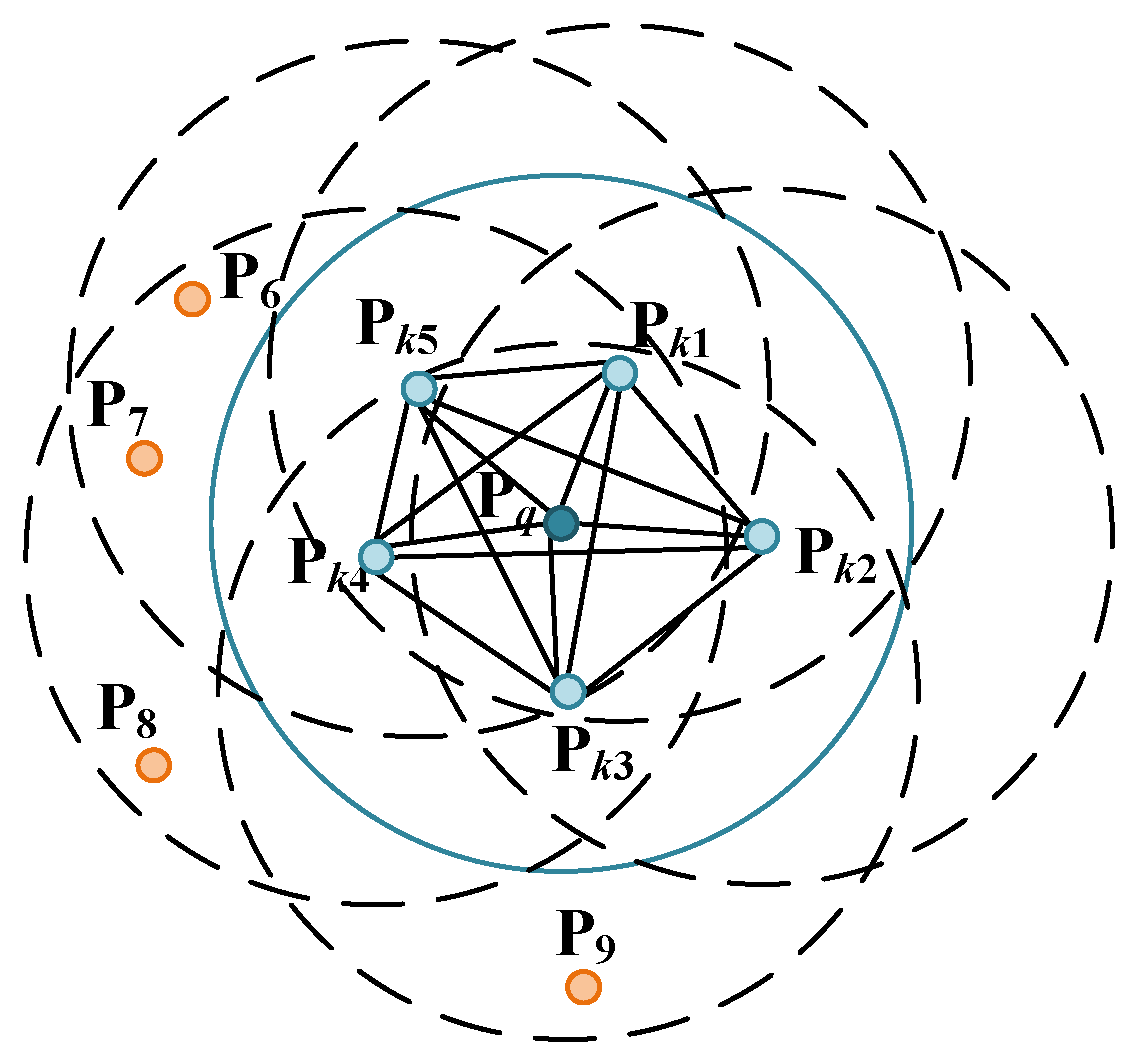
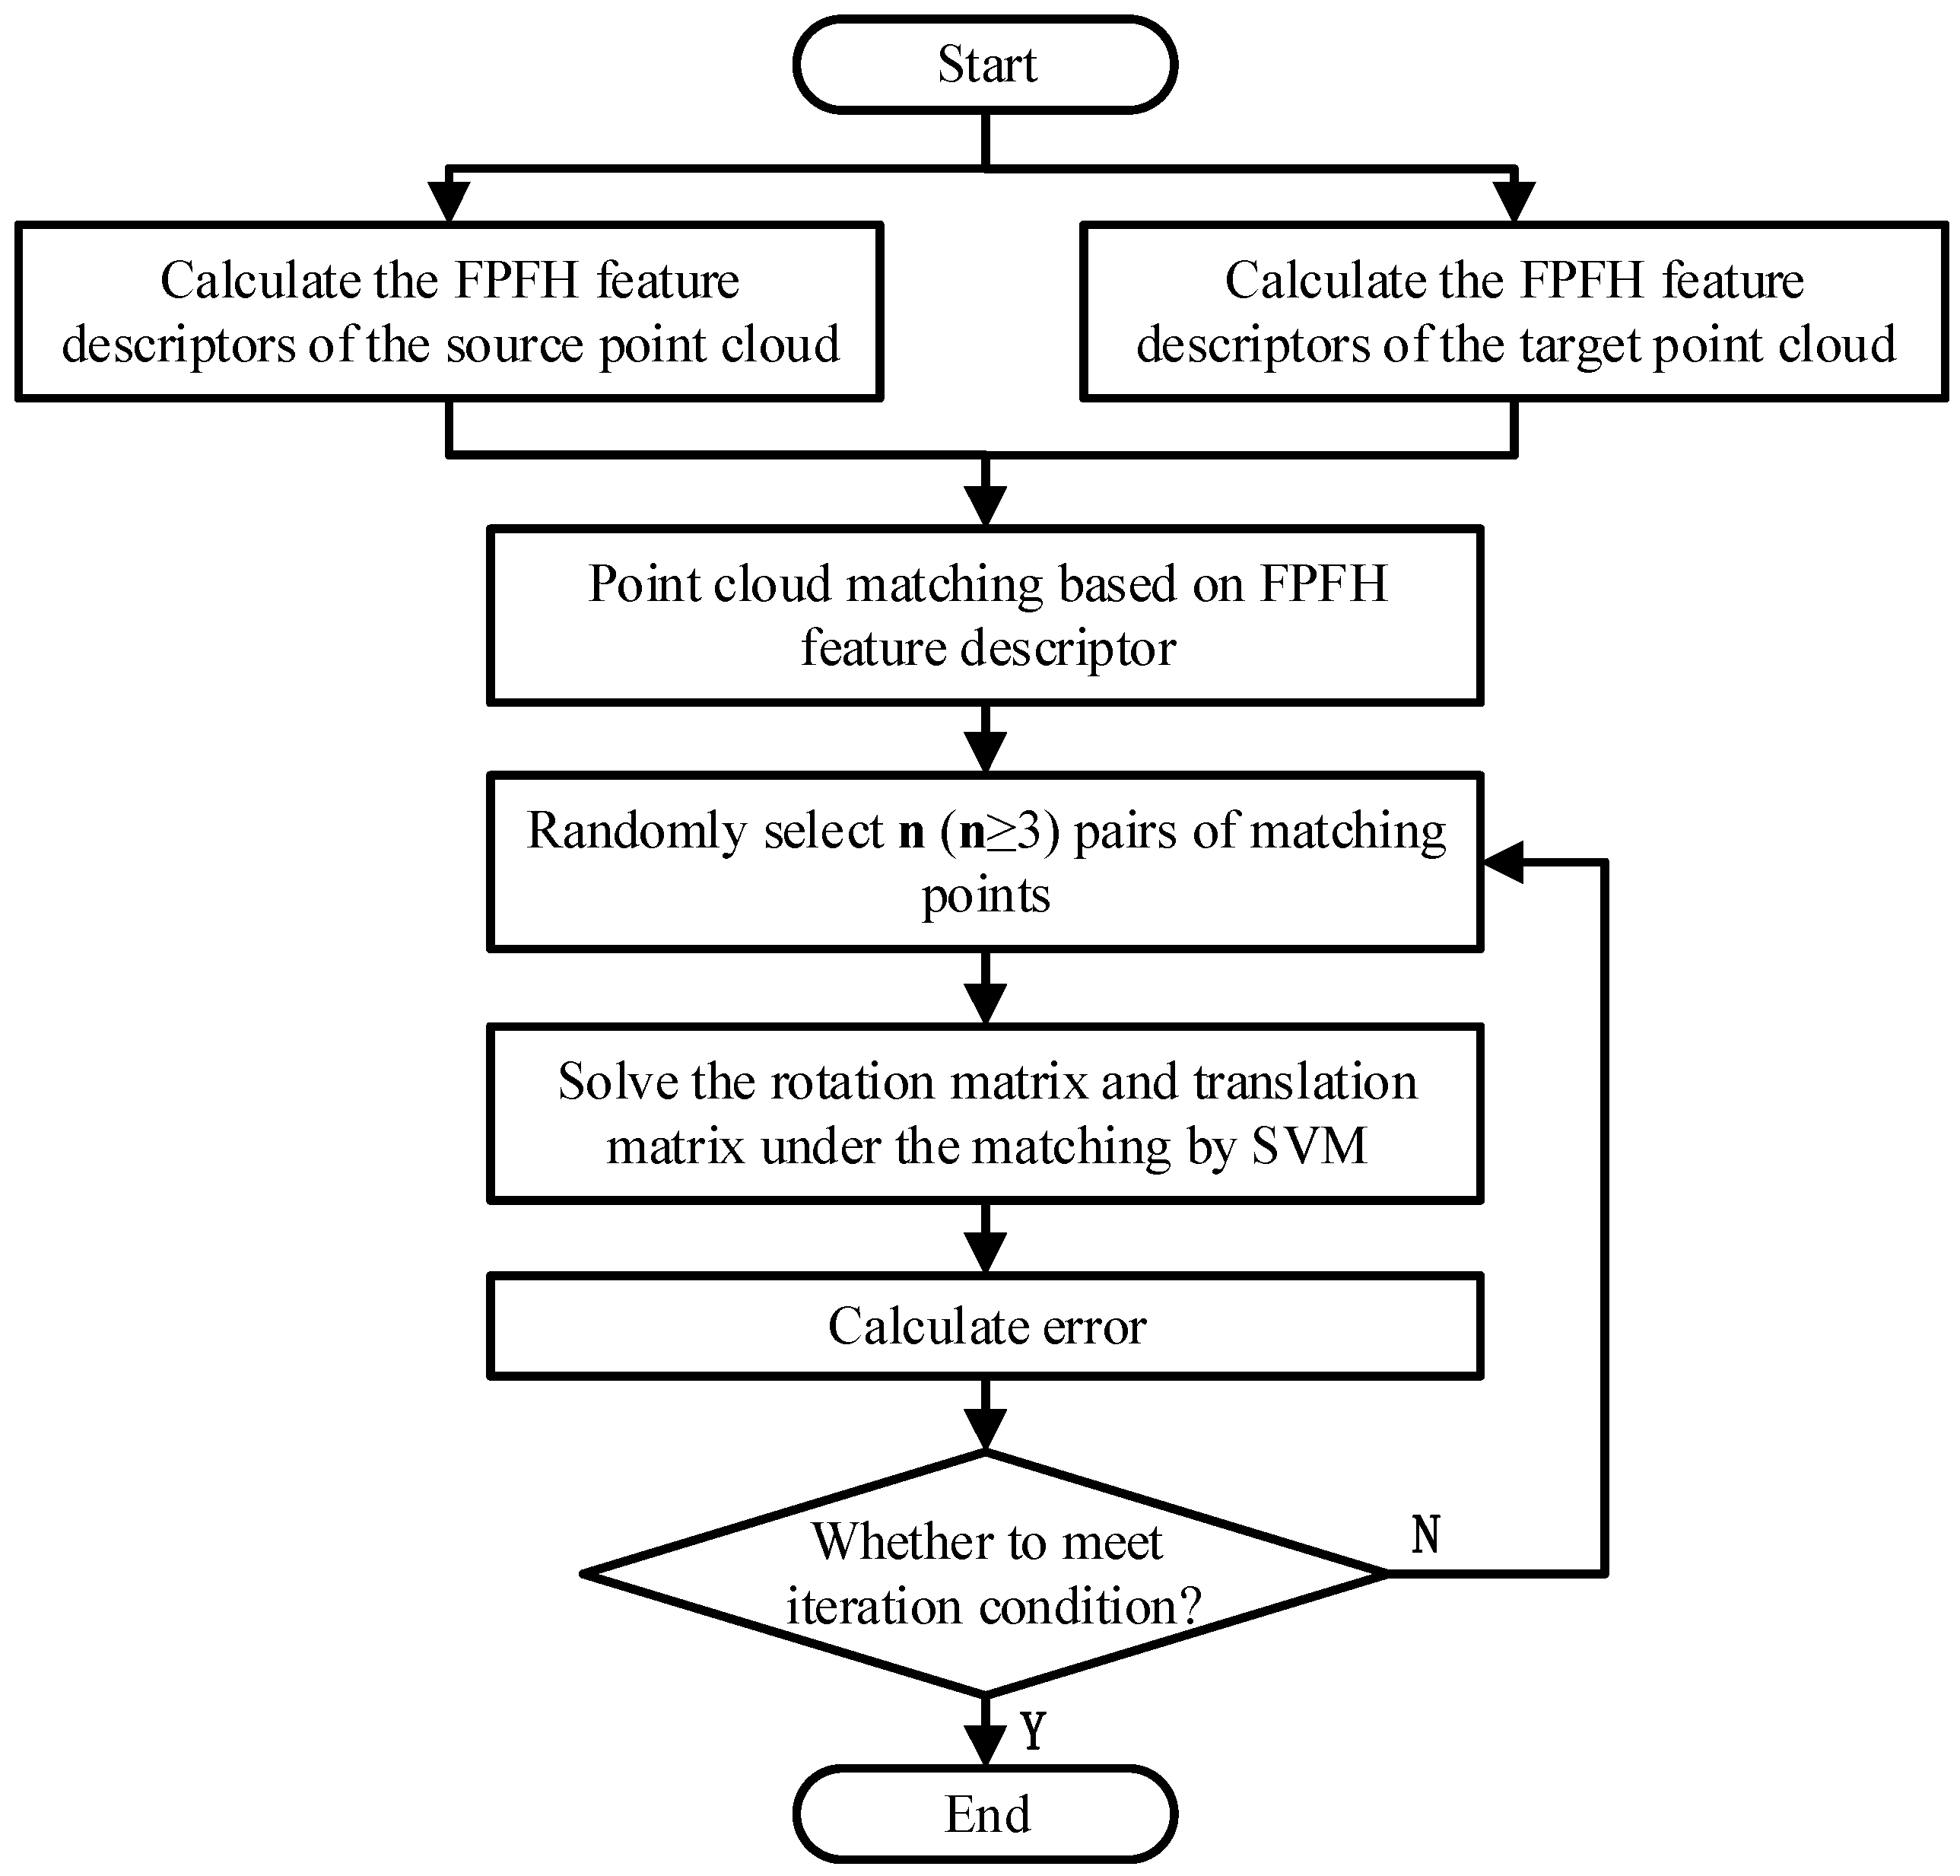
3.2. Object Pose Estimation Based on “SAC-IA Coarse Registration–ICP Precise Registration”
4. Experiment and Discussion
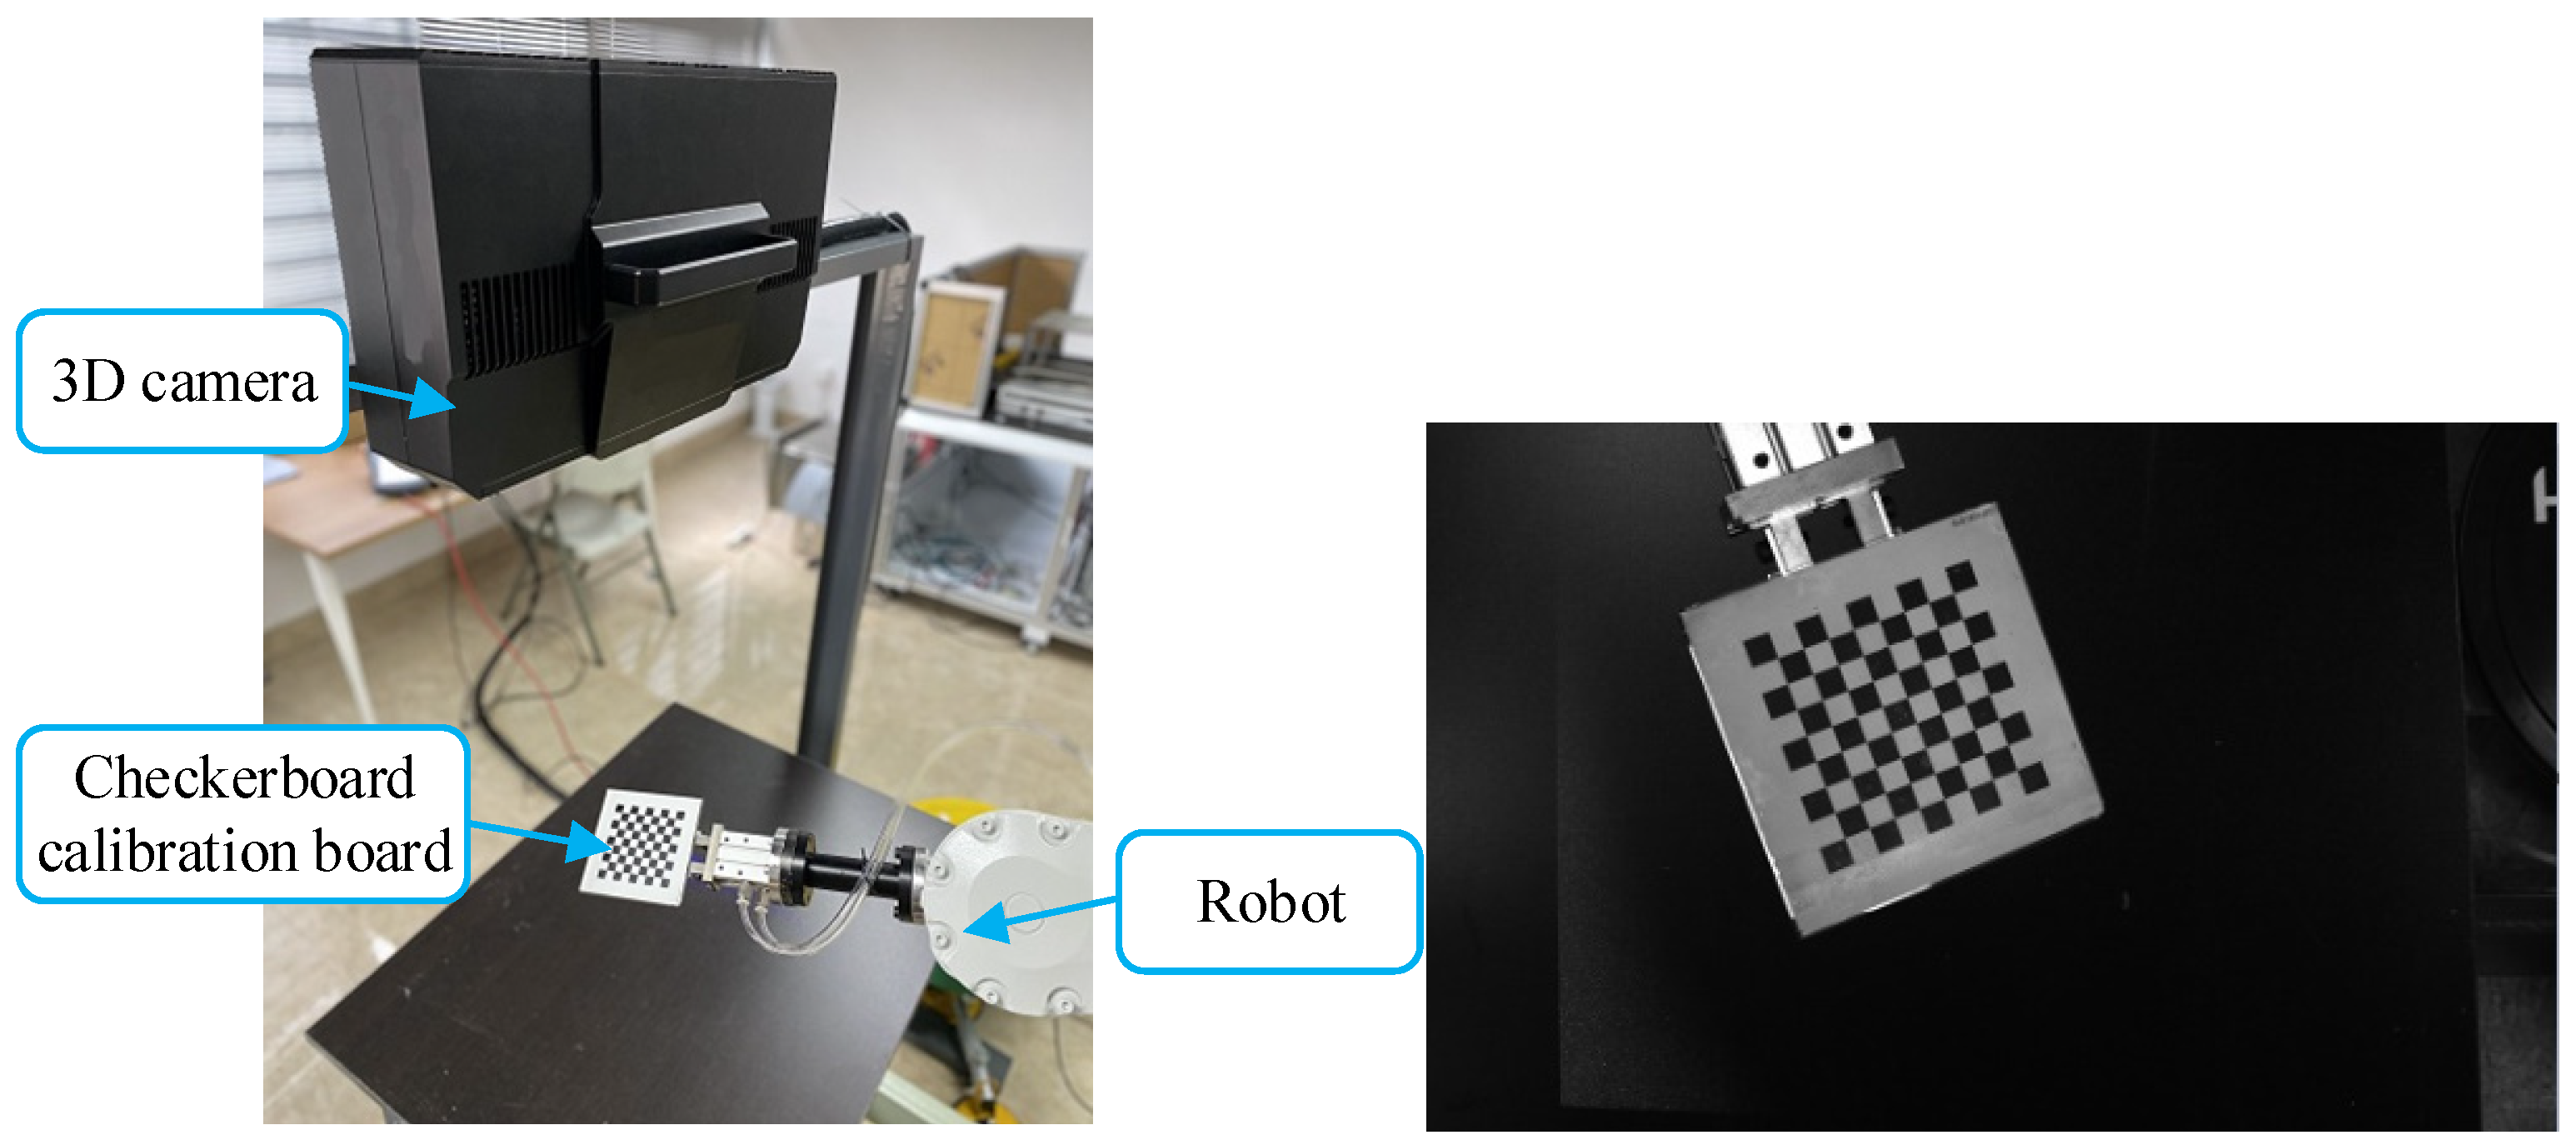
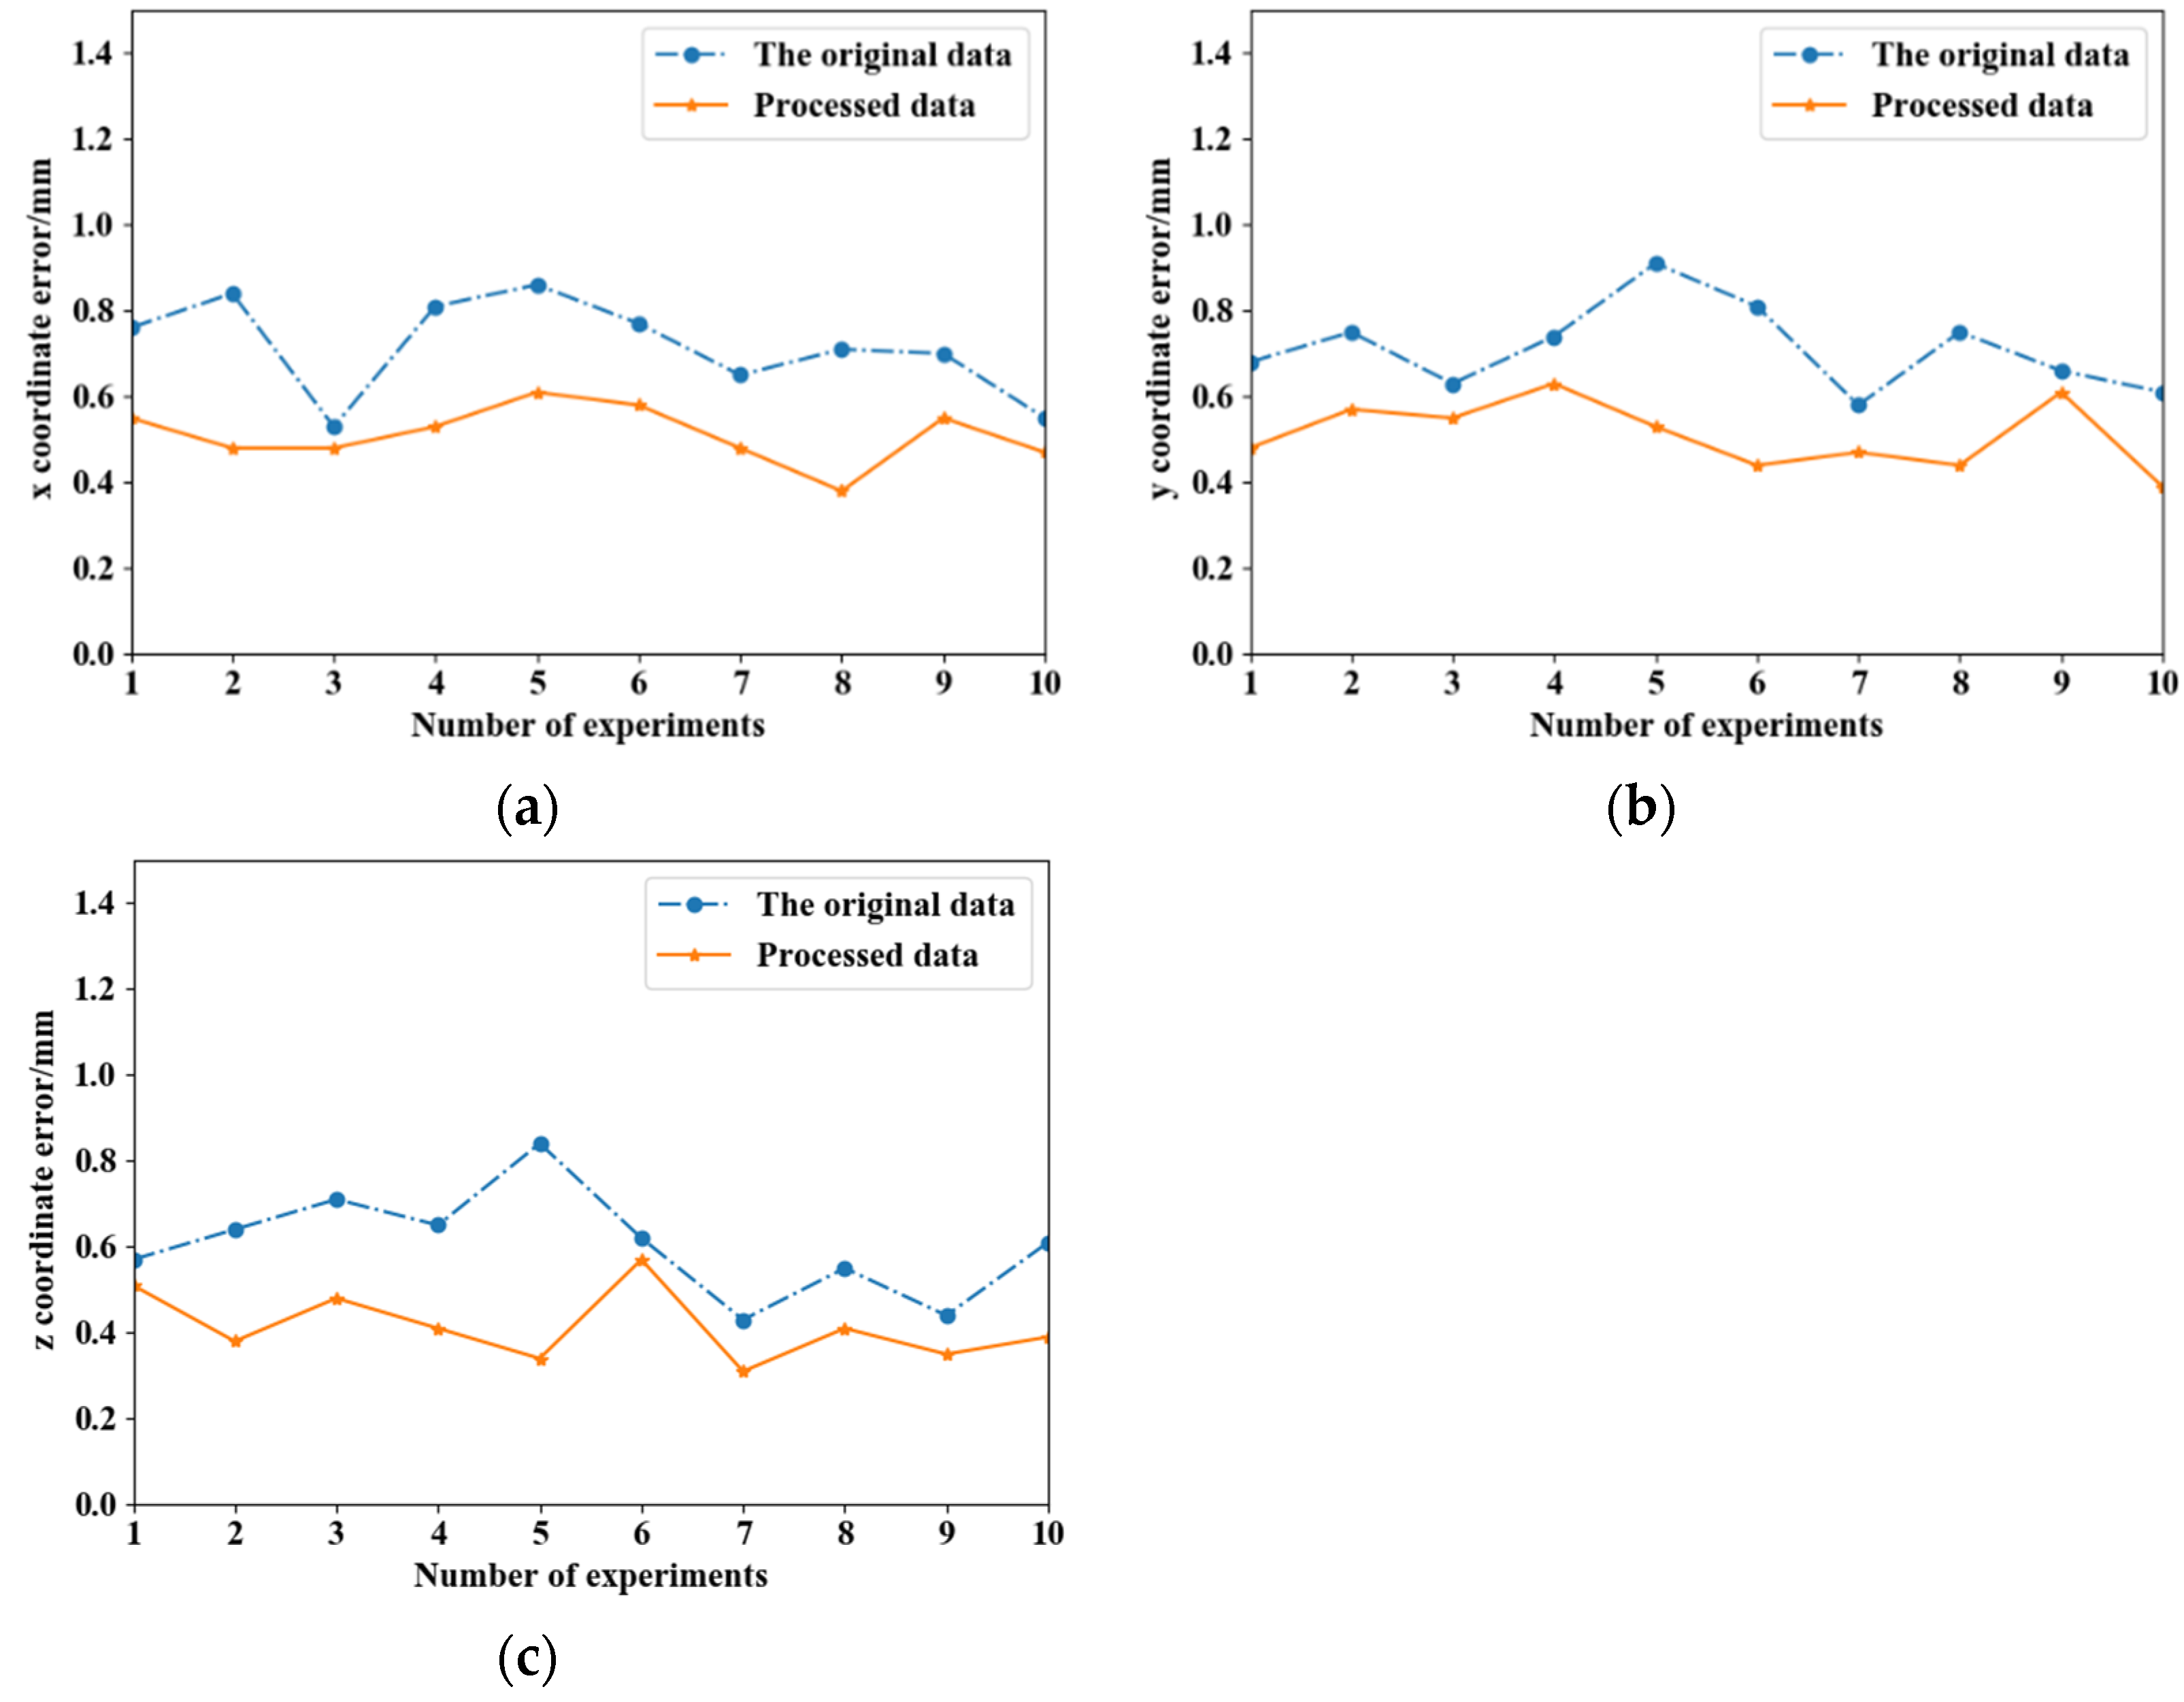
4.1. Hand–Eye Calibration Experiment
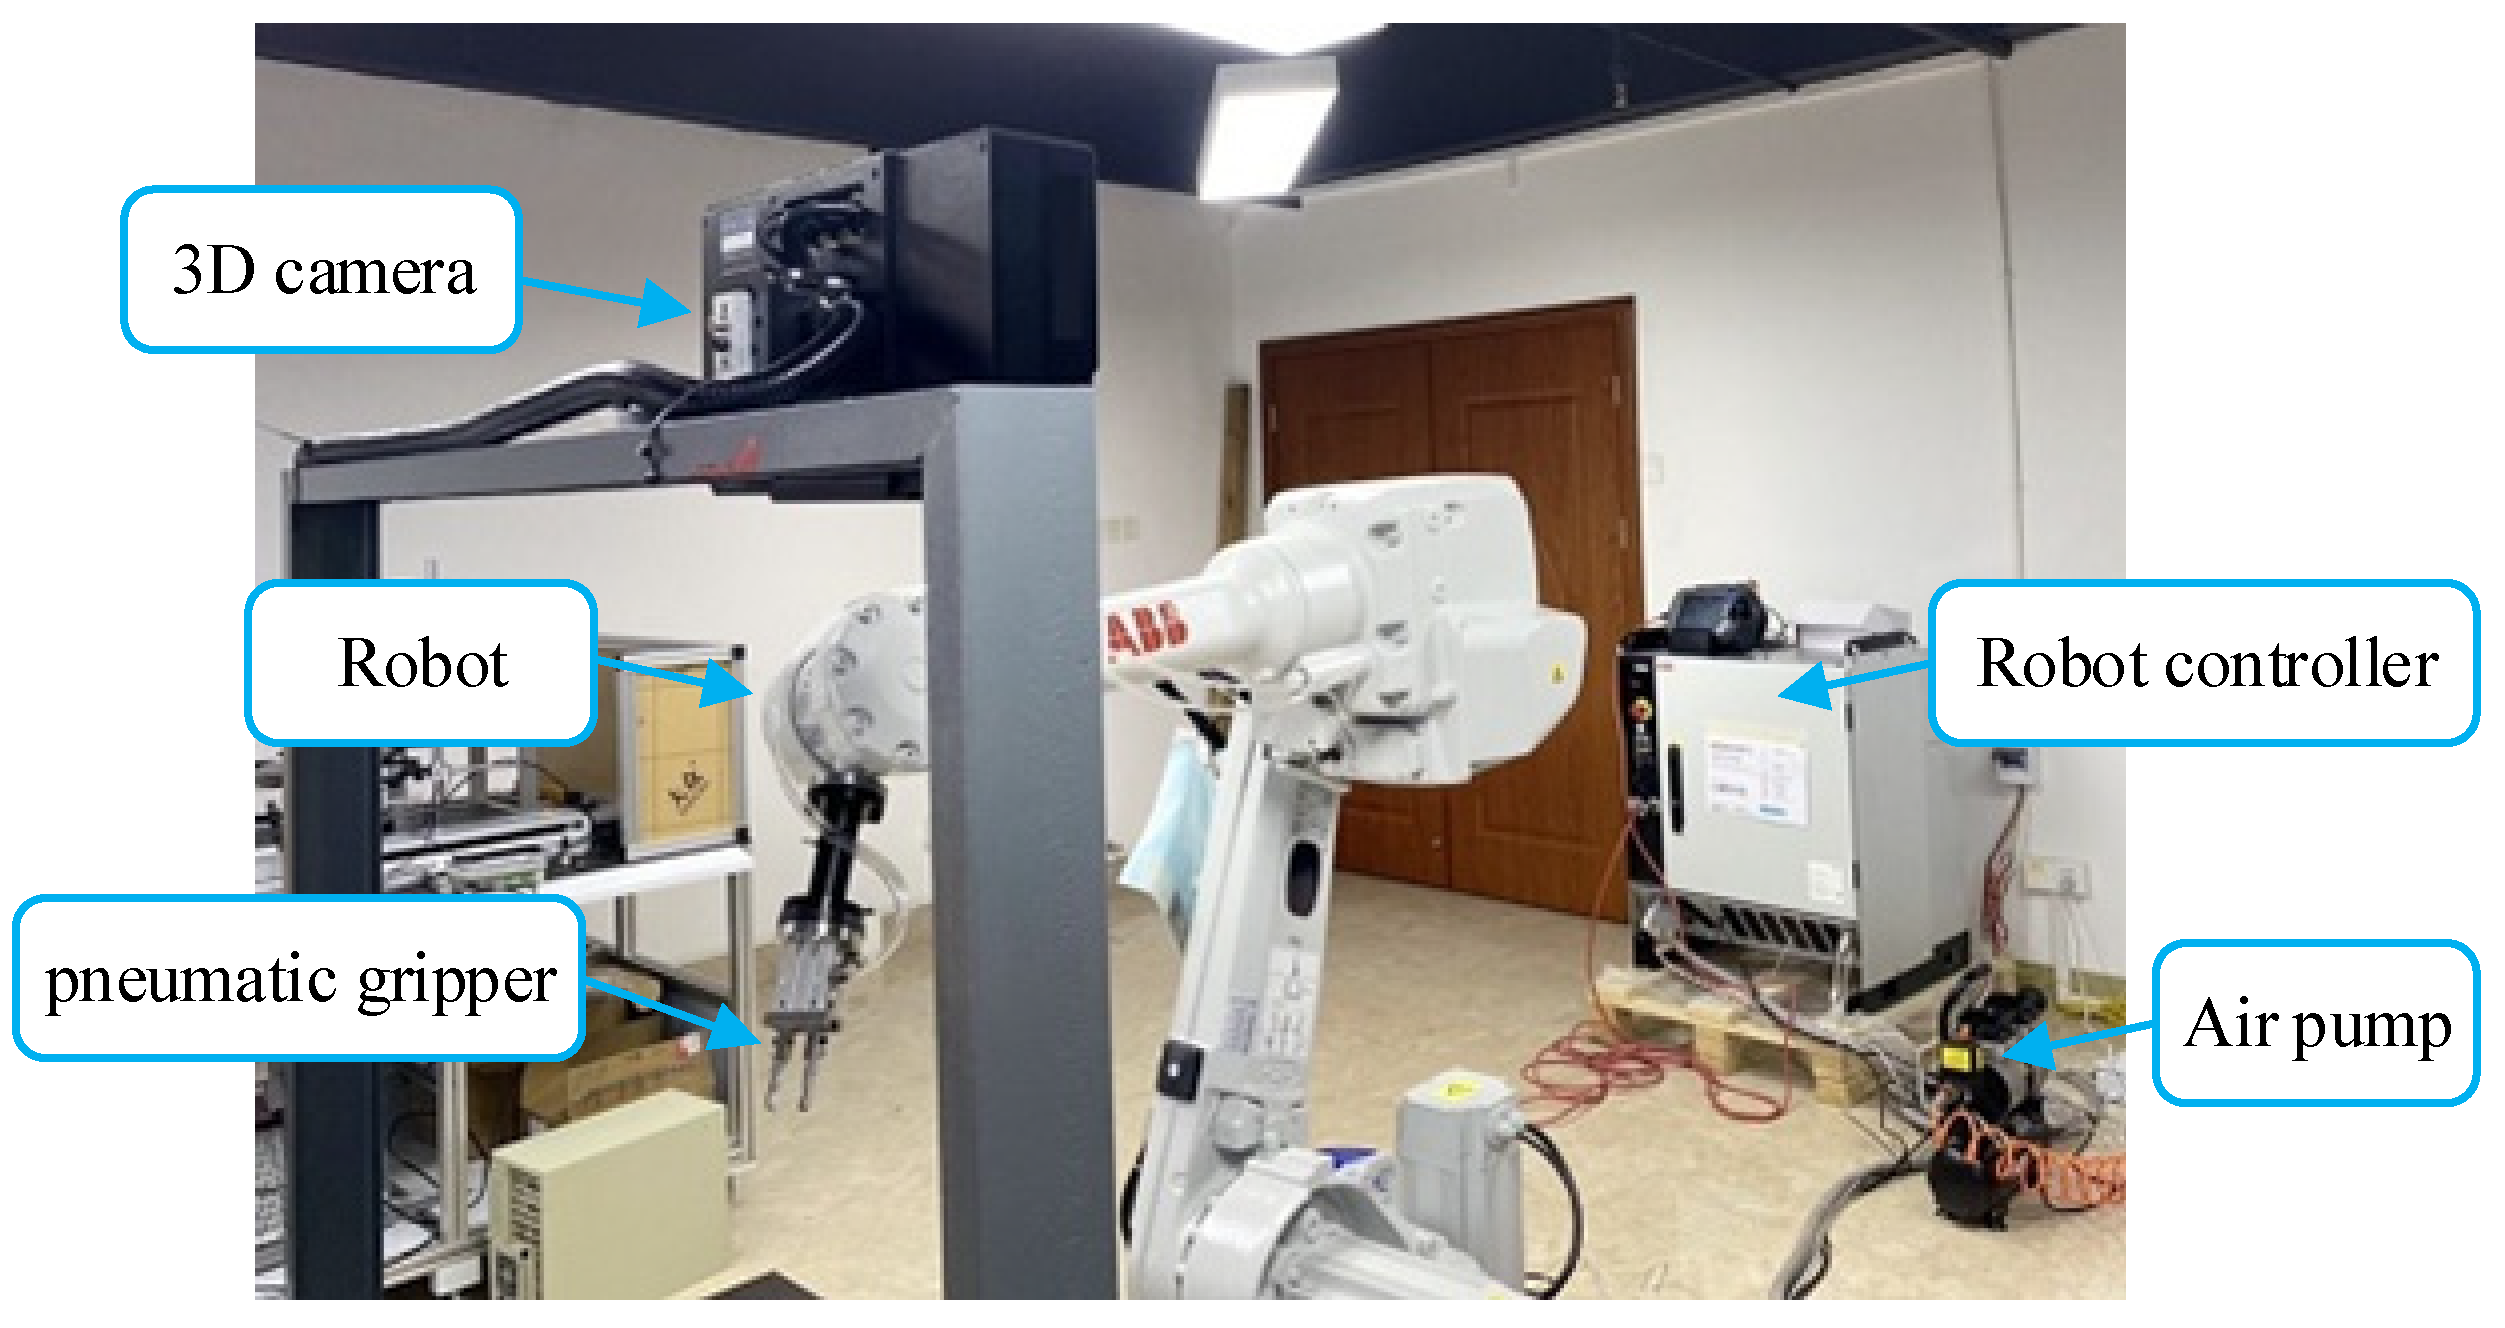
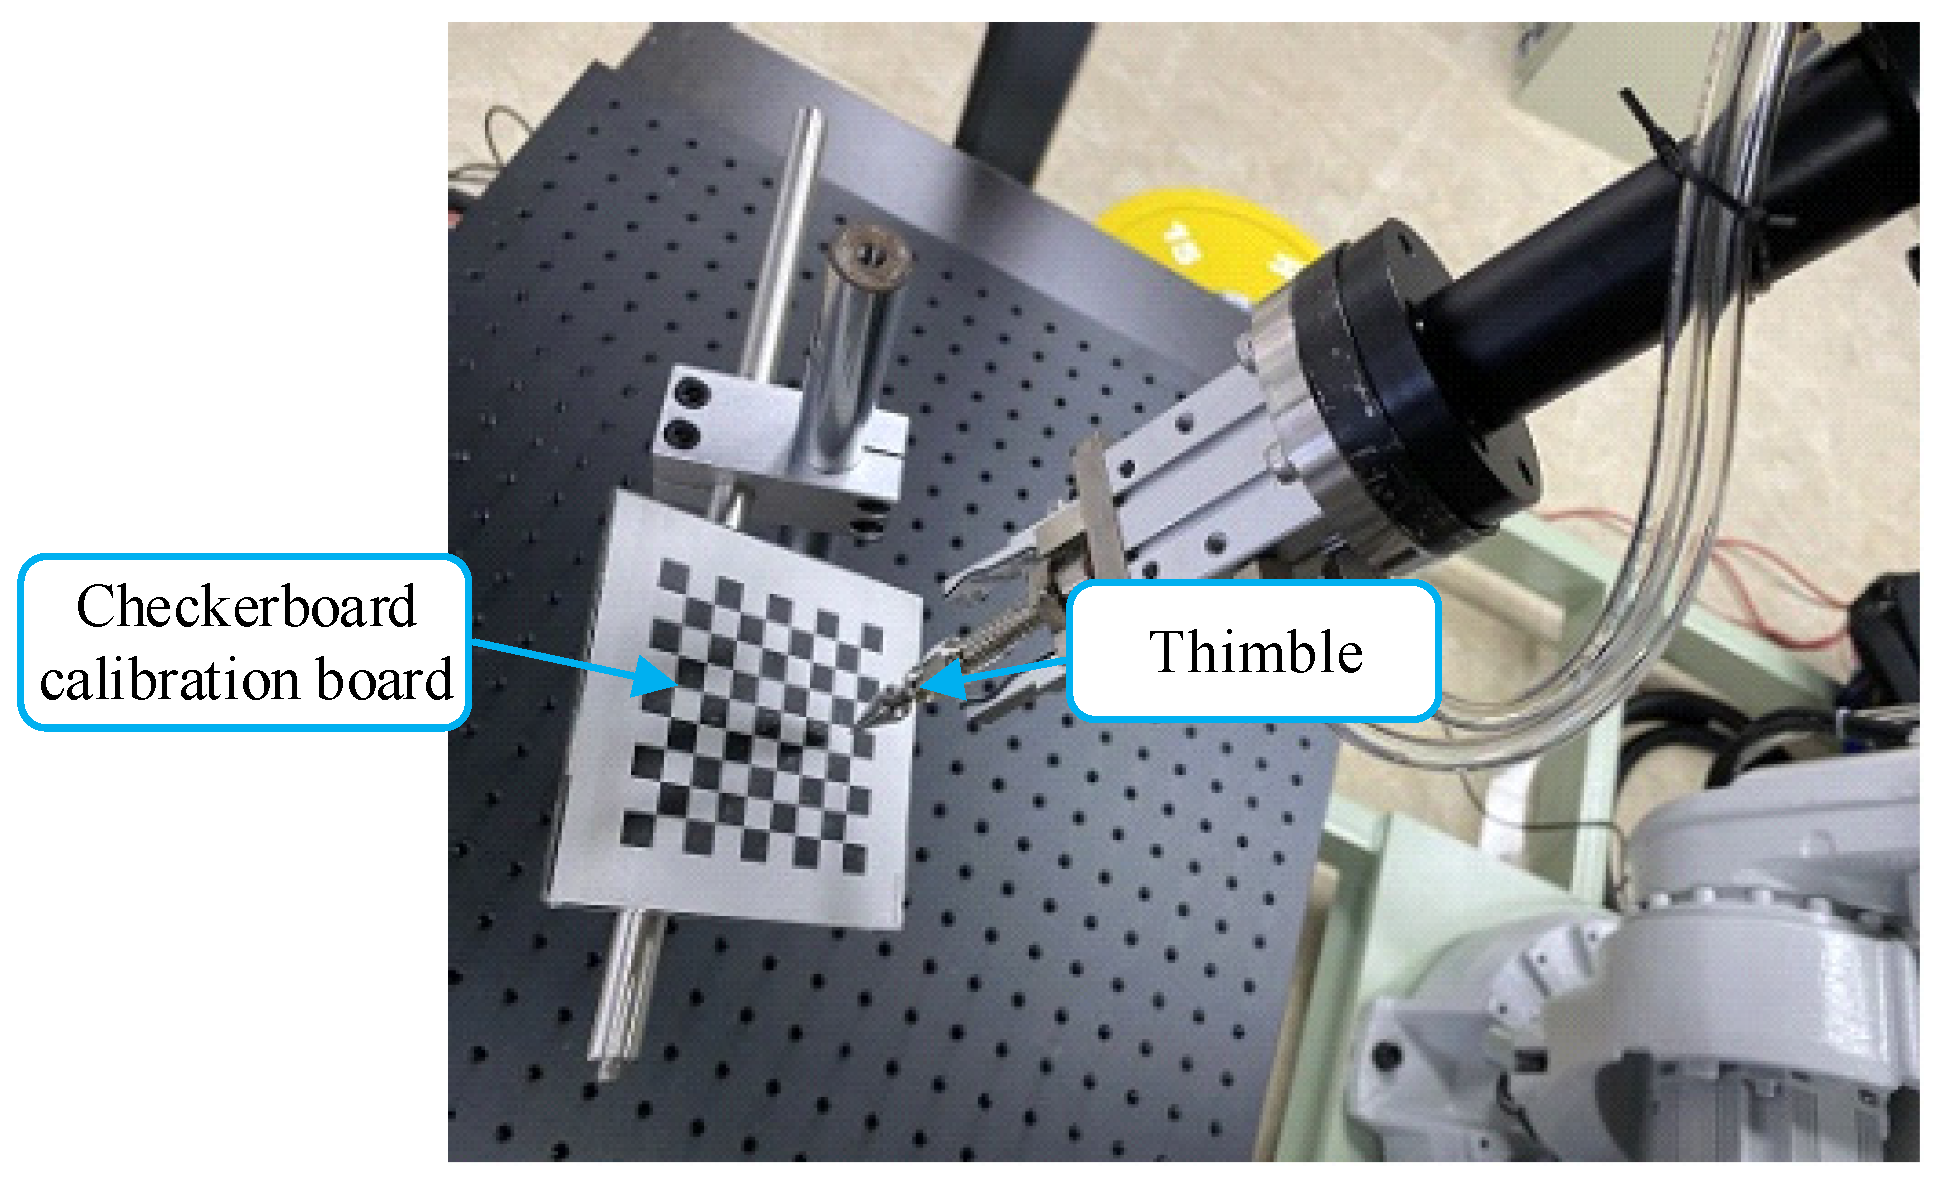
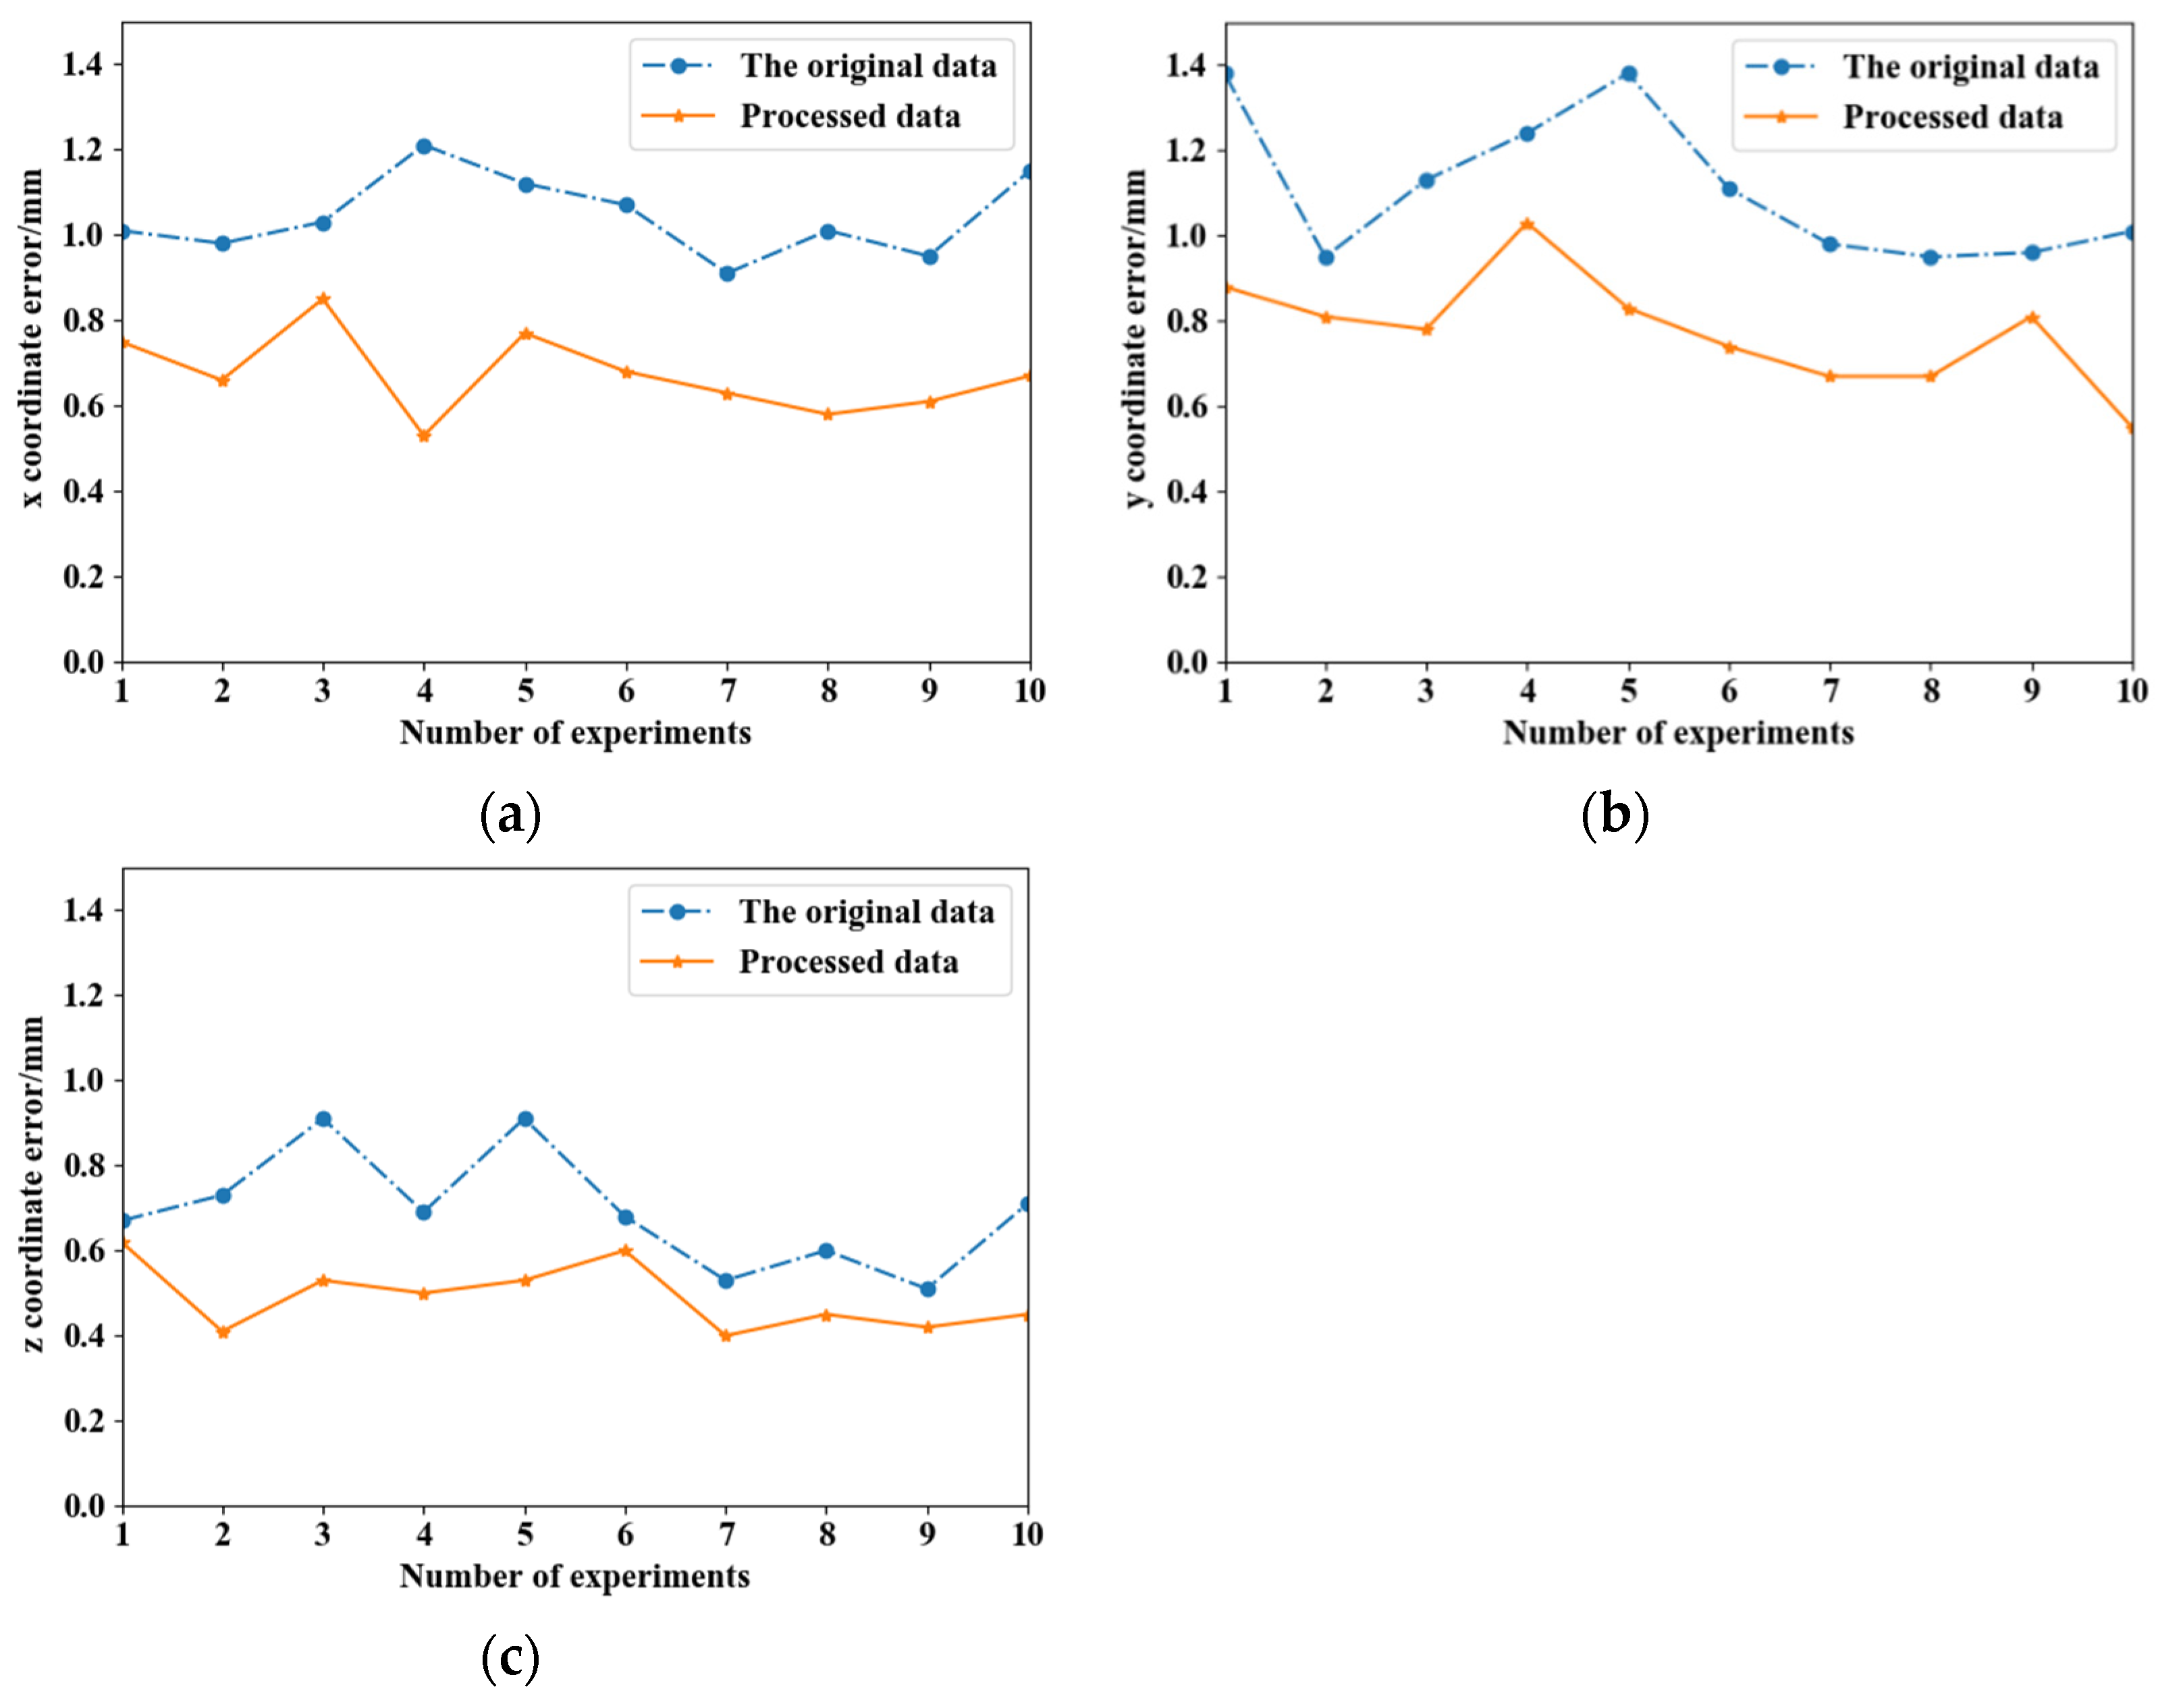
4.2. Pose Estimation and Assembly Experiment
5. Conclusions
Author Contributions
Funding
Data Availability Statement
Conflicts of Interest
References
- Peng, G.L.; Ji, M.Y.; Xue, Y.; Sun, Y. Development of a novel integrated automated assembly system for large volume components in outdoor environment. Measurement 2021, 168, 108294. [Google Scholar] [CrossRef]
- Wang, S.; Chen, G.D.; Xu, H.; Wang, Z. A robotic peg-in-hole assembly strategy based on variable compliance center. IEEE Access 2019, 7, 167534–167546. [Google Scholar] [CrossRef]
- Zeng, F.; Xiao, J.L.; Liu, H.T. Force/torque sensorless compliant control strategy for assembly tasks using a 6-DOF collaborative robot. IEEE Access 2019, 7, 108795–108805. [Google Scholar] [CrossRef]
- Gai, Y.H.; Guo, J.M.; Wu, D.; Chen, K. Feature-Based Compliance Control for Precise Peg-in-Hole Assembly. arXiv 2020, arXiv:2021.3112990. [Google Scholar] [CrossRef]
- Park, H.; Park, J.; Lee, D.-H.; Park, J.-H.; Bae, J.-H. Compliant peg-in-hole assembly using partial spiral force trajectory with tilted peg posture. IEEE Robot. Autom. Lett. 2020, 5, 4447–4454. [Google Scholar] [CrossRef]
- Ma, Y.Q.; Du, K.; Zhou, D.F.; Zhang, J.; Liu, X.L.; Xu, D. Automatic precision robot assembly system with microscopic vision and force sensor. Int. J. Adv. Robot. Syst. 2019, 16, 172988141985161. [Google Scholar] [CrossRef] [Green Version]
- Li, C.; Chen, P.; Xu, X.; Wang, X.Y.; Yin, A.J. A Coarse-to-Fine Method for Estimating the Axis Pose Based on 3D Point Clouds in Robotic Cylindrical Shaft-in-Hole Assembly. Sensors 2021, 21, 4064. [Google Scholar] [CrossRef]
- Liu, S.; Xing, D.-P.; Li, Y.-F.; Zhang, J.W.; Xu, D. Robust insertion control for precision assembly with passive compliance combining vision and force information. IEEE/ASME Trans. Mechatron. 2019, 24, 1974–1985. [Google Scholar] [CrossRef]
- Qin, F.B.; Xu, D.; Zhang, D.P.; Li, Y. Robotic skill learning for precision assembly with microscopic vision and force feedback. IEEE/ASME Trans. Mechatron. 2019, 24, 1117–1128. [Google Scholar] [CrossRef]
- Song, R.; Li, F.M.; Quan, W.; Yang, X.T.; Zhao, J. Skill learning for robotic assembly based on visual perspectives and force sensing. Robot. Auton. Syst. 2021, 135, 103651. [Google Scholar] [CrossRef]
- Wang, H.S.; Ni, H.; Wang, J.C.; Chen, W.D. Hybrid Vision/Force Control of Soft Robot Based on a Deformation Model. IEEE Trans. Control Syst. Technol. 2019, 29, 661–671. [Google Scholar] [CrossRef]
- Chang, W.C.; Weng, Y.H.; Tsai, Y.H.; Chang, C.L. Automatic robot assembly with eye-in-hand stereo vision. In Proceedings of the 2011 9th World Congress on Intelligent Control and Automation, Taipei, China, 21–25 June 2011; pp. 914–919. [Google Scholar]
- Jiang, T.; Cui, H.H.; Cheng, X.S. A calibration strategy for vision-guided robot assembly system of large cabin. Measurement 2020, 163, 107991. [Google Scholar] [CrossRef]
- Dong, D.W.; Yang, X.S.; Hu, H.P.; Lou, Y.J. Pose estimation of components in 3C products based on point cloud registration. In Proceedings of the 2019 IEEE International Conference on Robotics and Biomimetics (ROBIO), Dali, China, 20 January 2020; pp. 340–345. [Google Scholar]
- Yan, S.H.; Tao, X.; Xu, D. High-precision robotic assembly system using three-dimensional vision. Int. J. Adv. Robot. Syst. 2021, 18, 172988142110270. [Google Scholar] [CrossRef]
- Litvak, Y.; Biess, A.; Bar-Hillel, A. Learning Pose Estimation for High-Precision Robotic Assembly Using Simulated Depth Images. In Proceedings of the 2019 International Conference on Robotics and Automation (ICRA), Montreal, QC, Canada, 20–24 May 2019; pp. 3521–3527. [Google Scholar]
- Li, C.H.G.; Chang, Y.M. Automated visual positioning and precision placement of a workpiece using deep learning. Int. J. Adv. Manuf. Technol. 2019, 104, 4527–4538. [Google Scholar] [CrossRef]
- Bedaka, A.K.; Lee, S.C.; Mahmoud, A.M.; Cheng, Y.S.; Lin, C.-Y. A Camera-Based Position Correction System for Autonomous Production Line Inspection. Sensors 2021, 21, 4071. [Google Scholar] [CrossRef]
- Qiu, S.W.; Wang, M.M.; Kermani, M.R. A New Formulation for Hand–Eye Calibrations as Point-Set Matching. IEEE Trans. Instrum. Meas. 2020, 69, 6490–6498. [Google Scholar] [CrossRef]
- Hua, J.; Zeng, L.C. Hand–Eye Calibration Algorithm Based on an Optimized Neural Network. Actuators 2021, 10, 85. [Google Scholar] [CrossRef]
- Ronneberger, O.; Fischer, P.; Brox, T. U-net: Convolutional networks for biomedical image segmentation. In Proceedings of the International Conference on Medical Image Computing and Computer-Assisted Intervention, Munich, Germany, 5–9 October 2015; pp. 234–241. [Google Scholar]
- Woo, S.; Park, J.; Lee, J.Y.; Kweon, I.S. Cbam: Convolutional block attention module. In Proceedings of the European Conference on Computer Vision (ECCV), Munich, Germany, 8–14 September 2018; pp. 3–19. [Google Scholar]
- Biber, P. The normal distributions transform: A new approach to laser scan matching. In Proceedings of the 2003 IEEE/RSJ International Conference on Intelligent Robots and Systems (IROS 2003), Las Vegas, NV, USA, 27–31 October 2003; pp. 2743–2748. [Google Scholar]
- Arun, K.S.; Huang, T.S.; Blostein, S.D. Least-squares fitting of two 3-D point sets. IEEE Trans. Pattern Anal. Mach. Intell. 1987, 9, 698–700. [Google Scholar] [CrossRef] [Green Version]
- Besl, P.J.; Mckay, H.D. A method for registration of 3-D shapes. IEEE Trans. Pattern Anal. Mach. Intell. 1992, 14, 239–256. [Google Scholar] [CrossRef]
- Rusu, R.B.; Blodow, N.; Beetz, M. Fast point feature histograms (FPFH) for 3D registration. In Proceedings of the 2009 IEEE International Conference on Robotics and Automation, Kobe, Japan, 12–17 May 2009; pp. 3212–3217. [Google Scholar]
- Oktay, O.; Schlemper, J.; Folgoc, L.L.; Lee, M.; Heinrich, M.; Misawa, K.; Mori, K.; Mcdonagh, S.; Hammerla, N.Y.; Kainz, B. Attention u-net: Learning where to look for the pancreas. arXiv 2018, arXiv:1804.03999. [Google Scholar]
- Alom, M.Z.; Yakopcic, C.; Taha, T.M.; Asari, V.K. Nuclei segmentation with recurrent residual convolutional neural networks-based U-Net (R2U-Net). In Proceedings of the NAECON 2018-IEEE National Aerospace and Electronics Conference, Dayton, OH, USA, 23–26 July 2018; pp. 228–233. [Google Scholar]
- Chen, L.C.; Zhu, Y.; Papandreou, G.; Schroff, F.; Adam, H. Encoder-decoder with atrous separable convolution for semantic image segmentation. In Proceedings of the European Conference on Computer Vision (ECCV), Munich, Germany, 8–14 September 2018; pp. 801–818. [Google Scholar]
- Wong, J.M.; Kee, V.; Le, T.; Wagner, S.; Mariottini, G.L.; Schneider, A.; Hamilton, L.; Hebert, M.; Johnson, D.M.S.; Wu, J.; et al. Segicp: Integrated deep semantic segmentation and pose estimation. In Proceedings of the 2017 IEEE/RSJ International Conference on Intelligent Robots and Systems (IROS), Vancouver, BC, Canada, 24–28 September 2017; pp. 5784–5789. [Google Scholar]
- Van-Tran, L.; Lin, H.Y. BiLuNetICP: A Deep Neural Network for Object Semantic Segmentation and 6D Pose Recognition. IEEE Sens. J. 2020, 21, 11748–11757. [Google Scholar] [CrossRef]
- Xiang, Y.; Schmidt, T.; Narayanan, V.; Fox, D. Posecnn: A convolutional neural network for 6d object pose estimation in cluttered scenes. arXiv 2017, arXiv:1711.00199. [Google Scholar]
- Yang, J.; Li, H.; Campbell, D.; Jia, Y.D. Go-ICP: A globally optimal solution to 3D ICP point-set registration. IEEE Trans. Pattern Anal. Mach. Intell. 2015, 38, 241–2254. [Google Scholar] [CrossRef] [Green Version]
- Glowinski, S.; Obst, M.; Majdanik, S.; Potocka-Banas, B. Dynamic Model of a Humanoid Exoskeleton of a Lower Limb with Hydraulic Actuators. Sensors 2021, 21, 3432. [Google Scholar] [CrossRef]
- Campos, B.A.N.; Motta, J.M.S.T. Online Measuring of Robot Positions Using Inertial Measurement Units, Sensor Fusion and Artificial Intelligence. IEEE Access 2021, 9, 5678–5689. [Google Scholar] [CrossRef]


Publisher’s Note: MDPI stays neutral with regard to jurisdictional claims in published maps and institutional affiliations. |
© 2022 by the authors. Licensee MDPI, Basel, Switzerland. This article is an open access article distributed under the terms and conditions of the Creative Commons Attribution (CC BY) license (https://creativecommons.org/licenses/by/4.0/).
Share and Cite
Liang, P.; Lin, W.; Luo, G.; Zhang, C. Research of Hand–Eye System with 3D Vision towards Flexible Assembly Application. Electronics 2022, 11, 354. https://doi.org/10.3390/electronics11030354
Liang P, Lin W, Luo G, Zhang C. Research of Hand–Eye System with 3D Vision towards Flexible Assembly Application. Electronics. 2022; 11(3):354. https://doi.org/10.3390/electronics11030354
Chicago/Turabian StyleLiang, Peidong, Wenwei Lin, Guantai Luo, and Chentao Zhang. 2022. "Research of Hand–Eye System with 3D Vision towards Flexible Assembly Application" Electronics 11, no. 3: 354. https://doi.org/10.3390/electronics11030354