Article

Detection of Diseases in Pandemic: A Predictive Approach Using Stack Ensembling on Multi-Modal Imaging Data

1
Department of Computer Science, COMSATS University Islamabad, Islamabad 44500, Pakistan
2
Department of Computing, School of Electrical Engineering & Computer Science (SEECS), National University of Sciences and Technology (NUST), Islamabad 44500, Pakistan
3
Institute of Computing, Kohat University of Science and Technology (KUST), Kohat 26000, Pakistan
4
Centre for Smart Systems, AI and Cybersecurity, Staffordshire University, Stoke on Trent ST4 2DF, UK
5
Department of Physics, Shaheed Benazir Bhutto Women University Peshawar, Peshawar 25500, Pakistan
*
Author to whom correspondence should be addressed.
Electronics 2022, 11(23), 3974; https://doi.org/10.3390/electronics11233974
Submission received: 30 October 2022 / Revised: 17 November 2022 / Accepted: 21 November 2022 / Published: 30 November 2022
(This article belongs to the Special Issue Signal and Image Processing Applications in Artificial Intelligence)

Abstract

:
Deep Learning (DL) in Medical Imaging is an emerging technology for diagnosing various diseases, i.e., pneumonia, lung cancer, brain stroke, breast cancer, etc. In Machine Learning (ML) and traditional data mining approaches, feature extraction is performed before building a predictive model, which is a cumbersome task. In the case of complex data, there are a lot of challenges, such as insufficient domain knowledge while performing feature engineering. With the advancement in the application of Artificial Neural Networks (ANNs) and DL, ensemble learning is an essential foundation for developing an automated diagnostic system. Medical Imaging with different modalities is effective for the detailed analysis of various chronic diseases, in which the healthy and infected scans of multiple organs are compared and analyzed. In this study, the transfer learning approach is applied to train 15 state-of-the-art DL models on three datasets (X-ray, CT-scan and Ultrasound) for predicting diseases. The performance of these models is evaluated and compared. Furthermore, a two-level stack ensembling of fine-tuned DL models is proposed. The DL models having the best performances among the 15 will be used for stacking in the first layer. Support Vector Machine (SVM) is used in Level 2 as a meta-classifier to predict the result as one of the following: pandemic positive (1) or negative (0). The proposed architecture has achieved 98.3%, 98.2% and 99% accuracy for D1, D2 and D3, respectively, which outperforms the performance of existing research. These experimental results and findings can be considered helpful tools for pandemic screening on chest X-rays, CT scan images and ultrasound images of infected patients. This architecture aims to provide clinicians with more accurate results.

1. Introduction

The rapid growth in Deep Learning (DL) technology helps in the development of accurate diagnostic tools by using labelled Medical Imaging data. However, results should be trustworthy and close to manual diagnosis. The main advantage of using DL methods is that the feature extraction is performed automatically with the help of convolutional layers and it beats the other traditional classification systems [1,2]. Many DL methods have been proposed such as Long Short Term Memory (LSTM) [3], Recurrent Neural Network (RNN), Deep Belief Network (DBN) [4], Convolutional Neural Network (CNN) and Capsule Network [5]. CNN works in the manner of the human brain and play a significant role in pandemic detection as they do not need manual feature extraction. The hidden layers having the power of feature learning can achieve high sensitivity and specificity in classifying or diagnosing diseases [6].
During the pandemic, researchers have been working on different Medical Imaging modalities and processing these data via DL models. A CNN is an important class of DL in which the input image as a pixel array is passed through different layers for processing. The convolutional layers are mainly for feature extraction. The properties of input images are learned by applying different sizes of filters, which is also called the kernel. After several convolutional layers, a feature map is generated. At this layer, ReLU or sigmoid are commonly used activation functions [7]. The pooling layers are used for size reduction or down-sampling and are usually applied between two convolutional layers. The main function of these layers is to lessen the computation power by applying down-sampling or reducing the size of the feature map. Max pooling and average pooling are commonly used pooling layers. The dense layer or fully connected layer is used before the output layer, which contains the softmax function to perform classification. In a dense layer, each input from the previous layer is connected to each neuron. Hence, it makes a fully connected layer.
Medical Imaging plays an important role in disease diagnosis, in which healthy and infected CT scans or X-ray are compared and analyzed by expert radiologists [
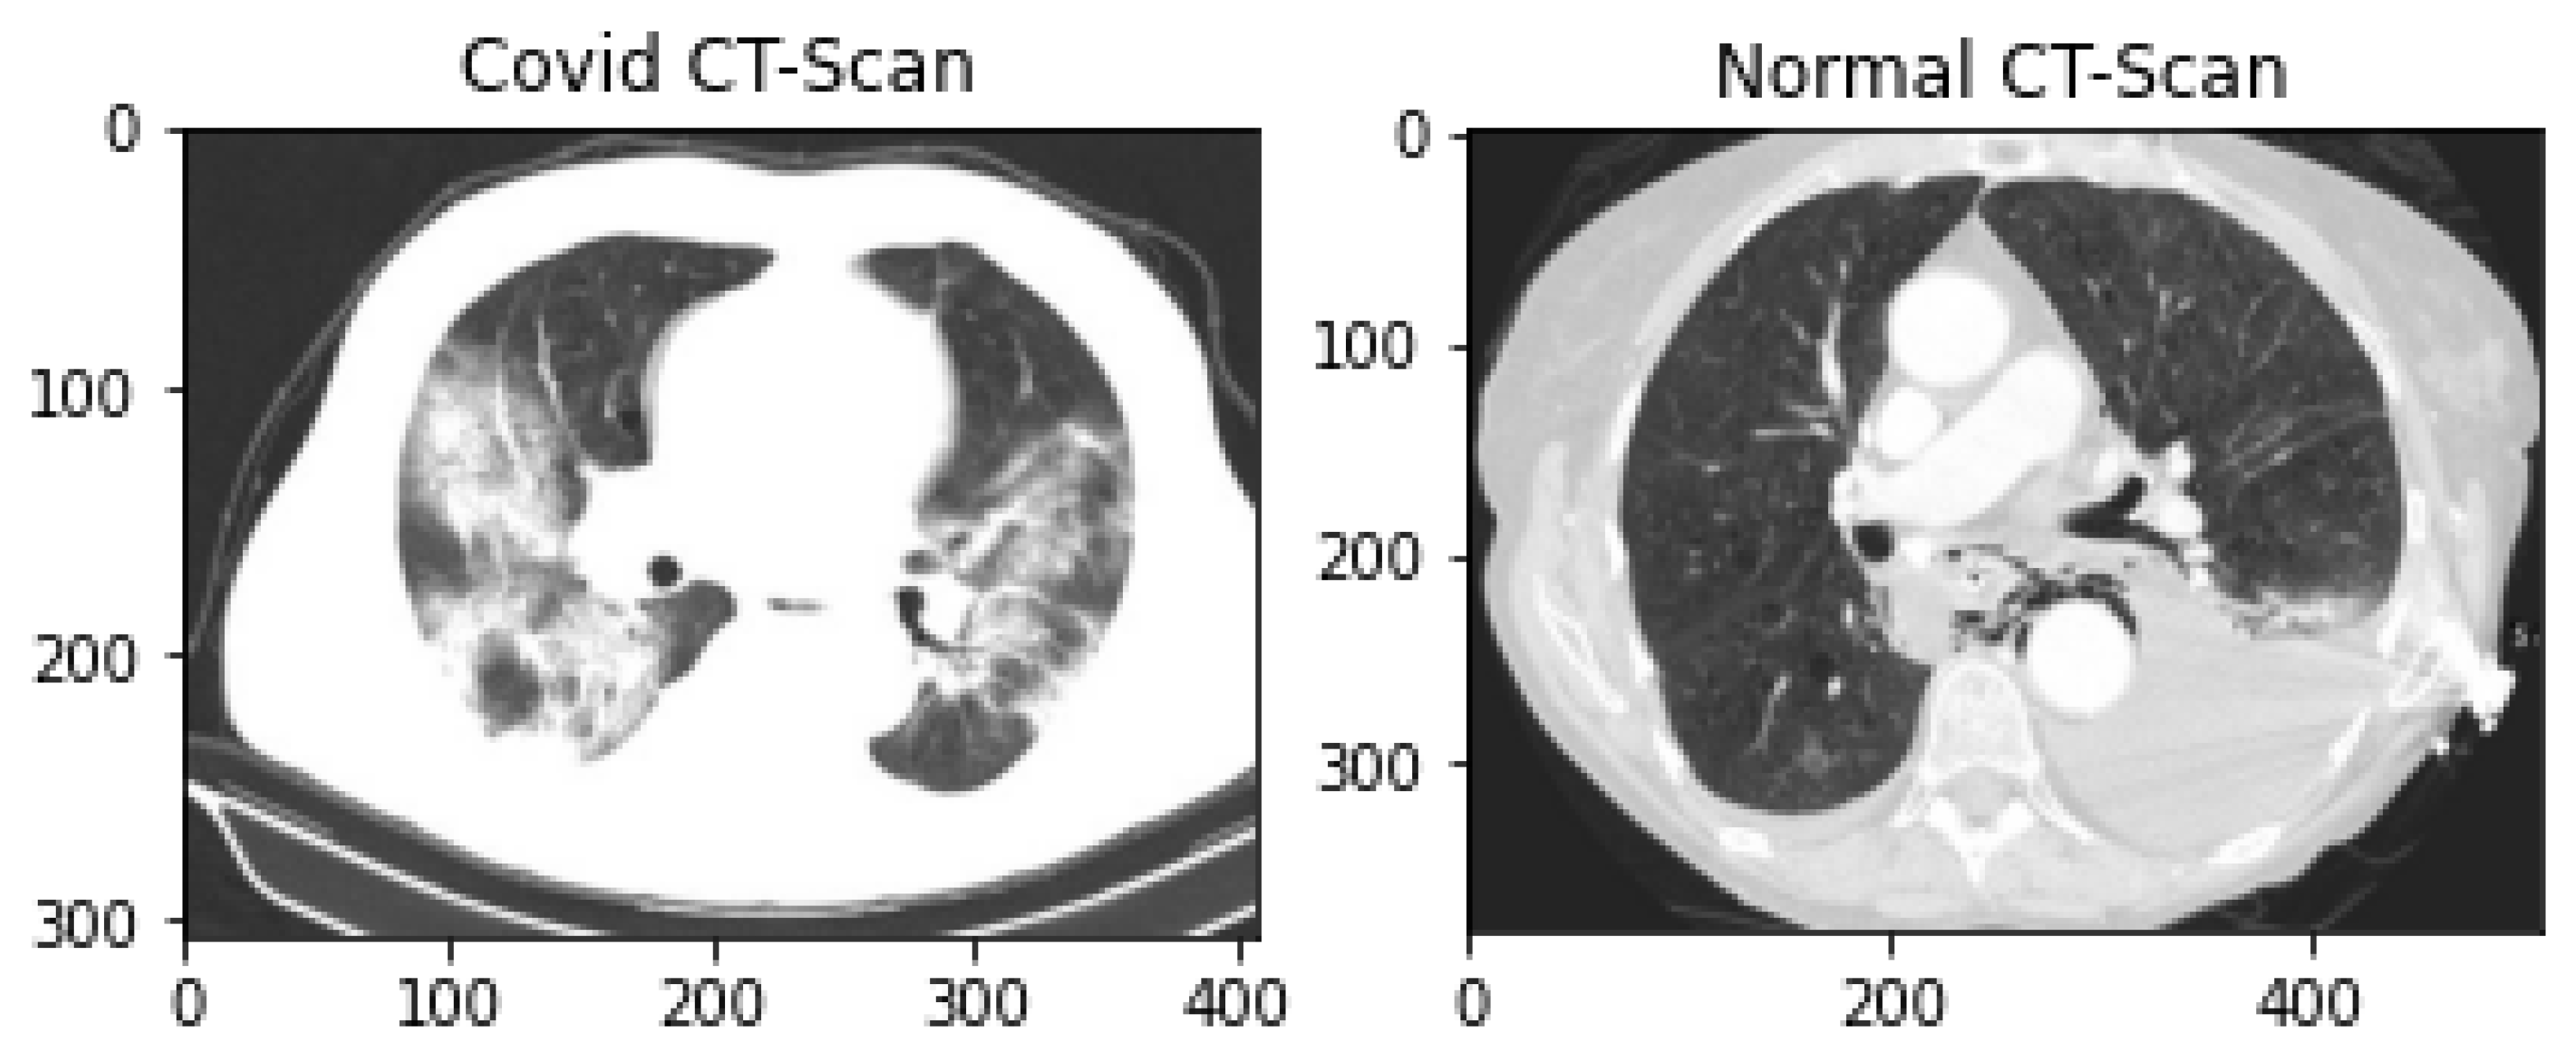
8]. Various studies show that different image modalities have their own merits and demerits regarding health risks, cost, sensitivity, specificity and accuracy. CT scans have high sensitivity and also high specificity, which means that they have high accuracy in terms of positive cases while having low accuracy in other classes [9].
CT scans are 360-degree cross-sectional images generated by CAT scanners. These scans are a series of X-rays taken from various angles, providing a more detailed visualization of bones, tissues and internal organs. Moreover, it is harmful to patients having many sessions of CT scans due to long time exposure to X-ray radiations [
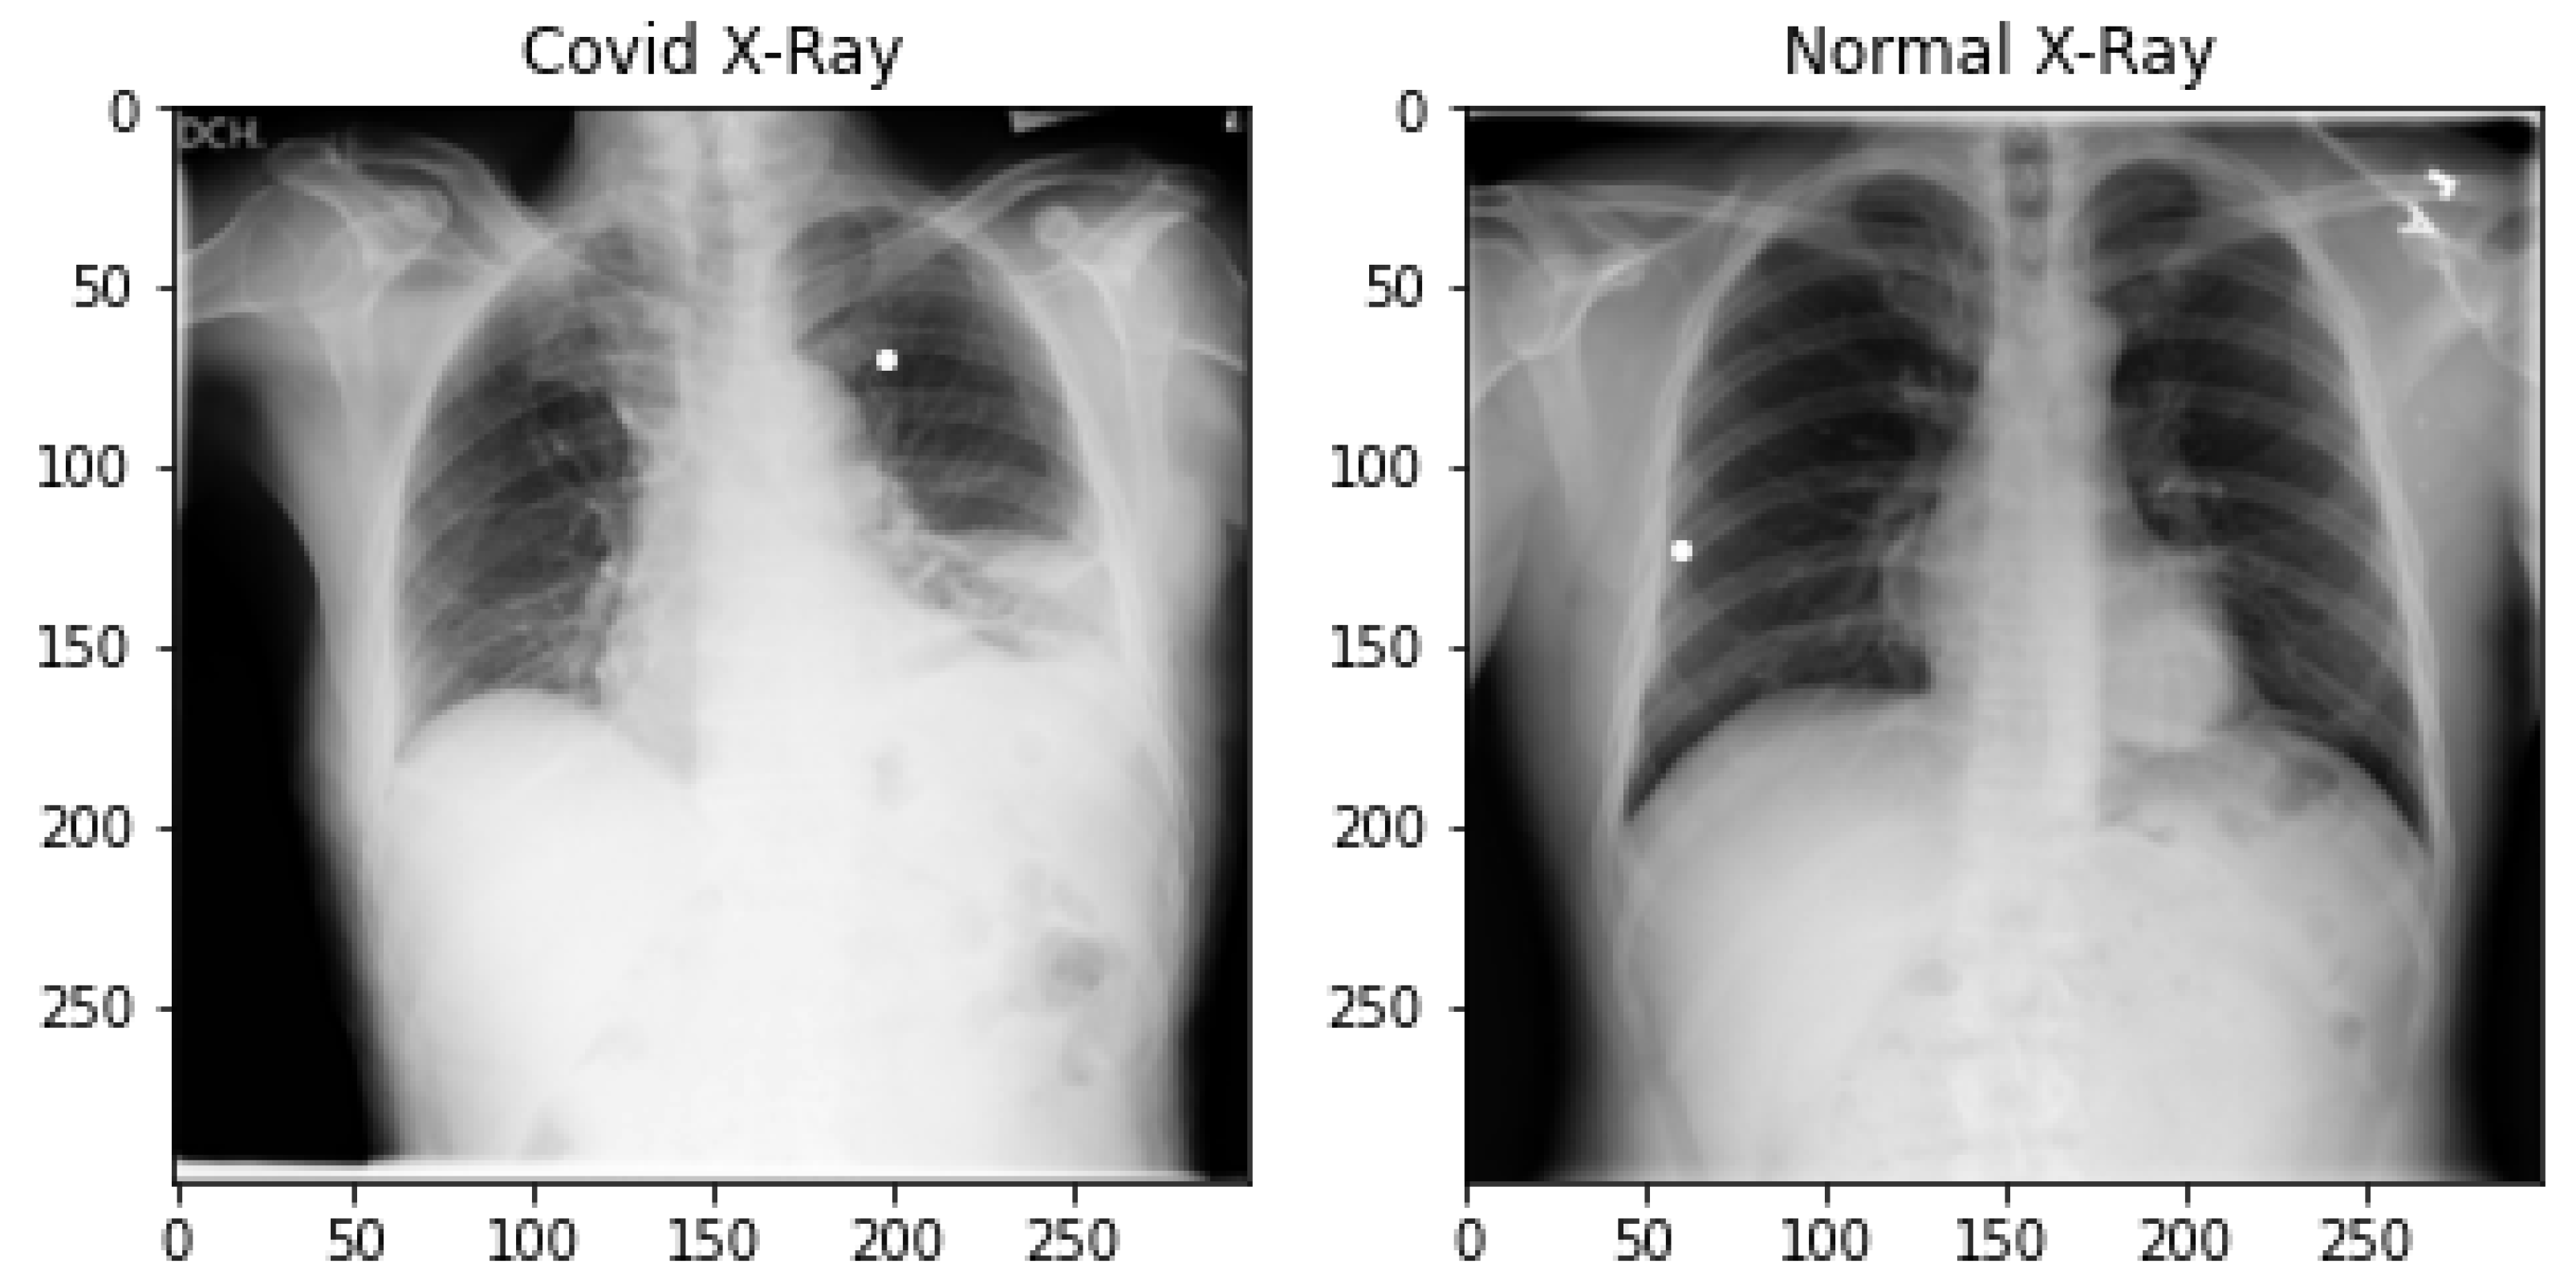
10]. X-rays are more secure, efficient and cost-effective for pandemic patients and give quick diagnoses. They are the first tool that doctors recommend for diagnosis at an initial stage and also X-ray machines are easily available in hospitals. However, they give low accuracy in some cases [6].
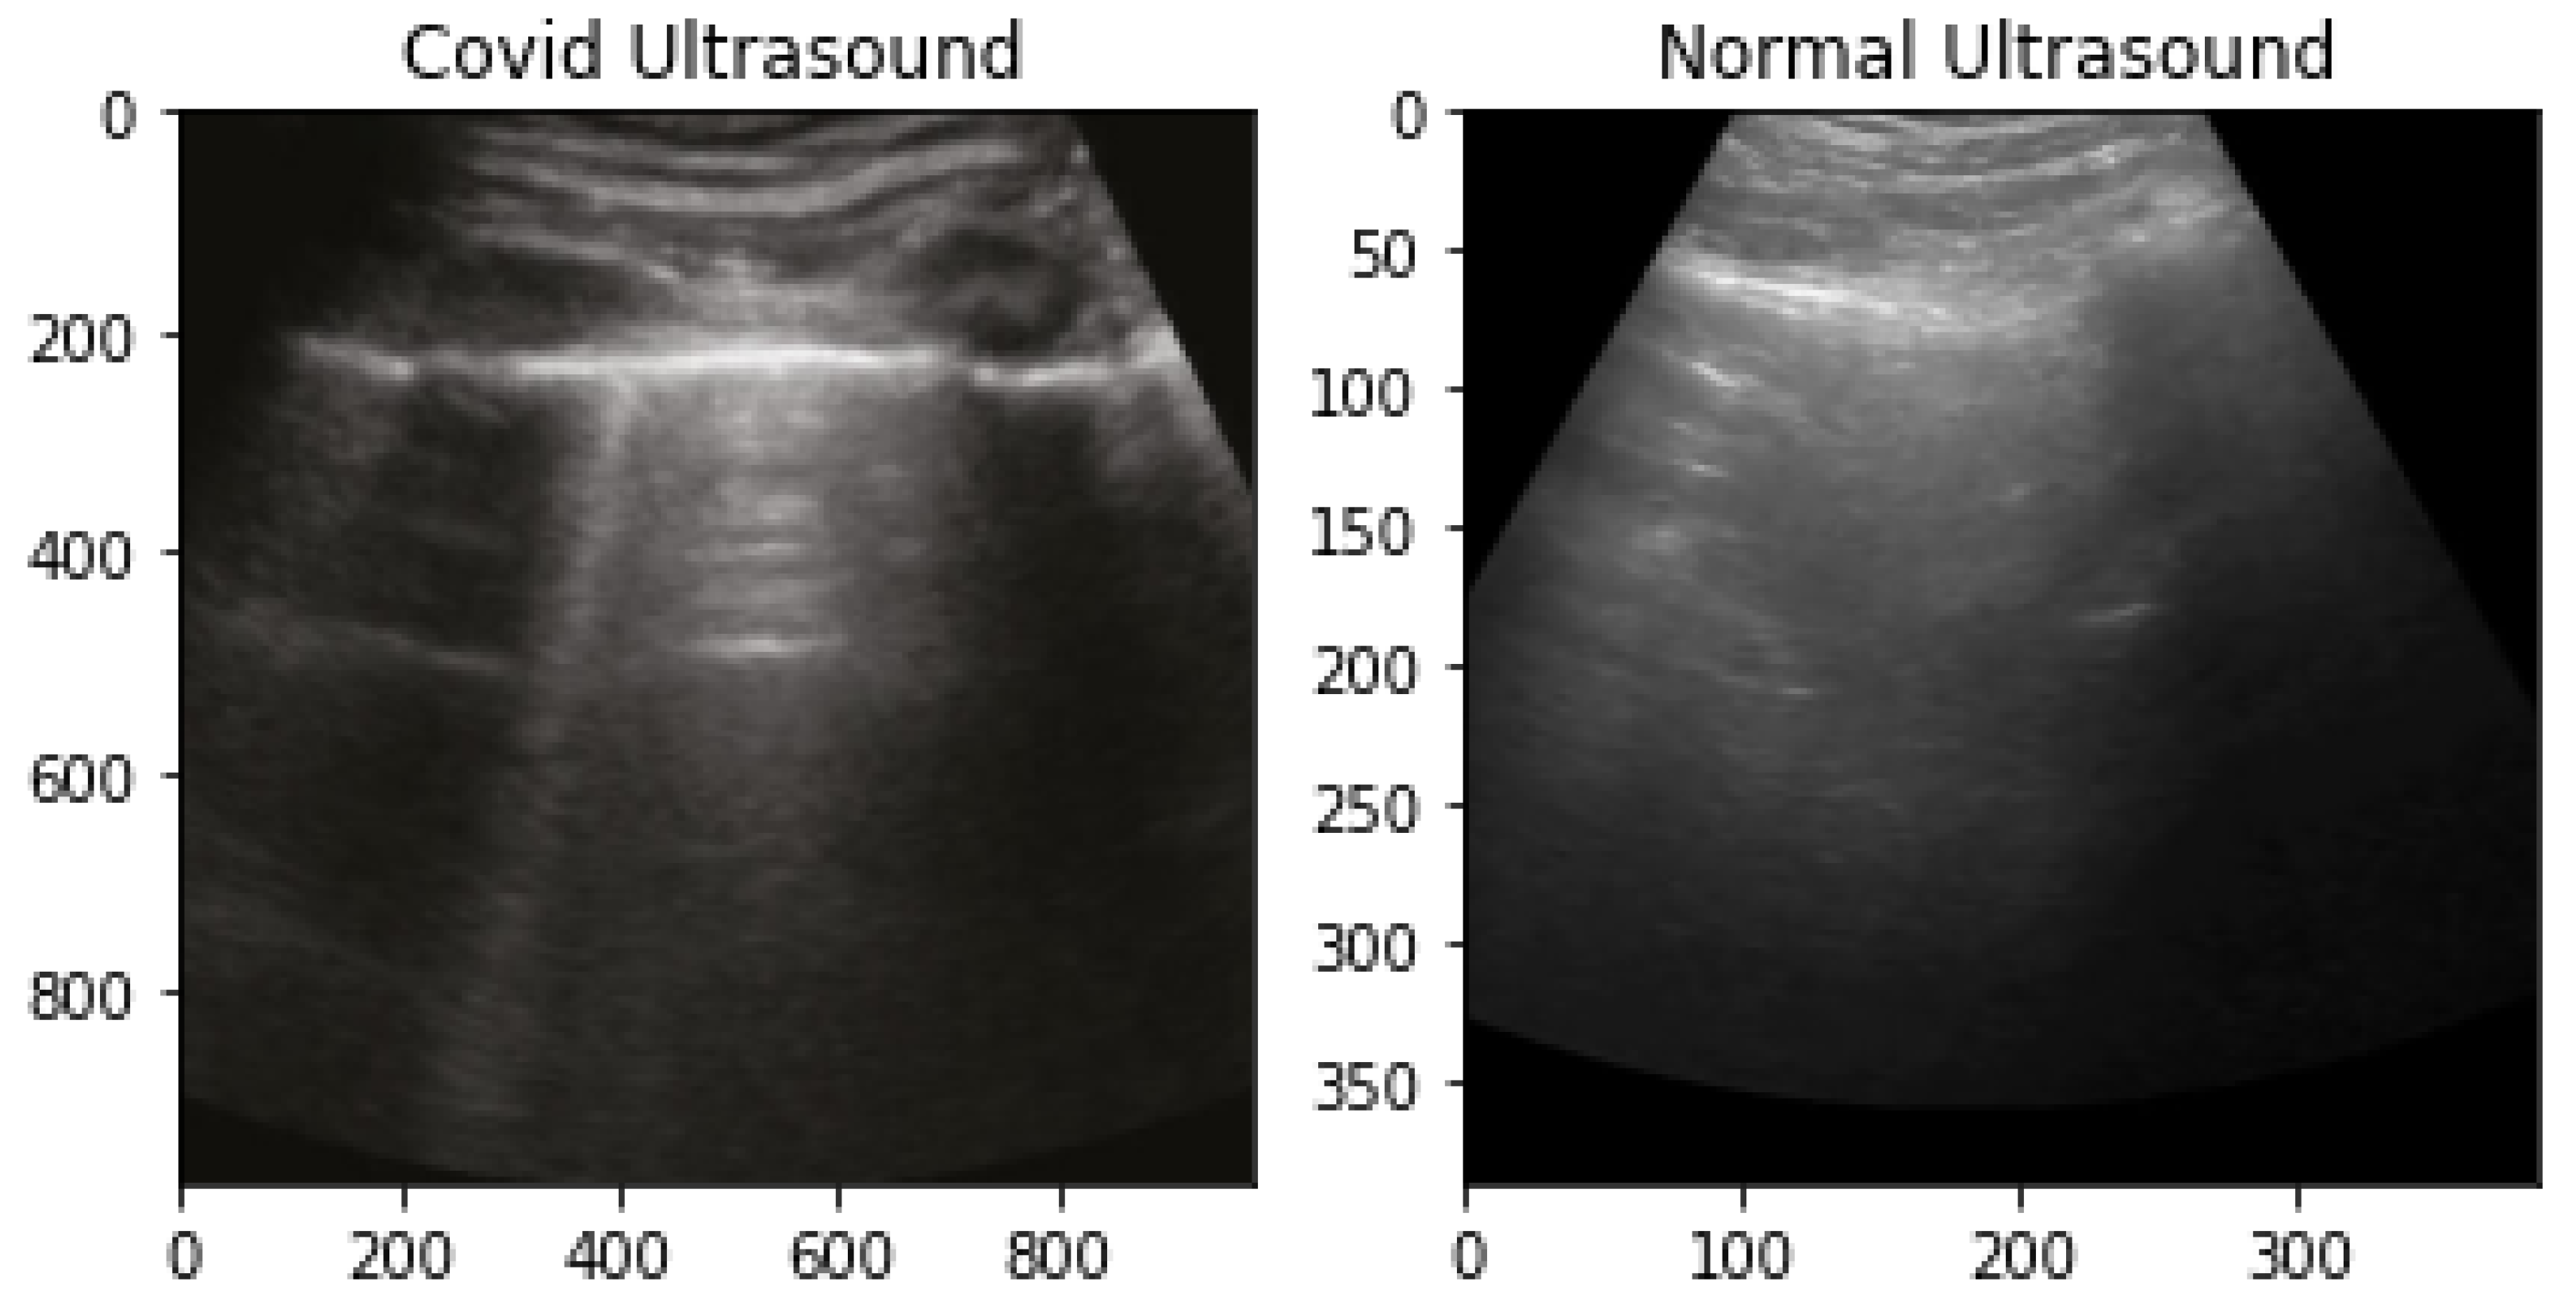
Ultrasound images are generated by a transducer, which uses high-frequency sound waves to create images of internal organs and their movement. After reflecting these waves from the body, the echo is recorded [11]. Unlike CT-scan and X-ray, there is no ionization radiation, hence no cancer risk. For the diagnosis of the pandemic, lung ultrasound is a recommended tool, as it helps in the visualization of the lung’s condition. As the disease goes from moderate to severe infection, it is visualized by B-line artifacts in ultrasound images and they increase as the severity of the illness increases [12]. This visualization is also useful in the grouping of patients according to their respiratory condition.
Artificial Intelligence (AI)-based automated systems using different image modalities help clinicians diagnose various lung organ diseases, as they give a second opinion. It is a difficult and challenging task for radiologists and clinicians to differentiate the disorders having similar patterns, such as pandemic patients, from other diseases, such as viral pneumonia, bacterial pneumonia and influenza, based on the medical images [13].
However, Medical Imaging is useful for diagnosing and classifying various chronic diseases such as diabetes, lung cancer, heart disease, brain stroke and pandemic-related diseases. However, reading scans manually is a time-consuming and error-prone task. Therefore, researchers are moving towards DL-based automated image analysis systems. The emergence of ML and DL for disease detection and prediction plays a significant role in healthcare. The rising scope of these technologies also encourages researchers to play a major role in pandemic detection.
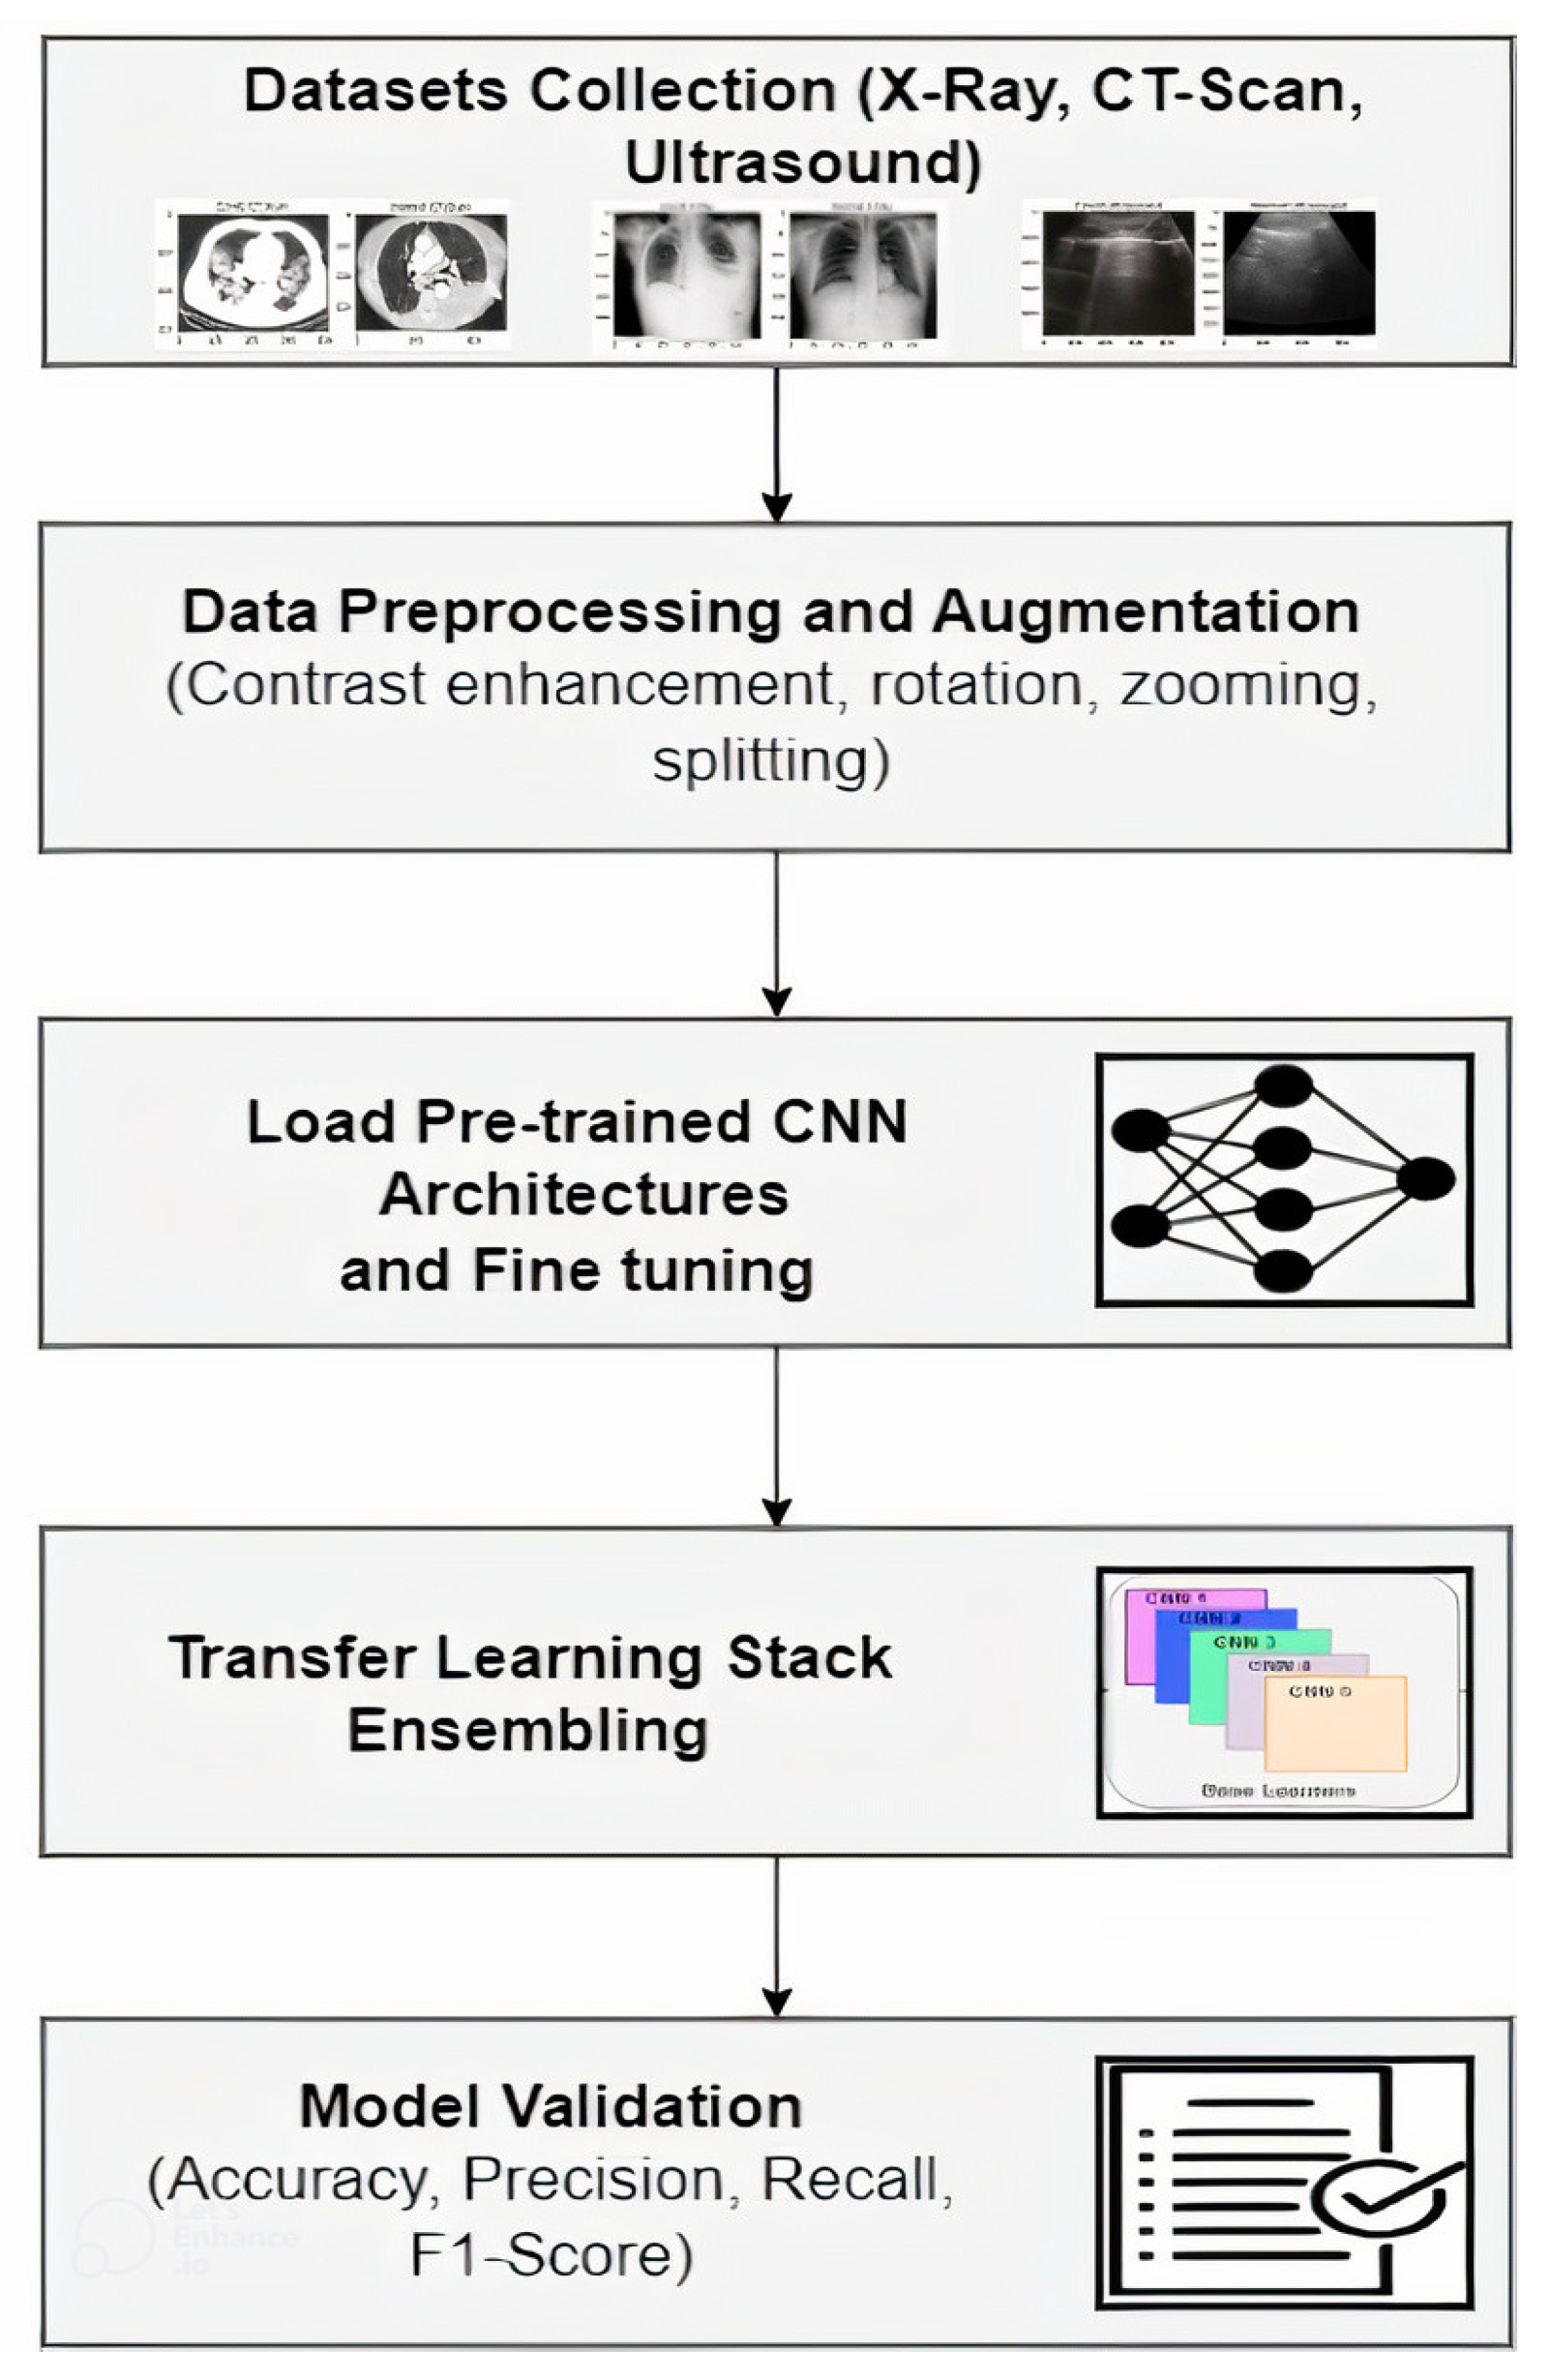
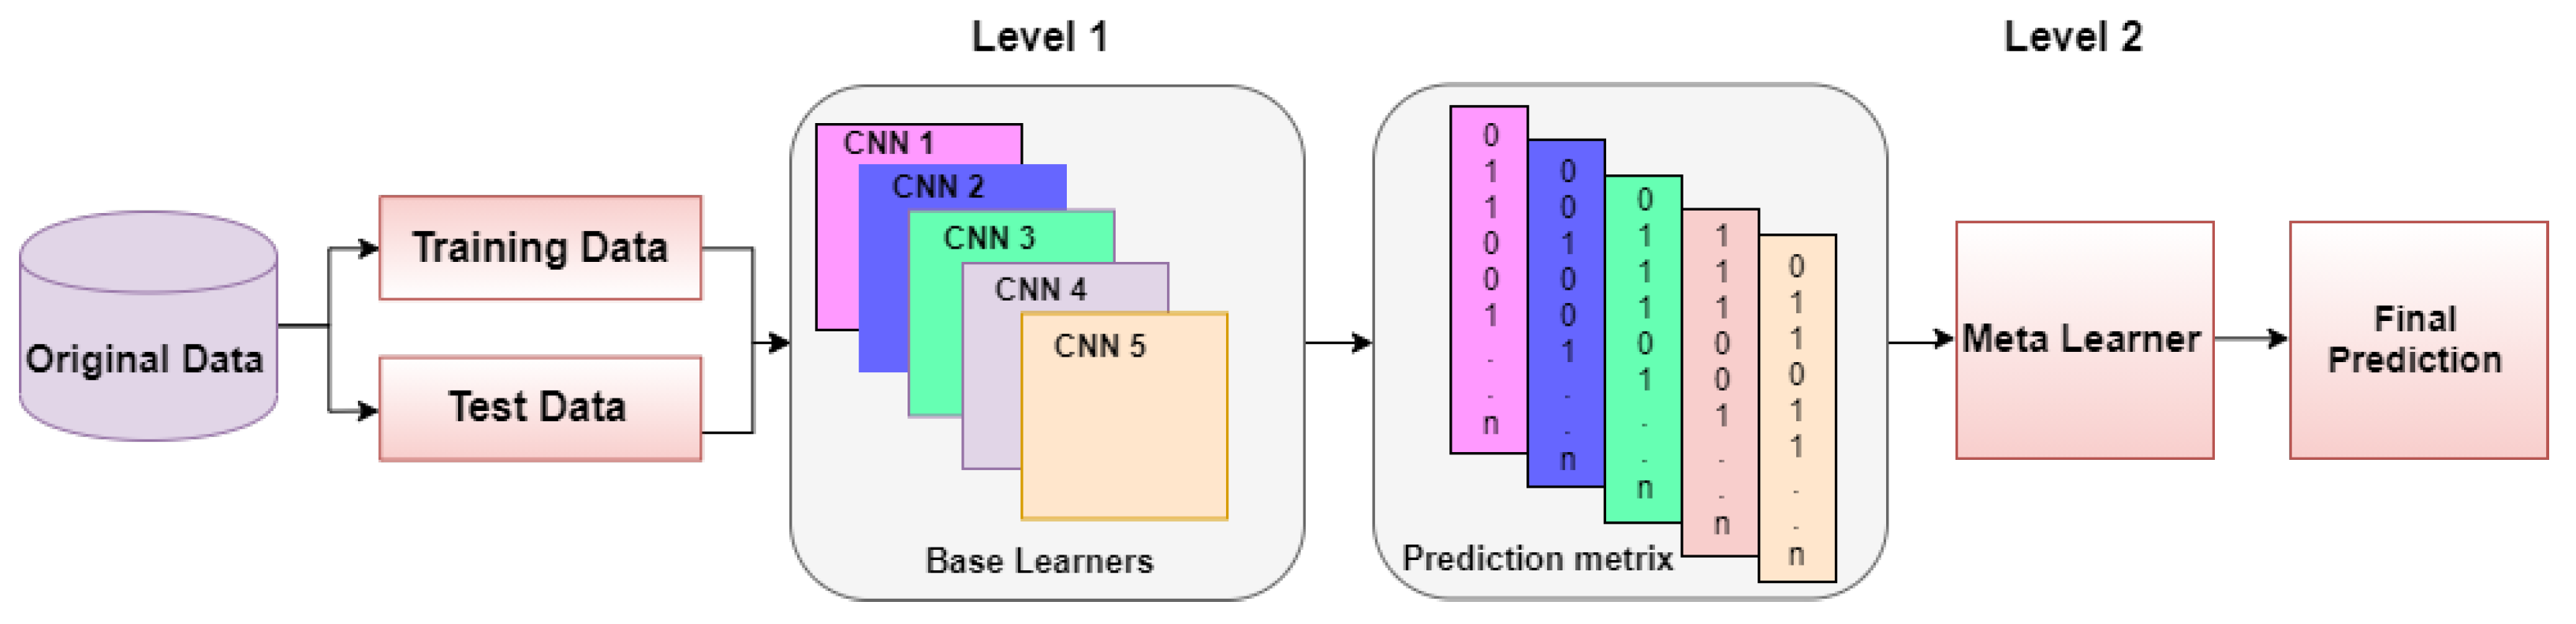
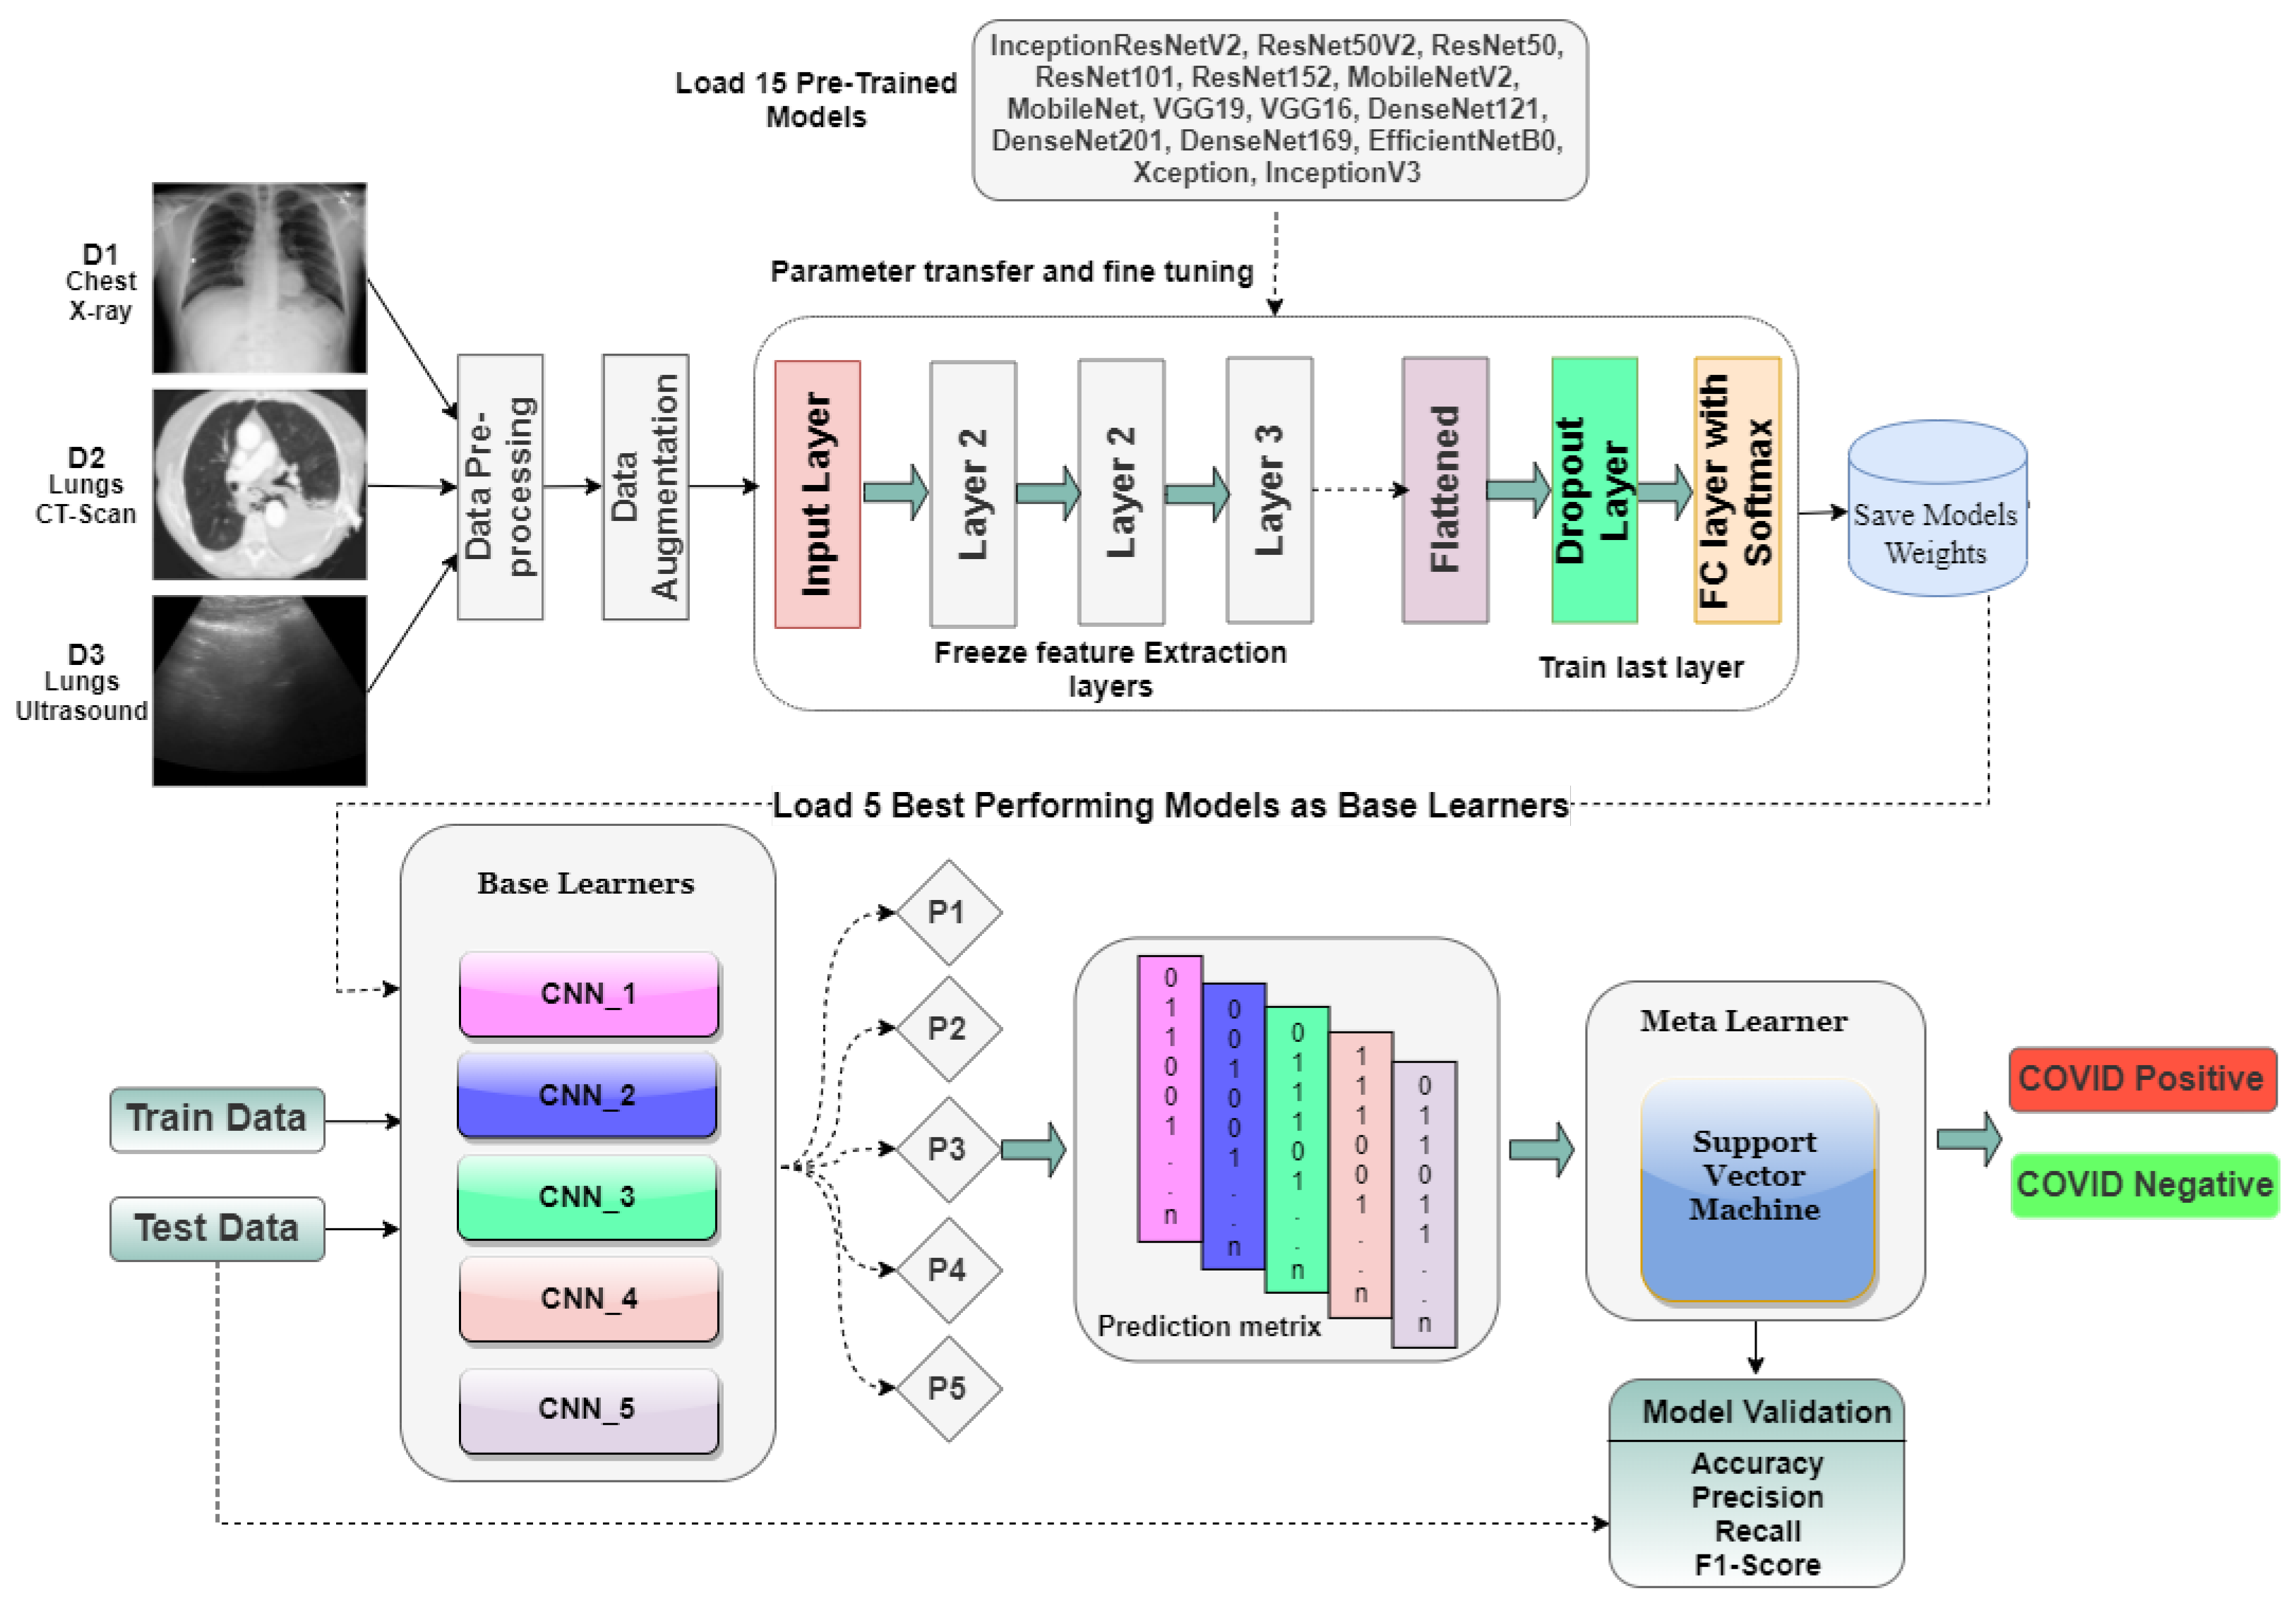
In this study, transfer learning-based stack ensemble architecture is proposed by using Medical Imaging datasets of three modalities (CT-Scans, X-ray and Ultrasound) and applying various CNN architectures for an accurate and reliable diagnosis. The datasets comprise pandemic positive and negative samples. These results might help in the early diagnosis of pandemic patients. The contributions of this research are summarized as follows:
  • Large publicly available multimodal datasets (Lung CT-scan, Chest X-ray, Lung Ultrasound) for pandemic detection are considered, which are taken from multiple online repositories.
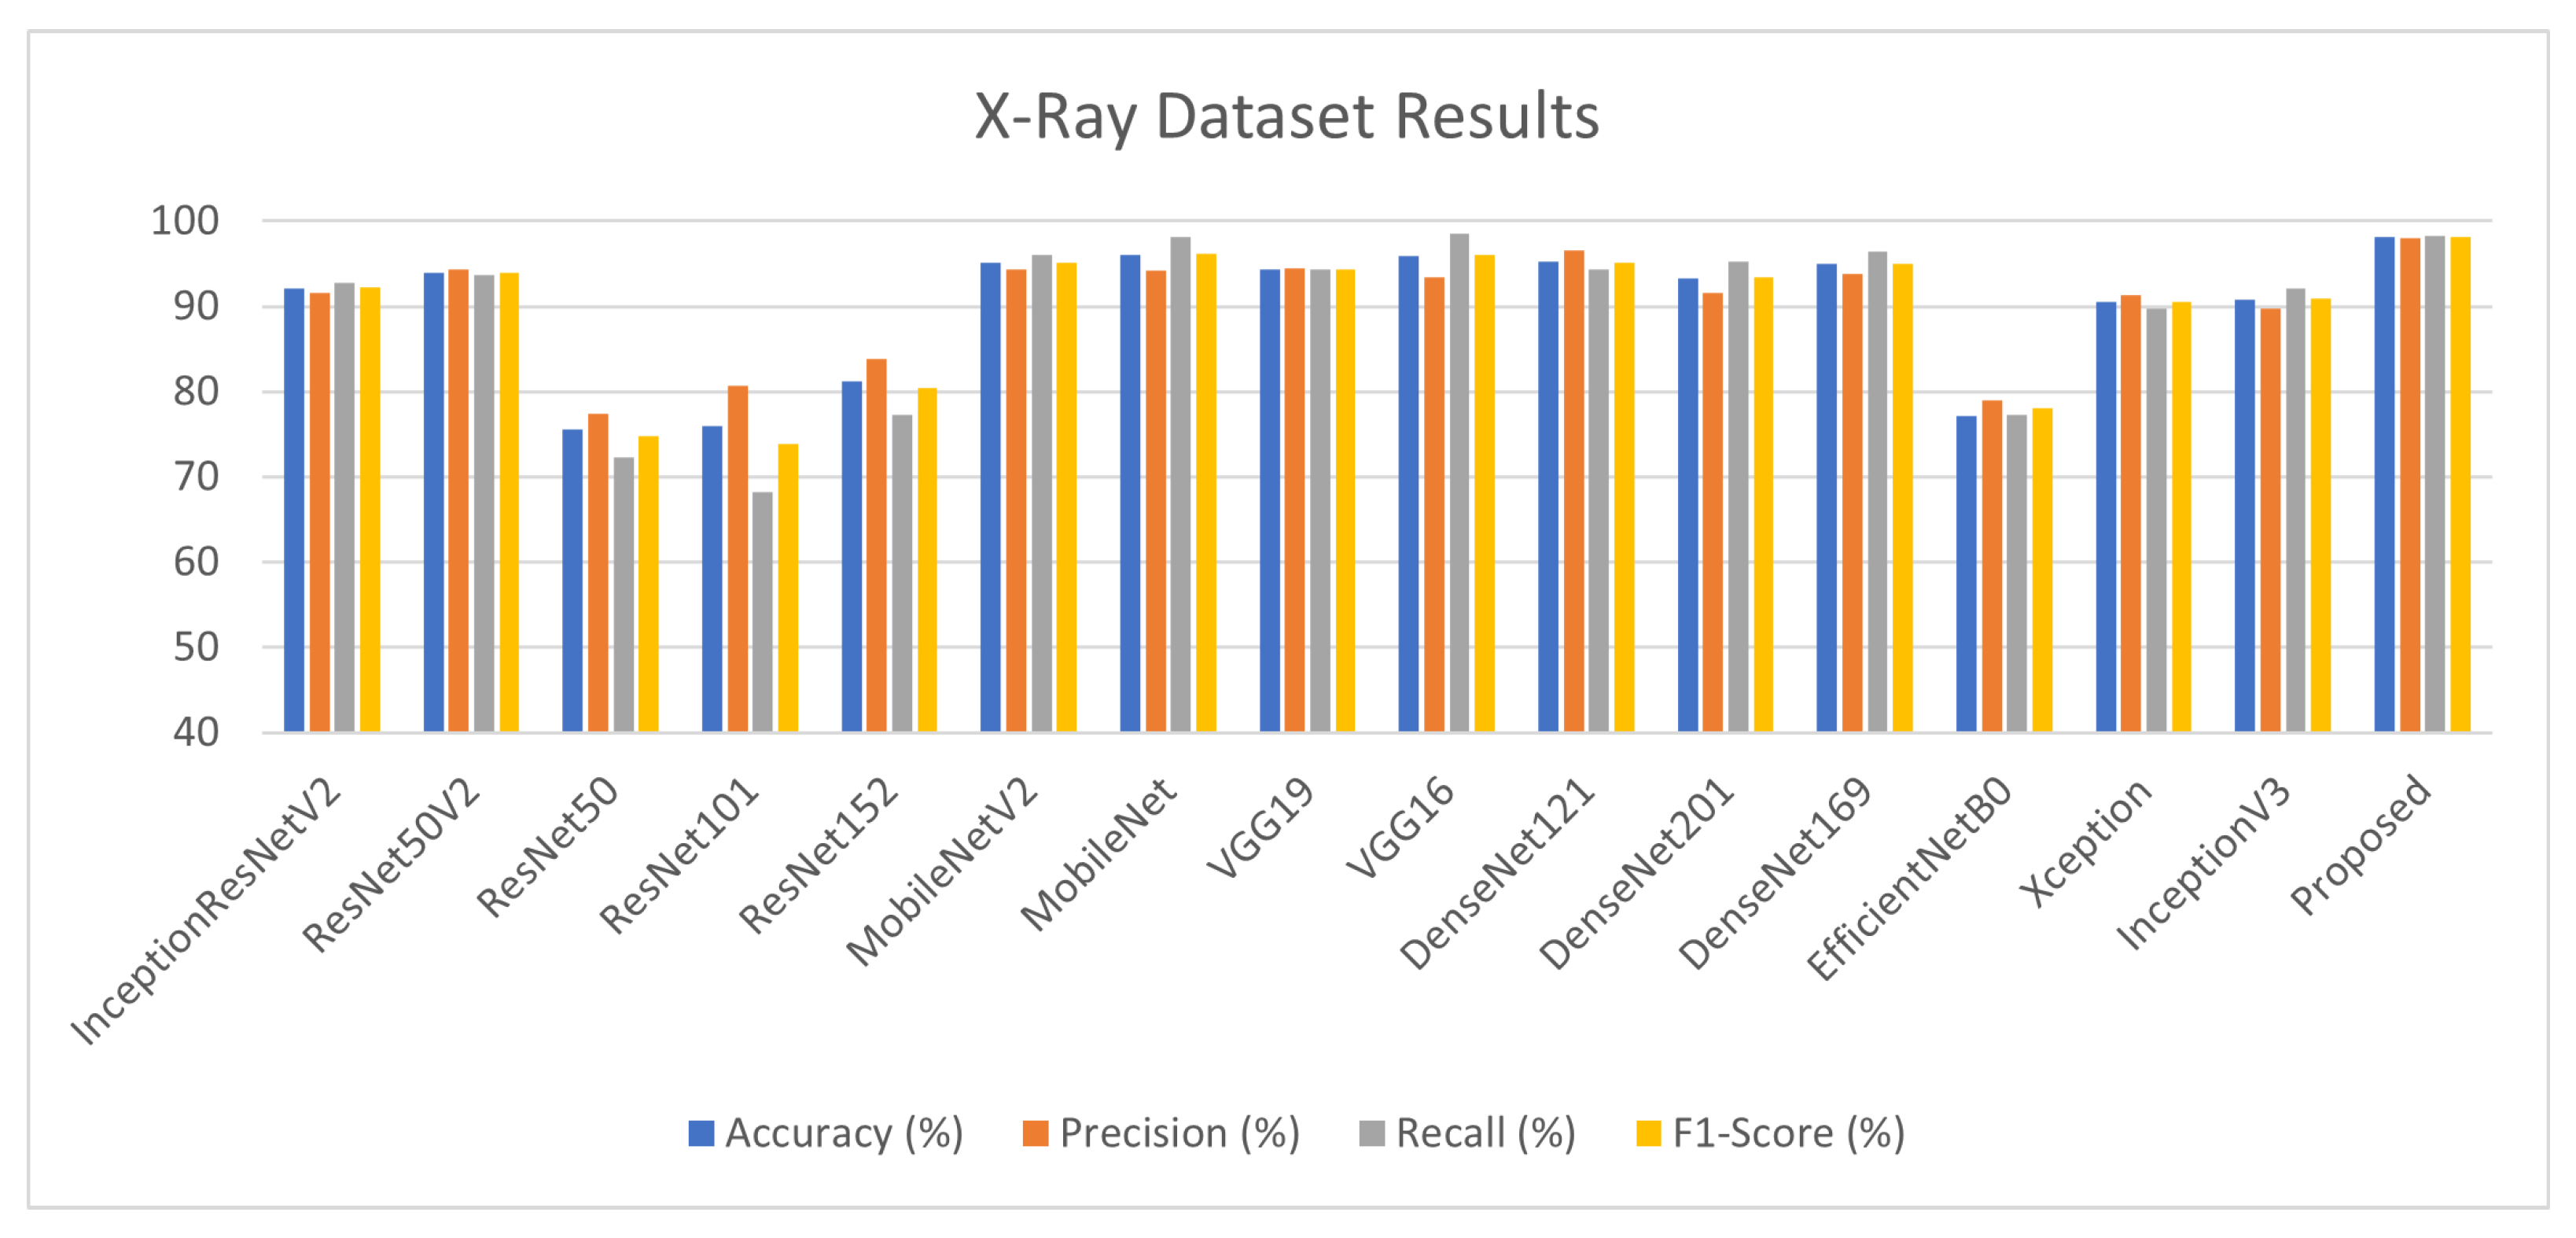
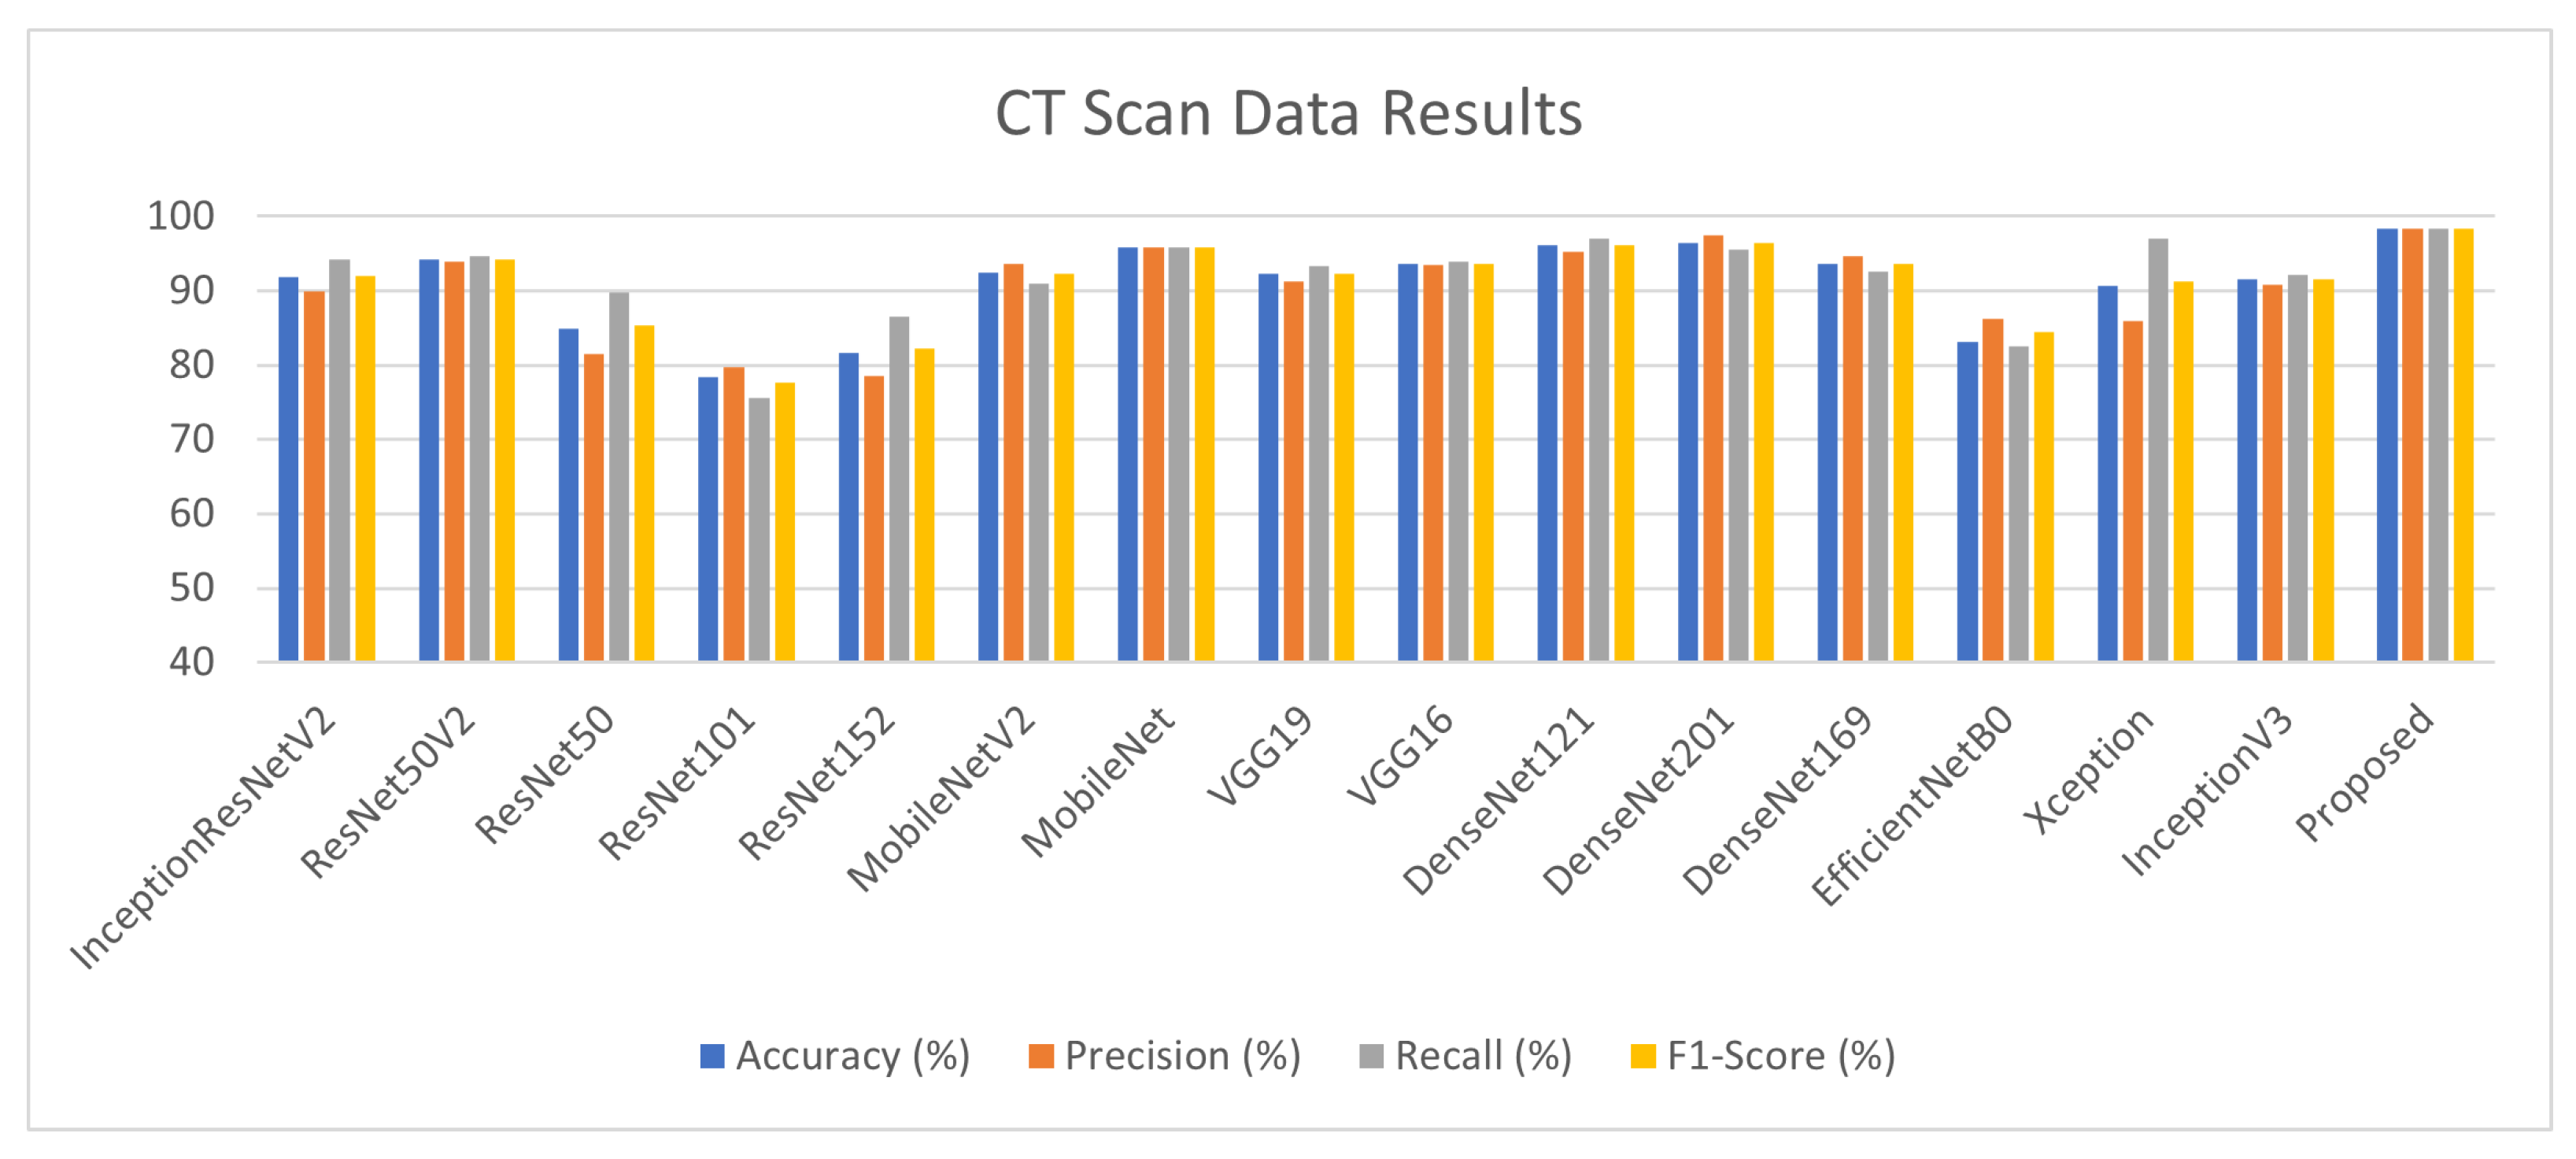
  • Fifteen state-of-the-art fine-tuned pre-trained CNN models are applied to all three datasets and their performance is evaluated and compared.
  • The Transfer-Learning-based Stack Ensembling approach is proposed using the fine-tuned models to improve the accuracy of diagnosis on all three datasets.
The rest of the paper is organized as follows. In Section 2, the related work is discussed in detail. Section 3 presents our proposed approach, which contains the description of the dataset and working of the proposed architecture. Section 4 presents the experimental results and comparative analysis. The conclusions and future dimensions of the research are presented in Section 5.

2. Related Work

DL is a sub-branch of ML that deals with the algorithms inspired by the structure and function of the brain called ANN. Although Medical Imaging is useful in disease prediction and classification, reading scans manually is time-consuming. Therefore, researchers are moving towards a DL-based automated image analysis system, which has vast applications in the healthcare sector, particularly in disease diagnosis and severity prediction. In [14], the authors proposed a quick automatic prediction system for pandemic patients using X-ray images. Pre-trained models comprise InceptionV3, ResNet50, InceptionResNetV2, ResNet151 and ResNet101.
Among these models, ResNet50 achieves high-performance accuracy, i.e., 98%. In reference [15], DL-based CNN models are applied to the dataset of 6432 X-ray scans. Three models—InceptionV3, Xception and ResNeXt—are evaluated and compared, resulting in high accuracy for the Xception model, i.e., 97%. However, they used an unbalanced dataset of positive and negative samples of pandemic samples. In [16], the authors proposed a system for early prediction of pandemics using X-ray radiographs by applying different AI techniques. CNN is implied in two ways. First, it is used for classification by using the softmax layer. In the second scenario, it is applied for feature extraction. These features are then passed to other classifiers, i.e., SVM and RF.
A. Gautam proposed a novel 13-layer CNN architecture for brain stroke classification into three categories, hemorrhagic, ischemic and normal stroke, using CT scan imaging data [17]. Quadtree-based fusion technique is applied to improve the contrast of 2D slices containing stroke. The proposed model comprises two convolutional layers and two dense layers to make the model efficient and require less computation time. Transfer learning-based DL algorithms are presented in [18] for classifying brain tumours into malignant and benign by using an open-source brain tumour MRI dataset. Various pre-trained models are utilized to achieve better accuracy. The TCIA dataset is used in this study, which consists of 224 benign images and 472 malignant images. In [19], the CNN-based DL model is proposed for classifying brain tumour types by using two publicly available MRI imaging brain tumour datasets. The datasets comprise 73 and 233 patients, respectively. The model classifies meningioma, glioma and pituitary tumour on D1 while multi-classification is performed for characterizing different grades of glioma tumour on D2.
The proposed model achieves 96% and 98% test accuracy on D1 and D2, respectively. Every year, about 123,000 new instances of skin cancer are detected throughout the world, making it a serious public health issue. Melanoma is the worst form of skin cancer, accounting for over 9000 fatalities annually in the United States. Balazs Harangi [20] proposed a weighted average ensemble architecture based on CNNs to classify dermoscopy images. Multiclass classification is performed for classifying seborrheic keratosis, nevus and melanoma lesions.
The proposed fusion-based ensemble architecture achieves good results as compared to individual CNN and achieves an AUC score of 0.89. In [21], an automated diagnosis system is proposed to classify nevus, melanoma and atypical nevus lesions. The concept of transfer learning is applied by utilizing AlexNet architecture and appending the dense layer with a softmax function. The Ph2 dataset is used for training and testing AlexNet-based architecture. The proposed model achieves 98% test accuracy.
Lung cancer is the most dreadful cancer that result in a large number of deaths globally. The only approach to increasing a patient’s probability of life is to discover lung cancer early. A new automated diagnostic classification system for CT scans of the lungs was developed in [22].
CT scans of lungs were evaluated using an Optimal Deep Neural Network (ODNN). The LDR approach was performed for dimensionality reduction of deep features to classify items into the categories malignant and benign lung nodules. The deep neural network is enhanced by using the (MGSA) algorithm. The suggested classifier has a sensitivity of 96.2%, a specificity of 94.2% and an accuracy of 94.56%.
Many custom DL models and architectures have been proposed to achieve more accurate and reliable results as they are designed according to the specific purpose of interest. They are evolved by using the existing DL models to develop a novel neural network or by combining the current DL models. For example, in reference [23], CoroNet architecture is proposed based on the Xception DL model for the detection of a pandemic. The model is applied on two publicly available datasets and achieves 89% and 95% accuracy, respectively. In [24], the authors proposed Bayesian CNN and discussed how drop-weight-based CNN predicts the uncertainty in DL models.
A new DL framework COVIDX-Net is proposed in [25] for automatically detecting a pandemic. This framework consists of seven different architectures applied on X-ray scans of 50 patients, achieving 91% accuracy and 89% f1-score. In [26], SqeezeNet with Bayesian optimization is proposed for pandemic detection. This study used a lightweight network design, a non-public augmented X-ray dataset and fine-tuned hyper-parameters to achieve good performance. In [27], authors worked on early detection of a pandemic by using X-ray images by applying different pre-trained models. VGG18 achieves the highest accuracy, i.e., 80%.
In [28], authors worked on patients’ CT images and their clinical reports. CNN models are applied to CT scans and ML models are applied to the clinical data of patients. A joint AI model is proposed for integrating CT scans and clinical data and achieves 0.84 AUC. In [9], the authors implement sixteen pre-trained CNN models on large chest CT-scan datasets. This study achieves high performance with DenseNet121 and discusses that better classification results can be achieved without augmentation and by inputting whole slices of CT scans. The pre-trained Densenet model is applied for classification purposes. Another study [29] used the transfer learning concept using CT slices. Ten well-known pre-trained models are implemented, among which ResNet101 and Xception achieved the best performance. However, they have used small train and test datasets.
Pathak et al. proposed a deep bidirectional LSTM network [30]. The Mixture Density Network (MDN) [31] is embedded along with LSTM which contains the output layer and hidden layers to perform classification. They achieved 98% accuracy. However, their dataset size was small. In reference [32], the disease detection and severity classification method is proposed using CT scans. The model classifies the severity as mild, severe and moderate. UNet, deep Encoder–Decoder CNN [33] and Feature Pyramid Network (FPN) [34] are applied for lung segmentation and detection of disease.
U. Özkaya et al. [35] proposed an automated system for early diagnosis of the pandemic in which CNN architecture is utilized for feature-extraction from CT images. Features are combined with the data fusion technique and then two subsets of data containing 16 × 16 and 32 × 32 patches are obtained. SVM is applied to perform the final classification from the patch datasets containing 3000 positive examples. In [36], an early screening method is proposed in which ResNet18 architecture is enhanced by embedding the location-attention mechanism in the dense layer of CNN; this achieves 86% accuracy. Ten layer CTnet-10 architecture is proposed [37] using CT scan samples and achieves 81% accuracy. DL architecture using the concept of transfer learning is proposed in [38]. Multiclass class classification is performed by classifying normal, pneumonia and pandemic cases with an accuracy of 96% They also claimed that the proposed model has more sensitivity than the radiologists perform screening and prediction. However, they have used a small and unbalanced dataset that contains only 140 pandemic-infected samples.
EfficientCovidNet is proposed in [39] by appending six new blocks in existing EffiecientNetB0 architecture and achieving 87% accuracy. They also performed cross-data testing, which reduced the classification accuracy to 56%. Various ensemble approaches are applied to enhance the performance of DL models. This allows the combination of the contribution of each base learner to give more accurate results and low variance in prediction errors. Multiple kernel ELM-based DL architecture is proposed in [40], in which DenseNet201 is applied for feature extraction and the final result is obtained from the majority voting ensembling of multiple ELM classifiers. In [41], a majority voting ensembling of five DL model architectures is proposed to enhance the performance of pre-trained models. This approach achieves 85% on test data of CT-Scan samples.
Five-block multi-scale Deep Neural Network (DNN) is proposed in [42] for the detection of COVID-19 using chest radiographs. The proposed research presented an IoT framework to remotely provide a fast diagnosis to COVID-19 patients. The multi-scale sampling presented efficient feature learning using different-size convolutional filters and achieved remarkable results. However, they considered a single mode of dataset, i.e., chest X-ray. Vyas et al. [43] presented a comparison of different feature extraction techniques and performed classification using state-of-the-art ML models to predict COVID-19 positive or negative status. Their findings illustrate that Local Binary Pattern (LBP) feature extraction along with Gradient Boosting (GB) classifier achieve the best results, i.e., 94% accuracy. However, they considered small training samples and their effects can be improved further.
Image preprocessing is an essential step in DL as the performance of DL models highly depends on it. Many segmentation and Region of Interest (ROI) extraction techniques have been proposed. In reference [44], a hybrid image enhancement based on guided and matched filtering techniques is applied on fundas images to extract blood vessels and outperforms state-of-the-art techniques. Seal et al. [45] applied three different probabilistic and predictive models for the detection of liver cancer. They first applied the segmentation of lesions using the fuzzy C-mean clustering technique. Their findings conclude that Logistic Regression (LR) has identified more significant features and achieved good accuracy as compared to Linear Discriminant Analysis (LDA) and Multilayer Perceptron (MLP). A novel DL architecture based on a correlation mechanism is proposed by [46] for the detection of brain tumours using brain CT scans. The authors combine traditional CNN with a supporting neural network that helps in finding the most suitable filters for convolutional and pooling layers. Their findings show that the proposed neural classifier is faster and achieves good accuracy.
Lung ultrasound (LUS) is a convenient, easy-to-sterilize and low-cost imaging modality that can be used to diagnose various lung diseases [47]. Very few studies, until this research, have used LUS for pandemic screening. In reference [48], four pre-trained models are utilized for the detection of pandemic and pandemic/pneumonia classification using publicly available ultrasound frames. They achieve a highest accuracy of 89%. A fine-tuned VGG model is used in [13] by using all three modalities. They achieve good results with LUS images. However, they did not achieve good results for X-ray and CT scans. CNN with a multi-layer fusion approach is proposed for pandemic screening from LUS images in [49]. In [50], a novel DL network based on Spatial Transformer Networks (STNs) is proposed, which predicts the severity score for the pandemic and also performs pixel-level identification of regions.
A lot of research has been conducted so far in pandemic diagnoses and various studies have achieve good results. However, many of them use small datasets for training their models which affects the overall performance and leads to overfitting. Moreover, there are very few studies that have utilized lung ultrasound data for pandemic diagnosis to the best of our knowledge. This is a cheap and more secure solution for patients with severe lung conditions. So, in this research, we used the largest publicly available dataset for three modalities (X-ray, CT-scan, Ultrasound) and applied various models to find out the more accurate solution. The unique features of this research are presented in Table 1.

3. Transfer Learning Stack Ensembling-Based Approach

In this section, the devised methodology is introduced; it was trained and tested on three datasets and the subsequent results are reported and discussed in the results section. The proposed method outperformed other similar available methods, in terms of model accuracy, in the number of images used in experiments and using more than one image data modality. The overall workflow for pandemic detection from Medical Imaging is depicted in Figure 1 and described in this section.

3.1. Datasets

In this research, Medical Imaging datasets of three different modalities are used that contain the samples of pandemic-infected patients and non-infected patients. The details are discussed in this section and summarized in Table 2.

3.1.1. Chest X-ray Dataset (D1)

The chest X-ray dataset is prepared from three different sources [52,53,54]. It is the largest publicly available open-source chest X-ray dataset prepared by a team of researchers from various universities in cooperation with medical doctors and is constantly updating. At the time of this study, it contains 3616 pandemic-positive cases of X-ray images, 1345 viral pneumonia and 10,192 normal chest X-ray images. A total of 4600 images are taken from normal chest X-ray images to make the data balanced. All images are in Portable Network Graphic (png) format, having a resolution of 299 × 299 pixels. The total number of pandemic-infected X-ray images used in this research is 4583. We did not use pneumonia images. The samples of both normal and pandemic-infected chest X-rays are shown in Figure 2.

3.1.2. Lung CT Scan Dataset (D2)

The public CT scan dataset for pandemic diagnosis and classification used in this research is SARS-CoV-2 CT-scan, prepared by Soares et al. These data were collected from hospitals in Sao Paulo, Brazil, and are publicly available on Kaggle Repository [55]. This dataset contains 2482 CT scans (1252 infected lung CT-scan images and 1230 non-infected lung scan images). The dataset consists of CT scans of 62 male patients and 58 female patients. This dataset comprises 2D slices of CT scans with no standard-size images. The smallest image in the dataset is 104 × 153 while the largest one is 484 × 416. The samples of both normal and pandemic-infected CT scans are shown in Figure 3.

3.1.3. Lung Ultrasound Dataset (D3)

The Public LUS dataset (POCUS) is used in this research; it is compiled by Born et al. [56]. POCUS dataset contains videos and images of two types, convex and linear. Convex and linear are two types of transducers, which are used to generate ultrasound. At the time of this study, it contained in total 162 videos of convex probe (46 pandemic-infected, 46 bacterial pneumonia, 64 healthy and three viral pneumonia). It had twenty videos of linear probe (6 pandemic-infected, 2 bacterial, 9 healthy, 3 viral pneumonia). The butterfly dataset was not considered in this study. The total number of images of the convex probe is 53, including 18 pandemic-infected, 20 pneumonia and 15 healthy LUS images. There are 6 images of the linear probe, with 4 pandemic-infected and 2 pneumonia images. The samples of both normal and pandemic-infected lung ultrasounds are shown in Figure 4.

3.2. Data Preprocessing and Augmentation

Data pre-processing is the first and an important step in DL and machine ML framework. For Medical Imaging datasets, pixel intensity normalization of medical images is performed to make them in a range of 0 and 1. This step is important for training a neural network. This can be done by setting the rescale argument of ImageDataGenerator class. ImageDataGenerator is the class of Keras DL library. Images are also resized according to the CNN architecture requirement which is usually 224 × 224. Data Augmentation is the technique of enhancing the number of training data by applying certain transformations. DL models require a large amount of training data to achieve good performance. In Medical Imaging, collecting a large number of images is difficult. Therefore, new data are generated by applying zoom, shift, rotate, flip, shear and brightness transformations. These transformations are also achieved with the ImageDataGenerator class, which provides real-time augmentation while training the CNN architecture.

3.3. Transfer Learning and Deep Learning Models

DL technology has vast scope in disease detection, segmentation and classification by using Medical Imaging. It is used in many studies for the diagnosis of diseases such as brain tumours, diabetes, breast cancer, lung cancer, brain stroke, etc. Using complex DL models from scratch with lots of parameters requires lots of training time and efficient machines, so this is the point from where transfer learning comes. It is a process of reusing the model trained on some large datasets with new scenarios and data. This technique achieves high performance with low computation cost [57].
In this research, 15 well-known DL models are applied, which are provided by Keras Applications and are available with pre-trained weights. These models can be utilized for different scenarios, e.g., classification, prediction, segmentation and feature extraction. The various characteristics of these architectures are described in Table 3. In CNN architecture, the first layer, or base layer, is a convolutional layer from which the input image is passed through a filter. This layer is used for feature extraction and gives output as a feature map. The second layer is the pooling layer, which is used to lessen the size of the feature map. For applying transfer learning, the starting layers containing the parameters remain unchanged and are reused for newer scenarios and datasets. The last layer is removed and embedded in a fully connected (dense) layer according to our scenario. This process is also called fine-tuning. The fully connected layer in CNN is an important layer containing the softmax activation function, which is used for final prediction.

3.4. Deep Stack Ensembling

The process of combining the contribution of homogeneous or heterogeneous ML/DL models to improve the overall performance results is known as ensembling [58]. It is also common practice in the medical field that opinions from multiple expert doctors about diagnosis are taken for greater reliability; ensemble learning involves the same concept. It allows the combination of the contribution of each base learner to give more accurate results and low variance in prediction errors. Different ensemble methods are used in different studies, including boosting, bagging and stacking [59]. In boosting, the misclassified samples from the first base learner are passed to another learner for training, which increases the problem of overfitting [60]. In bagging ensembling, the training dataset is divided into N numbers according to base learners and each model is trained on a sub-part of data. Hence it also increases the overfitting problem when there is a smaller number of training samples. The idea of stack ensembling is to train several heterogeneous models and combine them by using a meta classifier or meta learner using the predictions returned by base learners to give results. The basic idea of stack ensembling is illustrated in Figure 5.
Two-level deep stack ensembling is proposed in this research for accurate diagnosis of the pandemic. The proposed model is illustrated in Figure 6. In the first level, five CNN architectures out of fifteen, having the best performances, are picked as base learners. Base learners for each dataset (CT-scan, Xray, LUS) have to be different according to the performances on an individual dataset. Each CNN will give the predictions 0 or 1 (0 for pandemic negative, 1 for pandemic positive) on test data, which offers five arrays. These arrays are combined to form a prediction matrix using the dstack() function of the Numpy library. This prediction matrix acts as a training set for a meta-classifier. Finally, the meta classifier predicts the test dataset, which is the final result of ensembling. The overall workflow and calculations are depicted from Algorithm 1.
Algorithm 1: Deep Stack Ensembling.
Electronics 11 03974 i001

3.5. SVM Meta Classifier

Supervised ML algorithms deal with the learning of hypotheses with input features and output variables. In this study, SVM is used as a meta classifier which is used to predict the outcome. SVM is used in the second level, which accepts the prediction sets from different DL architectures as training data on which it will train. This prediction dataset will be in the form of 0 or 1 and its dimension will be according to the size of the test dataset and the Number of CNN used for ensembling. Let us suppose there is a test dataset of 300 images and five best-performing base learners; then, the prediction dataset will be 300 × 5. After training on the prediction dataset, the model will be evaluated on test data. SVM is mainly used for classification tasks. This model works by plotting the data samples in the n-dimensional plane and finding the decision boundary between the classes, which is called a hyperplane. The number of features determines the dimension of a plane. The best hyperplane is selected by calculating the distance between support vectors and boundary lines. This distance is called the margin. Therefore, the plane with the highest margin is declared the final decision boundary [12]. Linear kernel SVM is used in this study which is used for linearly separable problems defined by Equations (1) and (2).
( x ¯ 1 , y 1 ) ( x ¯ n , y n )
f ( x ) = ω T x + b
where x 1 , y 1 is the data sample, ω is the weight to be minimized and b is the linear coefficient learned from the training data.

4. Results and Discussion

This section represents the experimentation results of multiple datasets. The performance metrics to evaluate the CNN models are envisioned with discussion. Our findings are presented in this section. The results are obtained by training 15 CNN architectures then further stacking is performed on the predictions of best-performing models. The final results obtained from the meta classifier on all three datasets are illustrated and compared with pre-trained CNN models.

4.1. Experimental Setting

All the experiments are performed on Google Colaboratory. Windows 10 operating system is used in this study with 8 GB RAM and Intel(R) Core (TM) i5-7200U CPU @ 2.50 GHz 2.71 GHz processors. DL library Keras with TensorFlow backend is used for DL, while Scikit learns library is used for ML models. The train test ratio for all models is 80% and 20%. Fifteen fine-tuned pre-trained models are applied, i.e., InceptionResNetV2, ResNet50V2, ResNet50, ResNet101, ResNet152, DenseNet121, DenseNet169, DenseNet201, MobileNet, VGG16, VGG19, MobileNetV2, Xception, InceptionV3, EfficientNetB0. Five base learners are selected out of 15 according to the performance on all three datasets. This exhaustive approach is adopted so that the best combinations for ensembling can be determined with regard to which will give more accurate and reliable results. The system and hyperparameter details are presented in Table 4.

4.2. Evaluation Criteria

In ML/DL, model evaluation is essential for knowing about the results of trained models. It helps in the understanding of the model’s performance and simplifies the presentation of the model. Models need to be evaluated using several measures to improve its performance, fine-tune it and to achieve better results. There are various evaluation metrics available. For evaluating our proposed model, confusion-matrix based performance metrics are used. These metrics show the classification performance of a model. In the confusion matrix, True positives ( t p ) are samples that model correctly predicted positives. True negative ( t n ) is the test data that are correctly classified as negative, whereas false positives ( f p ) are the values incorrectly classified as positive and false negatives ( f n ) are the samples that incorrectly predict the negative class [61]. The details of these metrics are explained below with formulas:

4.2.1. Accuracy

A model’s a c c u r a c y is determined by dividing the total predicted samples by the number of correct predictions. It is only an acceptable metric if the different classes in the dataset are substantially evenly distributed. It can be calculated as in Equation (3).
A c c u r a c y = ( t p + t n ) / ( t p + t n + f p + f n )

4.2.2. Precision

P r e c i s i o n is the ratio of positive samples that are correctly predicted to the total number of samples that are predicted positive. P r e c i s i o n can be computed using Equation (4).
P r e c i s i o n = t p / ( t p + f p )

4.2.3. Recall

R e c a l l , or sometimes sensitivity, implies the ratio of total samples correctly classified as positive to all the samples that are in the actual positive class. The r e c a l l measure can be computed using Equation (5).
R e c a l l = t p / ( t p + f n )

4.2.4. F1-Score

F 1 - s c o r e measures the harmonic mean of p r e c i s i o n and r e c a l l . It is a strong measure in the case of unbalanced data. Equation (6) shows the computation mechanism of the F 1 - s c o r e .
F 1 - s c o r e = 2 ( P r e c i s i o n R e c a l l ) / ( P r e c i s i o n + R e c a l l )

4.2.5. AUC Score

AUC score is a very good metric; it evaluates the performance of a binary classifier with varying thresholds. It represents the ability of a classifier to successfully distinguish the classes. It is calculated from the ROC curve, which shows the trade-off of sensitivity (TPR) and specificity (FPR). A model has the best performance in distinguishing the classes if it has an AUC near to 1. Similarly, its performance is worst if its AUC score is near 0.

4.3. X-ray Dataset Results

The Keras DL models are employed to perform stacking and various matrices are calculated for each model as well as proposed architecture as illustrated in Table 5 and Figure 7. Training and validation batch size is kept at 90 with 7256 training and 1812 validation samples with an image size of 224. The Keras DL neural network library is used to fit the models using image data augmentation via the ImageDataGenerator class. The results highlighted in red are the models with the best performances out of the 15 models. The weights of these models are utilized in the deep stack ensembling approach to achieve 98.2% accuracy, outperforming the approaches in the literature.

4.4. Lung CT Scan Dataset Results

The performance results for the lung CT scan dataset (D2) for pandemic detection are depicted in Table 6. Training and validation batch size is kept at 32 with 1984 training and 497 validation samples with an image size of 224. ResNet50V2, MobileNet, DenseNet121, DenseNet201 and VGG16 achieve good results among the 15 models, which are highlighted in red and are used for stacking. The proposed approach achieved 98% accuracy as illustrated in Figure 8.

4.5. Lung Ultrasound Dataset Results

For ultrasound data (D3), the training and validation batch size is kept at 32 with 1448 training and 363 validation samples with an image size of 256 × 265. Table 7 depicts that DenseNet family and ResNet architectures achieve good results, which are further used as base learners for stack ensembling. The proposed architecture achieved 99% test accuracy as illustrated in Figure 9.

4.6. Proposed Ensembler Results for D1, D2, D3

The SVM is used as a meta classifier in the second level of ensembling. The base learners are selected in level 1 according to the performances on all three datasets. Table 8 presents the results of deep ensemble architecture on all three datasets. It is shown that after combining the predictions of CNN models, the proposed architecture achieved surprising results as depicted in Figure 10.
ROC curve plots are depicted in Figure 11, Figure 12 and Figure 13. The figure shows a graphical representation of proposed architecture performance. The True Positive Rate (TPR) and False Positive Rate (FPR) are plotted to generate the ROC curve. TPR displays the proportion of all positive samples with true positive predictions. The FPR displays the proportion of all negative samples that include false positive findings. The capacity of a classifier to correctly distinguish between classes is shown by the area under the curve, or AUC. An AUC score of 0.99 is achieved for all three datasets.
The confusion matrices for all three datasets are displayed in Figure 14, Figure 15 and Figure 16. It is shown that for the chest X-ray dataset, the proposed model correctly predicts 908 samples as positive while it correctly predicts 872 samples as normal out of 1812 total test samples. For the CT scan dataset, the model correctly predicts 242 positive samples and 247 negative samples from the total test samples, i.e., 497. Similarly, the proposed model correctly predicts 242 positive ultrasound samples and 117 negative samples from the total 363 ultrasound test samples.
Transfer Learning Stack Ensembling architecture is proposed by using multimodal imaging data to differentiate between patients who are either positive or negative for SARS-CoV-2, the pandemic disease. The proposed architecture finds out the 5 best performing CNN architectures among 15 for all three datasets. More accurate and reliable results are achieved by stacking these 5 models. This exhaustive approach is adopted so that the best possible combinations of models can be discovered for ensembling.
From the evaluation, it is shown that the proposed approach achieved good results for all three datasets, i.e., 99% test accuracy is achieved on the Ultrasound dataset, whereas 98.3% and 98.2% are achieved on X-ray and CT scan datasets. It is clear from these results that the proposed architecture performs best for both small and large datasets, as there are 2482 X-ray samples and 1811 ultrasound samples. This study also shows the importance of using DL technologies and Medical Imaging modalities in the prediction of pandemics, which can help in reducing the huge burden on the limited healthcare systems in most nations around the world.

4.7. Comparative Analysis

The performance comparison with state-of-the-art models is depicted in Table 9. The results for the X-ray, CT scan and ultrasound dataset of the proposed ensemble architecture are also mentioned. There are multiple works by different authors for the classification or prediction of pandemics using Medical Imaging modalities. In the literature, authors consider only one modality for pandemic diagnosis with a small number of training and testing images, which affects the performance of models. The accuracy, precision, recall and F1-score of different approaches and the proposed architecture are shown, which shows that the proposed solution outperforms the existing studies. Three different Medical Imaging modalities with large publicly available data samples are considered and a transfer learning stacking approach is applied to achieve the best results.

5. Conclusions

During the period of the pandemic, the load on radiologists has increased. The manual examination of radiographic images takes a lot of time and can be prone to human error. Therefore, an automatic decision support system for diagnoses of pandemics with high accuracy is needed. This research presented a Transfer Learning Stack Ensembling approach for pandemic detection using multimodal datasets to improve the results in existing studies. It uses the concept of transfer learning in which models already trained on the ImageNet dataset are re-trained on desired data to achieve the best results. Fifteen state-of-the-art DL models on three datasets (CT-scan, X-ray, Ultrasound) are trained. The performance of these models on three different datasets is evaluated and compared.
Further, a two-level stack ensembling of fine-tuned DL is performed to achieve more accurate results. These DL models are used as base learners in level 1, while SVM is used in level 2 of stacking to predict the result of pandemic positive (1) or negative (0). Accuracies of 98.3%, 98.2% and 99.0% for D1, D2 and D3, respectively, were achieved, outperforming existing research. These experimental results are considered a helpful tool for pandemic screening on chest X-ray, CT scan images and ultrasound images of infected patients. Future work will focus on the detection of various other diseases along with the pandemic for patients with respiratory problems, i.e., the detection of pneumonia, lung cancer and tuberculosis, to name a few.

Author Contributions

Conceptualization, R.M. and M.A.S.; Methodology, S.M.; Formal analysis, M.A.S.; Investigation, H.T.R.; Data curation, R.M.; Writing—original draft, R.M., H.A.K. and Z.A.; Visualization, H.A.K.; Supervision, H.A.K. All authors have read and agreed to the published version of the manuscript.

Funding

This work is partially supported by NUST SEED Grant NUST-22-41-44.

Institutional Review Board Statement

Not applicable.

Informed Consent Statement

Not applicable.

Data Availability Statement

Data used in this manuscript are from publicly available datasets, and the information related to datasets has been given in the references, including their URLs and access Dates.

Conflicts of Interest

The authors declare no conflict of interest.

References

  1. Mousavi, Z.; Rezaii, T.Y.; Sheykhivand, S.; Farzamnia, A.; Razavi, S. Deep convolutional neural network for classification of sleep stages from single-channel EEG signals. J. Neurosci. Methods 2019, 324, 108312. [Google Scholar] [CrossRef] [PubMed]
  2. Başaran, E.; Cömert, Z.; Çelik, Y. Convolutional neural network approach for automatic tympanic membrane detection and classification. Biomed. Signal Process. Control 2020, 56, 101734. [Google Scholar] [CrossRef]
  3. Graves, A. Long short-term memory. In Supervised Sequence Labelling with Recurrent Neural Networks; Springer: Berlin/Heidelberg, Germany, 2012; pp. 37–45. [Google Scholar]
  4. Hinton, G.E.; Osindero, S.; Teh, Y.W. A fast learning algorithm for deep belief nets. Neural Comput. 2006, 18, 1527–1554. [Google Scholar] [CrossRef] [PubMed]
  5. Sun, K.; Yuan, L.; Xu, H.; Wen, X. Deep Tensor Capsule Network. IEEE Access 2020, 8, 96920–96933. [Google Scholar] [CrossRef]
  6. Ghaderzadeh, M.; Asadi, F. Deep Learning in the Detection and Diagnosis of COVID-19 Using Radiology Modalities: A Systematic Review. J. Healthc. Eng. 2021, 2021, 6677314. [Google Scholar] [CrossRef]
  7. Lu, M.T.; Ivanov, A.; Mayrhofer, T.; Hosny, A.; Aerts, H.J.; Hoffmann, U. Deep learning to assess long-term mortality from chest radiographs. JAMA Netw. Open 2019, 2, e197416. [Google Scholar] [CrossRef] [Green Version]
  8. Zhu, N.; Zhang, D.; Wang, W.; Li, X.; Yang, B.; Song, J.; Zhao, X.; Huang, B.; Shi, W.; Lu, R.; et al. A Novel Coronavirus from Patients with Pneumonia in China, 2019. N. Engl. J. Med. 2020, 382, 727–733. [Google Scholar] [CrossRef]
  9. Pham, T.D. A comprehensive study on classification of COVID-19 on computed tomography with pretrained convolutional neural networks. Sci. Rep. 2020, 10, 16942. [Google Scholar] [CrossRef]
  10. Amis, E.S.; Butler, P.F.; Applegate, K.E.; Birnbaum, S.B.; Brateman, L.F.; Hevezi, J.M.; Mettler, F.A.; Morin, R.L.; Pentecost, M.J.; Smith, G.G.; et al. American College of Radiology White Paper on Radiation Dose in Medicine. J. Am. Coll. Radiol. 2007, 4, 272–284. [Google Scholar] [CrossRef]
  11. Shelton, A.B. What Is an Ultrasound? Available online: https://www.webmd.com/a-to-z-guides/what-is-an-ultrasound (accessed on 2 November 2021).
  12. Smith, M.J.; Hayward, S.A.; Innes, S.M.; Miller, A.S. Point-of-care lung ultrasound in patients with COVID-19—A narrative review. Anaesthesia 2020, 75, 1096–1104. [Google Scholar] [CrossRef]
  13. Horry, M.J.; Chakraborty, S.; Paul, M.; Ulhaq, A.; Pradhan, B.; Saha, M.; Shukla, N. COVID-19 Detection through Transfer Learning Using Multimodal Imaging Data. IEEE Access 2020, 8, 149808–149824. [Google Scholar] [CrossRef]
  14. Narin, A.; Kaya, C.; Pamuk, Z. Automatic detection of coronavirus disease (COVID-19) using X-ray images and deep convolutional neural networks. Pattern Anal. Appl. 2021, 24, 1207–1220. [Google Scholar] [CrossRef] [PubMed]
  15. Jain, R.; Gupta, M.; Taneja, S.; DJ, H. Deep learning based detection and analysis of COVID-19 on chest X-ray images. In Proceedings of the 2021 International Conference on Information and Communication Technology for Sustainable Development, Dhaka, Bangladesh, 27–28 February 2021; pp. 210–214. [Google Scholar] [CrossRef]
  16. Alqudah, A.M.; Qazan, S.; Alqudah, A. Automated Systems for Detection of COVID-19 Using Chest X-ray Images and Lightweight Convolutional Neural Networks. Res. Sq. 2020, 2020, 1–26. [Google Scholar] [CrossRef]
  17. Gautam, A.; Raman, B. Towards effective classification of brain hemorrhagic and ischemic stroke using CNN. Biomed. Signal Process. Control 2021, 63, 102178. [Google Scholar] [CrossRef]
  18. Mehrotra, R.; Ansari, M.; Agrawal, R.; Anand, R. A Transfer Learning approach for AI-based classification of brain tumours. Mach. Learn. Appl. 2020, 2, 100003. [Google Scholar]
  19. Sultan, H.H.; Salem, N.M.; Al-Atabany, W. Multi-Classification of Brain tumour Images Using Deep Neural Network. IEEE Access 2019, 7, 69215–69225. [Google Scholar] [CrossRef]
  20. Harangi, B. Skin lesion classification with ensembles of deep convolutional neural networks. J. Biomed. Inform. 2018, 86, 25–32. [Google Scholar] [CrossRef]
  21. Hosny, K.M.; Kassem, M.A.; Foaud, M.M. Skin cancer classification using deep learning and transfer learning. In Proceedings of the 2018 9th Cairo International Biomedical Engineering Conference (CIBEC), Cairo, Egypt, 20–22 December 2018; pp. 90–93. [Google Scholar]
  22. Lakshmanaprabu, S.; Mohanty, S.N.; Shankar, K.; Arunkumar, N.; Ramirez, G. Optimal deep learning model for classification of lung cancer on CT images. Future Gener. Comput. Syst. 2019, 92, 374–382. [Google Scholar]
  23. Khan, A.I.; Shah, J.L.; Bhat, M.M. CoroNet: A deep neural network for detection and diagnosis of COVID-19 from chest X-ray images. Comput. Methods Programs Biomed. 2020, 196, 105581. [Google Scholar] [CrossRef]
  24. Ghoshal, B.; Tucker, A. Estimating uncertainty and interpretability in deep learning for coronavirus (COVID-19) detection. arXiv 2020, arXiv:2003.10769. [Google Scholar]
  25. Hemdan, E.E.D.; Shouman, M.A.; Karar, M.E. Covidx-net: A framework of deep learning classifiers to diagnose covid-19 in X-ray images. arXiv 2020, arXiv:2003.11055. [Google Scholar]
  26. Ucar, F.; Korkmaz, D. COVIDiagnosis-Net: Deep Bayes-SqueezeNet based diagnosis of the coronavirus disease 2019 (COVID-19) from X-ray images. Med. Hypotheses 2020, 140, 109761. [Google Scholar] [CrossRef] [PubMed]
  27. Sahinbas, K.; Catak, F.O. Transfer learning-based convolutional neural network for COVID-19 detection with X-ray images. In Data Science for COVID-19; Elsevier: Amsterdam, The Netherlands, 2021; pp. 451–466. [Google Scholar]
  28. Mei, X.; Lee, H.C.; Diao, K.y.; Huang, M.; Lin, B.; Liu, C.; Xie, Z.; Ma, Y.; Robson, P.M.; Chung, M.; et al. Artificial intelligence–enabled rapid diagnosis of patients with COVID-19. Nat. Med. 2020, 26, 1224–1228. [Google Scholar] [CrossRef] [PubMed]
  29. Ardakani, A.A.; Kanafi, A.R.; Acharya, U.R.; Khadem, N.; Mohammadi, A. Application of deep learning technique to manage COVID-19 in routine clinical practice using CT images: Results of 10 convolutional neural networks. Comput. Biol. Med. 2020, 121, 103795. [Google Scholar] [CrossRef]
  30. Pathak, Y.; Shukla, P.K.; Arya, K.V. Deep Bidirectional Classification Model for COVID-19 Disease Infected Patients. IEEE/ACM Trans. Comput. Biol. Bioinform. 2021, 18, 1234–1241. [Google Scholar] [CrossRef]
  31. Zen, H.; Senior, A. Deep mixture density networks for acoustic modeling in statistical parametric speech synthesis. In Proceedings of the 2014 IEEE International Conference on Acoustics, Speech and Signal Processing (ICASSP), Florence, Italy, 4–9 May 2014; pp. 3844–3848. [Google Scholar]
  32. Qiblawey, Y.; Tahir, A.; Chowdhury, M.E.; Khandakar, A.; Kiranyaz, S.; Rahman, T.; Ibtehaz, N.; Mahmud, S.; Al Maadeed, S.; Musharavati, F.; et al. Detection and severity classification of COVID-19 in CT images using deep learning. Diagnostics 2021, 11, 893. [Google Scholar] [CrossRef]
  33. Ye, J.C.; Sung, W.K. Understanding geometry of encoder-decoder CNNs. In Proceedings of the International Conference on Machine Learning, PMLR, Long Beach, CA, USA, 9–15 June 2019; pp. 7064–7073. [Google Scholar]
  34. Lin, T.Y.; Dollár, P.; Girshick, R.; He, K.; Hariharan, B.; Belongie, S. Feature pyramid networks for object detection. In Proceedings of the IEEE Conference on Computer Vision and Pattern Recognition, Honolulu, HI, USA, 21–26 July 2017; pp. 2117–2125. [Google Scholar]
  35. Özkaya, U.; Öztürk, Ş.; Barstugan, M. Coronavirus (COVID-19) classification using deep features fusion and ranking technique. In Big Data Analytics and Artificial Intelligence Against COVID-19: Innovation Vision and Approach; Springer: Berlin/Heidelberg, Germany, 2020; pp. 281–295. [Google Scholar]
  36. Xu, X.; Jiang, X.; Ma, C.; Du, P.; Li, X.; Lv, S.; Yu, L.; Ni, Q.; Chen, Y.; Su, J.; et al. A deep learning system to screen novel coronavirus disease 2019 pneumonia. Engineering 2020, 6, 1122–1129. [Google Scholar] [CrossRef]
  37. Shah, V.; Keniya, R.; Shridharani, A.; Punjabi, M.; Shah, J.; Mehendale, N. Diagnosis of COVID-19 using CT scan images and deep learning techniques. Emerg. Radiol. 2021, 28, 497–505. [Google Scholar] [CrossRef]
  38. Wang, N.; Liu, H.; Xu, C. Deep Learning for the Detection of COVID-19 Using Transfer Learning and Model Integration. In Proceedings of the ICEIEC 2020—2020 IEEE 10th International Conference on Electronics Information and Emergency Communication, Beijing, China, 17–19 July 2020; pp. 281–284. [Google Scholar] [CrossRef]
  39. Silva, P.; Luz, E.; Silva, G.; Moreira, G.; Silva, R.; Lucio, D.; Menotti, D. COVID-19 detection in CT images with deep learning: A voting-based scheme and cross-datasets analysis. Inform. Med. Unlocked 2020, 20, 100427. [Google Scholar] [CrossRef]
  40. Turkoglu, M. COVID-19 detection system using chest CT images and multiple kernels-extreme learning machine based on deep neural network. IRBM 2021, 42, 207–214. [Google Scholar] [CrossRef]
  41. Gifani, P.; Shalbaf, A.; Vafaeezadeh, M. Automated detection of COVID-19 using ensemble of transfer learning with deep convolutional neural network based on CT scans. Int. J. Comput. Assist. Radiol. Surg. 2021, 16, 115–123. [Google Scholar] [CrossRef] [PubMed]
  42. Karnati, M.; Seal, A.; Sahu, G.; Yazidi, A.; Krejcar, O. A novel multi-scale based deep convolutional neural network for detecting COVID-19 from X-rays. Appl. Soft Comput. 2022, 125, 109109. [Google Scholar] [CrossRef] [PubMed]
  43. Vyas, S.; Seal, A. A comparative study of different feature extraction techniques for identifying COVID-19 patients using chest X-rays images. In Proceedings of the 2020 International Conference on Decision Aid Sciences and Application (DASA), Sakheer, Bahrain, 8–9 November 2020; pp. 209–213. [Google Scholar]
  44. Dash, S.; Verma, S.; Bevinakoppa, S.; Wozniak, M.; Shafi, J.; Ijaz, M.F. Guidance image-based enhanced matched filter with modified thresholding for blood vessel extraction. Symmetry 2022, 14, 194. [Google Scholar] [CrossRef]
  45. Seal, A.; Bhattacharjee, D.; Nasipuri, M. Predictive and probabilistic model for cancer detection using computer tomography images. Multimed. Tools Appl. 2018, 77, 3991–4010. [Google Scholar] [CrossRef]
  46. Woźniak, M.; Siłka, J.; Wieczorek, M. Deep neural network correlation learning mechanism for CT brain tumour detection. Neural Comput. Appl. 2021, 3, 1–16. [Google Scholar] [CrossRef]
  47. Raheja, R.; Brahmavar, M.; Joshi, D.; Raman, D. Application of lung ultrasound in critical care setting: A review. Cureus 2019, 11, e5233. [Google Scholar] [CrossRef] [Green Version]
  48. Diaz-Escobar, J.; Ordóñez-Guillén, N.E.; Villarreal-Reyes, S.; Galaviz-Mosqueda, A.; Kober, V.; Rivera-Rodriguez, R.; Lozano Rizk, J.E. Deep-learning based detection of COVID-19 using lung ultrasound imagery. PLoS ONE 2021, 16, e0255886. [Google Scholar] [CrossRef]
  49. Muhammad, L.J.; Islam, M.M.; Usman, S.S.; Ayon, S.I. Predictive Data Mining Models for Novel Coronavirus (COVID-19) Infected Patients’ Recovery. SN Comput. Sci. 2020, 1, 206. [Google Scholar] [CrossRef]
  50. Roy, S.; Menapace, W.; Oei, S.; Luijten, B.; Fini, E.; Saltori, C.; Huijben, I.; Chennakeshava, N.; Mento, F.; Sentelli, A.; et al. Deep learning for classification and localization of COVID-19 markers in point-of-care lung ultrasound. IEEE Trans. Med. Imaging 2020, 39, 2676–2687. [Google Scholar] [CrossRef]
  51. Das, A.K.; Ghosh, S.; Thunder, S.; Dutta, R.; Agarwal, S.; Chakrabarti, A. Automatic COVID-19 detection from X-ray images using ensemble learning with convolutional neural network. Pattern Anal. Appl. 2021, 24, 1111–1124. [Google Scholar] [CrossRef]
  52. Singh, S. Covid X-ray Dataset. Available online: https://www.kaggle.com/whysodarkbro/covid-xray-dataset (accessed on 17 August 2021).
  53. Siddhartha, M. COVID CXR Image Dataset (Research). Available online: https://www.kaggle.com/sid321axn/covid-cxr-image-dataset-research (accessed on 20 August 2021).
  54. Rahman, T. COVID-19 Radiography Database. Available online: https://www.kaggle.com/tawsifurrahman/covid19-radiography-database (accessed on 1 September 2021).
  55. Soares, E.; Angelov, P.U.d.L. SARS-CoV-2 Ct-Scan Dataset. 2020. Available online: https://www.kaggle.com/datasets/plameneduardo/sarscov2-ctscan-dataset (accessed on 25 September 2021).
  56. Born, J.; Brändle, G.; Cossio, M.; Disdier, M.; Goulet, J.; Roulin, J.; Wiedemann, N. COVID-19 Lung Ultrasound Dataset. Available online: https://github.com/jannisborn/covid19_ultrasound/tree/master/data (accessed on 4 October 2021).
  57. Hussain, M.; Bird, J.J.; Faria, D.R. A study on cnn transfer learning for image classification. In Proceedings of the UK Workshop on Computational Intelligence, Nottingham, UK, 5–7 September 2018; pp. 191–202. [Google Scholar]
  58. Mohammed, M.; Mwambi, H.; Mboya, I.B.; Elbashir, M.K.; Omolo, B. A stacking ensemble deep learning approach to cancer type classification based on TCGA data. Sci. Rep. 2021, 11, 15626. [Google Scholar] [CrossRef] [PubMed]
  59. Bellmann, P.; Thiam, P.; Schwenker, F. Multi-classifier-Systems: Architectures, algorithms and applications. In Studies in Computational Intelligence; Pedrycz, W., Chen, S.M., Eds.; Springer International Publishing: Cham, Switzerland, 2018; Volume 777, pp. 83–113. [Google Scholar] [CrossRef]
  60. Rokach, L. Ensemble-based classifiers. Artif. Intell. Rev. 2010, 33, 1–39. [Google Scholar] [CrossRef]
  61. Markham, K. Simple Guide to Confusion Matrix Terminology. Available online: https://www.dataschool.io/simple-guide-to-confusion-matrix-terminology/ (accessed on 5 November 2021).
  62. Muhammad, G.; Shamim Hossain, M. COVID-19 and Non-COVID-19 Classification using Multi-layers Fusion From Lung Ultrasound Images. Inf. Fusion 2021, 72, 80–88. [Google Scholar] [CrossRef] [PubMed]
Figure 1. Proposed Methodology.
Electronics 11 03974 g001
Figure 2. Covid-infected and Normal Chest X-ray Data Samples.
Electronics 11 03974 g002
Figure 3. Covid-infected and Normal Lung CT scan Data Samples.
Electronics 11 03974 g003
Figure 4. Covid-infected and Normal Lung Ultrasound Data Samples.
Electronics 11 03974 g004
Figure 5. Basic Idea of Stack Ensembling Approach.
Electronics 11 03974 g005
Figure 6. Proposed Stack Ensembling Architecture.
Electronics 11 03974 g006
Figure 7. X-ray Dataset Results.
Electronics 11 03974 g007
Figure 8. Lung CT Scan Dataset Results.
Electronics 11 03974 g008
Figure 9. Lung Ultrasound Dataset Results.
Electronics 11 03974 g009
Figure 10. Proposed Ensembler Results for D1, D2, D3.
Electronics 11 03974 g010
Figure 11. ROC Curve D1.
Electronics 11 03974 g011
Figure 12. ROC Curve D2.
Electronics 11 03974 g012
Figure 13. ROC Curve D3.
Electronics 11 03974 g013
Figure 14. Confusion Matrix D1.
Electronics 11 03974 g014
Figure 15. Confusion Matrix D2.
Electronics 11 03974 g015
Figure 16. Confusion Matrix D3.
Electronics 11 03974 g016
Table 1. Unique features in Proposed Approach.
Author(s)CNNTransfer LearningMultimodal DatasetsEnsemblingTransfer Learning Stacking
Shah et al. [37]
Gifani et al. [41]
Khan et al. [23]
Das et al. [51]
Escobar et al. [48]
Horry et al. [13]
Proposed
Table 2. Dataset Description.
DatasetsSourceTotal SamplesInfected SamplesNon-Infected Samples
Chest X-ray[52,53,54]723645834600
Lung CT scan[55]248212521230
Lung Ultrasound[56]18115661245
Table 3. CNN Architecture Characteristics.
CNN ArchitectureSize (MB)Total ParametersTrainable ParametersDepthInput Size
InceptionResNetV221554,392,03355,297164299 × 299
ResNet50V29831,431,0417,866,24150224 × 224
ResNet509831,453,9537,866,24150224 × 224
ResNet10117150,524,4177,866,241101224 × 224
ResNet15223266,237,1857,866,241152224 × 224
DenseNet1213310,971,5853,934,081121224 × 224
DenseNet1695719,034,5616,391,681169224 × 224
DenseNet2018025,696,7057,374,721201224 × 224
MobileNet167,162,9453,934,08188224 × 224
VGG1652816,682,6891,968,00116224 × 224
VGG1954921,992,3851,968,00119224 × 224
MobileNetV2147,175,1054,917,12153224 × 224
Xception8828,727,7217,866,24171224 × 224
InceptionV39226,228,3854,425,601159299 × 299
EfficientNetB0298,966,6924,917,121237224 × 224
Table 4. Summary of Experimental Details.
ParametersValue
Base LearnersInceptionResNetV2, ResNet50V2, ResNet50, ResNet101, ResNet152, DenseNet121, DenseNet169, DenseNet201, MobileNet, VGG16, VGG19, MobileNetV2, Xception, InceptionV3, EfficientNetB0, Meta Classifier, Support Vector Machine
EnvironmentGoogle Colab Pro
RAM25 GB
GPUTeslaP100
Programming languagePython (v3.7)
LibrariesTensorflow 2.6, Keras, Scikitlearn
No of Epochs50
Learning Rate0.001
OptimizerAdams
Loss FunctionBinary Cross Entropy
Evaluation Metrics usedAccuracy, Precision, Recall, F1 Score
Table 5. X-ray Dataset Results. The red color is highlighting the best performing models among 15. Those models are basically picked as base learners. The bold is highlighting that after ensembling we are getting improved results.
ModelsAccuracy (%)Precision (%)Recall (%)F1-Score (%)
InceptionResNetV291.891.292.992
ResNet50V29494.393.794
ResNet5075.677.472.374.8
ResNet1017680.768.273.9
ResNet15276.178.672.675.5
MobileNetV294.996.593.495
MobileNet96.395.597.396.4
VGG1994.494.594.394.4
VGG1695.993.598.696
DenseNet12195.394.696.395.4
DenseNet20193.391.695.393.4
DenseNet169969597.396.1
EfficientNetB077.27977.378.1
Xception90.691.489.790.5
InceptionV390.889.892.190.9
Proposed98.29898.398.2
Table 6. Lung CT Scan Dataset Results. The red color is highlighting the best performing models among 15. Those models are basically picked as base learners. The bold is highlighting that after ensembling we are getting improved results.
ModelsAccuracy (%)Precision (%)Recall (%)F1-Score (%)
InceptionResNetV291.989.994.392
ResNet50V294.393.994.794.3
ResNet5084.981.589.885.4
ResNet10178.479.875.677.6
ResNet15281.678.586.582.3
MobileNetV292.593.79192.3
MobileNet95.995.995.995.9
VGG1992.391.293.492.3
VGG1693.793.593.993.7
DenseNet12196.195.297.196.1
DenseNet20196.597.595.596.5
DenseNet16993.794.692.693.6
EfficientNetB083.186.382.584.4
Xception90.785.997.191.2
InceptionV391.590.892.291.5
Proposed98.3998.3798.3798.37
Table 7. Lung Ultrasound Dataset Results. The red color is highlighting the best performing models among 15. Those models are basically picked as base learners. The bold is highlighting that after ensembling we are getting improved results.
ModelsAccuracy (%)Precision (%)Recall (%)F1-Score (%)
InceptionResNetV288.191.39191.2
ResNet50V293.39298.195
ResNet5094.29991.495.1
ResNet10194.498.393.795.9
ResNet15297.29699.198
MobileNetV292.598.189.394.1
MobileNet88.186.397.991.7
VGG1993.397.492.694.9
VGG1688.785.69992.2
DenseNet12194.398.293.695.8
DenseNet20194.798.19396
DenseNet1699597.793.895.3
EfficientNetB082.680.597.988.3
Xception83.4839689
InceptionV392.59098.193.8
Proposed9999.598.799.1
Table 8. Proposed Architecture Results.
DatasetsAccuracy (%)Precision (%)Recall (%)F1-Score (%)AUC Score
D1 (X-ray)98.29898.398.20.99
D2 CT Scan)98.3998.3798.3798.370.99
D3 (Ultrasound)9999.598.799.10.99
Table 9. Comparison with the Literature (Text in bold represents the contributions and improvements of our work).
MethodsModalityTotal SamplesAccuracyPrecisionRecallF1-Score
Shah et al. [37]CT-scan73894.50%94.10%94.10%94.10%
Gifani et al. [41]CT-scan74885.20%85.70%85.40%85.20%
Das et al. [51]X-ray100691.60%-95.00%91.70%
Khan et al. [23]X-ray60095%95%96.90%95.60%
Escobar et al. [48]Ultrasound181189.10%90.186.40%88.00%
Muhammad et al. [62]Ultrasound181191.892.593.2-
ProposedCT-scan248298.3998.3798.3798.37
X-ray723698.2098.098.3098.20
Ultrasound181199.099.5098.7099.10
Publisher’s Note: MDPI stays neutral with regard to jurisdictional claims in published maps and institutional affiliations.

