1. Introduction
The market explosion of big data [
1], automatous cars [
2], and artificial intelligence internet of things (AIoT) [
3,
4,
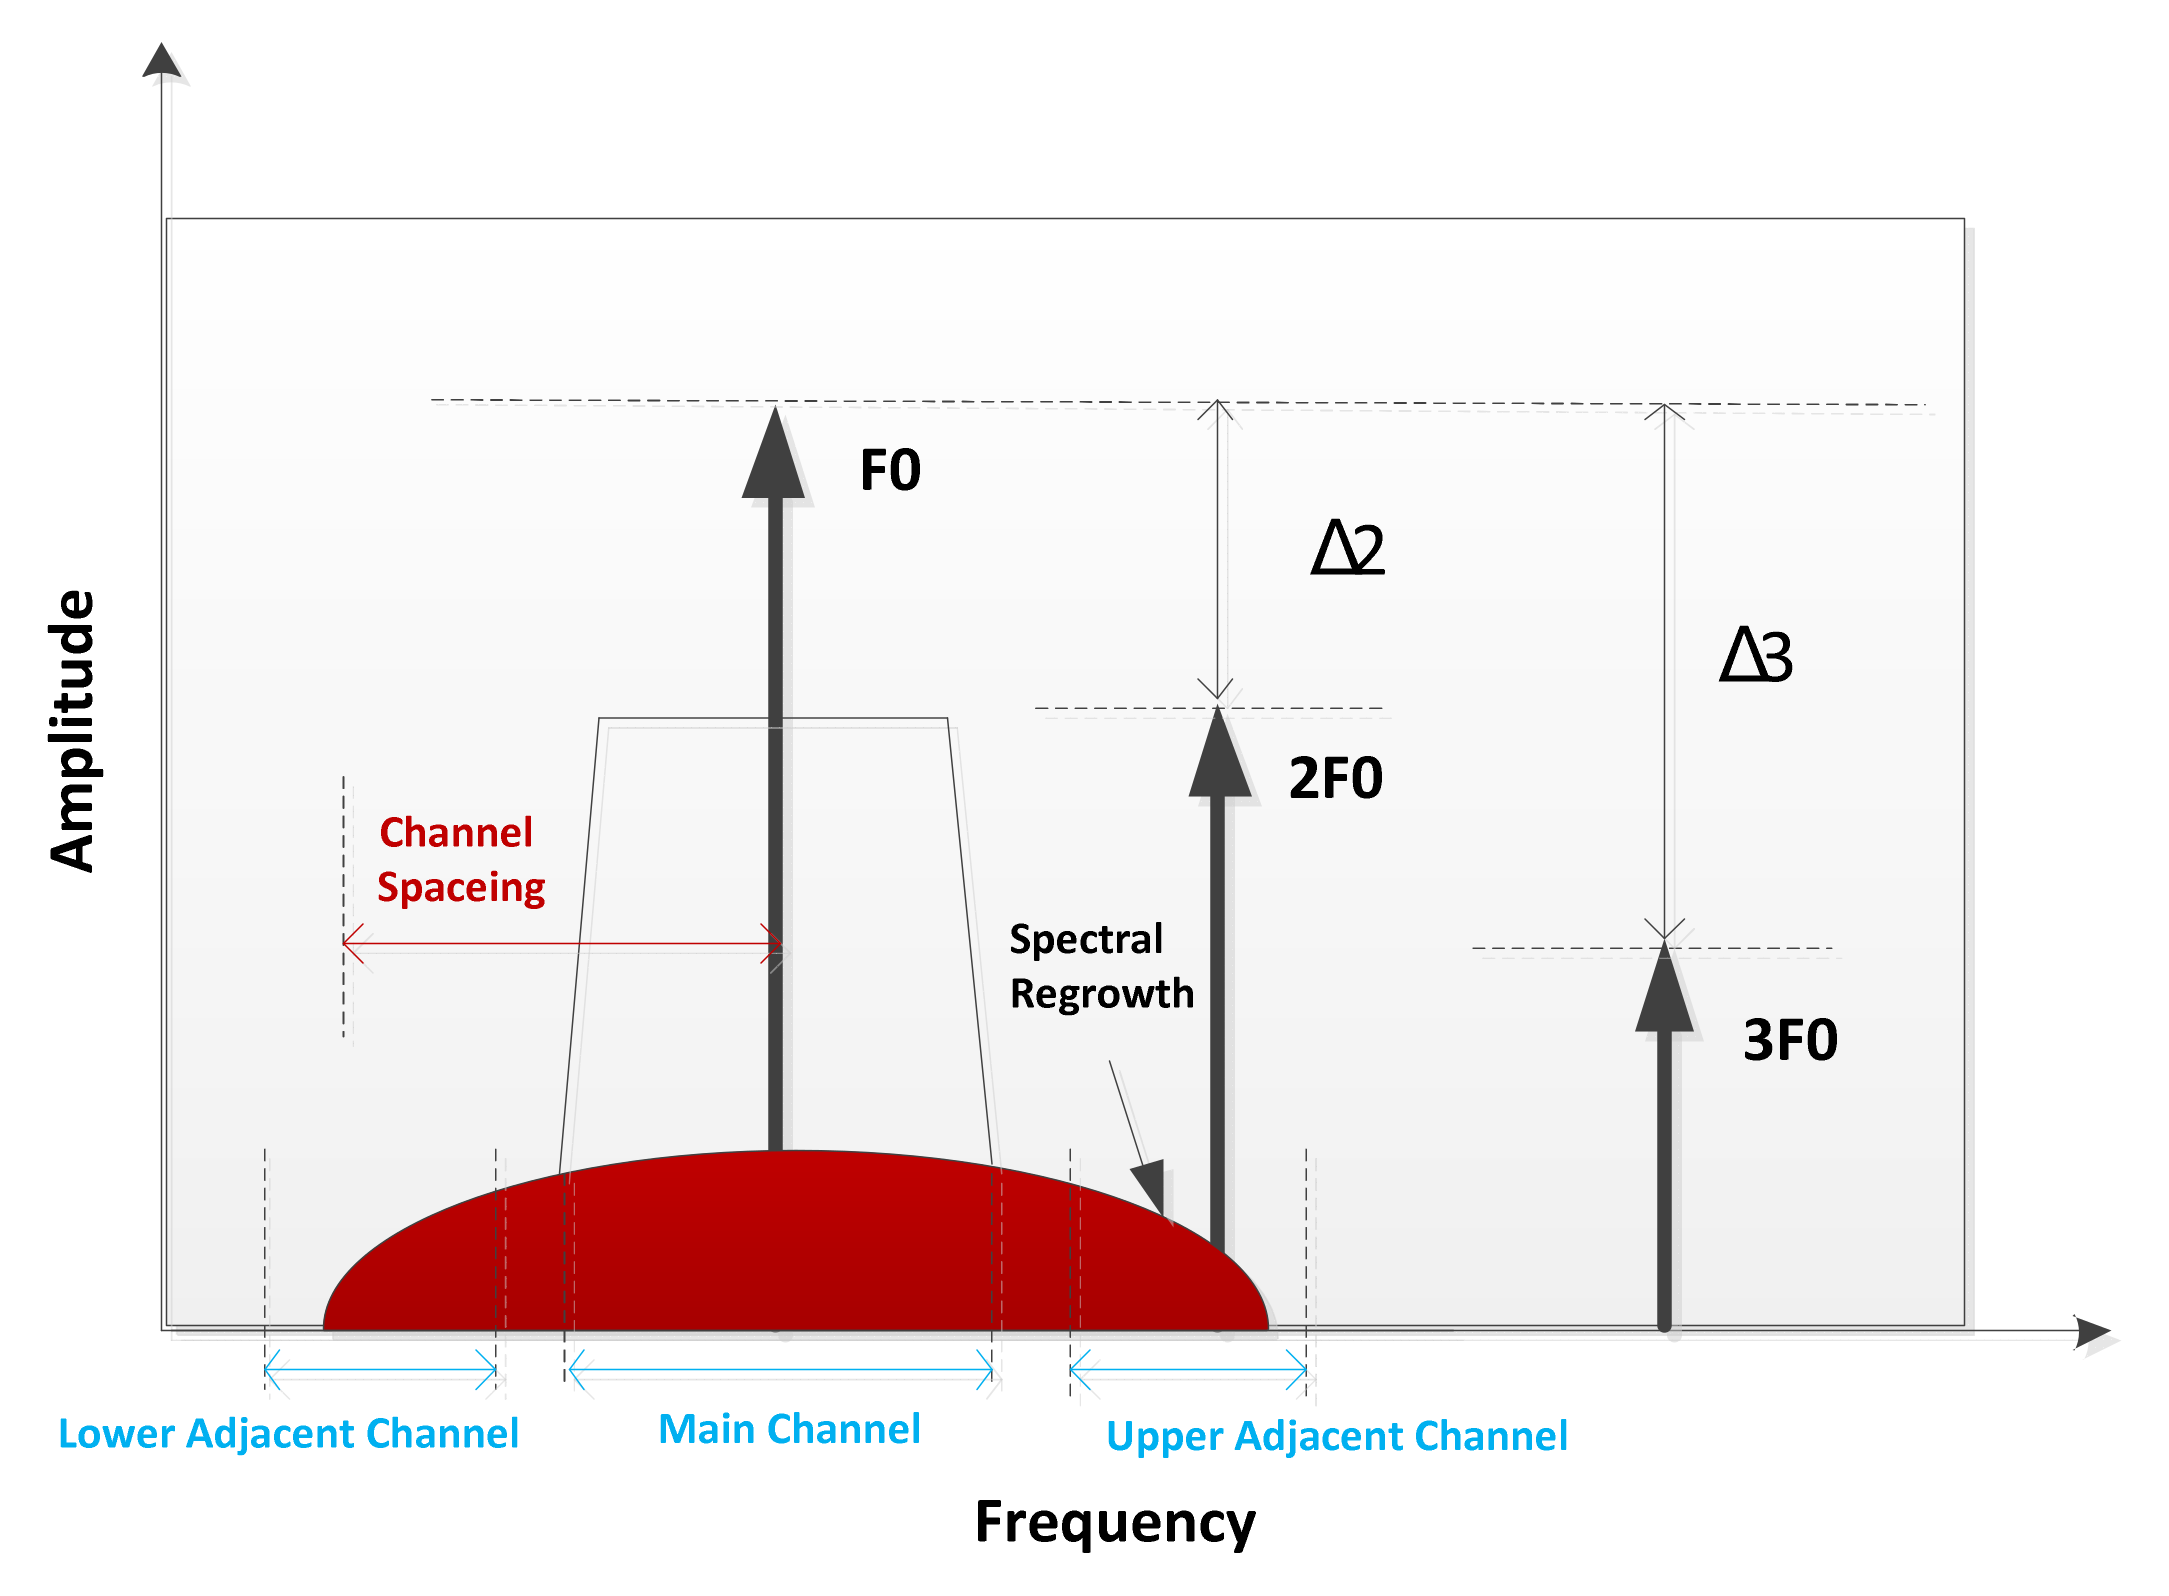
5] boosts the global demands of the multi-mode and multi-frequency. Facing the upcoming information era, frequency channel spacing is close to achieving spectral efficiency as indicated in
Figure 1. In narrow-band and wide-band communication systems, the distortion products might be unwanted in-channel, in-band, or out-of-band spectral signals. It would seriously restrict the bandwidth resource. The major impact is harmonic distortion. Harmonic distortion is defined as the amplitude- transferring characteristics of the device which prevent it from precisely tracking the input signal. It generates integer multiples of the input signal frequencies. Harmonic distortion not only degrades the performance of the transmitter but also the sensitivity of receivers.
In order to improve spectrum efficiency and restrain the non-linear distortion, most studies focus on protocol algorithms, material processes, and circuit design architecture. The spectrum allocation technique is essential for the protocol algorithm [
6]. Some researchers investigate joint user association and spectrum allocation to further improve spectral efficiency for massive multiple-input multiple-output (MIMO) enabled heterogeneous networks with full-duplex wireless backhaul [
7]. Some researchers study the device structure and process to optimize the harmonic distortion suppression such as silicon on insulator (SOI). SOI CMOS process plays a pivotal role in material process control. It is selected to fabricate the chip to restrain the harmonic distortion brought from the silicon substrate. Both standard high resistivity HR-SOI and two types of trap-rich high resistivity HR-SOI substrates named enhanced signal integrity high resistivity silicon-on-insulator (eSI HR-SOI) provided by SOITEC are thoroughly studied and compared to eliminate distortion coming from the parasitical effect of the substrate structure [
8,
9,
10,
11]. Meanwhile, both symmetry shunt/series stacked topology and asymmetry with double floating techniques [
12,
13] are for high linear design architecture. The design with integrated filtering performance is to linearize the high-power antenna and power amplifiers’ distortion performance [
14,
15]. The dual coupled-line sections embedded in the conventional quarter-wavelength transmission lines are designed for wideband filtering power divider with ultra-wideband harmonic rejection and isolation [
16].
However, the phase angles’ effects of harmonic measurement are simply ignored and they have not been investigated thoroughly. The existing methodologies and protocols for harmonics characterizing are only confined to the measurement of the amplitudes of these quantities [
17,
18,
19]. It is critical to detect undesirable and nonlinear spectral distortions. The accurate optimal harmonic rejection and measurement are becoming new hotspots in the communication and semiconductor domains. The conventional method based on the standard 50-ohm terminator for harmonic contribution assessment highly depends on instrument accuracy and testing environment [
20]. What’s more, the repeatability and reproducibility challenge of harmonic measurement is also unprecedented. The SOI monolithic RF switch is realized as the carrier in the following paper. The high linear performance of the RF switch is already optimized by both eSI HR-SOI process control and symmetry stacked design topology. This work focuses on measurement methodology for deep further harmonic accuracy and stability improvement. DTPT with isolation compensation methodology is proposed to improve harmonics measurement accuracy and stability. The intrinsic device harmonic characteristic measured precisely could be the basis of reference for design optimization.
2. Mechanism on Harmonic Measurement Architecture
The harmonic distortion is generally emitted by nonlinear loads of the nonlinear system. It adds overtones that are whole number multiples of a wave’s frequencies. Nonlinearities that give rise to amplitude distortion in the systems are most often measured in terms of the harmonics added to a pure sine wave fed to the system. Harmonic distortion may be expressed in terms of the relative strength of individual components as below:
where,
is the nonlinear system function expression and
is the single-tone wave input. The second term of a polynomial represents the fundamental of the frequency. The third and fourth terms of polynomials stand for the second and the third harmonics.
is expressed [
21] as follows:
where
are the scattering coefficients of the device under test (DUT).
and
are the source and load reflection coefficients looking from different test ports, respectively.
The straightforward harmonic distortion measurement method is using a continuous wave tone.
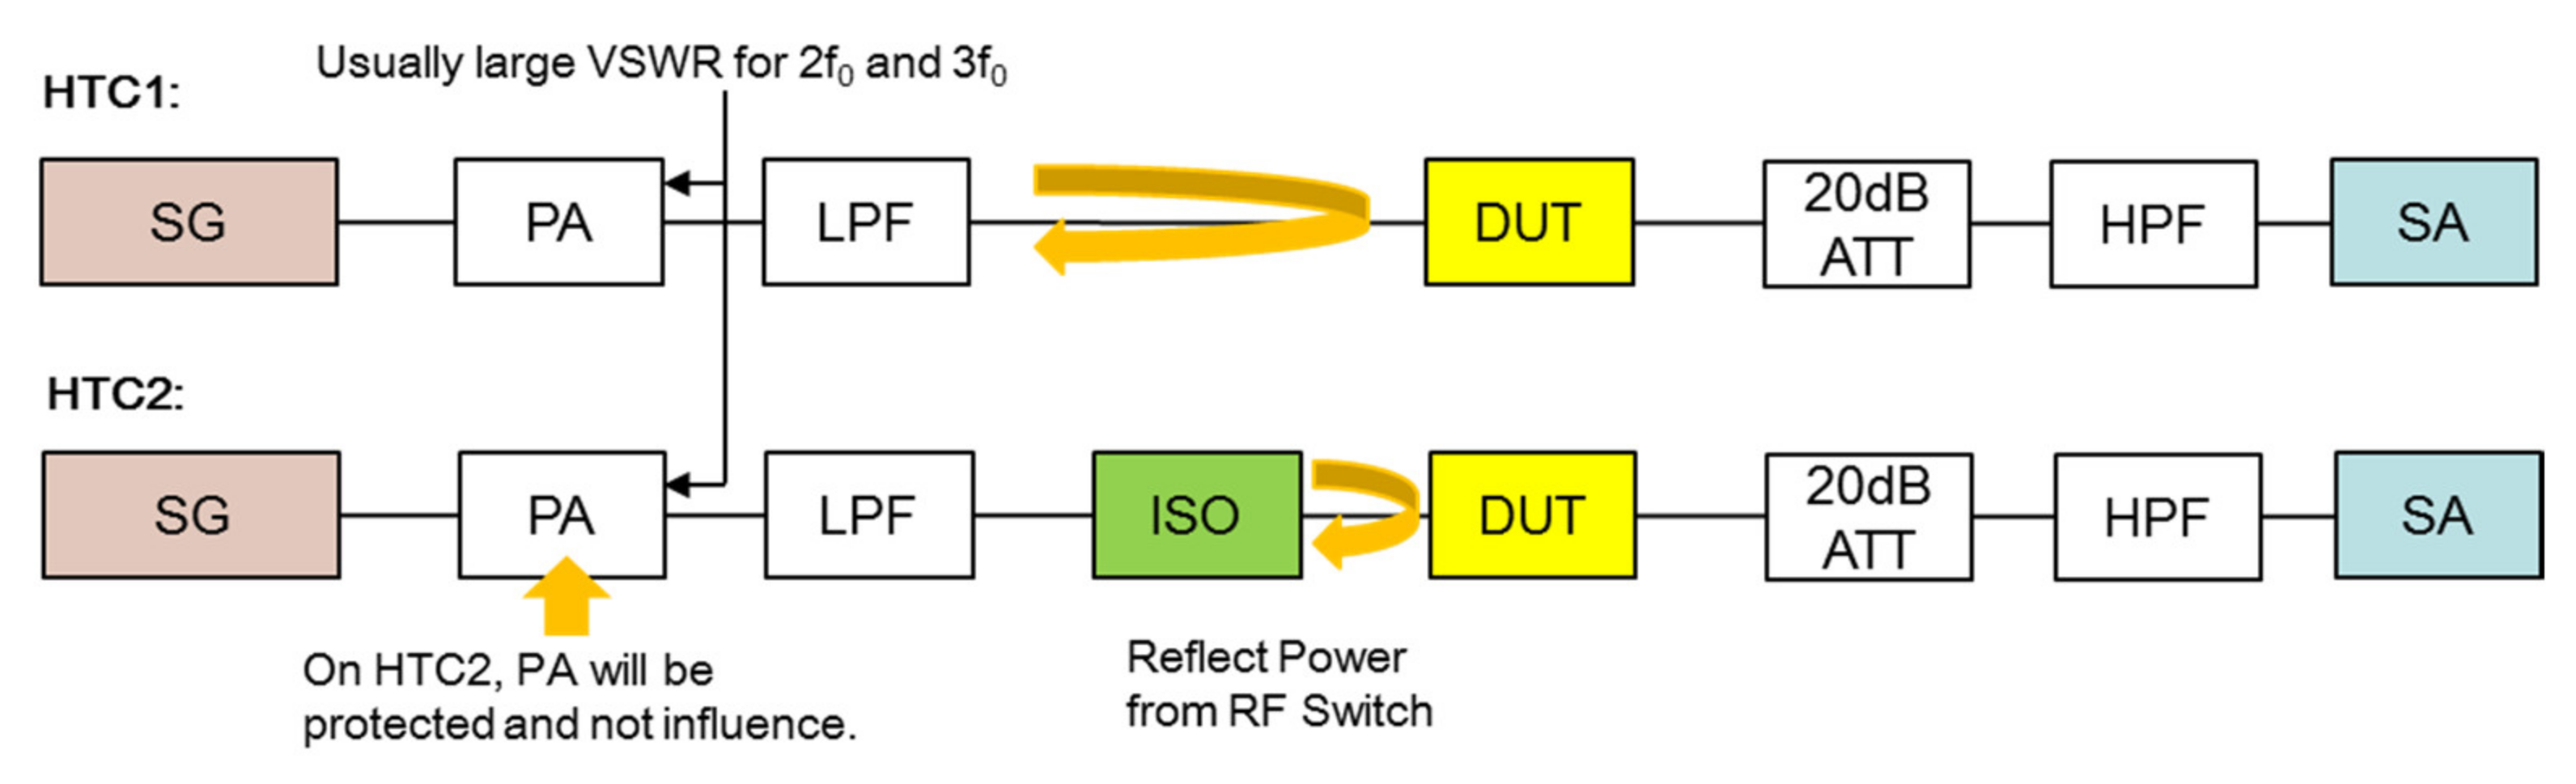
Figure 2 shows the conventional high-power harmonic measurement architecture diagram. A signal generator (SG) provides the fundamental wave. In order to effectively release the methodology to volume multi-test verification, a V93K tester with a PSRF instrument card is selected as the signal generator whose power capability is 12 dBm. While doing the high-power harmonic measurement, the stimulus test signal requires over 36 dBm generally. Due to the fact that the basic instruments can’t provide such a high input power, the external power amplifier (PA) is involved to provide certain and effective gain. In this paper, the gain of PA is 50 dB and the power handling capability is 45 dBm. Due to the introduction of the PA, the system has a high universality even though the SG is changed. Considering the PA’s nonlinear characteristic, the multiple harmonics introduced by the amplifier itself can’t be ignored. In order to eliminate the harmonic distortion caused by the amplifier, the additional low pass filter (LPF) is introduced into the test system to isolate the harmonic caused by the nonlinear factors of the power amplifier. The pass-band of LPF is DC-1000 MHz and the out-band rejection is 52 dB.
The interface plane between LPF and DUT will cause the phase shift and impedance mismatch that lead to the generation of undesired nonlinear terms. Sometimes the distortion will be seriously amplified, specifically in such a high-power condition evaluation. In order to obtain the pure stimulus signal which doesn’t mask the DUT’s actual performance, one more Isolator (ISO) is in the loop to improve the source’s effective harmonic distortion. In the back-end loop of the test chain, a cascaded attenuator and high pass filter (HPF) are used to avoid such high-power fundamentals in the spectrum analyzer (SA). The pass-band of HPF is 1650–5000 MHz and the out-band rejection is 51 dB. Characterizing the harmonic distortion performance of the switch requires a low-distortion stimulus test signal and accurate measurement instruments and methods. The sensitivity of the harmonic measurement is restricted by the source’s intrinsic harmonic and the SA dynamic range.
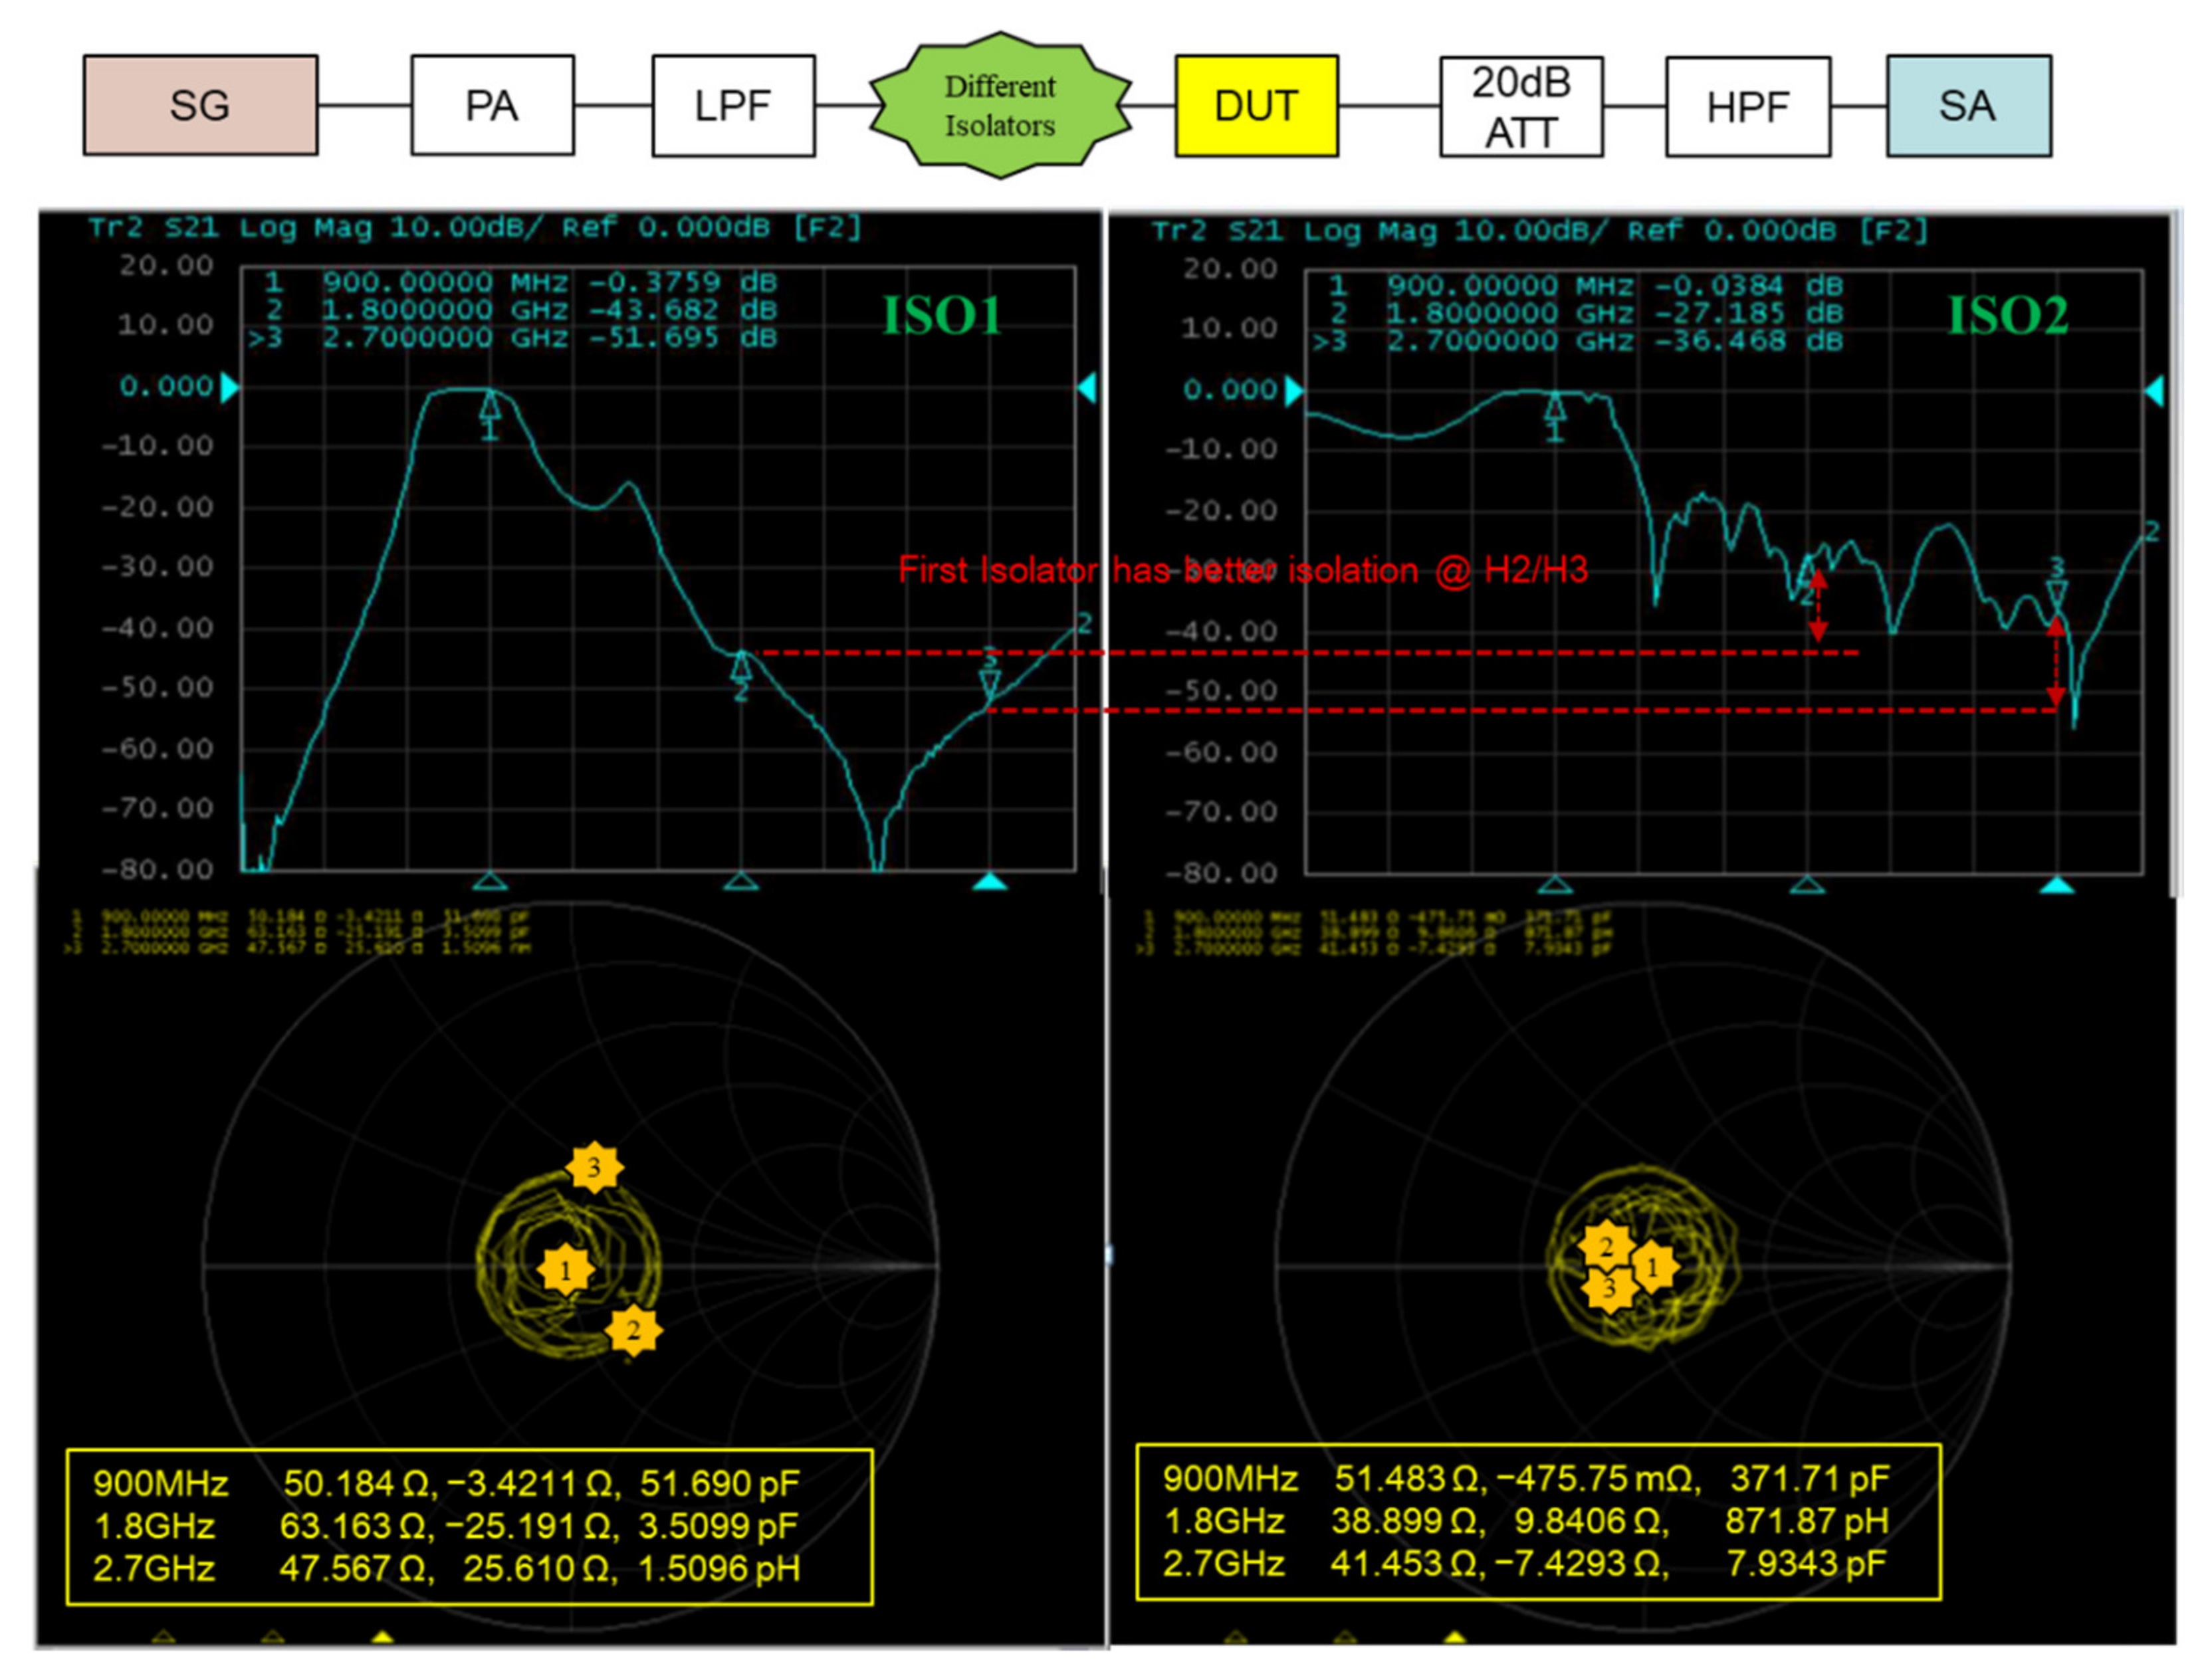
In order to demonstrate the above model, two different performance ISOs are used for the bench analysis. As a result, the difference gap of harmonic distortion almost reaches 10 dB while it works at high power transmission. The second harmonic is seriously affected without an isolator in the measurement system. For further study, we measure the smith chart and S parameter as
Figure 3 shown. It is found that the harmonic impedance termination has a great influence on the distortion performance of the switch.
3. DTPT for High Accuracy Harmonic Measurement
The above description of the analytical model demonstrates that the front-end and back-end harmonic impedance termination seriously affects the RF devices’ distortion. Meanwhile, the best condition of the port match needs to be found out.
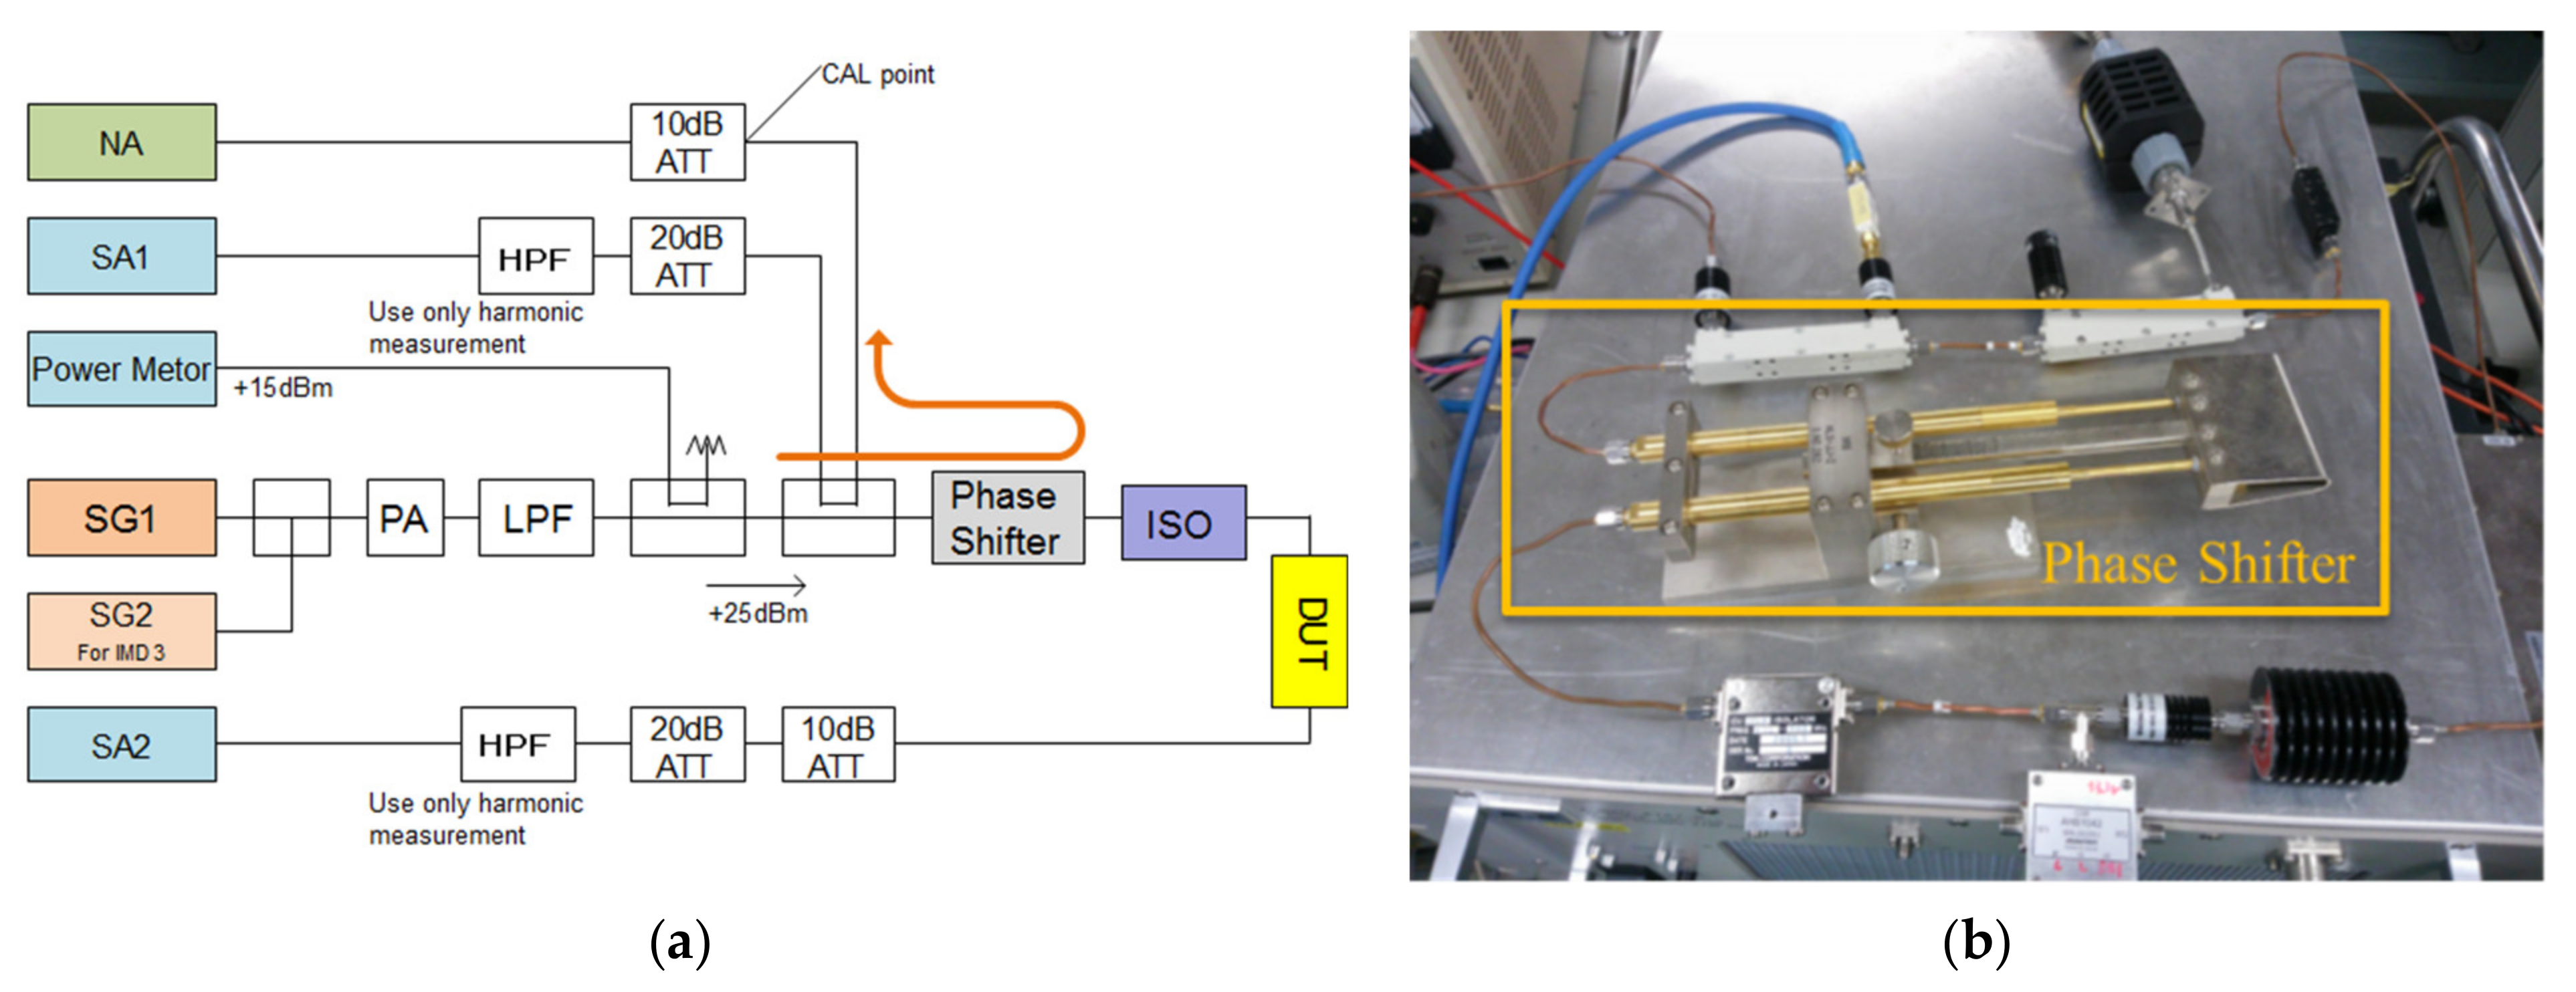
Figure 4 illustrates the verification bench system diagram. Both stimulus and measurement are executed by the V93K tester with a PSRF instrument card. Harmonic verification is carried out by front-end phase tuning in half period and isolation compensation. While variable components are connected to the verification port, the phase
is changed so that front superscripts
and
denote the initial and final settings, respectively;
may be similarly expressed [
22] as follows:
When both the front-end and the back-end load of DUT haven’t a reflection,
and
are defined as zero and
could be expressed as the above in the ideal condition. From the bench test results as
Table 1 shows, for achieving a better and more stable distortion effect, it is necessary to offer lower harmonic impedance at the high-power port. A good performance isolator at high power is indispensable as well or the harmonics will be widely distributed. The isolation compensation could improve the harmonics convergence from 13.7 dB to 2.1 dB, while input is 25 dBm.
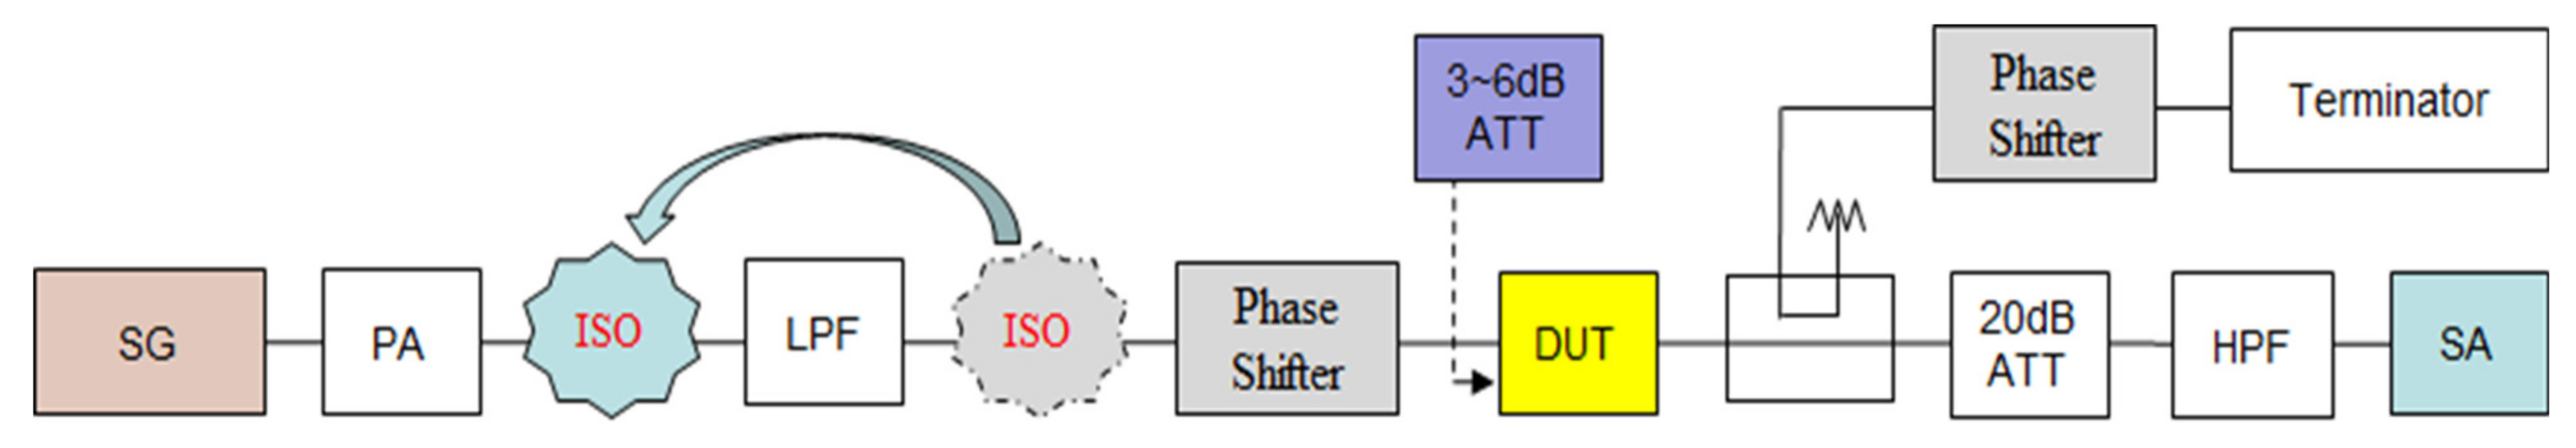
By the same token, dual trace phase tuning (DTPT) is proposed. Dual trace phase tuning sets out to track and tune the arbitrary phase at front-end and back-end ports.
Figure 5 shows the actual verification circuit with both isolation compensation and DTPT. To eliminate the possibility of the auxiliary loop’s measurement instability, the isolator is repositioned before LPF and a −3 dB attenuator is added to DUT’s interface. Both the second harmonic (H2) and third harmonic (H3) impedance will be more concentrated on the central location of the smith chart. The positive effect is caused to the weakening of the different components’ influences.
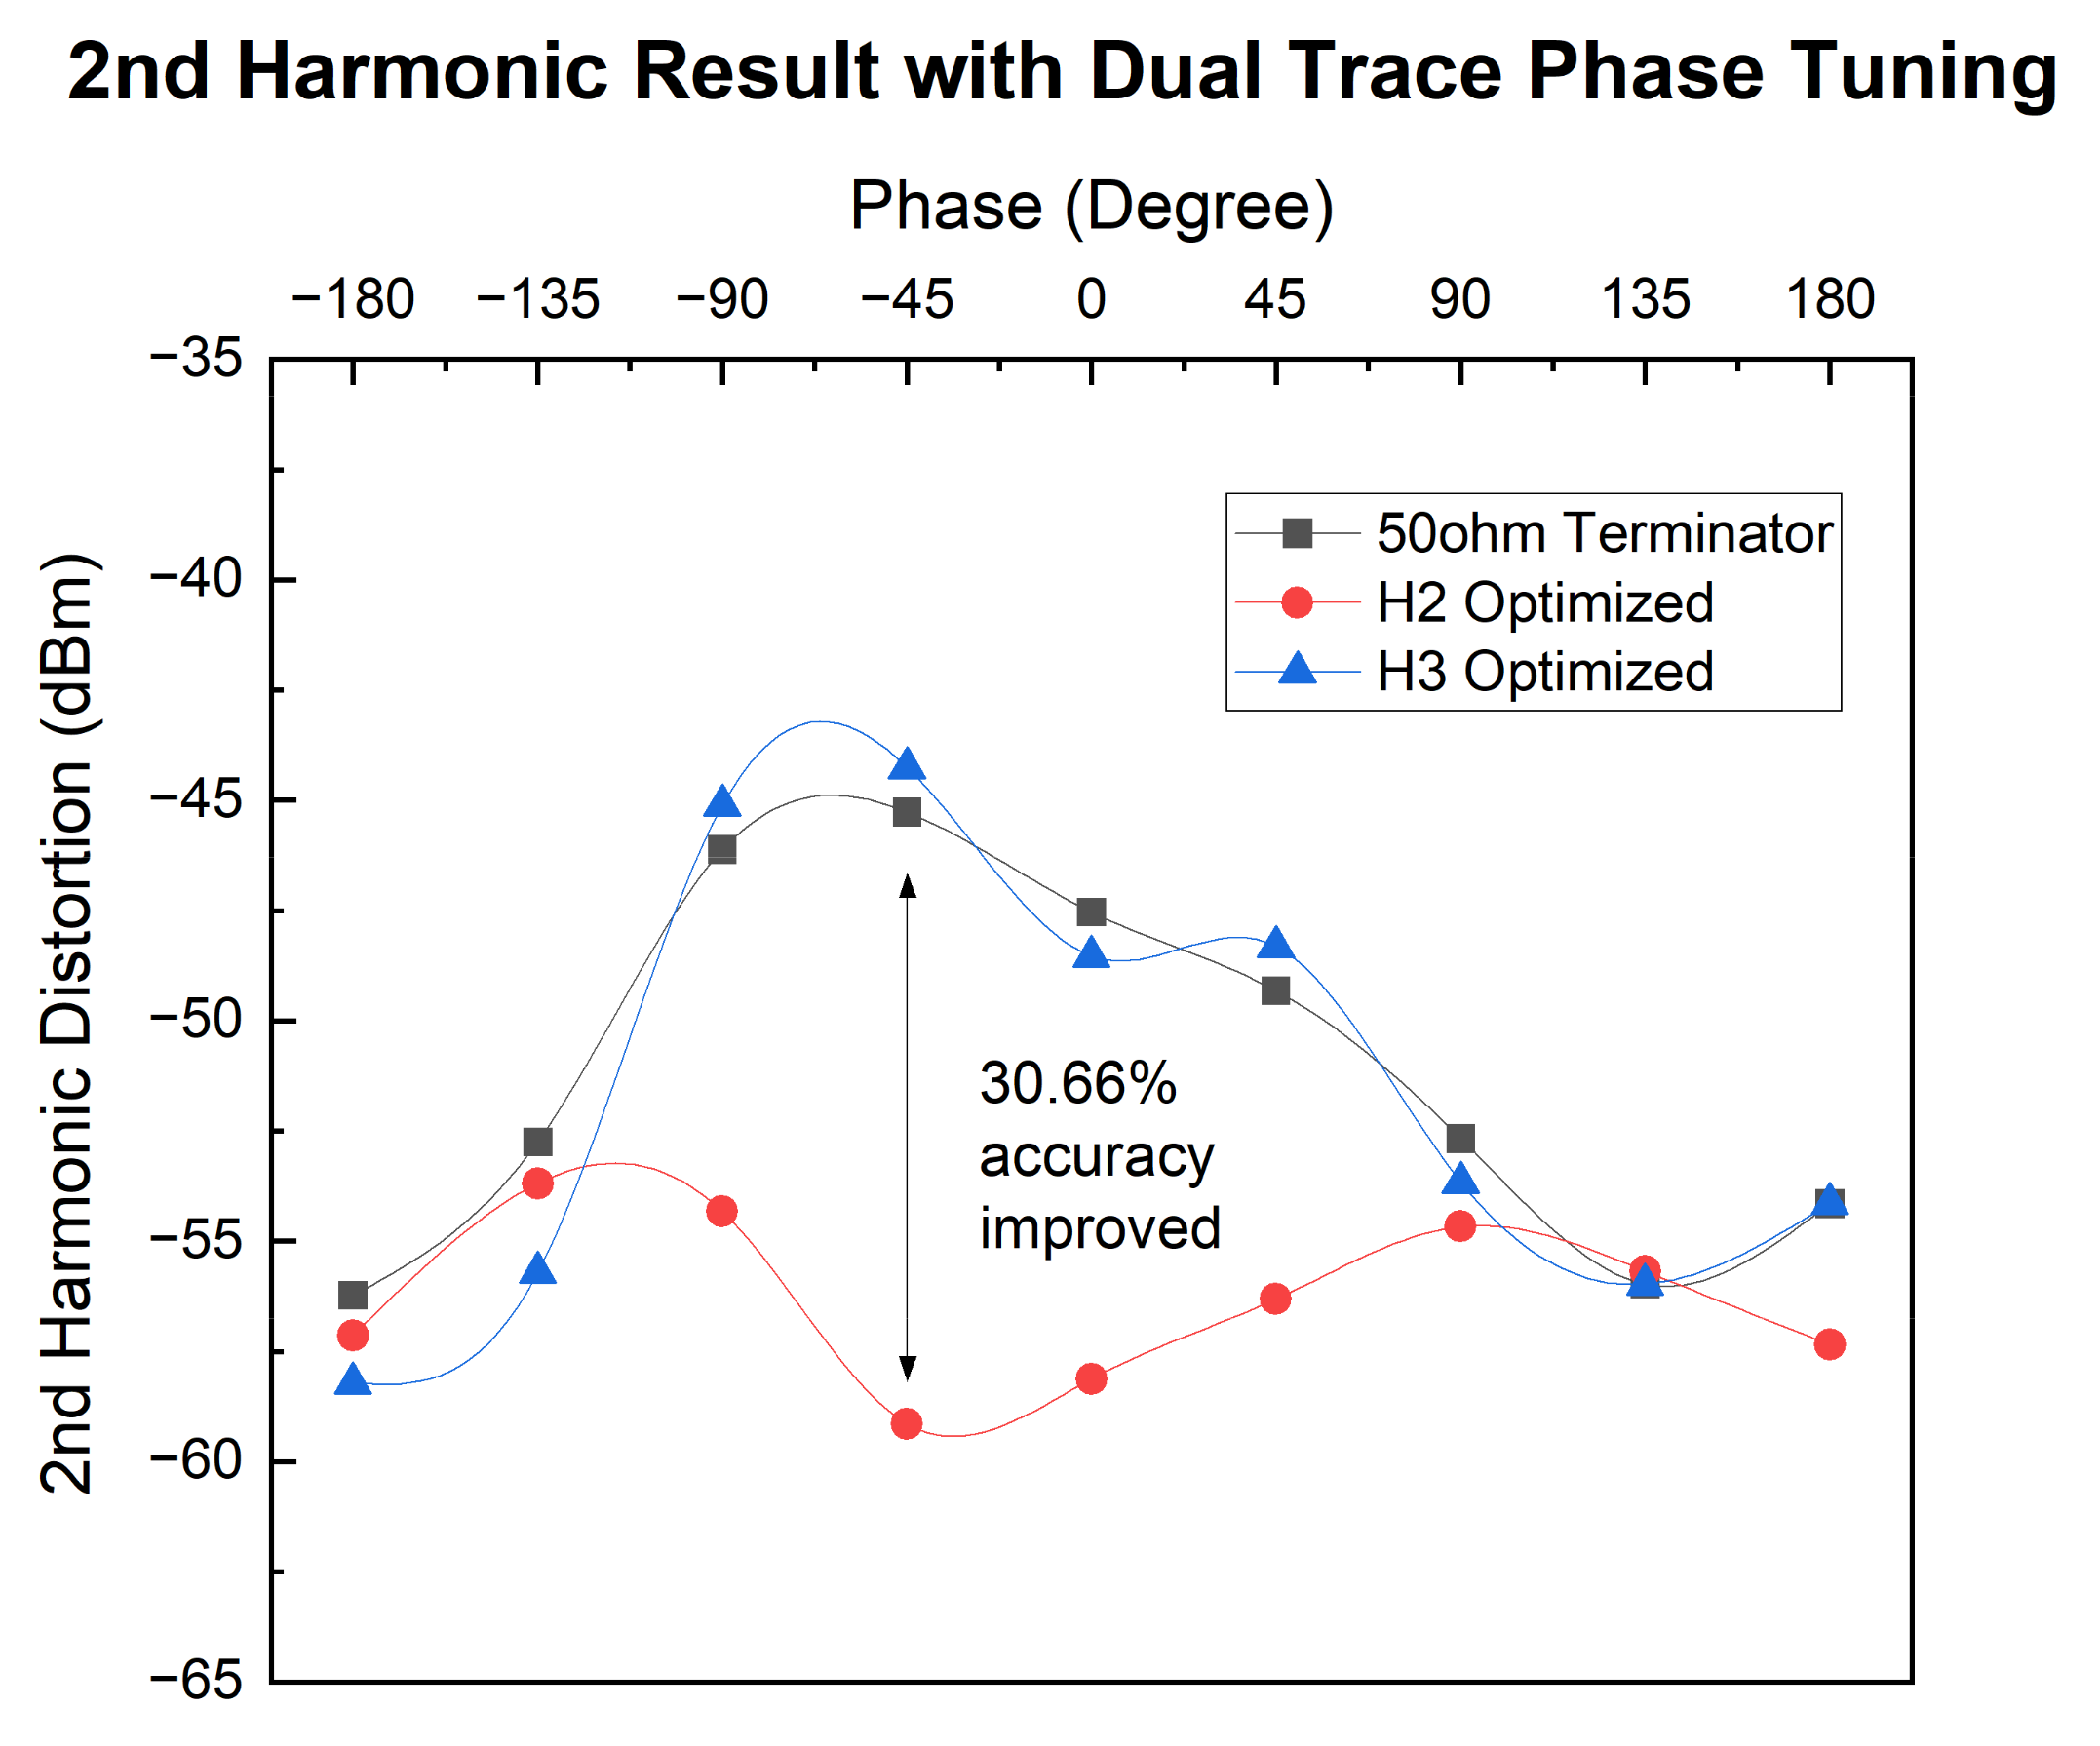
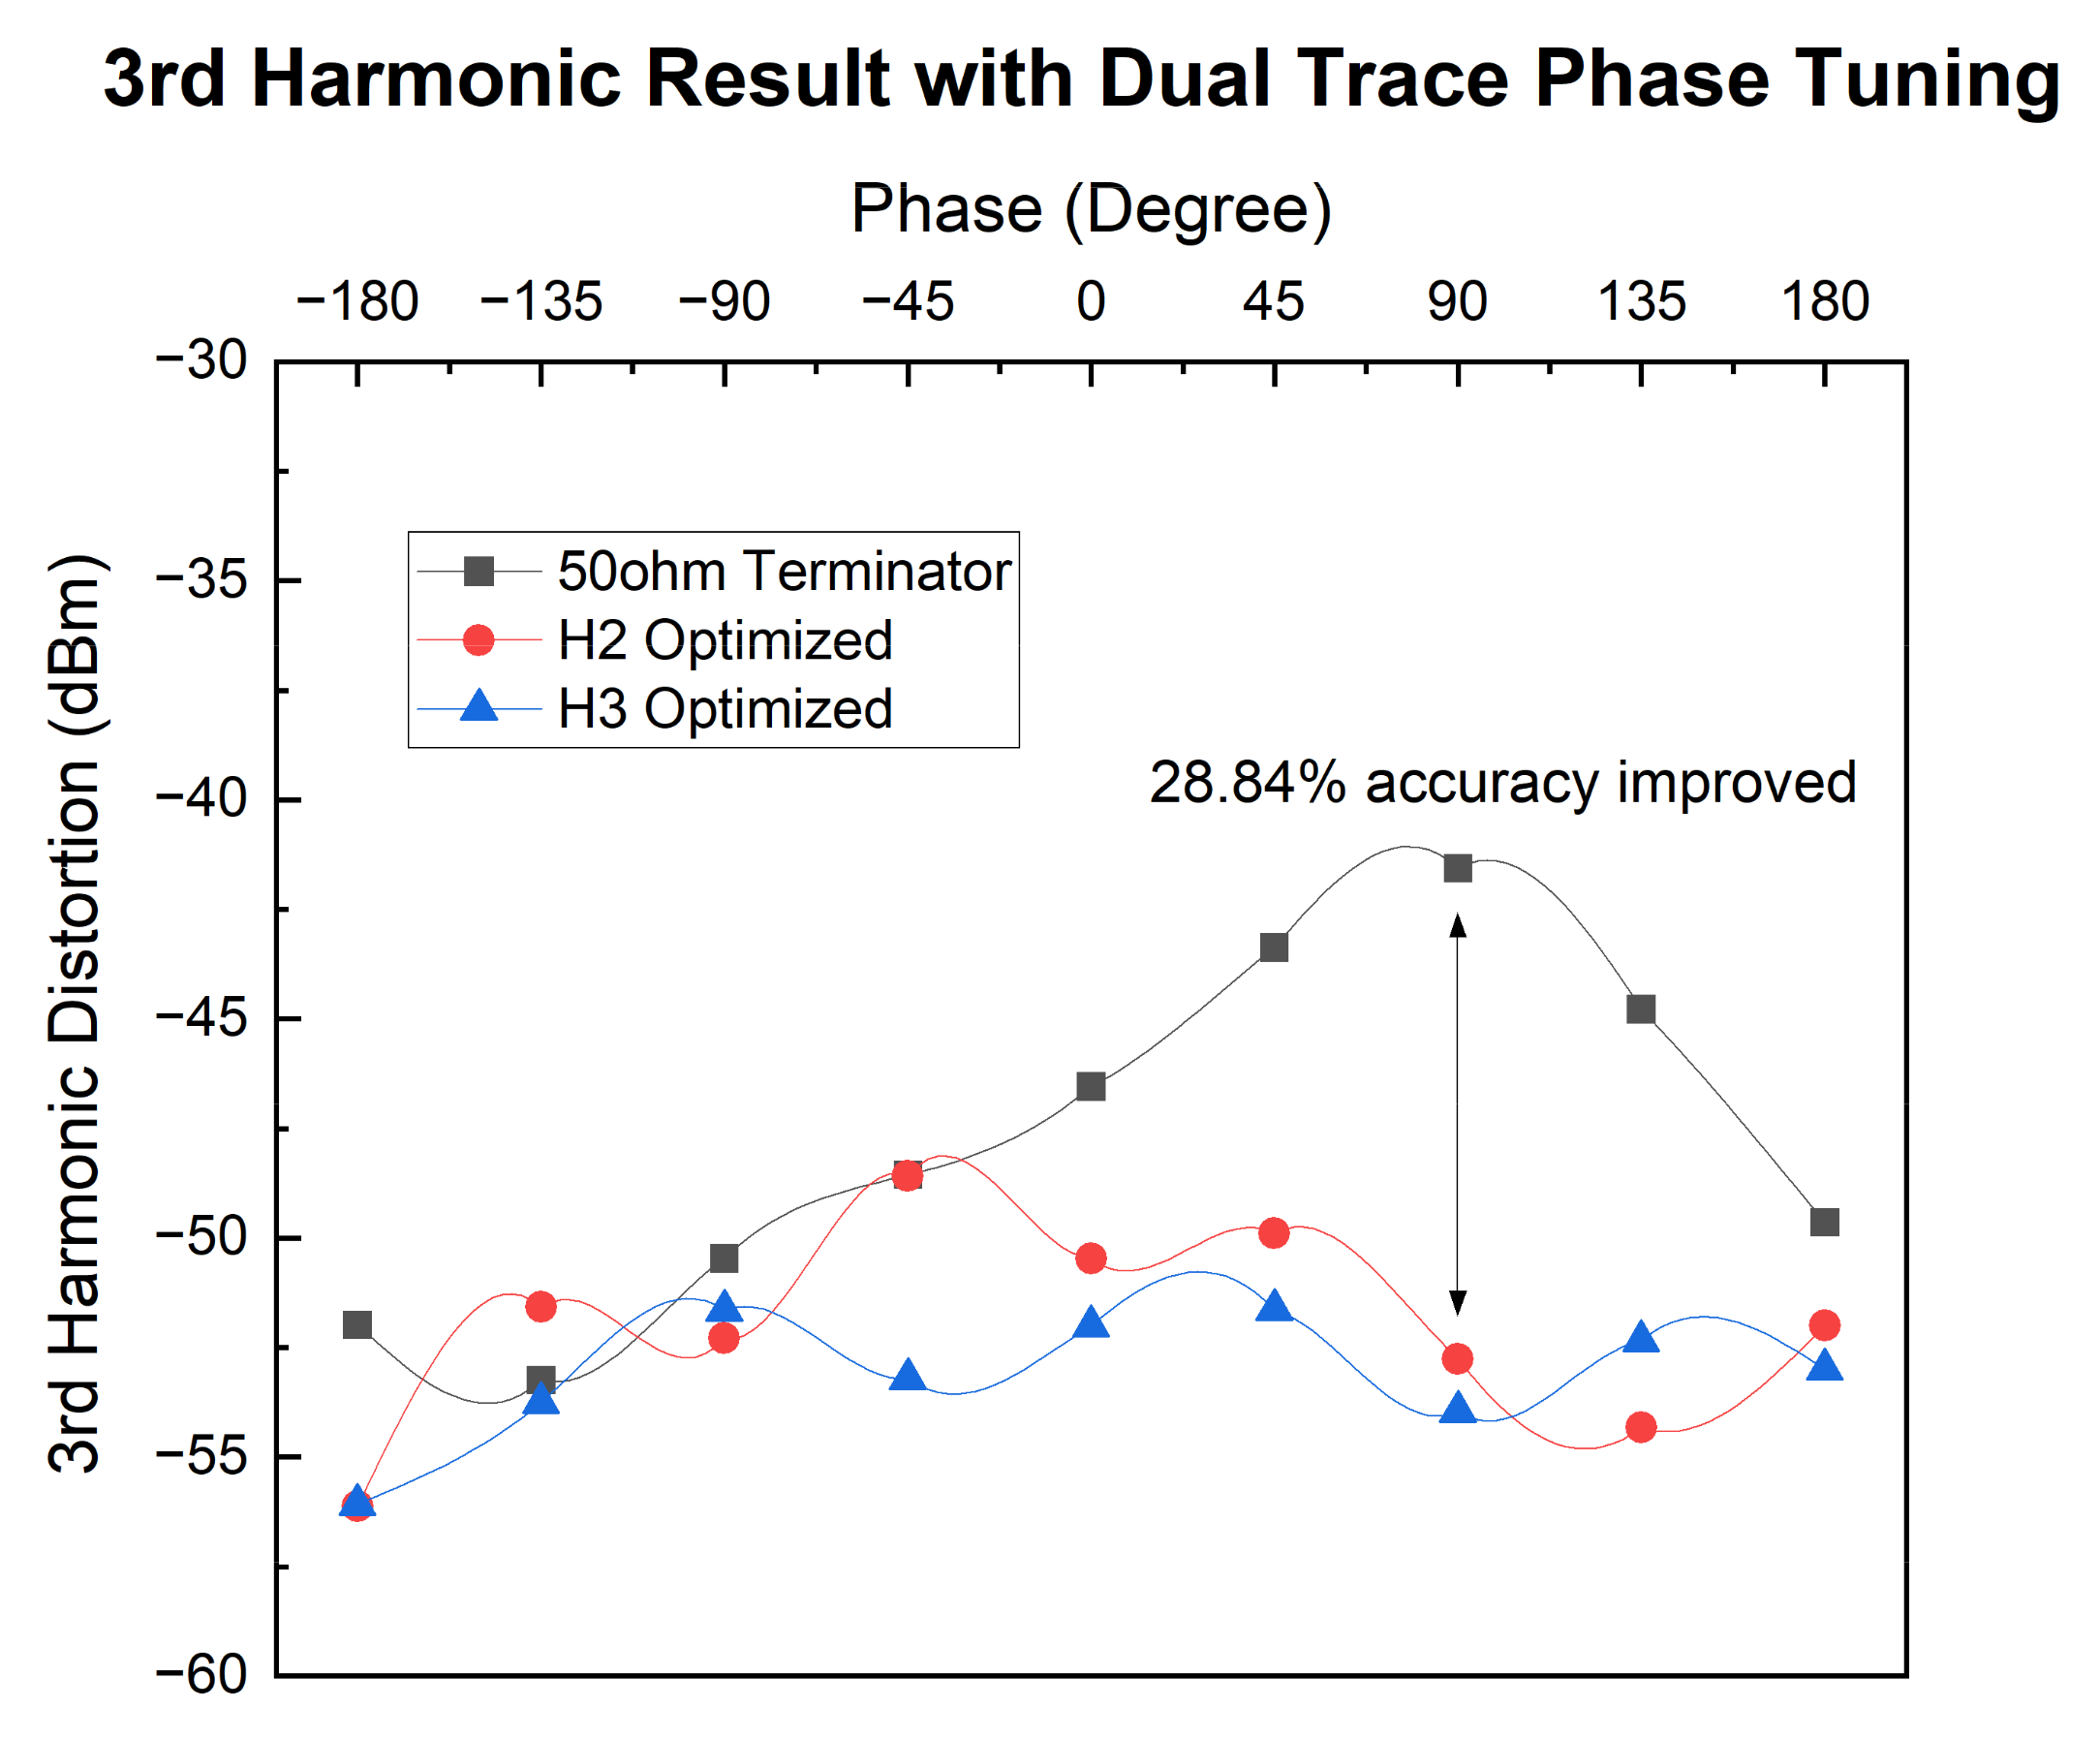
The 50-ohm terminator is conventionally based on the standard 50-ohm terminator without phase tunning. The H2-optimized and H3-optimized curves are pre-tuning the H2 and H3 harmonics impedance to optimize the optimal phase condition. From the results as
Table 2 shown, H2 and H3 distortion could be restrained in different phase conditions. After the front-end harmonic impendence optimization with the DTPT approach, the H2 and H3 accuracy improvements achieve almost 15 dB and 10 dB, respectively, as
Figure 6 and
Figure 7 shown. From the overall phases’ tuning, the second and third harmonic measurement accuracy is optimized to 30.66% and 28.84% efficiently. Assessment results prove that the proposed methodology can restrain the influence of measurement error and it improves the accuracy of harmonic contribution assessment. Therefore, the remaining action is to choose the tradeoff on both second and third harmonic performances for final design consideration.
4. DTPT on Measurement Stability Verification
Stability is the fundamental property to evaluate the DTPT tactic with isolation compensation, and GRR (Gauge Repeatability and Reproducibility) is involved in assessing the uncertainty and the stability verification. GRR is a particular technique in an industry that is utilized to determine the adequacy of a measurement system architecture [
23,
24]. Repeatability defines that variation in measurements obtained with the same instruments when used several times by an appraiser while measuring the identical characteristic on the same device. It’s short-term and within EV (Equipment Variation). It indicates the gauge or potential capability. Reproducibility defines the variation in the average of the measurements made by different appraisers using the same gauge when measuring the identical characteristic on the same device. The AV (Appraiser Variation) error may be the appraiser, environment, or method. The methodology requires adequate discrimination and sensitivity. Instrument discrimination should divide the tolerance into ten parts or more and it ought to be in statistical control. In the following formula, nr expresses trials multiplied by samples. Pp is a constant value of 1.67. TV represents total variation. PV stands for part-to-part variation. NDC means the number of distinct categories:
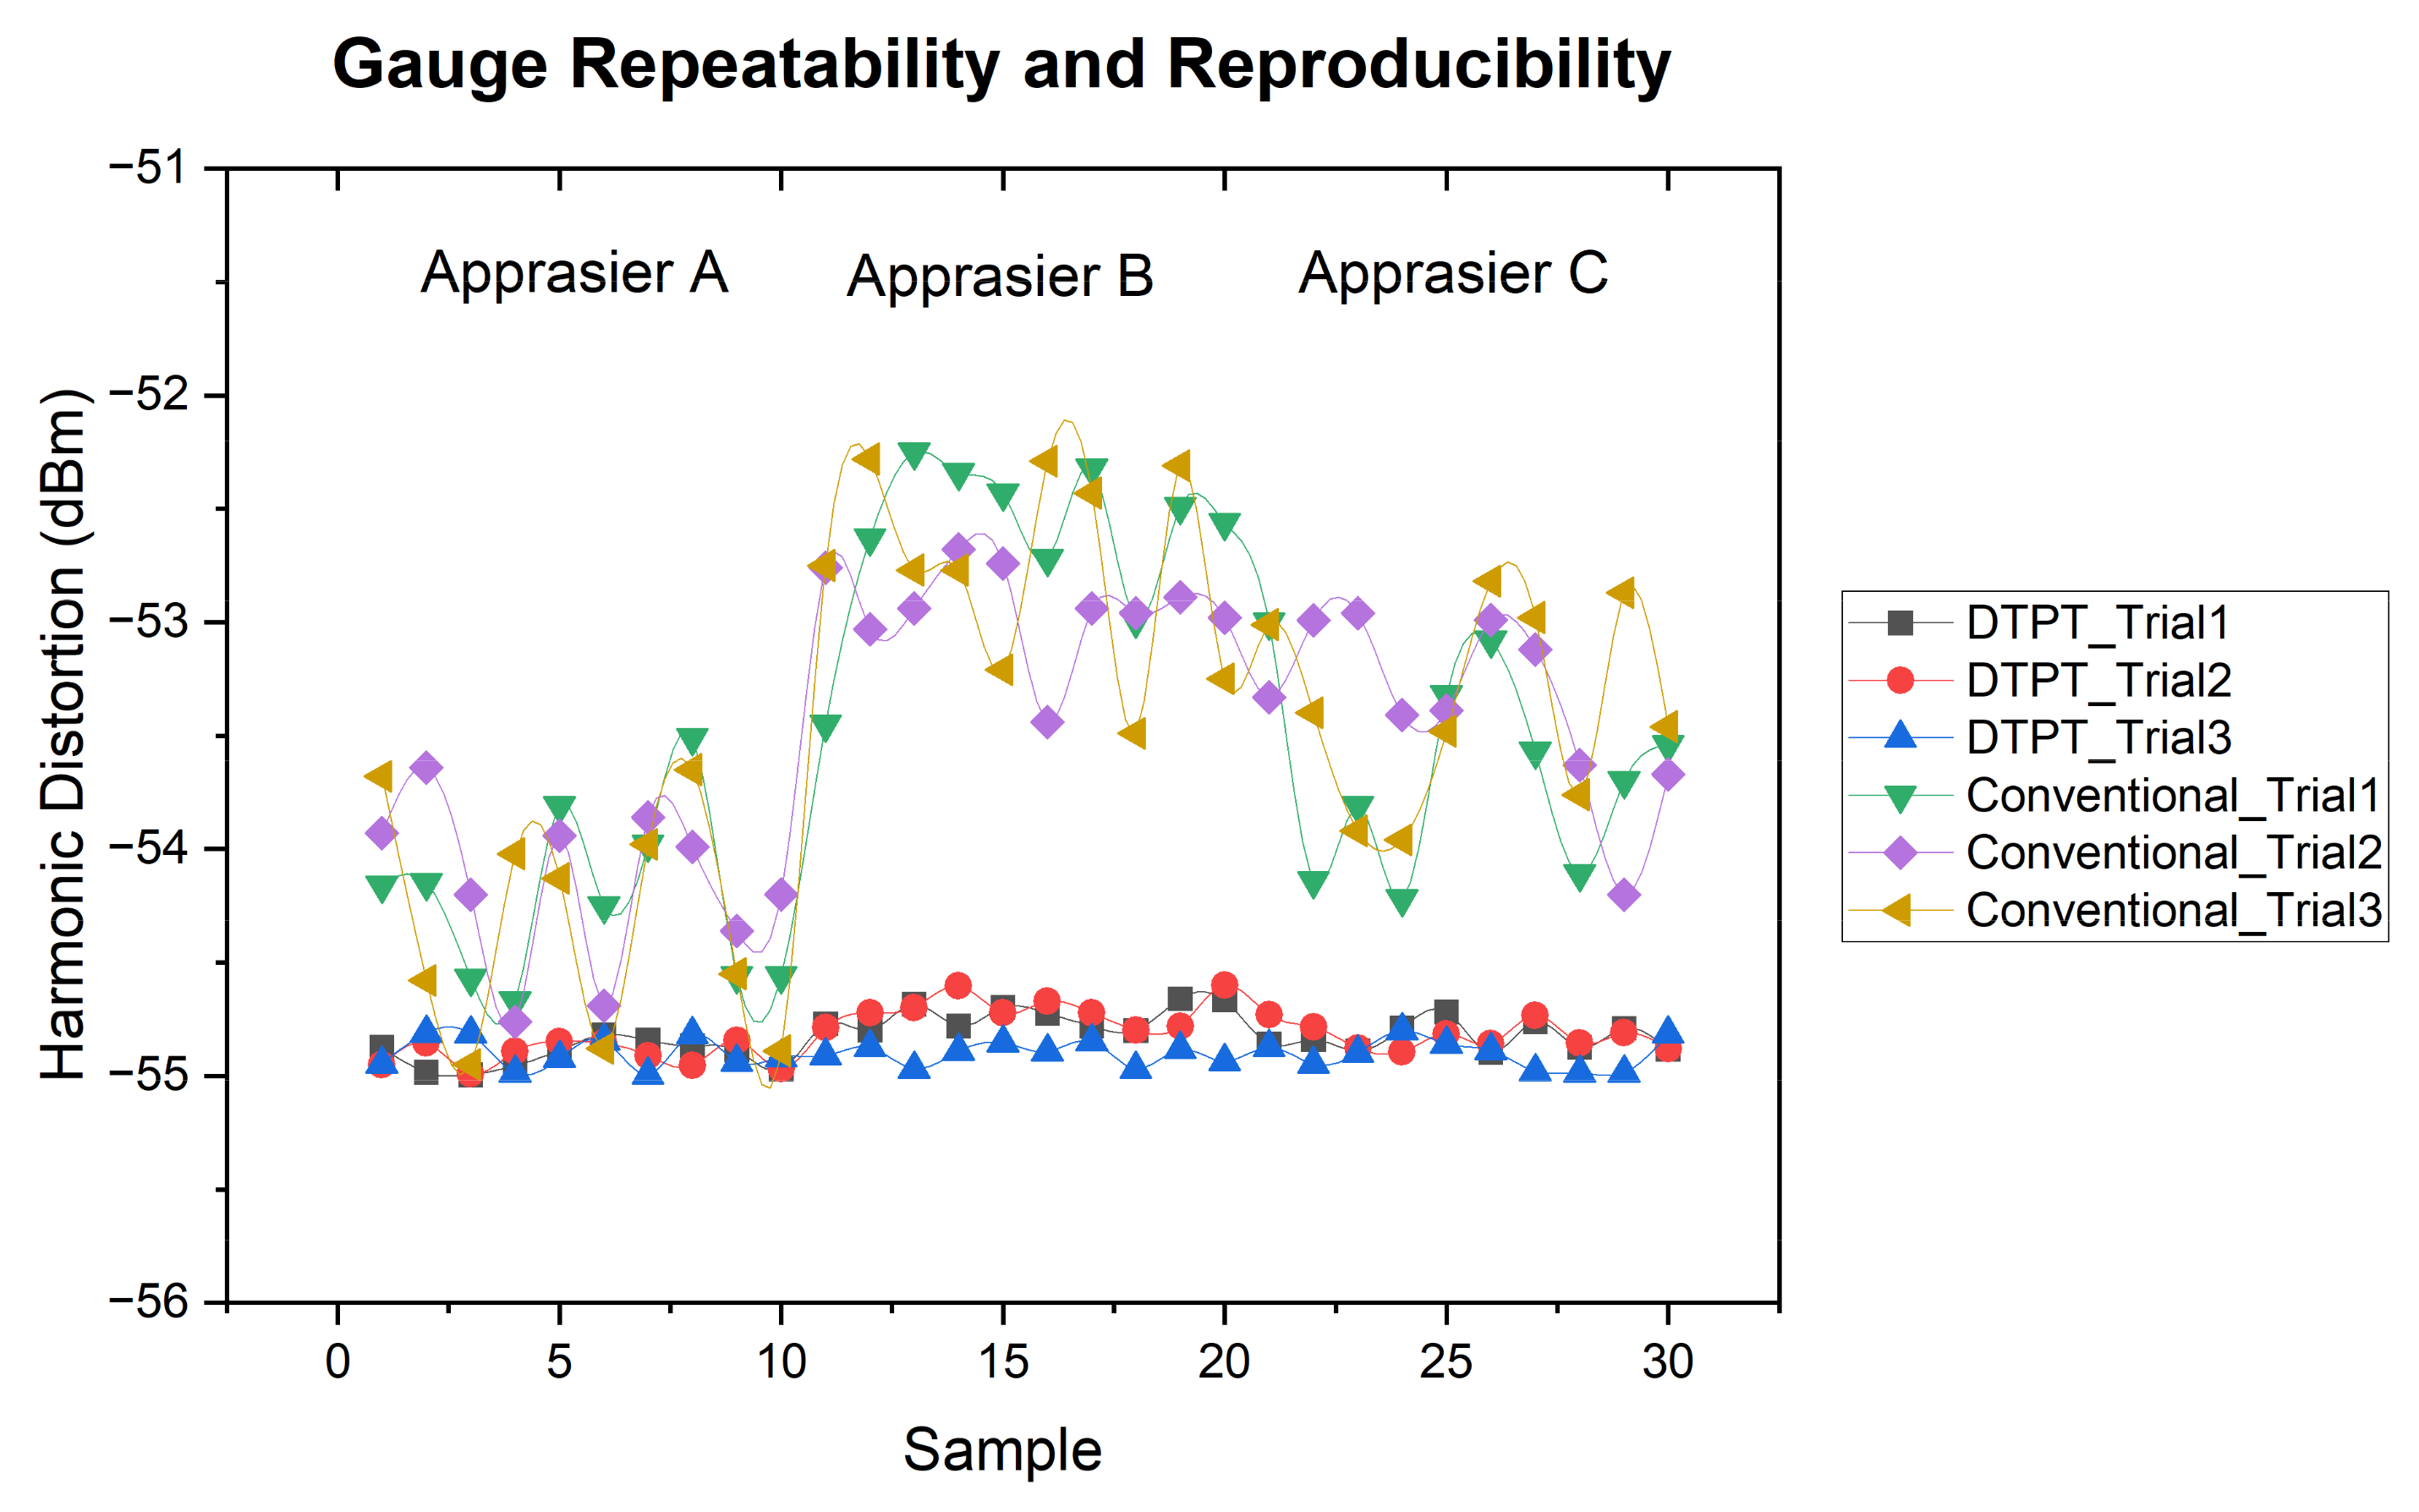
Figure 8 sketches the compared relationships between two measurement methodologies and the Gauge R&R results as
Table 3 shows, indicating that DTPT with isolation compensation achieves perfect repeatability and reproducibility versus conventional measurement architecture. The Gauge R&R of DTPT methodology could be kept around 7% and reach the acceptance criteria. Nevertheless, conventional architecture is seriously affected by device process variation, different setup environment, and measurement method.
5. Conclusions
Harmonic measurement is sensitive to both front-end and back-end impedance match and the harmonic impedances of the RF device also have great influences on the performance. Isolation compensation can provide good isolation at fundamental power, second harmonic, and third harmonic. To avoid the worst phase case at the switch’s antenna port, the properly chosen matching circuit is recommended. The overall harmonic performance could be improved by good selection of the critical phase angle. The precise and optimal harmonic distortion could be also measured through DTPT with an isolation compensation methodology implanted. Compared to conventional 50-ohm, terminator measurement architecture without phase tunning, the assessment results prove the proposed methodology could improve 30.66% and 28.84% measurement accuracy both on second and third harmonics and keep the gauge repeatability and reproducibility (GRR) reduced to around 7.13%.
Moreover, to achieve the best harmonic distortion performance, low impedance harmonic termination has to be determined at the high-power front-end port. The matching network can transform the VSWR circle to the perfect back-end port impedance condition to avoid the worst harmonic case performance phase by the DTPT approach. All in all, the isolation compensation and dual trace phase tuning are combined efficiently to seek out the optimal harmonic performance condition, especially at the back-end port’s VSWR mismatch. Last but not least, the core hybrid methodology on dual trace phase tuning with isolation compensation could be not only extended to ultra-low distortion FEM circuit design but also practical in application.
6. Patents
Chinese Patent License No: 201510560849.9.
Author Contributions
Conceptualization, methodology, L.W. and J.Z.; software, validation, investigation L.W.; data curation, writing—original draft preparation, L.W.; writing—review and editing, L.W. and J.Z.; visualization, L.W. and J.Z.; supervision, J.Z. All authors have read and agreed to the published version of the manuscript.
Funding
This research received no external funding.
Data Availability Statement
Not applicable.
Acknowledgments
The authors would also like to thank the Shanghai Huahong Grace Semiconductor Manufacturing Corporation for the chip fabrication and verification instrument support, and the Global Advantest Corporation for testing approaches to the study, and all team members for technical discussion during the theory and engineering analysis.
Conflicts of Interest
The authors declare no conflict of interest.
References
- Saggi, M.K.; Jain, S. A survey towards an integration of big data analytics to big insights for value-creation. Inf. Process. Manag. 2018, 54, 758–790. [Google Scholar] [CrossRef]
- Alzenad, M.; Shakir, M.Z.; Yanikomeroglu, H.; Alouini, M.S. FSO-Based Vertical Backhaul/Fronthaul Framework for 5G+ Wireless Networks. IEEE Commun. Mag. 2018, 56, 218–224. [Google Scholar] [CrossRef] [Green Version]
- Gohar, M.; Ahmed, S.H.; Khan, M.; Guizani, N.; Ahmed, A.; Rahman, A.U. A Big Data Analytics Architecture for the Internet of Small Things. IEEE Commun. Mag. 2018, 56, 128–133. [Google Scholar] [CrossRef]
- Babiceanu, R.F.; Seker, R. Manufacturing Operations, Internet of Things, and Big Data: Towards Predictive Manufacturing Systems. Stud. Comput. Intell. 2015, 594, 157–164. [Google Scholar]
- Zhang, C.M.; Lu, Y. Study on artificial intelligence: The state of the art and future prospects. J. Ind. Inf. Integr. 2021, 23, 100224. [Google Scholar] [CrossRef]
- Liu, Y.; Lu, L.; Li, G.Y.; Cui, Q.; Han, W. Joint User Association and Spectrum Allocation for Small Cell Networks With Wireless Backhauls. IEEE Wirel. Commun. Lett. 2017, 5, 496–499. [Google Scholar] [CrossRef]
- Khan, I.; Singh, D. Efficient Compressive Sensing Based Sparse Channel Estimation for 5G Massive MIMO Systems. AEU–Int. J. Electron. Commun. 2018, 89, 181–190. [Google Scholar] [CrossRef]
- Esfeh, B.K.; Kilchytska, V.; Flandre, D.; Raskin, J.P. RF SOI CMOS technology on 1st and 2nd generation trap-rich high resistivity SOI wafers. In Proceedings of the IEEE 2016 Joint International EUROSOI Workshop and International Conference on Ultimate Integration on Silicon (EUROSOI-ULIS), Vienna, Austria, 25–27 January 2016; pp. 159–161. [Google Scholar]
- Neve, C.R.; Raskin, J.P. RF Harmonic Distortion of CPW Lines on HR-Si and Trap-Rich HR-Si Substrates. IEEE Trans. Electron Devices 2012, 59, 924–932. [Google Scholar] [CrossRef]
- Yu, B.; Ma, K.X.; Meng, F.Y.; Yeo, K.S.; Shyam, P. Ultra-Wideband Low-Loss Switch Design in High-Resistivity Trap-Rich SOI With Enhanced Channel Mobility. IEEE Trans. Microw. Theory Tech. 2017, 65, 3947–3949. [Google Scholar] [CrossRef]
- Yu, B.; Ma, K.; Meng, F.; Yeo, K.S.; Shyam, P.; Zhang, S.; Verma, P.R. DC-30 GHz DPDT Switch Matrix Design in High Resistivity Trap-Rich SOI. IEEE Trans. Electron Devices 2017, 64, 3548–3554. [Google Scholar] [CrossRef]
- Zhu, H.; Li, Q.; Sun, H.; Wang, Z.; Liu, R.; Liu, Y. Ultra low loss and high linearity RF switch using 130 nm SOI CMOS process. In Proceedings of the IEEE 12th International Conference on ASIC (ASICON), Guiyang, China, 25–28 October 2017. [Google Scholar]
- Zhang, D.P.; Dai, Q.Y. The design of a high linearity performance T/R Switch. Sci. Technol. Eng. 2011, 11, 7801–7803. [Google Scholar]
- Mao, C.X.; Gao, S.; Wang, Y.; Sanz-Izquierdo, B.; Wang, Z.; Qin, F.; Chu, Q.X.; Li, J.; Wei, G.; Xu, J. Dual-Band Patch Antenna with Filtering Performance and Harmonic Suppression. IEEE Trans. Antennas Propag. 2016, 64, 4074–4077. [Google Scholar] [CrossRef]
- Zheng, S.Y.; Liu, Z.W.; Pan, Y.M.; Wu, Y.; Chan, W.S.; Liu, Y. Bandpass Filtering Doherty Power Amplifier with Enhanced Efficiency and Wideband Harmonic Suppression. IEEE Trans. Circuits Syst. I Regul. Pap. 2016, 63, 337–346. [Google Scholar] [CrossRef]
- Wu, Y.L.; Zhuang, Z.; Liu, Y.N.; Deng, L.; Ghassemlooy, Z. Wideband Filtering Power Divider with Ultra-Wideband Harmonic Suppression and Isolation. IEEE Access 2017, 4, 6876–6882. [Google Scholar] [CrossRef]
- Zhong, R.; Guo, X.Q.; Zhang, M.S.; Ding, D.; Sun, W. Influence of switch angles on second-order current harmonic and resonance in switched reluctance motors. IET Electr. Power Appl. 2018, 12, 1247–1255. [Google Scholar] [CrossRef]
- Xavier, G.L.; Macedo, J.R. Assessment on the Behavior of Harmonic Phase Angles. IEEE Lat. Am. Trans. 2021, 19, 404–412. [Google Scholar] [CrossRef]
- Guo, M. Discussion on A Reasonable Measurement Method of Harmonic Energy Allocation based on the Adaptive Impedance. In Proceedings of the 13th IEEE Conference on Industrial Electronics and Applications (ICIEA), Wuhan, China, 31 May–2 June 2018; pp. 874–880. [Google Scholar]
- Wang, L.H.; Xiao, X.Y.; Zhang, Y.; Huang, Y.; Liu, Y.M. Harmonic Contribution Assessment Considering Measurement Error. Power Syst. Technol. 2017, 40, 3865–3870. [Google Scholar]
- Widarta, A. Null Technique for Precision RF Phase Shift Measurements. Eng. Electr. Electron. 2019, 68, 1840–1843. [Google Scholar] [CrossRef]
- Widarta, A. Precision Phase Shift Measurement System in the Frequency Range of 1–18 GHz. In Proceedings of the 50th European Microwave Conference, Utrecht, The Netherlands, 12 January 2021; pp. 631–633. [Google Scholar]
- Shirodkar, A.; Rane, S. Evaluation of Coordinate measuring machine using Gage Repeatability & Reproducibility. Int. J. Syst. Assur. Eng. Manag. 2021, 12, 84–90. [Google Scholar]
- Hernandez, O.C.; Rodriguez, I.C.; Bernad, M.J.B.; Contreras, L.M.M. Design of crossed and nested Gauge R&R studies for the validation of the Heckel and Ryshkewitch-Duckworth mathematical models. ARS Pharm. 2021, 62, 190–202. [Google Scholar]
| Publisher’s Note: MDPI stays neutral with regard to jurisdictional claims in published maps and institutional affiliations. |
© 2022 by the authors. Licensee MDPI, Basel, Switzerland. This article is an open access article distributed under the terms and conditions of the Creative Commons Attribution (CC BY) license (https://creativecommons.org/licenses/by/4.0/).


