1. Introduction
Single-image super-resolution (SISR) is an important research topic in computer vision. It aims to reconstruct high-resolution (HR) images from low-resolution (LR) images. SISR has been extensively used in many fields, including information security, monitoring, medical imaging, and satellite images. However, SISR is an ill-posed problem, since multiple HR images may degenerate into one specific LR image. Numerous deep-learning SR methods have been widely developed over the last few years to establish mappings between LR and HR images. They are mainly PSNR-oriented and GAN-driven methods. PSNR-oriented methods [
1,
2,
3,
4,
5,
6] are trained with the MSE or L1 as loss functions and achieve excellent PSNR. Nevertheless, these losses tend to drive the super-resolution (SR) result to an average or a median of several possible SR predictions [
7], causing excessive smoothing of the images. Hence, GAN-driven methods [
8,
9,
10,
11,
12,
13] have been proposed to address the issue of missing details. However, GAN-driven methods tend to generate pseudo-textures in the reconstructed HR image. Furthermore, by maintaining constant mapping complexity, both PSNR-oriented and GAN-driven methods fail to infer realistic details of complex structures and natural textures, ignoring the contradiction between the indiscriminate processing and the disparate difficulties in processing regions [
13]. To divide and conquer the images, Wei et al. [
13] proposed a network with different processing capabilities for the various components of a degraded image. Next, they divided and conquered the degraded images according to their opinions. Moreover, Wang et al. [
9] proposed SFTGAN, which distinguished the processing difficulty by using HR images’ category information. These division methods mentioned above are all entirely based on image information.
However, the processing difficulty is not a property of an image, but the quantification of the network processing power for different areas of images. Taking image restoration as an example, when an input image seriously degenerates, it may become challenging or impossible to deal with its restoration [
14]. Further, the processing power of a model and its adaptability for coping with specific issues are critical as well [
15]. Overall, quantizing the processing difficulty must encompass not only the image information, but also the model properties. Therefore, it is urgent to propose a divide-and-conquer network that follows the substance of the network processing difficulty.
Lately, the successful adoptions of Bayesian uncertainty in classification [
16], segmentation [
17], and camera re-localization problems [
18] have shown the power of uncertainty in vision tasks. Recent progress was made by obtaining Bayesian uncertainty through dropout [
16] or batch normalization [
19]. The main types of uncertainty are epistemic uncertainty and aleatoric uncertainty. Epistemic uncertainty measures the output confidence of a model in processing input images. On the one hand, image information and network properties are key factors affecting output confidence. On the other hand, the lower the confidence level, the harder it is to process. Consequently, epistemic uncertainty is an appropriate measurement of the processing difficulty, as it describes how much a model is uncertain about its predictions related to the model and data. In this way, divide-and-conquer networks can localize difficult and easy processing regions more precisely by quantizing the epistemic uncertainty.
In this paper, we propose an epistemic-uncertainty-based divide-and-conquer network (EU-DC). Firstly, an image-gradient-based divide-and-conquer network (IG-DC) is built, which utilizes gradient-based division to divide. Specifically, the gradient-based division employs to separate images into easy and hard processing areas. Secondly, we measure the output confidence of the IG-DC by applying Monte Carlo dropout in order to model the IG-DC’s epistemic uncertainty map (EUM). The EUM-based division is proposed by quantizing the EUM into easy and hard processing regions. Finally, the IG-DC is transformed into an EU-DC by replacing the gradient-based division with EUM-based division.
In sum, the innovation of this paper is the proposal of a novel method for the division of processing difficulty by quantizing the epistemic uncertainty. Based on our novel division method, we further propose a divide-and-conquer SR method, which is an effective solution to the practical problem of discriminating among the difficulties in processing distinct regions. Most previous SR works ignored this problem and processed input images indiscriminately. Furthermore, some researchers only used image information (categories or gradients) to quantify the processing difficulty, but these division methods do not meet the definition of network processing difficulty. Our division considers the properties of the input image and the network’s processing power for different regions of the input image. Our comprehensive experiments prove that epistemic-uncertainty-based division is reasonable and effective in quantizing the processing difficulty. Moreover, our EU-DC method is superior to the advanced SR approaches mentioned above when considering a combination of quantitative analysis and visual quality.
Our contributions can be summarized as follows:
We introduce epistemic uncertainty in order to quantify the output confidence of the network. By utilizing the output confidence, we can clearly understand the distribution of the network’s processing capabilities on the input images.
We propose a novel division based on epistemic uncertainty, which is consistent with the substance of the processing difficulty. This division based on epistemic uncertainty accurately and reasonably distinguishes areas with different processing difficulties.
We construct an EU-DC that divides LR images through EUM-based division and can infer clear structures and realistic textures. Extensive simulation results demonstrate that our proposed method is superior to multiple comparable state-of-the-art methods.
3. Method
3.1. Outline
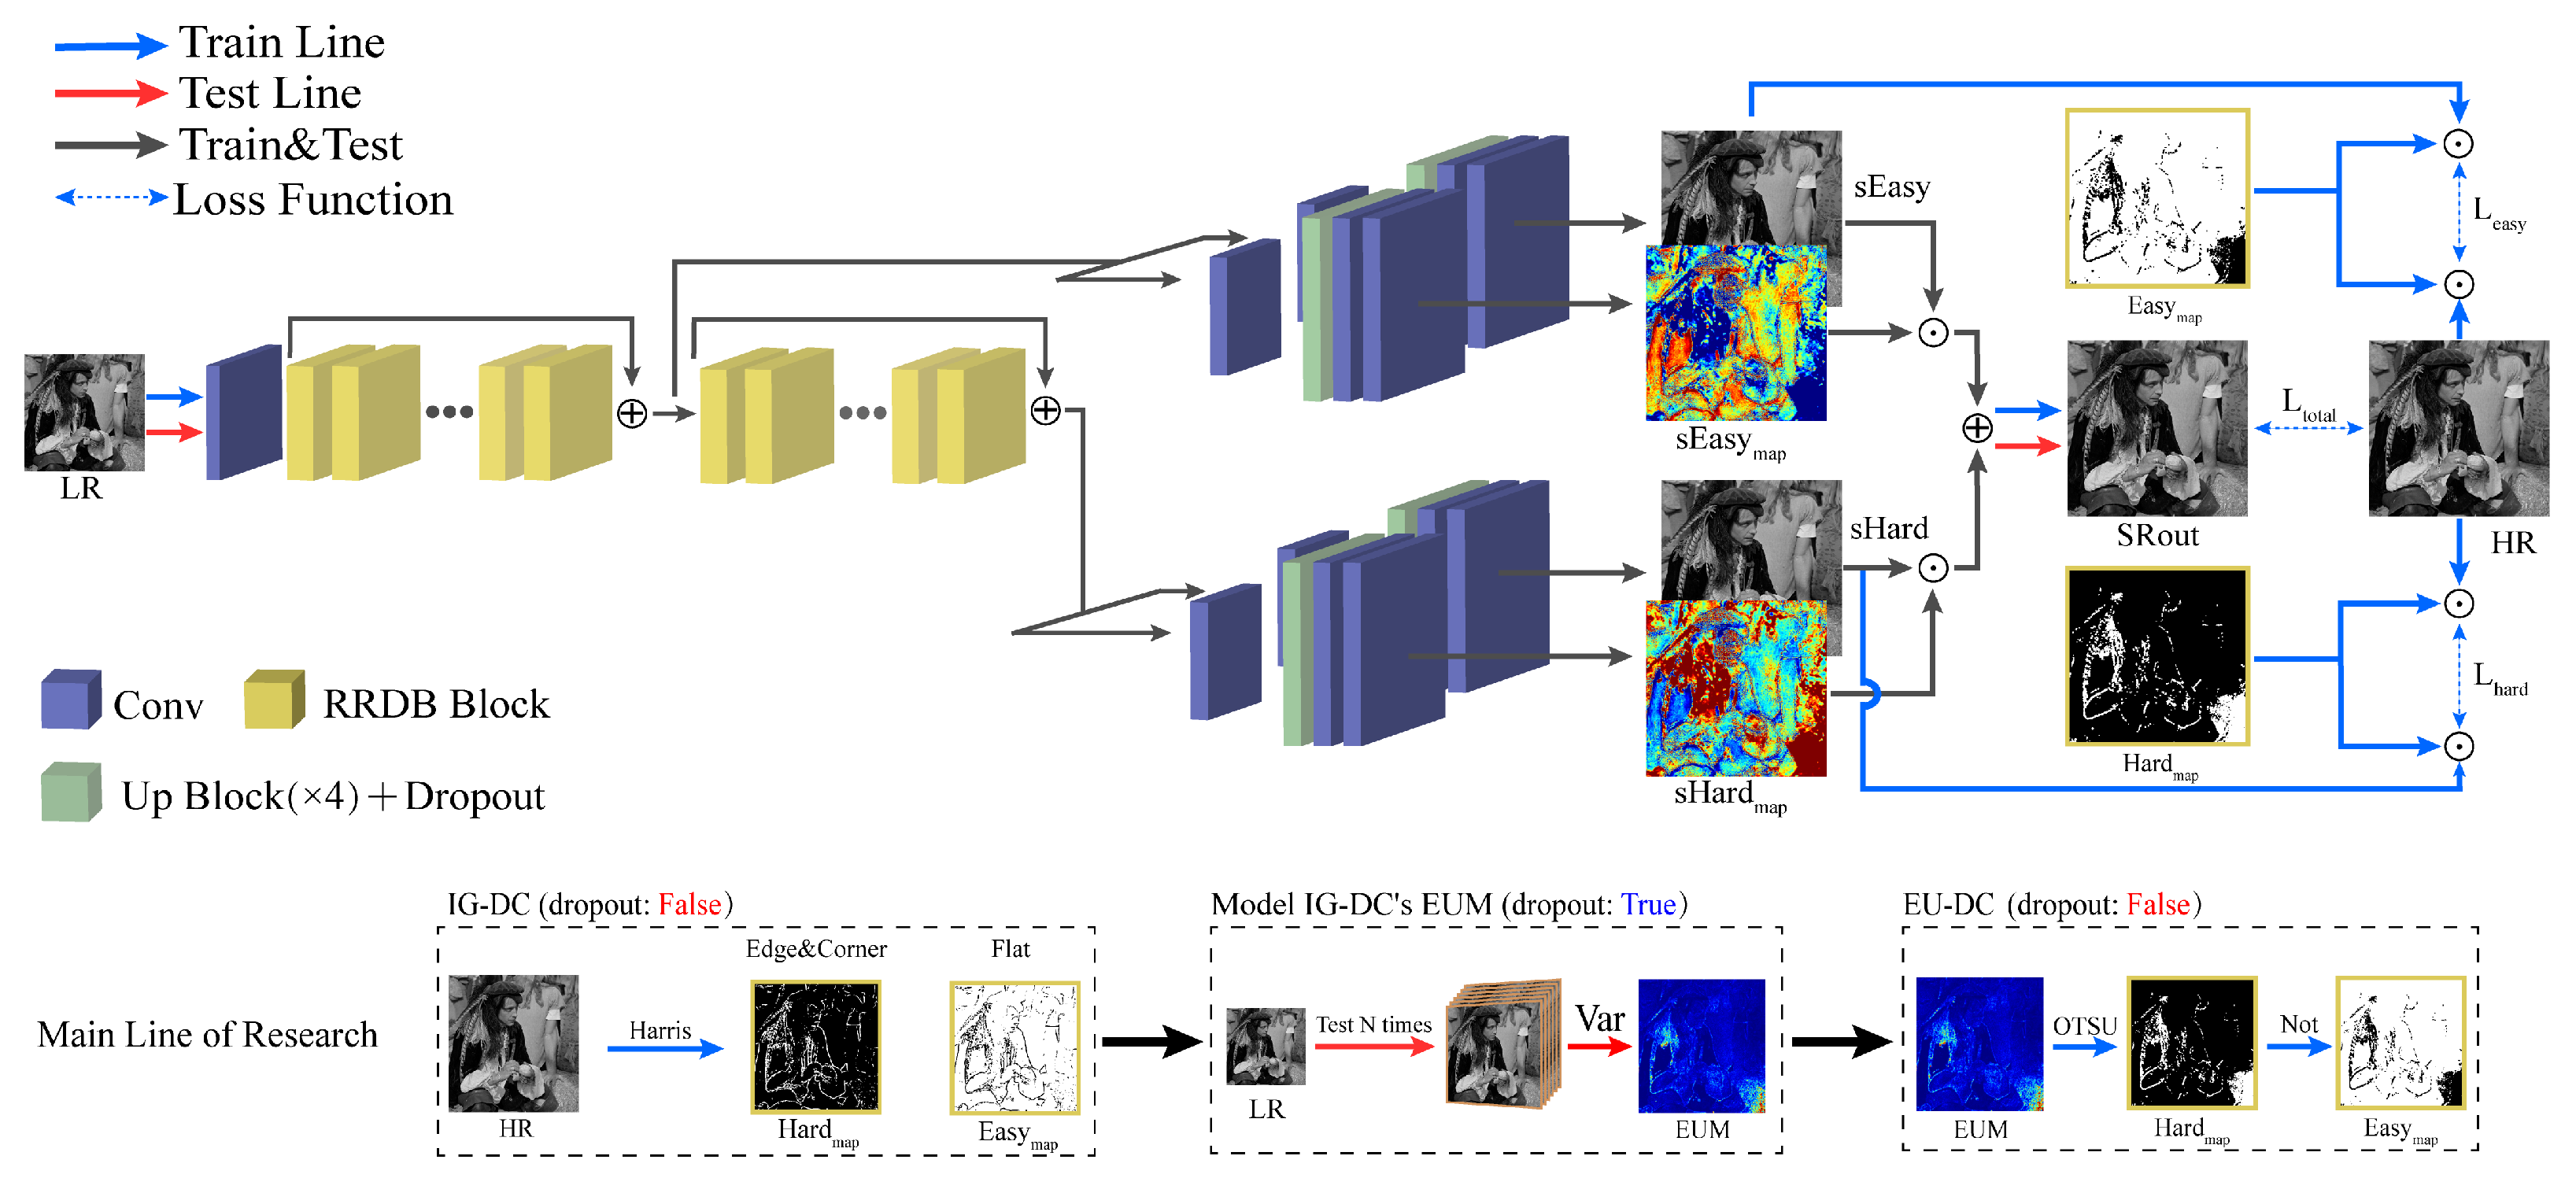
As shown in
Figure 1, the main line of the proposed method involves three steps. In the first step, inspired by [
13], we construct a divide-and-conquer network structure based on image gradient division. The IG-DC divides an image into hard regions
and easy regions
by using
(a method that detects the gradient changes in an image). Multi-path supervision and reasonable allocation of computational overhead strategies are employed to optimize the IG-DC. In the second step, Monte Carlo dropout is introduced in order to model the IG-DC’s EUM by measuring the output confidence of the IG-DC. The lower the output confidence, the more difficult the IG-DC is to process. Further, we present a division method based on epistemic uncertainty by quantizing the EUM. The division based on epistemic uncertainty is consistent with the substance of the processing difficulty because of it considers not only degraded images’ features, but also the properties of the network. In the third step, we set the IG-DC as the base model. We propose the EU-DC by substituting for image-gradient-based division with EUM-based division. It is worth noting that the different steps of the main line employ the same network structure and training strategy.
3.2. IG-DC
Given the differences in the difficulties of reconstructing different areas, we use a divide-and-conquer network structure to build the IG-DC. Motivated by [
13], the IG-DC measures the processing difficulty by using
to detect gradient changes in images. Specifically, as shown in
Figure 1, an HR image is divided into three components by
. The edge and corner components are identified as the hard regions. Meanwhile, the flat component is defined as a simple region. Moreover, we adopt multi-path supervision and strategies for reasonable allocation of computational overhead to optimize the IG-DC.
3.2.1. Multi-Path Supervision
To facilitate the feature learning in the IG-DC from easy to hard, the IG-DC built easy and hard branches to overcome regions with various processing difficulties. We define the results of the easy routing as
and
. Meanwhile,
and
are the outputs of the hard branch. The overall result
is obtained by using weighted fusion of the results of the two routings:
Different loss functions are employed to supervise the multi-path SR results.
is supervised by utilizing a combination loss
comprising the pixel loss
, perceptual loss
[
20], and GAN loss
. The definitions of
,
, and
are:
where
denotes the
-layer output of the VGG [
24] model.
Thus, the combination loss
is shown below:
where
,
, and
denote the trade-off hyperparameters of different losses. The loss for the easy branch is formulated as:
Finally, the loss function for the IG-DC’s generator is expressed as:
where
,
, and
denote the trade-off hyperparameters of different branches.
The IG-DC’s discriminator network is a VGG128 model [
24], and the discriminator loss is formulated as:
The IG-DC’s discriminator and generator are optimized through adversarial learning. Through multi-path supervision, we guide the network in emphatically learning processing-difficulty-attentive masks, with
and
providing guidance from the gradient information in the HR images. In other words,
focuses more on the generation of simple regions because of the supervision from Equation (
6), which is similar to that of
. Furthermore, to produce
with a higher quality, it is proper for the direction of optimization for
and
to be regional distributions of
and
, respectively. The IG-DC’s generator produces processing-difficulty-attentive masks and intermediate SR predictions. Therefore, relatively independent branches supervise the various regions, making it possible to perform differential processing.
3.2.2. Reasonable Allocation of Computational Overhead
To reasonably allocate the computational overhead of the network, we build the generator of the IG-DC with a stacked architecture comprising 20 RRDBs, making it beneficial for adjusting our emphases on different regions. The main factors limiting the overall quality of reconstruction are the areas that are challenging to reconstruct. Therefore, putting more attention into extracting features in problematic areas is, theoretically, a more reasonable option. We exploit the first part of the stacked architecture to reconstruct accessible areas and the rest to inherit the first part’s output for restoring complex areas. At this point, we carry out the reasonable allocation of computational overhead in the feature extraction stage. We utilize the feature extraction stage and the backpropagation phase to achieve discriminate processing. Distinct values are configured for
and
in Equation (
8) to modify the proportions of the original gradients of the different branches, which is a method for implicitly adjusting the allocation of computational overhead.
3.3. Modeling the IG-DC’s EUM
The processing difficulty distribution map of the IG-DC is based on gradient changes in HR images, which is not consistent with the substance of network processing difficulty.
A reasonable processing difficulty division method should have two characteristics. On the one hand, the input image information and model properties play a decisive role. On the other hand, it should have a stable relationship of transformation with the processing difficulty. The model’s output confidence is a good choice because it falls perfectly in line with these two characteristics. To measure the model’s output confidence, we introduce epistemic uncertainty into SISR. Compared to modeling the EUM by using batch normalization, adopting dropout as a Bayesian approximation alleviates the computational consumption and accuracy degradation that may be caused by the uncertainty characterization process in deep learning models. Thus, we model the EUM of the IG-DC by using the Monte Carlo dropout. Specifically, the status of the dropout is configured to “true”. We utilize the dropout to randomly sample the image features after the up block () and then reconstruct the HR image by using the sampled features.
In training, the network structure and training strategy remain the same as those in the IG-DC. In the test procedure, we enter an LR image as an input N times and obtain a set of different outputs [
,
, …,
,
]. The EUM is formulated as the variance of the outputs:
where
is the operation of normalization.
Finally, we obtain the IG-DC’s EUM for each image in the training dataset.
3.4. EU-DC
To build a divide-and-conquer network that is consistent with the network processing difficulty, we transform the IG-DC into the EU-DC by substituting the image-gradient-based division with EUM-based division. On the one hand, the EUM considers the properties of both the input image and the network. On the other hand, the value of the EUM has 256 levels; thus, the difficulty of image processing is divided more accurately and finely. Further, the EUM-based division is constructed with the EUM as the prior information of the IG-DC’s processing difficulty distribution. Specifically, we quantify the EUM according to two levels to define
and
. As shown in
Figure 1, the EUM is binarized by
[
25] to get the hard areas, i.e.,
= OTSU(EUM). The
can be obtained by reversing
, i.e.,
= 1-
.
Before the training of the EU-DC, we utilized the Monte Carlo dropout to model the epistemic uncertainty on all of Div2K’s data. To obtain the values of and required for network training, we employed to quantify the epistemic uncertainty map into two levels. Finally, we applied and to guide the network in restoring the complicated regions and accessible regions, respectively.
In the training procedure, by obtaining the IG-DC’s EUM for each image in the second step of our main line, we no longer need the dropout to model the EUM; thus, the dropout is turned off. The EU-DC utilizes the same dataset, loss function, and training strategy as those in the ID-DC to perform supervised learning. Compared with the IG-DC, the EUM is an additional input for the SR model because we need to use the EUM-based division to transform the EUM into and . Through the EUM’s guidance, the EU-DC accurately allocates more computing power to areas in which IG-DC does not process well and improves the overall processing performance in these regions. In other words, according to the EUM is where the IG-DC does not perform well. The EU-DC pays attention to to obtain more excellent overall capabilities. During the test, we no longer need to enter the EUM and only input the degraded image because the EUM’s only role is to guide the supervised learning of EU-DC, and generating does not require the EUM. The EU-DC can reconstruct HR images and predict the processing-difficulty-attentive masks, accessible processing areas , and complex processing areas .
In summary, we transform the IG-DC into the EU-DC by replacing the gradient-based division method with the EUM-based division method. EU-DC is an upgraded version that improves upon the IG-DC’s imperfections.
4. Experiment
To evaluate our technique, we carried out a comprehensive set of experiments with the aim of answering the following two questions:
What are the superiorities of the proposed EU-DC SR model? The answer to this question is based on its characteristics, including the allocation of computational overhead, the analysis of the EUM, and the division method.
Is the proposed reconstruction solution superior to the state-of-the-art SR methods when comparison the combination of a quantitative analysis and the visual quality? The answer to this question is based on a comprehensive comparison with other SR methods. We analyzed objective metrics, visual quality, model parameters, and running times.
4.1. Implementation Details
The IG-DC and EU-DC were trained with a training set (800 images) from DIV2K [
26]. Both of the hyperparameters—the block size and window size for Harris—in the IG-DC were set to 3. The free parameter in the corner detection equation for Harris is was to 0.04. Moreover, the training set was processed with a scaling factor of
between the LR and HR images. The input LR images were obtained by down-sampling their GT images by using the bicubic method [
27]. We set the batch size to 16. The spatial size of the cropped HR patch was
. The Adam optimizer [
28] was used, in which
was 0.9 and
was 0.99. We set the learning rates to
for both the generator and the discriminator and reduced them to half at 50 k, 100 k, 200 k, and 300 k iterations. The hyperparameters in Equation (
5), namely,
,
, and
, were set to 0.1, 1, and 0.005, respectively.
,
, and
in Equation (
8) were set to 1, 4, and 1, respectively. We set the sampling rate of the dropout to 0.2. Our stacked architecture in the IG-DC included 20 RRDB blocks. We allocated 5 and 15 RRDB blocks for the easy and hard regions, respectively. Before training the EU-DC, we first obtained the IG-DC’s EUM for each image in the training set (800 images) from DIV2K. For the test of the EU-DC, we used four benchmark datasets, namely, Set5 [
29], Set14 [
30], BSDS100 [
31], and Urban100 [
32].
4.2. Superiority Analysis
To demonstrate the superiority of the EU-DC, we performed comprehensive studies on our method. As shown in
Table 1, the base model was the IG-DC.
and
denote the
basic RRDB blocks that reconstructed simple areas and the other
basic RRDB blocks that served to restore difficult areas.
and
in
Table 2 are identical to those in Equation (
8). All results from the reconstructed degraded images in the Set14 dataset were comprehensively evaluated with objective and visual metrics. The objective metrics included the PSNR and SSIM [
33], and the visual metrics included the NIQE [
34] and LPIPS [
35]. The higher the indicators of the PSNR and SSIM, the better the quantitative quality of the reconstructed image. The lower the values of the NIQE and LPIPS, the better the visual quality of the reconstructed image.
4.2.1. Allocation of Computational Overhead
In order to prove that our proposed network structure can reasonably allocate computing power, we conducted experiments on control variables for module allocation. Both the IG-DC and EU-DC divided an input image into two difficulty levels, resulting in the final reconstruction being affected by the restoration qualities of regions with distinct ratings. Discriminate processing was carried out in the feature extraction and backpropagation phases. We demonstrated the roles of these two stages by using control variates. and were our initial conditions. It is worth emphasizing that the EU-DC and its corresponding IG-DC adopted the same network structure and loss functions, regardless of the allocation scheme employed.
To demonstrate the essential effect of the stacked structures in obtaining excellent overall performance, we experimented with RRDB allocation schemes under the conditions of
and
. As shown in
Table 1, we adopted three different schemes for allocation of computational overhead. The distribution of “5 & 15” means that more computational overhead was concentrated on challenging areas. By contrast, “15 & 5” denotes that we paid more attention to reconstructing simple regions. “10 & 10” is a balanced option. Compared to “15 & 5”, “5 & 15” surpasses it in all indicators, regardless of if the IG-DC or EU-DC is used. Between “5 & 15” and “10 & 10”, “5 & 15” obtains a better quantitative quality, whereas “10 & 10” is superior in visual quality. It is worth noting that “5 & 15” surpasses “10 & 10” very much in objective quality, but “10 & 10” does not surpass “5 & 15” very much in visual quality. Therefore, “5 & 15” is an excellent option for the IG-DC and EU-DC.
Moreover, to prove the effect of modifying the loss weights on the allocation of the computational power, an experiment on the loss weights was performed with the best RRDB allocation scheme, “5 & 15”. We fixed the value of
to 1 and modified the various branches’ loss weights by adopting values from the list [1, 2, 4, 6, 8] for
. As shown in
Table 2, we transformed
from 1 to 4. The objective indicators slightly decreased, while the visual indicators significantly improved, especially in the NIQE. Further, by continuing to raise the value of
, our emphasis was heavily unbalanced, causing all indicators to decline to varying degrees. Consequently, setting
to 4 was a great choice for improving the all-around performance, and the loss weights affected the distribution of the computing power and balanced the overall effect of reconstruction.
To put it in a nutshell, the EU-DC reasonably allocated computational overhead in both the feature extraction and backpropagation phases, and it realized an exceptional balance between quantitative quality and visual performance.
4.2.2. Analysis of the EUM
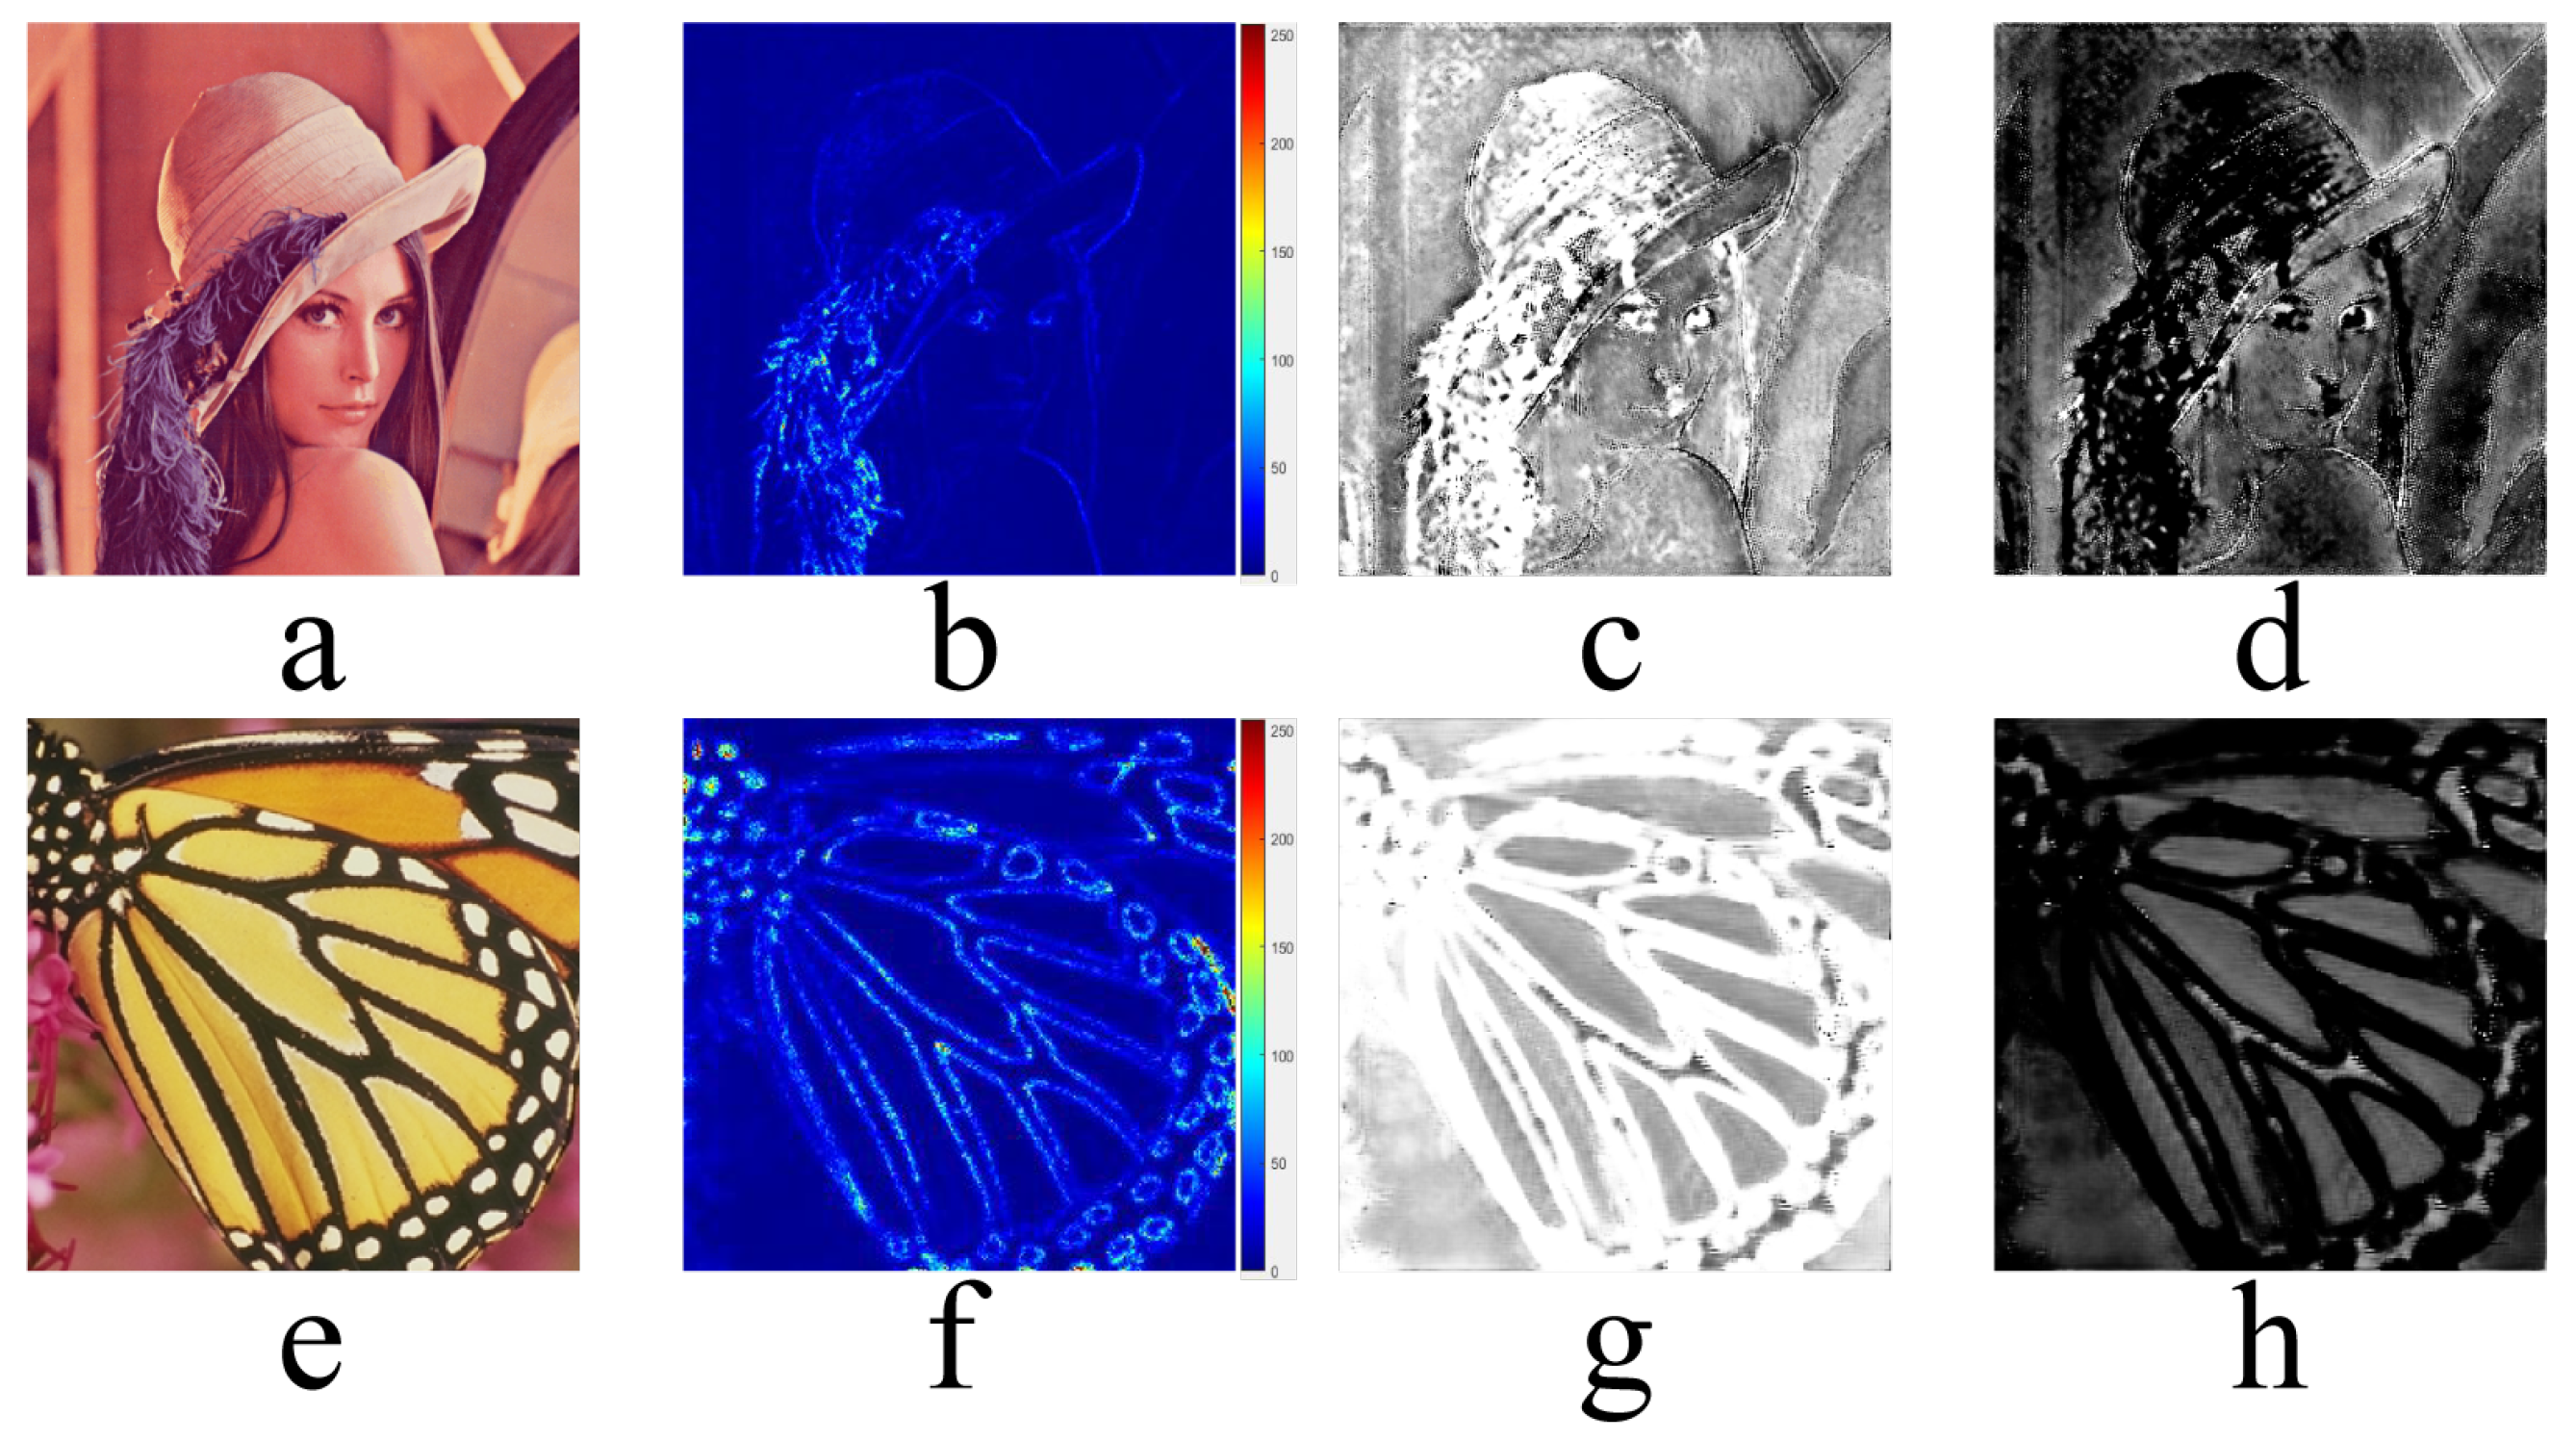
In order to analyze the rationality of quantizing the processing difficulty with the EUM, we visually analyzed it. As shown in
Figure 2, we utilized MATLAB’s colormap to visualize the IG-DC’s EUM for a more intuitive understanding. We first analyze
Figure 2a. The information in “lenna” contains fine textural details and edge structures.
Figure 2b shows the EUM of “lenna”. The large numerical values are mainly concentrated in the hair texture area, which indicates that it is challenging for the IG-DC to reconstruct complex textures. This is consistent with the fact that GAN-driven SR methods tend to create pseudo-textures in complex regions.
Figure 2e includes more flat regions, and
Figure 2f mainly positions the edge structure, which demonstrates that the EUM dynamically adapts to input images with different characteristics. In addition, the EUM quantifies the processing difficulty into 256 levels, which is more refined than the gradient-based division method. To illustrate that the EUM can effectively guide the EU-DC in dividing and conquering input images, the processing-difficulty-attentive masks (
and
) are also presented in
Figure 2.
Figure 2c accurately locates the area with a high value in the EUM, and it is regionally complementary to
Figure 2d.
Figure 2g,h also complement each other in certain regions, which proves that the network can effectively carry out regional supervised learning.
To sum up, on the one hand, the regions with higher values in the EUM were, indeed, strongly correlated with areas that were difficult to handle. On the other hand, the EUM was able achieve more refined division. Consequently, the EUM is a reasonable and precise program for quantifying processing difficulty.
4.2.3. Division Method
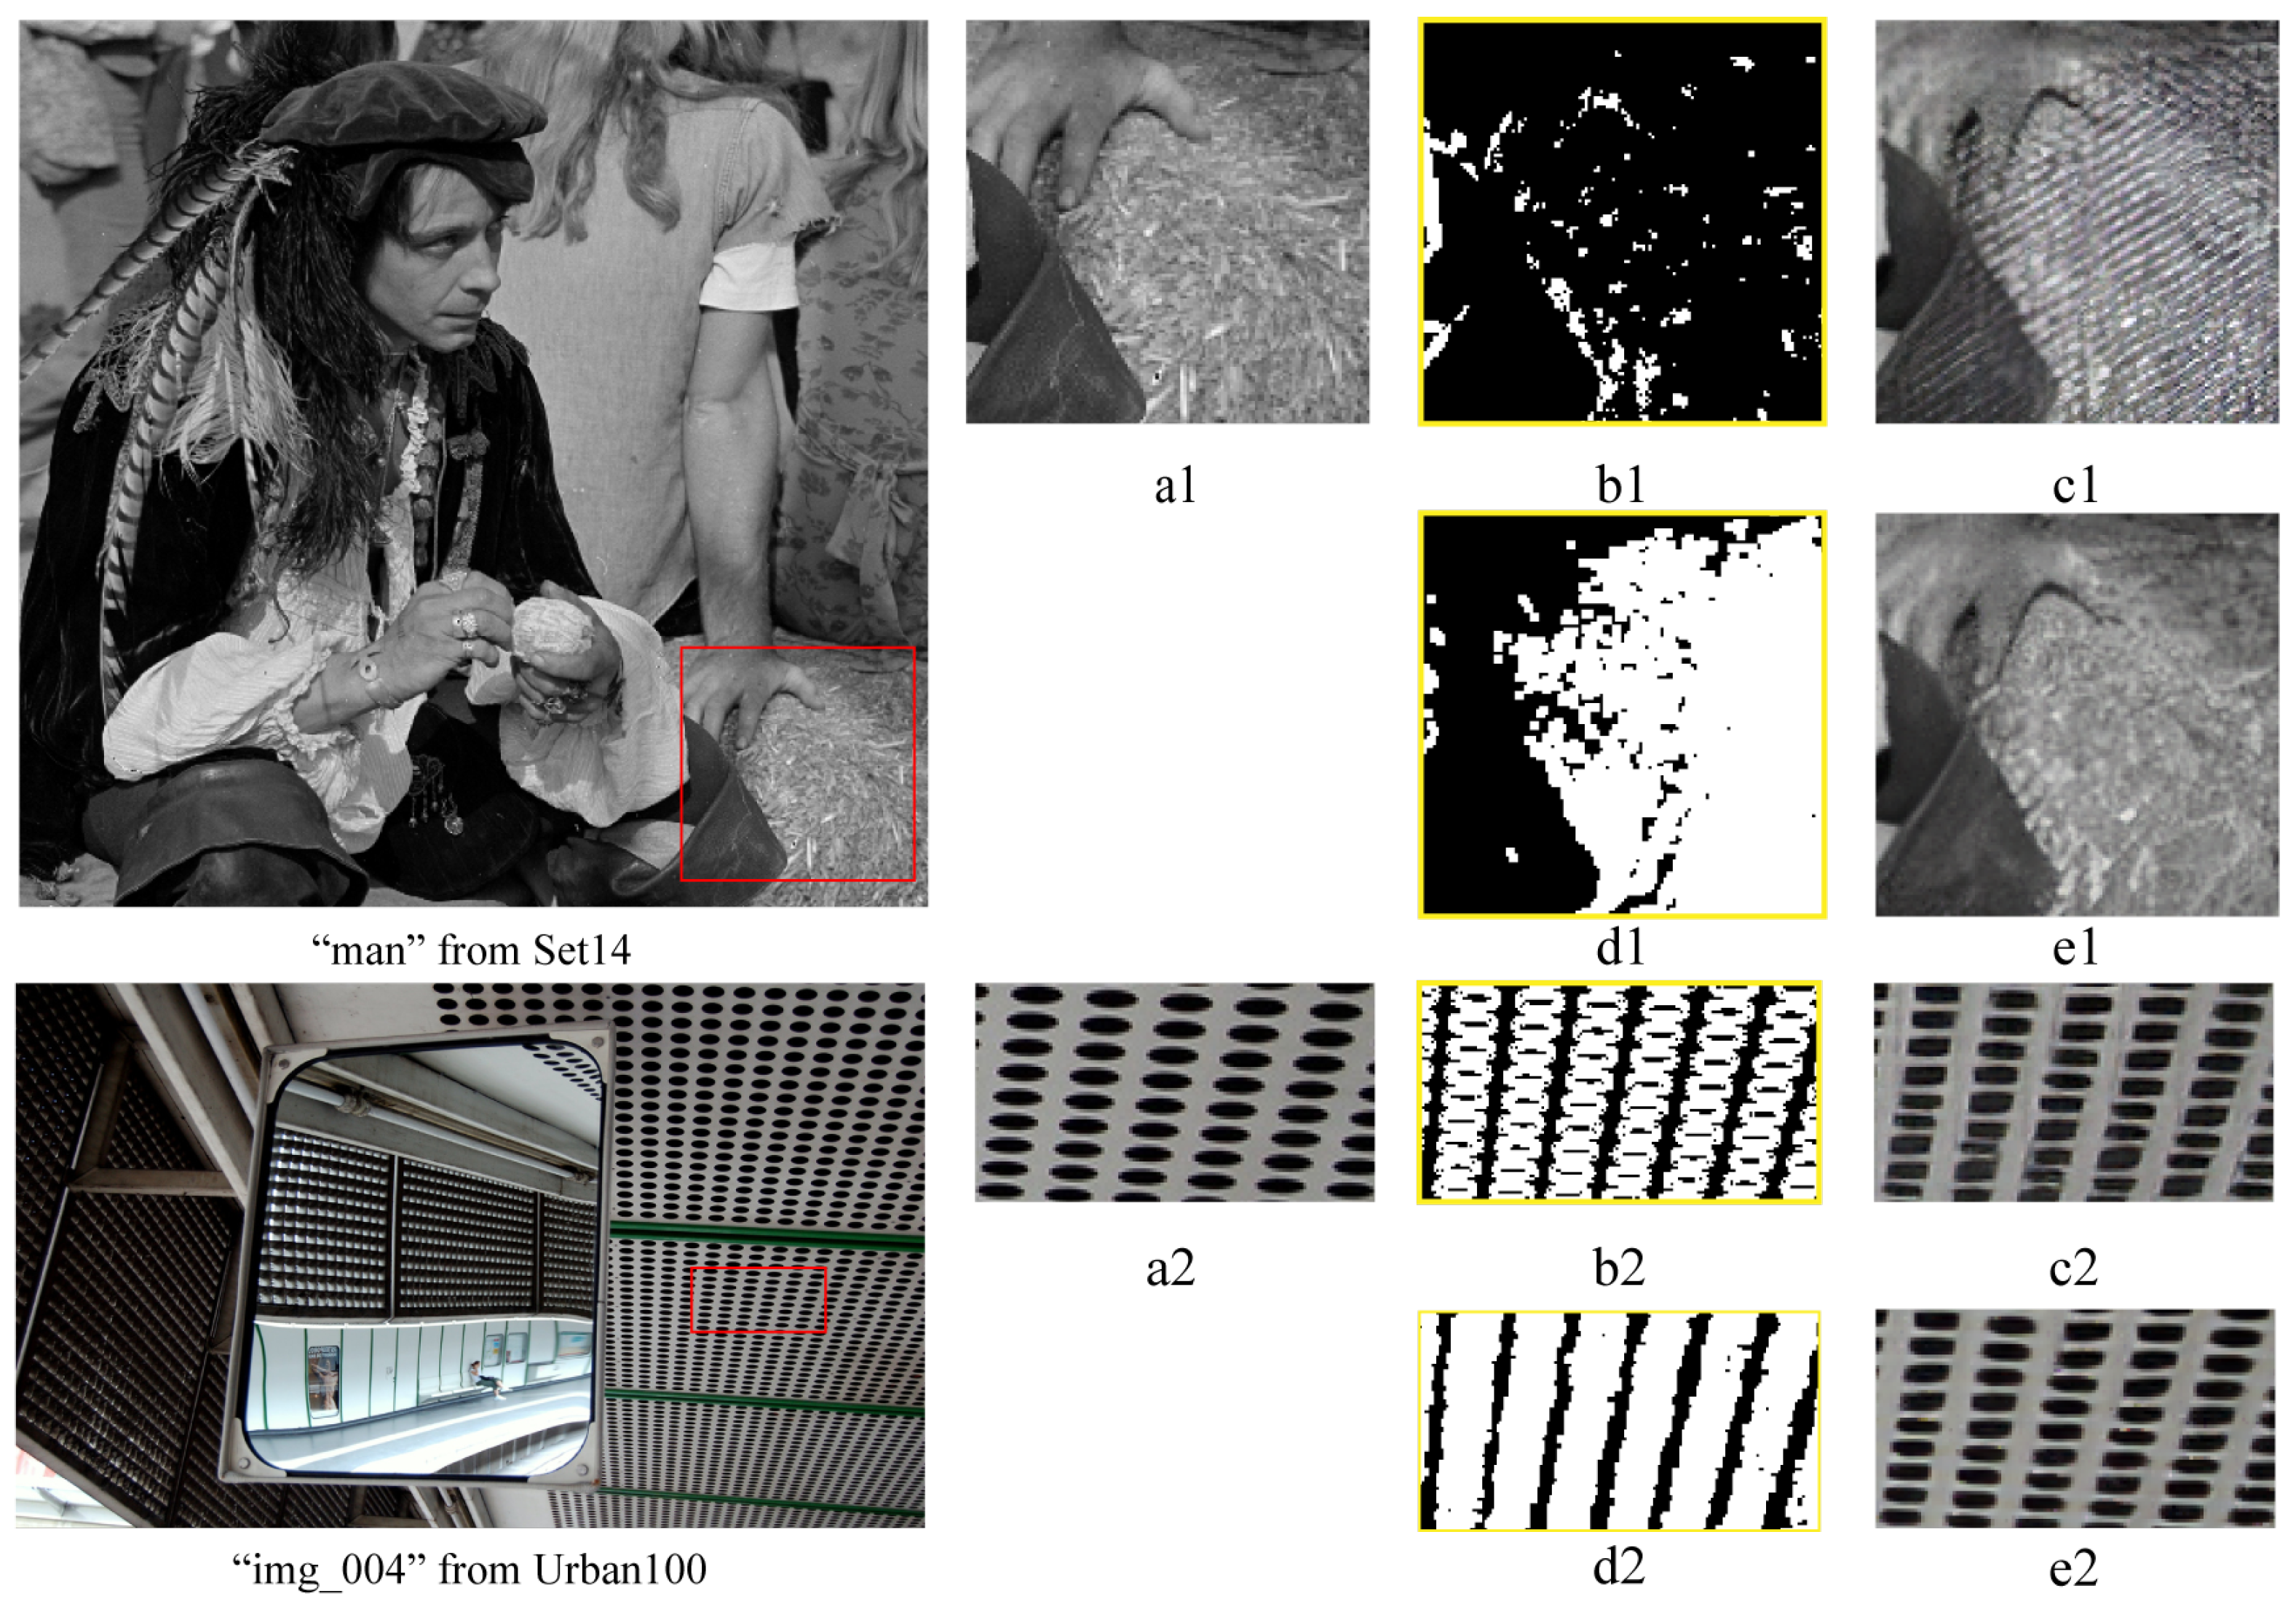
We performed a comprehensive experimental analysis to demonstrate that epistemic-uncertainty-based division is more reasonable and effective in quantizing the processing difficulty than image-gradient-based division. As shown in
Figure 3, on the one hand,
varied widely for the IG-DC and EU-DC. The low numerical distribution in
Figure 3(b1) indicates that the IG-DC model considered the ROI of “man” to be easily reconstructed for the network. By contrast, the HR image in
Figure 3(c1) that was restored by the ID-DC was full of pseudo-textures, which indicated that gradient-based difficulty division methods do not accurately locate the distributions of actual processing difficulties. Meanwhile,
Figure 3(d1) shows that the EU-DC accurately located difficult processing areas. The HR results in
Figure 3(e1) show that a natural texture was reconstructed. On the other hand,
was similar for the IG-DC and EU-DC. As shown in
Figure 3(b2,d2),
Figure 3(b2) is more regular and has many fine structures, which is unreasonable because images with degraded resolutions have often lost these tiny features. Consequently, distortions appear in the reconstructed HR image in
Figure 3(c2).
Figure 3(d2) is relatively flat and can completely cover delicate structures. The results restored by the EU-DC in
Figure 3(e2) are well structured.
Based on the above analysis, EUM-based division is more reasonable and adequate than image-gradient-based division because EUM-based division considers not only the input image information, but also the network’s properties for a particular degraded image.
In addition, as shown in
Table 1, no matter what allocation of computational overhead scheme is adopted, under conditions in which the network structure and training strategy are identical, the EU-DC surpasses the IG-DC by a large margin for all indicators. The improvement in the indicators further illustrates the superiority of the EUM-based division method.
In conclusion, the EU-DC is an advanced SISR model because it can accurately and effectively divide the difficulty levels and reasonably allocate the computational overhead for different ratings of areas.
4.3. Quantitative Analysis
4.3.1. Quantitative Evaluation
To demonstrate the superiority of the proposed method, we compared it with a variety of recently proposed SR networks, including ESRGAN [
10], NatSR [
11], SPSR [
12], and ATG [
36]. We used the PSNR, SSIM [
33], NIQE [
34], and LPIPS [
35] as evaluation metrics. Overall, our EU-DC method was able to achieve a comparable or superior performance with respect to its existing counterparts.
In
Table 3, we present the results of recent advanced super-resolution network methods on the Set5, Set14, BSDS100, and Urban100 datasets. In comparison with ESRGAN, our approach surpassed it by a large margin for all indicators. NatSR obtained excellent objective quality in terms of the PSNR and SSIM metrics. However, it obtained unsatisfactory results for the visual metrics, suggesting that NatSR tends to produce relatively blurry results with a high PSNR compared to the results of other perceptually driven methods. Our method surpassed NatSR in the objective metrics and maintained a superior visual quality. SPSR achieved good results for the visual indicators by introducing image gradient information in order to suppress image distortion. At the same time, our method achieved higher scores on all indicators than SPSR did in the objective evaluation. ATG obtained well-rounded metrics, especially on the Set5 dataset, but our method obtained better indicator scores when considering all of the metrics for all datasets.
Therefore, our EU-DC method comprehensively achieved excellent indicator scores on all test datasets, and it is superior to the recent SR methods with which it was compared in terms of both quantitative and visual quality indicators.
4.3.2. Model Size and Running Times
We analyzed the computational complexity of the EU-DC and compared it with those of other advanced SR models. We first show the model parameter sizes of the EU-DC and the other advanced SR models in
Table 4. In addition, we recorded the running time that it took for each method to test the Urban100 dataset.
Model Size: The parameter size of NatSR was the most lightweight, but NatSR lacked superior performance. The EU-DC’s parameter size was secondary, and there was only a small gap between the EU-DC and NatSR. In terms of the comprehensive performance comparison, the EU-DC far exceeded NatSR. The model parameters of SPSR were the largest, but it did not obtain the best overall indicator scores. ATG achieved slightly inferior metrics than the EU-DC, but it used more model parameters than the EU-DC. It is worth noting that ESRGAN, SPSR, and the EU-DC all employed stacked RRDB structures to extract image features, but the EU-DC built the best-performing model by utilizing the minimum number of RRDBs. Therefore, the EU-DC is more efficient in utilizing computational resources to achieve better reconstruction.
Running times: We evaluated the proposed and start-of-the-art methods mentioned above on the Urban100 dataset. We performed all experiments on a GeForce RTX 2080Ti with 11 GB of memory. The running times are shown in
Table 4. The running times of the proposed method were slightly inferior to those of ATG. In contrast, our approach was faster than ERSGAN, NatSR, and SPSR, which shows the EU-DC’s advantages in terms of computational complexity.
In conclusion, the EU-DC utilizes computational resources effectively, and its computational complexity is lower than those of other advanced SR models.
4.4. Visual Quality Comparison
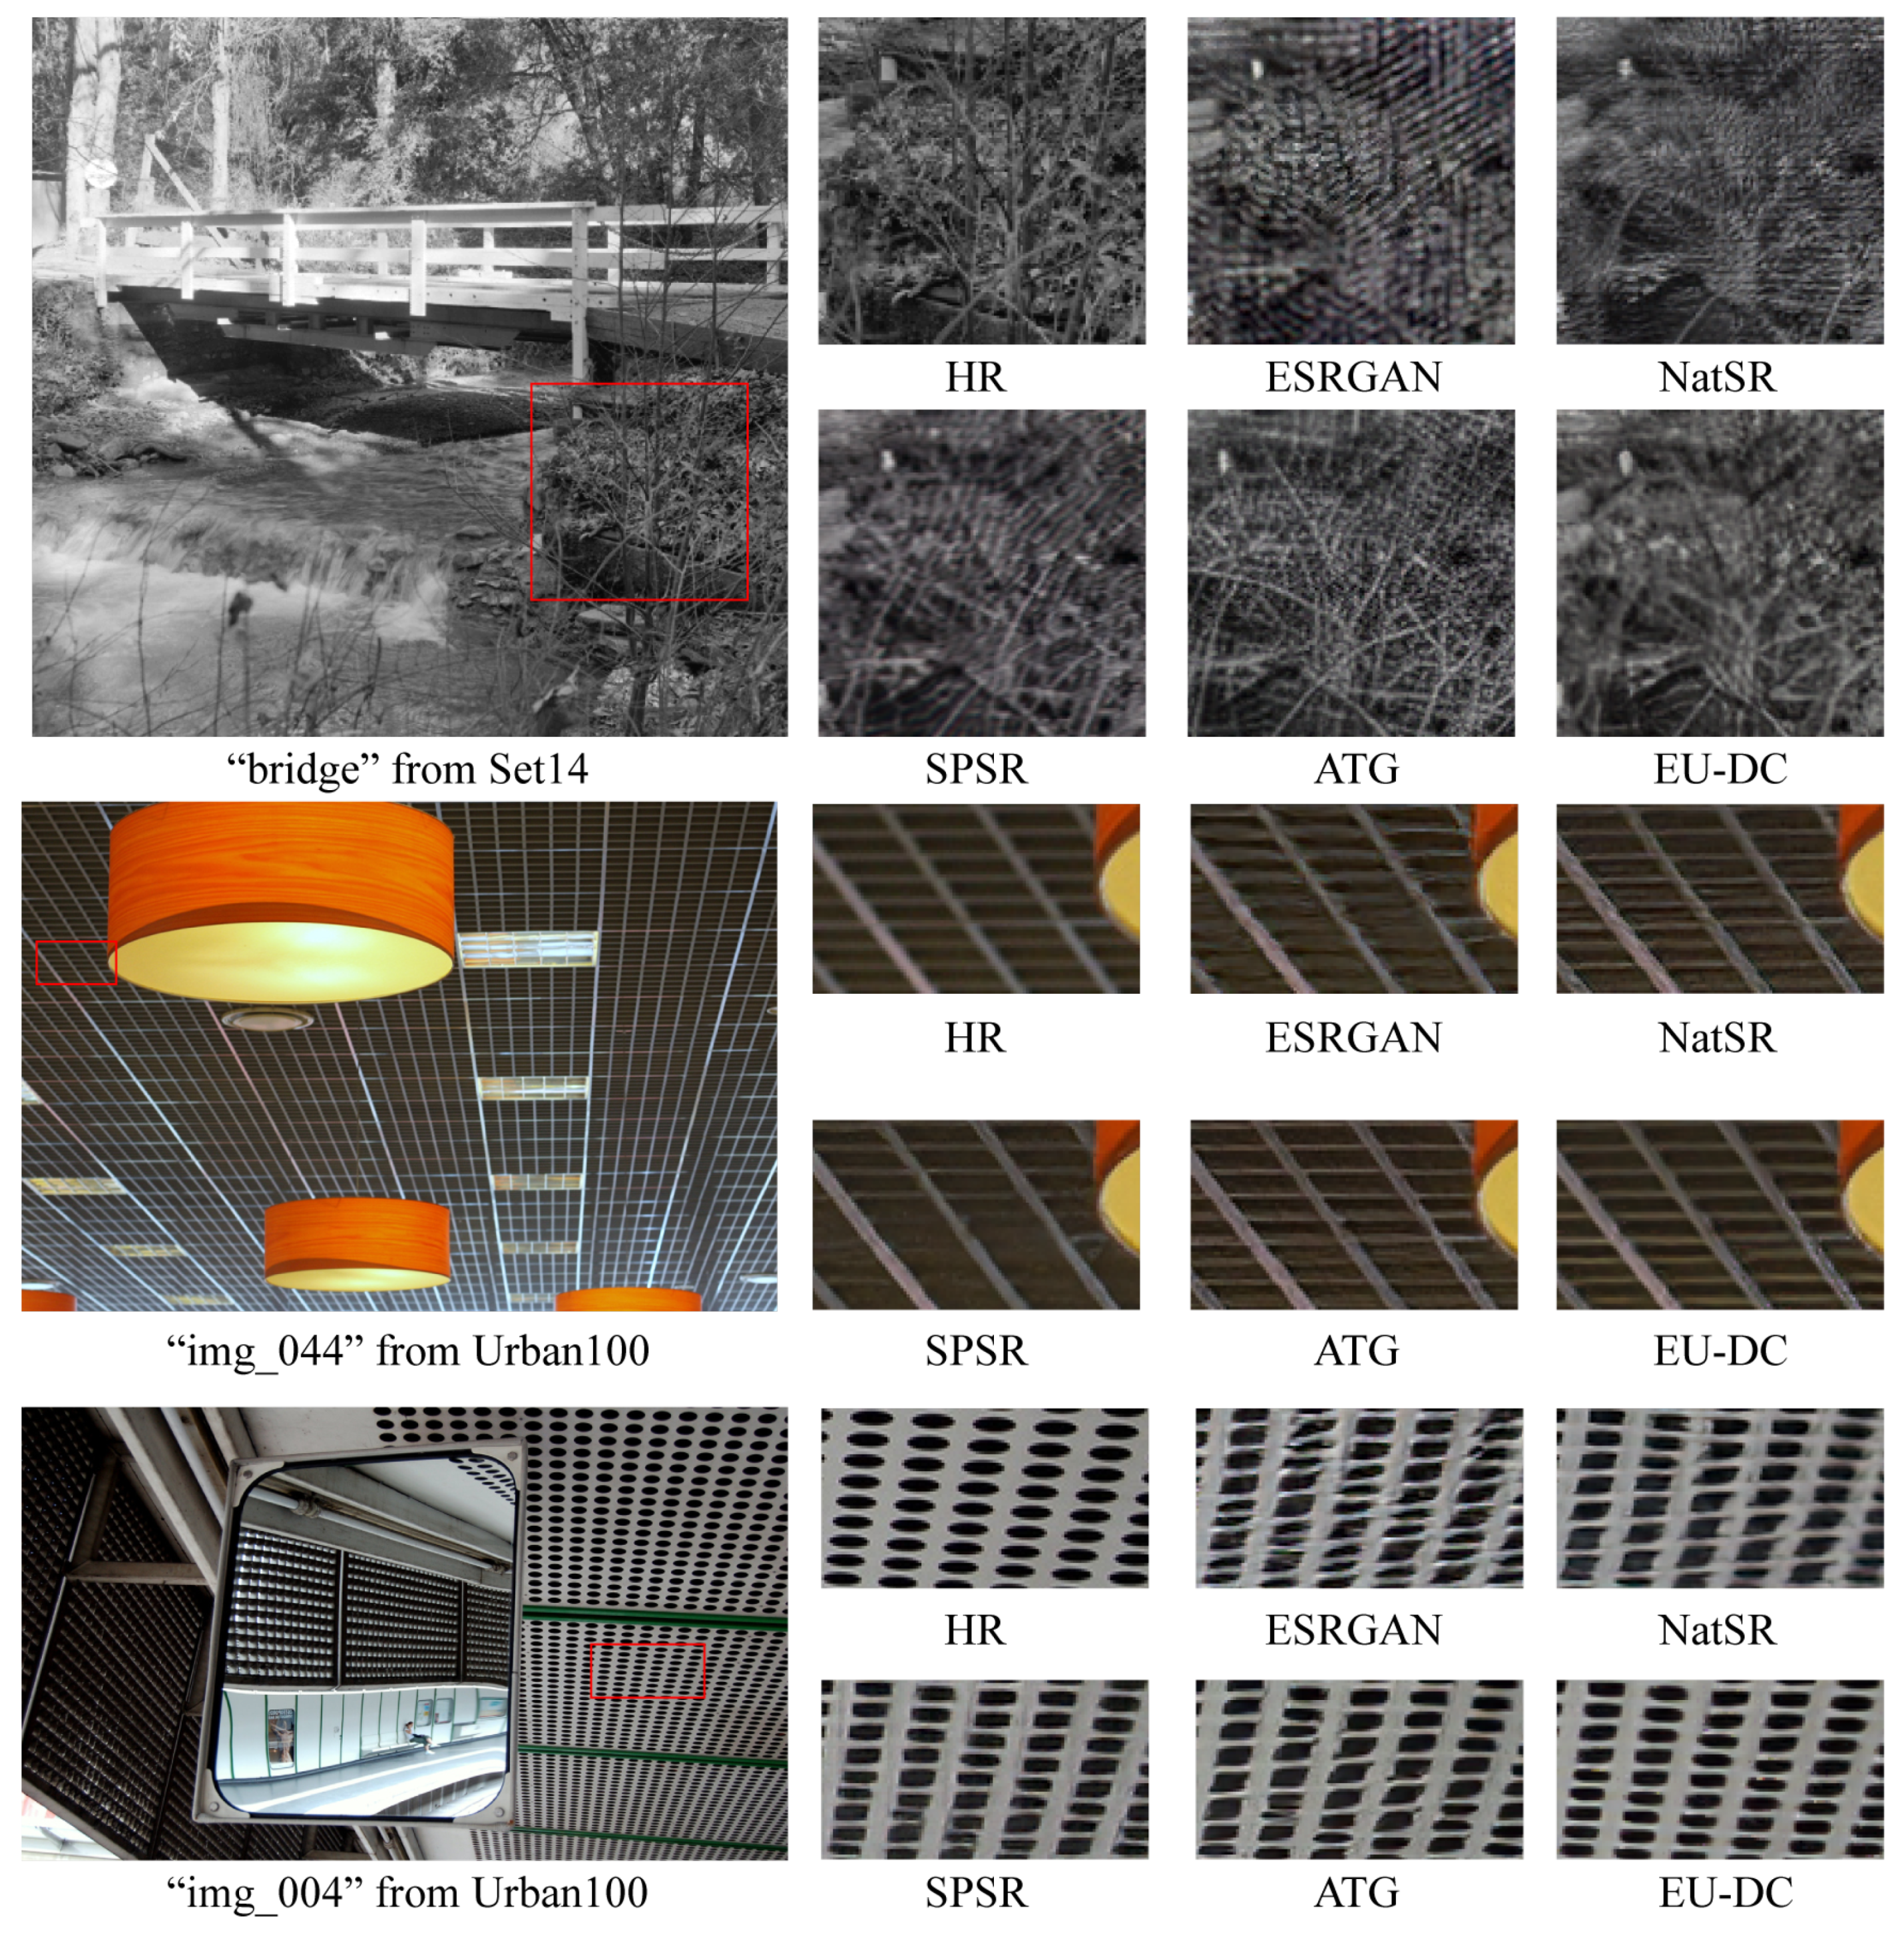
We conducted visual quality comparisons to demonstrate the superiority of our approach more intuitively. In addition to the quantitative analysis conducted above,
Figure 4 depicts a visualization of the results of our EU-DC method and the methods with which it was compared. First, taking bridge.png in the Set14 dataset as an example, our EU-DC restored more realistic tree textures than the other SR models did, thus making the rebuilt image more natural. On the contrary, the other models produce plenty of pseudo-texture and distortions.
Another case is img_044.png from the Urban100 dataset. Restoring small periodic structures and making them easy to identify is challenging. Therefore, previously proposed SR approaches, from ESRGAN to ATG, have failed to address the problem. In their results, these tiny structures still have varying degrees of blur, so it is challenging to define the edges of each fine detail. Our EU-DC method can restore more structural minutiae, thus making finer structures distinguishable.
As for img_004.png in the Urban100 dataset, restoring tiny and regular appearances is notably tricky. The ellipses in img_004.png recovered by ESRGAN and NatSR were massively distorted. The results restored by SPSR and ATG improved to some extent. Compared with the mentioned methods, the EU-DC reconstructed regular ellipses with little distortion.
In summary, compared with many recently proposed advanced SR models, our proposed EU-DC model recovers discernible structures and natural textures, resulting in excellent quantitative and visual quality.
6. Future Work
Although our method achieved good performance, we did not take the best advantage of the EUM. The EUM can divide the processing difficulty into 256 ratings, but here, we quantified it into simple and complicated levels without much thought. Making more effective use of the EUM will be our future work. In addition, at present, we fixed the allocation ratios for the operation modules. In the future, we will design the ratios as a training parameter so that the network can automatically adjust the balance according to the input image. Our proposed divide-and-conquer framework is universal for image restoration. The framework is especially beneficial for non-uniform degradation of image restoration because the EUM can accurately locate areas in which the degradation is severe. Therefore, we will explore the potential of this method and expand its application to other image restoration tasks, such as dehazing or deblurring. In addition, pseudo-textures and distortions often appear in the results restored with generative denoising methods in real-world scenarios. We will try to address this problem by utilizing uncertainty caused by noise as prior information.


