
Strengthening Quality of Chaotic Bit Sequences


1
Department of Computer Science and Telecommunications, Poznan University of Technology, 60-965 Poznan, Poland
2
Department of Computer Science, Opole University of Technology, 45-758 Opole, Poland
*
Author to whom correspondence should be addressed.
†
These authors contributed equally to this work.
Electronics 2022, 11(2), 272; https://doi.org/10.3390/electronics11020272
Submission received: 30 December 2021
/
Revised: 13 January 2022
/
Accepted: 13 January 2022
/
Published: 15 January 2022
(This article belongs to the Special Issue Dependability of Emerging Computing Paradigms and Technologies in IoT-Oriented Circuits, Architectures and Algorithms)
Abstract
:We discuss chaos and its quality as measured through the 0-1 test for chaos. When the 0-1 test indicates deteriorating quality of chaos, because of the finite precision representations of real numbers in digital implementations, then the process may eventually lead to a periodic sequence. A simple method for improving the quality of a chaotic signal is to mix the signal with another signal by using the XOR operation. In this paper, such mixing of weak chaotic signals is considered, yielding new signals with improved quality (with K values from the 0-1 test close to 1). In some sense, such a mixing of signals could be considered as a two-layer prevention strategy to maintain chaos. That fact may be important in those applications when the hardware resources are limited. The 0-1 test is used to show the improved chaotic behavior in the case when a continuous signal (for example, from the Chua, Rössler or Lorenz system) intermingles with a discrete signal (for example, from the logistic, Tinkerbell or Henon map). The analysis is presented for chaotic bit sequences. Our approach can further lead to hardware applications, and possibly, to improvements in the design of chaotic bit generators. Several illustrative examples are included.
1. Introduction
Most well-known chaotic-based bit generators use a single source (input), either a continuous or a discrete one [1,2]. Due to a possible synchronization [3,4,5,6] or prediction of a bit sequence because of a finite length representation [7,8,9], such sequences of bits could be compromised. Those problems are based on the fact that, in the finite precision arithmetic, the output of a single input discrete generator becomes periodic, and therefore nonchaotic, even if the length of the output sequence is of order . For sequences with lengths greater than , one can use the National Institute of Standards and Technology (NIST) tests to check certain statistical properties (i.e., randomness) of the sequences of bits. In this paper, we examine much shorter sequences (as short as 5000 bits), and we are interested in improving the levels of chaotic behavior of such sequences. The 0-1 test for chaos is the measurement tool applied to justify the improved quality of chaos.
In the quest to provide strong sequences of chaotic bits, we examine how two signals of mixed nature (continuous and discrete) behave when XORed. We claim that the quality of chaos is improved when various combinations of such signals are analyzed, as it is much more difficult to predict the chaotic binary output of the resulting signal. The parameters of the two (continuous and discrete) chaotic input systems can easily be modified each time the XORed process is run. It is shown that in the case of a small number of bits being represented, the proposed method works much better when compared with the single-source chaotic bit generators. Our method prevents periodicity, and the obtained sequence is truly chaotic, as evidenced by the results of the 0-1 test.
Furthermore, the proposed XORing process with two segments, the discrete (logistic, Henon, Tinkerbell or other map) and analog (Chua, Rössler, Lorenz or another system), can be modeled and analyzed using the hardware description language VHDL-AMS, which is an industry standard modeling language for mixed signal circuits [10,11]. In this paper, however, we focus on analyzing the dynamical properties and features of the proposed output signal rather than hardware implementations. The method described in this paper is novel, and the XOR mixing of signals, while simple in nature, gives very good results, as shown by our illustrative examples, whose results were confirmed by the 0-1 test for chaos and the ent tests. A deterioration of the quality of chaotic signals, for example, due to a failure in the chaotic system’s components or a Trojan insertion into the system, can be avoided by applying the method presented in this paper.
2. The XOR Process of Mixed-Mode Signals
Figure 1 shows the structure of the proposed process of mixing two signals. The continuous signal comes from any of the chaotic circuits of Chua, Rössler and Lorenz (or another), and the discrete signal can be any of the logistic, Henon, Tinkerbell and Baker maps (or another). As an example, Figure 2 shows the logistic map realization in a finite precision number representation for the equation with and .
2.1. The XOR Mixing Process
The continuous input in Figure 1 is discretized and synchronized with the internal clock of the discrete chaotic map. The two binary signals and are mixed through the XOR operation. As a result, a sequence of bits is obtained. The 0-1 test is then applied to the sequence to check its chaotic nature. If the result of the test is satisfactory (see the analysis below), the sequence is used to form a new sequence of chaotic bits. Otherwise, changes to the parameters of the discrete chaotic map should be considered to yield a better test result. One can also consider a replacement of the discrete chaotic system—for example, replacing the logistic map with a Tinkerbell, Henon, Baker or other discrete map [12].
The choice of XORing for mixing two signals is due to two main reasons. First, the operation is relatively simple, does not require complicated circuit realization and is widely used to mix transmitted data with secret keys in typical secure electronic transmission implementations. Furthermore, as demonstrated in this paper, the XOR operation significantly improves the quality of the obtained chaotic sequence–see the sections below. The mixing process gives a very good result, even with a small amount of bit representation. An important factor is that the quality analysis of the resulting sequence is done through a simple but reliable tool, namely, the 0-1 test, which can be implemented in a real time monitoring system.
2.2. Generation of Chaotic Bits
The chaotic behavior of the logistic map occurs for a certain range of the parameter . If the parameter value is chosen from that range, then for a chosen initial condition , we obtain a sequence of real numbers in the interval . Each of those real numbers is represented as a fixed point number. Those numbers are implemented in the digital structure of the logistic map shown in Figure 2. The is a fixed point number representation. The j index is the iteration number of the logistic map (or another implemented discrete map). The S denotes the sign bit. The sign is the same in all iterations of the logistic map, because for all , but it may change from iteration to iteration when other discrete maps are used. The are the integer part bits and the are the fractional part bits in the jth iteration. The output chaotic bits in Figure 2 are obtained in each iteration by using a bit at a selected position (fixed in all iterations) in the sequence of consecutive fixed point numbers.
Chaotic bits from the continuous system in Figure 1 result from a threshold unit, for example, in the form of a simple comparator [2]. A synchronization unit is used to synchronize those bits with the occurrence of bits . The discrete map is iterated to obtain when a bit from the continuous chaotic system is received. The two independent chaotic sequences and in Figure 1 are mixed by the XOR operation. As a result, a new sequence of bits is obtained. This sequence is next tested by the 0-1 test for chaos [13,14,15,16,17,18].
3. Computational Results
We used sequences of 5000 numbers in all our numerical calculations, and 10,000 numbers in one visual experiment associated with the last figure in this paper. In addition, and (see the description of the 0-1 test in Appendix A). Such values are suggested, for example, in [15].
First, we used the above approach to analyze the logistic map only, without a continuous chaotic system. For , the following two cases were considered. First, we examined a sequence of real numbers from the logistic map. The plot is shown in Figure 3a. Then, in the second case, the sequence of real numbers from the previous case was transformed to a respective fixed point representation. We selected a particular bit position and tested a sequence of bits from the consecutive fixed-point numbers; i.e., from each fixed-point number we selected a single bit of in Figure 2 (on the 7th position) and formed a sequence of bits taken from that selected position. Choosing the 7th position has no particular significance, and any other position could also be used. However, using a single bit position may have a significant impact and be an efficient implementation method when hardware resources are limited, for example, in FPGA devices. In this paper, the logistic map is used in a fixed point representation. Figure 3b shows the plot obtained in the second case. Since for the logistic map gives a nonchaotic signal, in both cases, the obtained graphs are of regular shape, as shown in Figure 3a,b. An interesting result of our analysis is the fact that the nonchaotic nature of the sequence of real numbers (the first case above) is transformed into a nonchaotic nature of the sequence of bits (obtained from a selected single bit position as described in the second case above). The K values from the 0-1 test in the two cases above are 0.0015 and 0.0025, respectively. These numbers clearly indicate a periodic nature of the analyzed sequences.
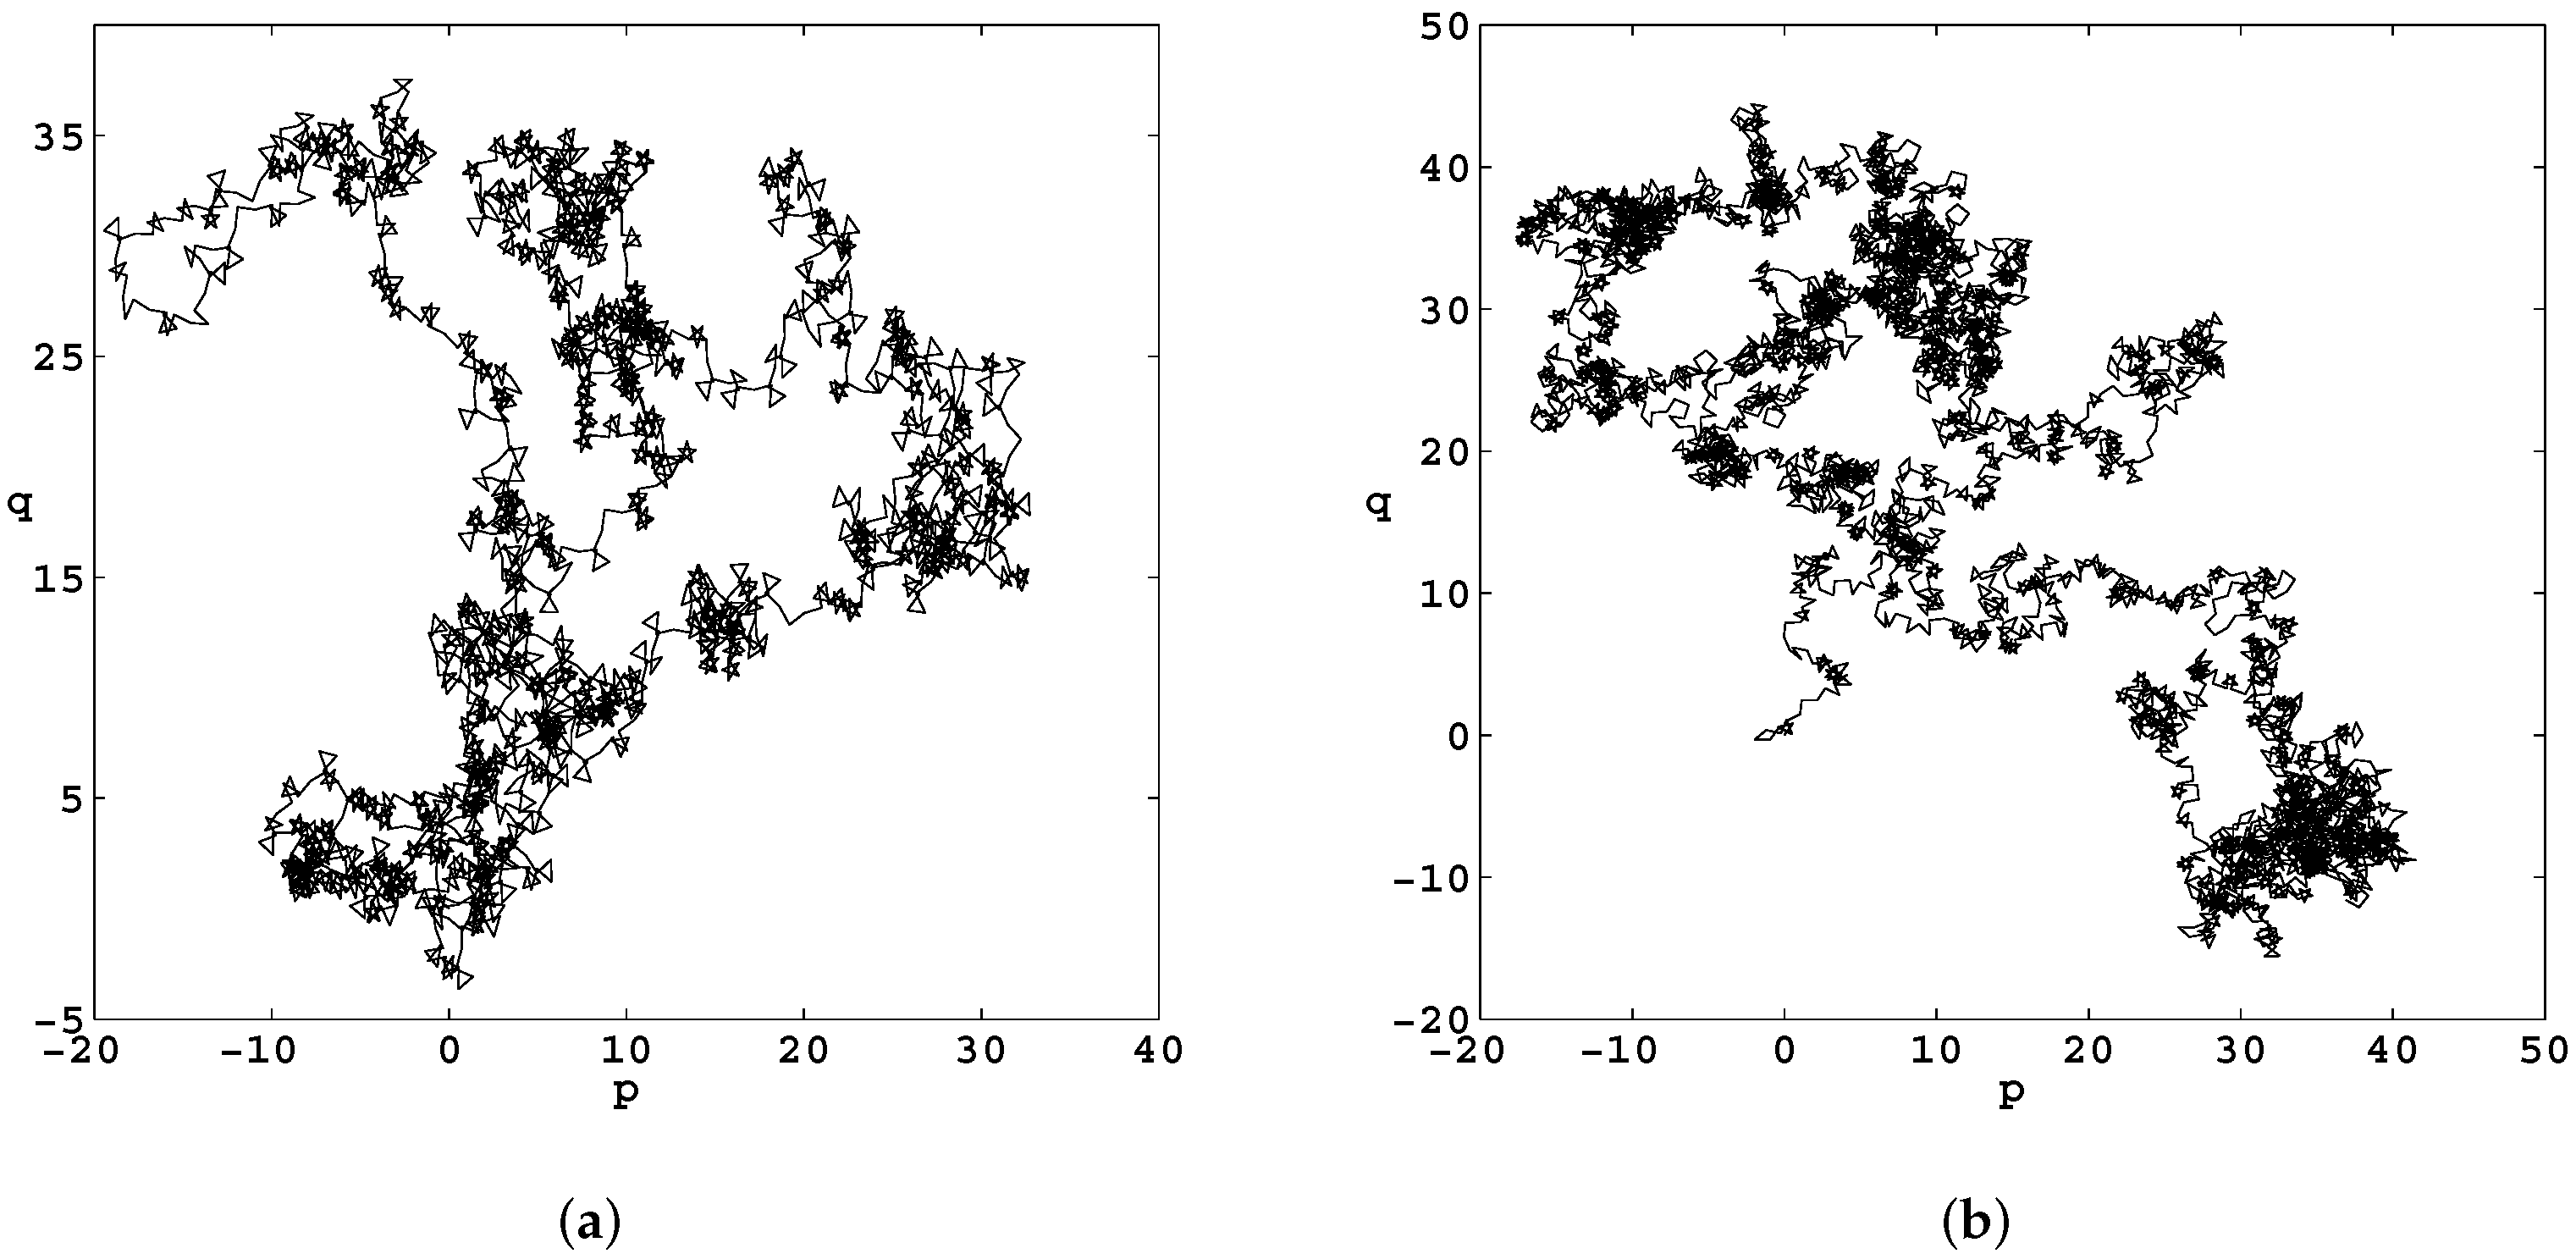
The same two cases were analyzed for the logistic map with , which resulted in chaotic behavior. The corresponding plots are shown in Figure 3c,d. The irregular shapes (Brownian-like motion) in those figures indicate the chaotic nature of the sequences. The corresponding K values from the 0-1 test are very close to 1 and equal 0.9982 and 0.9980, respectively.
Figure 4a,b shows the results for the proposed mixing of signals when a continuous chaotic output of the Chua circuit is XORed with the logistic map with a nonchaotic sequence (, Figure 4a), and with a chaotic one (, Figure 4b). The K values are 0.9974 and 0.9984, respectively.
The Chua (or another analog chaotic generator) can be realized as a hardware device (with elements R, C and diodes together with op-amps) or as a software implementation of the discretization of a solution of a system of differential equations [19].
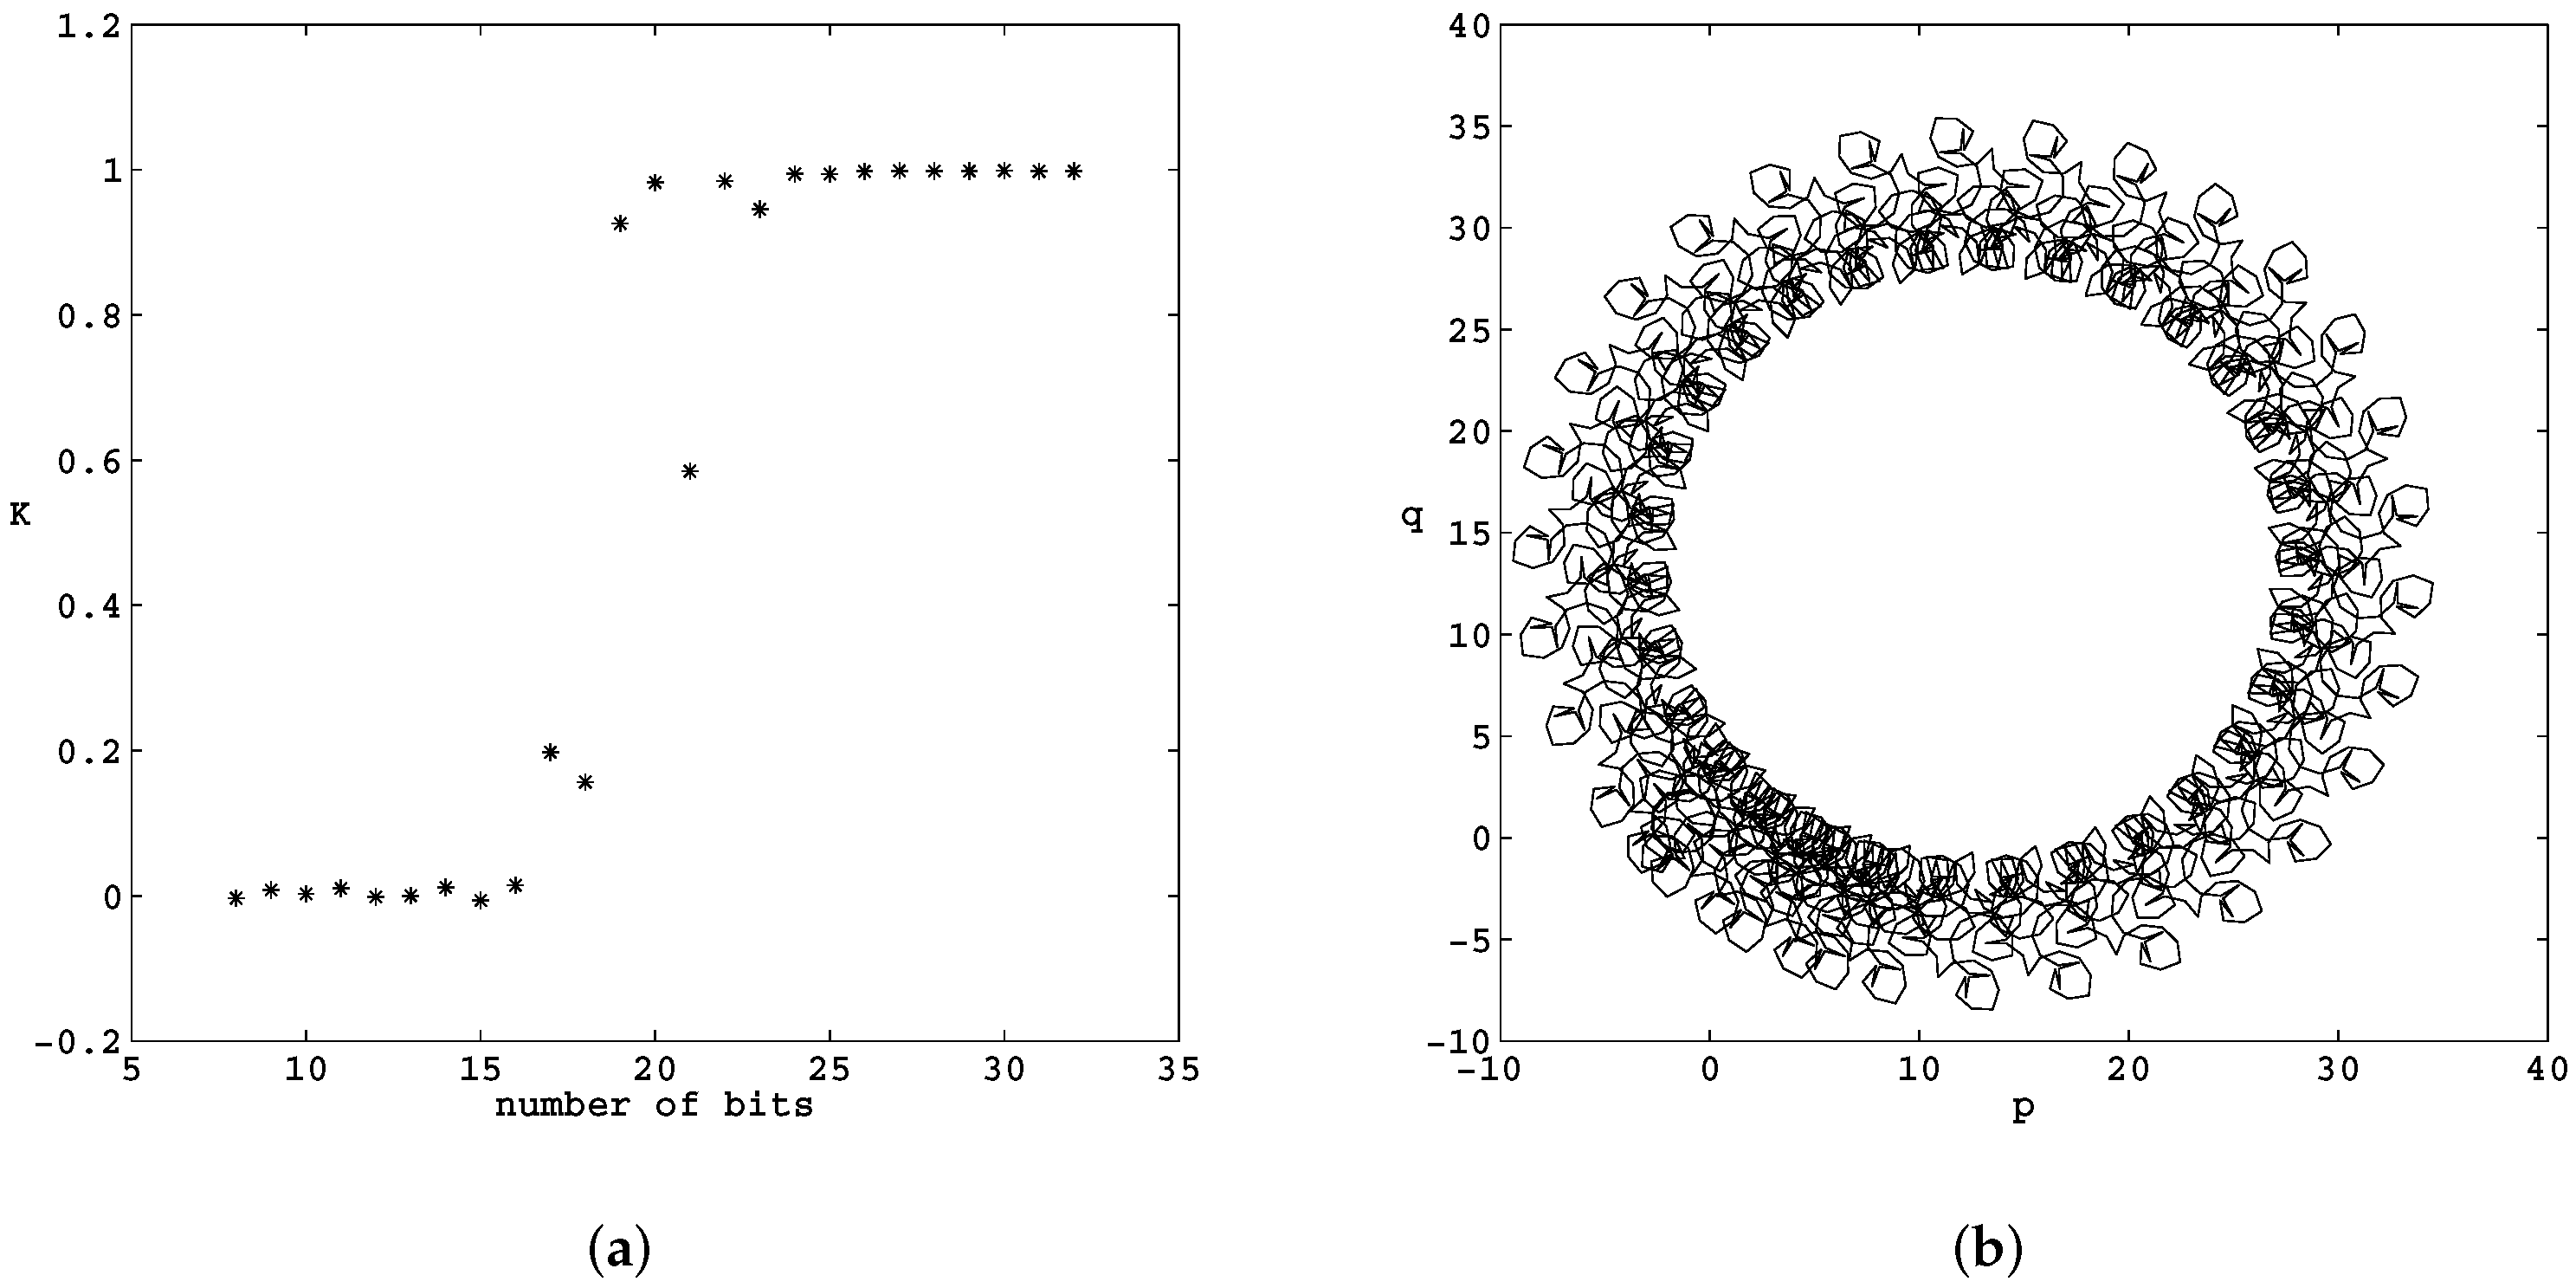
Figure 5a shows the results of applying the 0-1 test when a sequence of 7th bits was used for generated numbers with various lengths of sequence Y (between 8 and 32). Logistic map with was used. It is clear from Figure 5a that the chaotic sequences (the K values close to 1) are obtained for numbers of 22 or more bits. All numbers of 16 and fewer bits indicate regular (nonchaotic) sequences formed of the 7th bits. If the sequences of 7th bits (from logistic map) are XORed with the bits resulting from the continuous chaotic Chua (Matsumoto) circuit [19], then all the new sequences show chaotic nature with K values close to 1, as shown in Figure 5b. Moreover, we also fixed the length of numbers obtained from the logistic map (with ) to 18 bits, and as shown in Figure 5a, we obtained for the sequence of 7th bits. The corresponding plot is shown in Figure 6a. The plot is fairly regular (as expected for ), and the sequence of 7th bits can, at best, be classified as weakly chaotic. The same sequence, when XORed with a sequence obtained from continuous Chua (Matsumoto) circuit, gives , and the plot is irregular, as shown in Figure 6b.
Figure 7a shows a result similar to that of Figure 6a, but it illustrates another interesting fact about the 0-1 test. Notice that for a sequence with a 21 bit representation, we obtained , which is almost in the middle between 0 and 1. The plot for this case is shown in Figure 7b. The case can be classified as weak chaos with a fairly regular plot of .
We also examined a mixing process of chaotic bit sequences with various values of () and XOR operations with other continuous chaotic systems, such as the Chua system with Kennedy diode, Rössler and Lorenz chaotic continuous systems. The K values obtained in all such cases were all greater than , with differences in the third and fourth decimal digits.
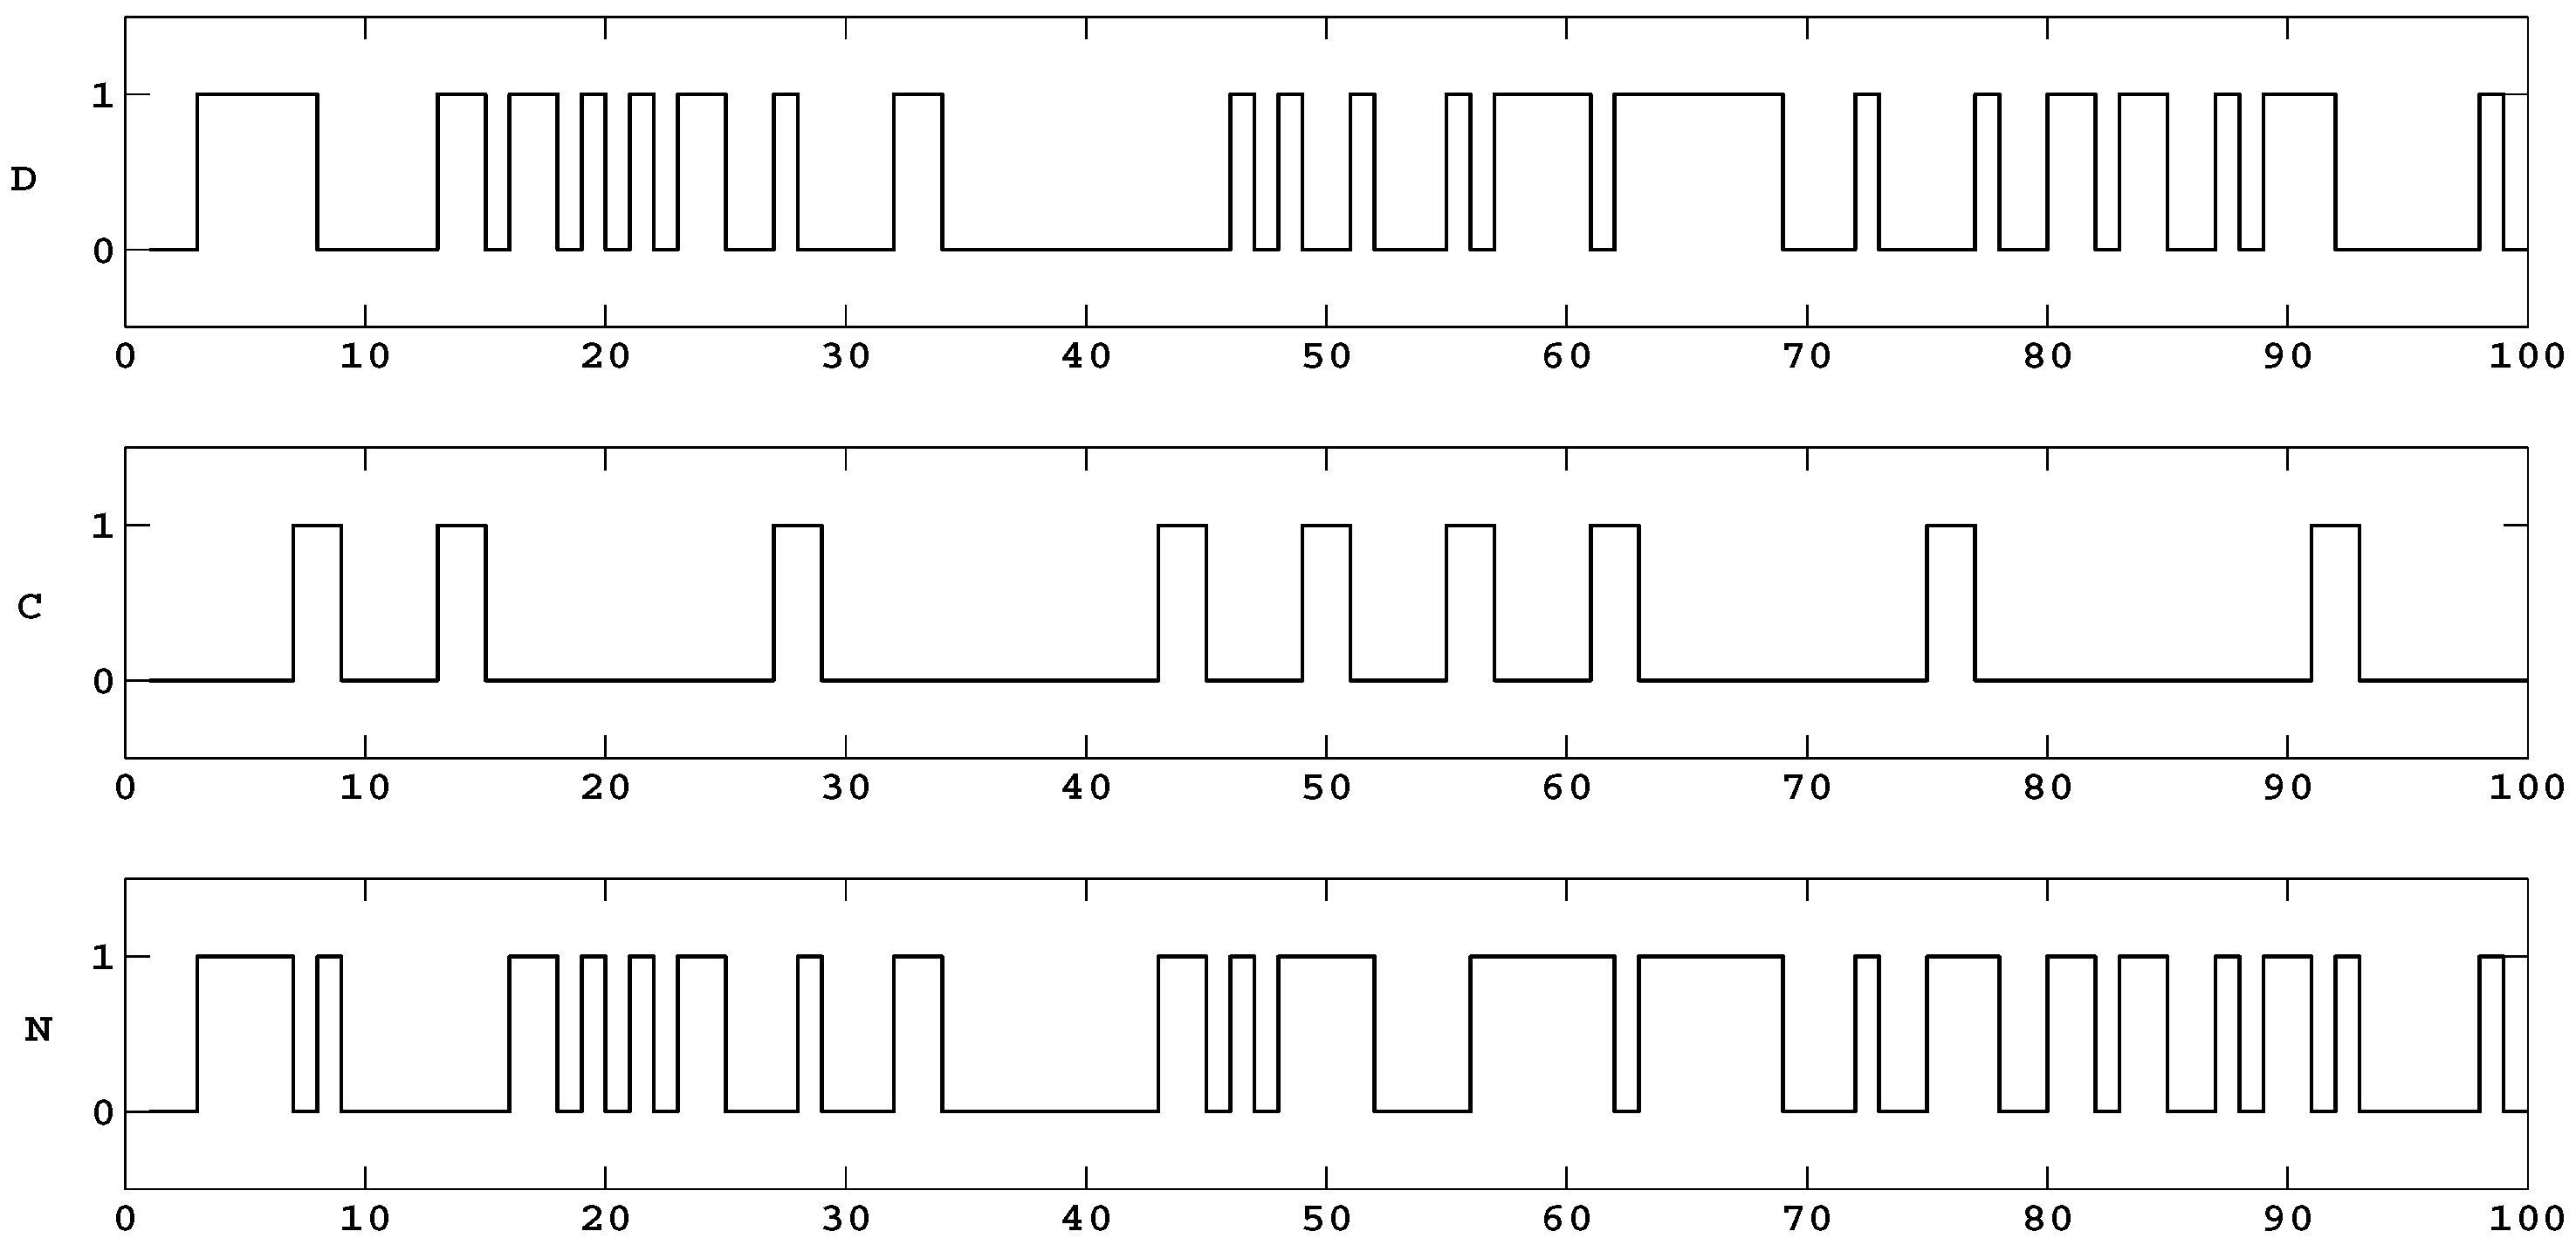
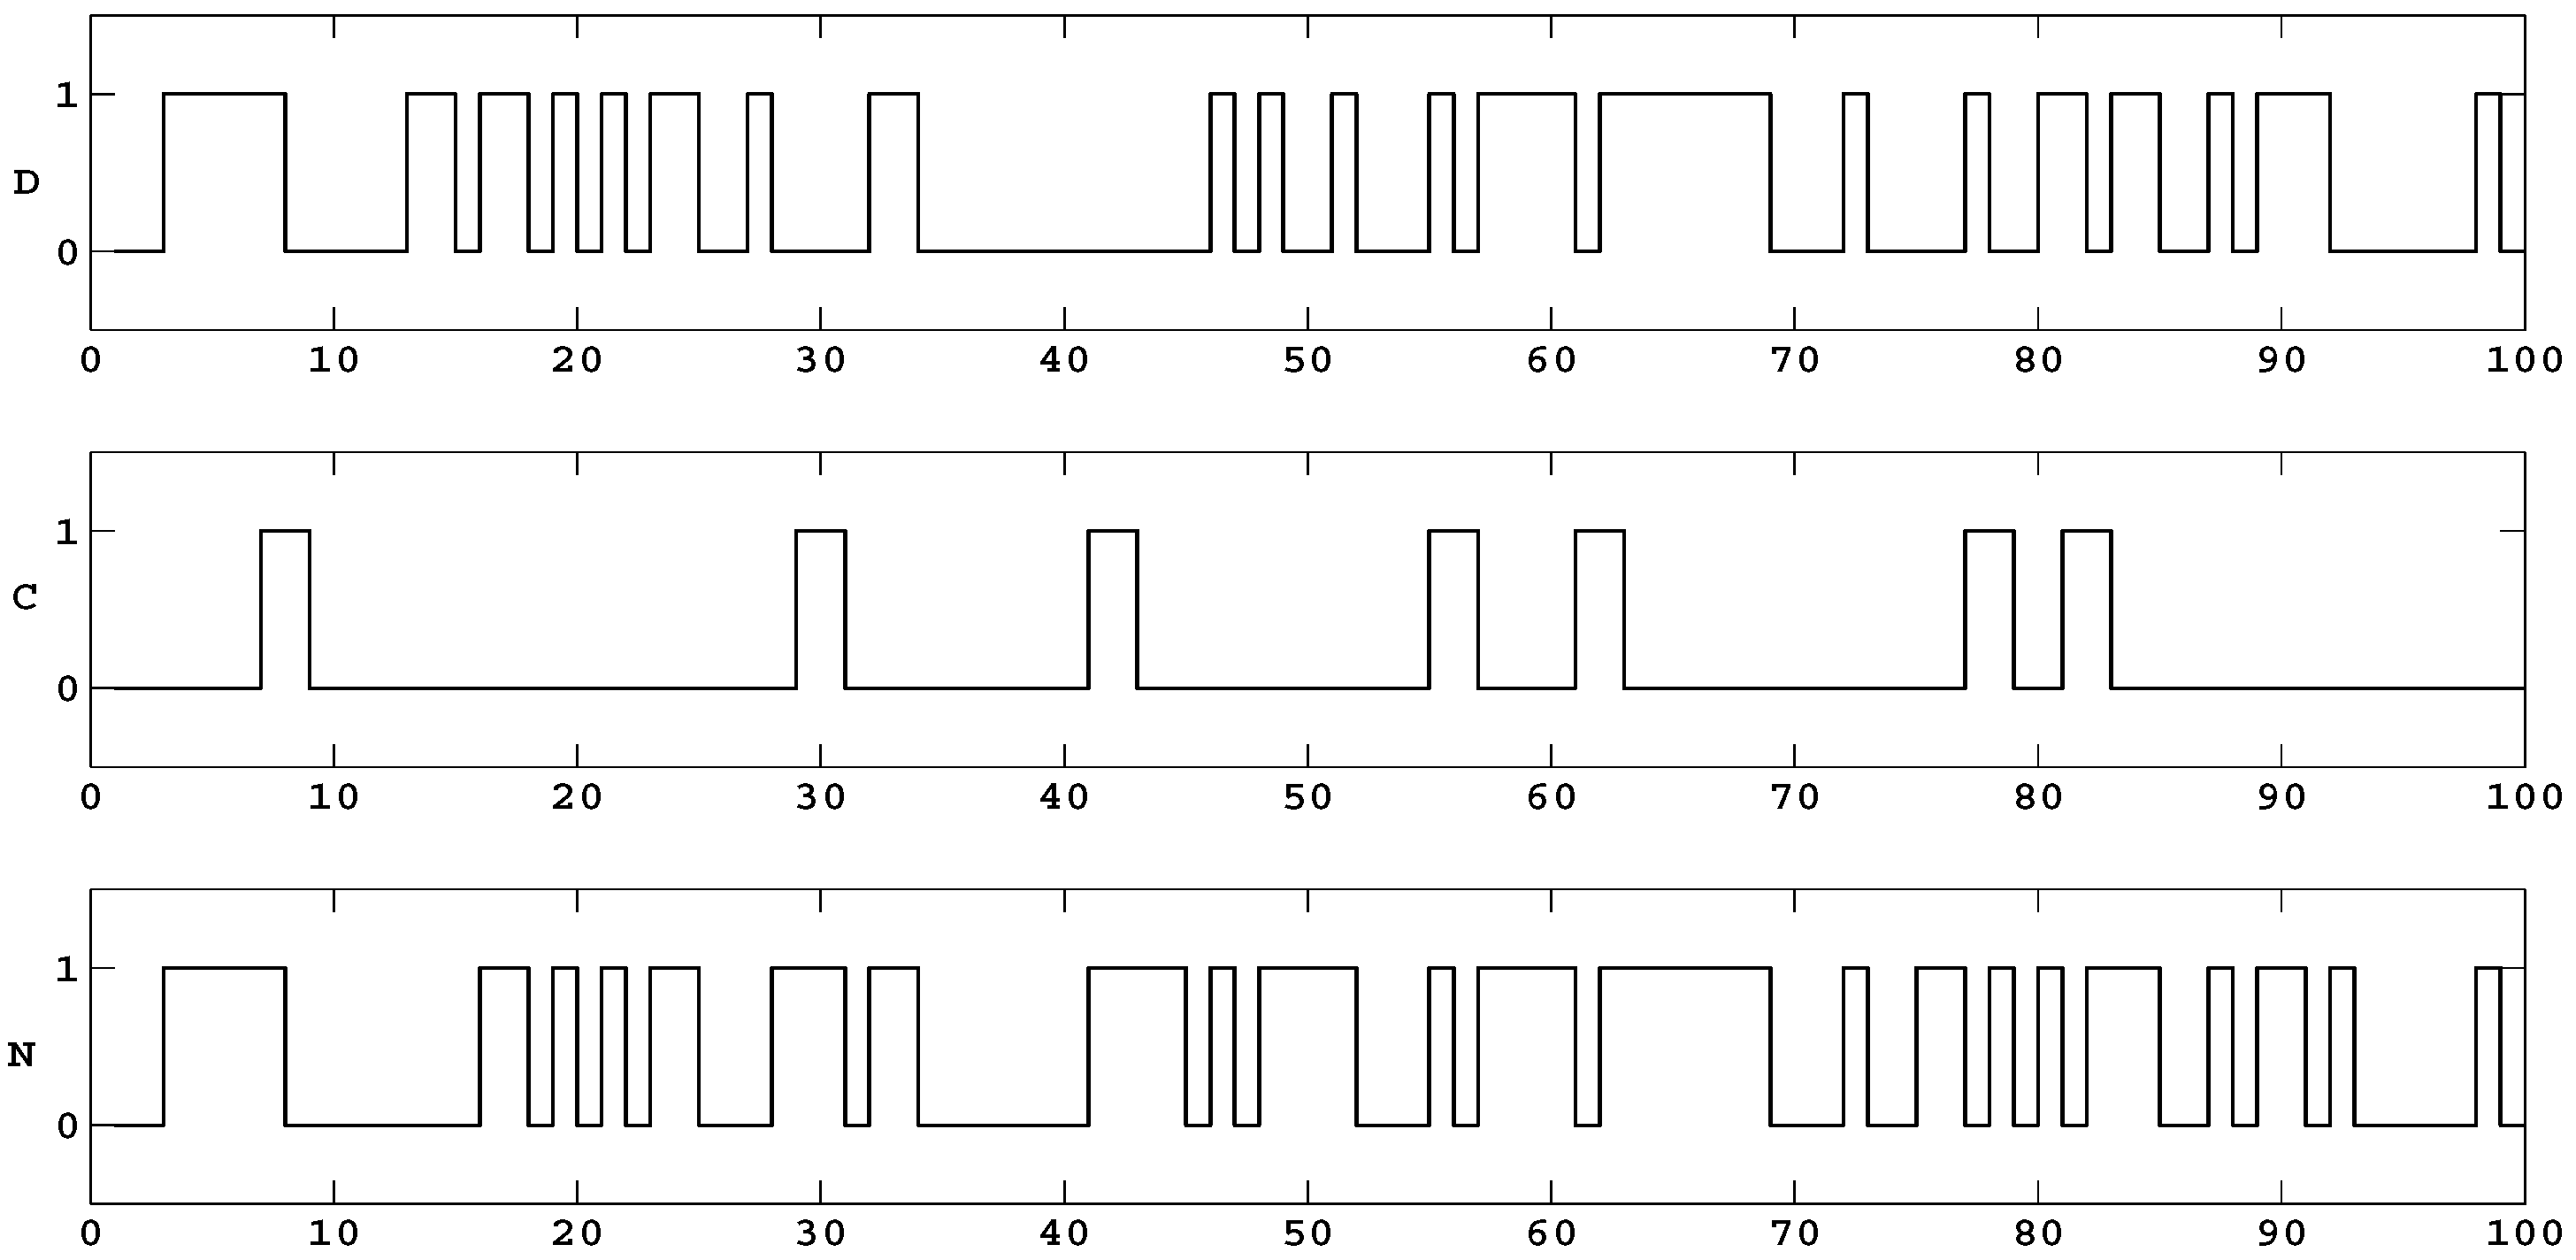
Figure 8 and Figure 9 show the bit sequences , and for the Chua (Matsumoto) system with a logistic map (, Figure 8) and the Lorenz system with a logistic map (, Figure 9). The sequences yielded and in Figure 8 and Figure 9, respectively. Figure 10 shows the result of using a logistic map for and 12-bit precision of . The value of should indicate chaotic dynamics. However, due to the small number of bits used, we obtained a non-chaotic (or regular) sequence . The regular sequence and chaotic sequence (Chua (Matsumoto) circuit) were XORed to yield a new chaotic sequence . The three sequences , and in Figure 10 are characterized by values of K of 0.0011, 0.9980 and 0.9950, respectively. Thus, Figure 10 illustrates the case when one of the two input sources are regular (non-chaotic sequence ), and yet, thanks to the XOR operation with another source sequence (with a relatively small number of precision bits), we obtain a strong chaotic sequence . Thus, the analog part of the mixing process (Chua circuit) assures us that the overall performance is firmly chaotic (), despite the fact that a regular sequence () is obtained from the discrete part (logistic map) of the process. Each of the three figures, Figure 8, Figure 9 and Figure 10, shows the first 100 bits in the respective sequences of 5000 bits in length.
4. The XORed Sequences and Their Quality
4.1. The Nine Sequences and Their Visual Quality
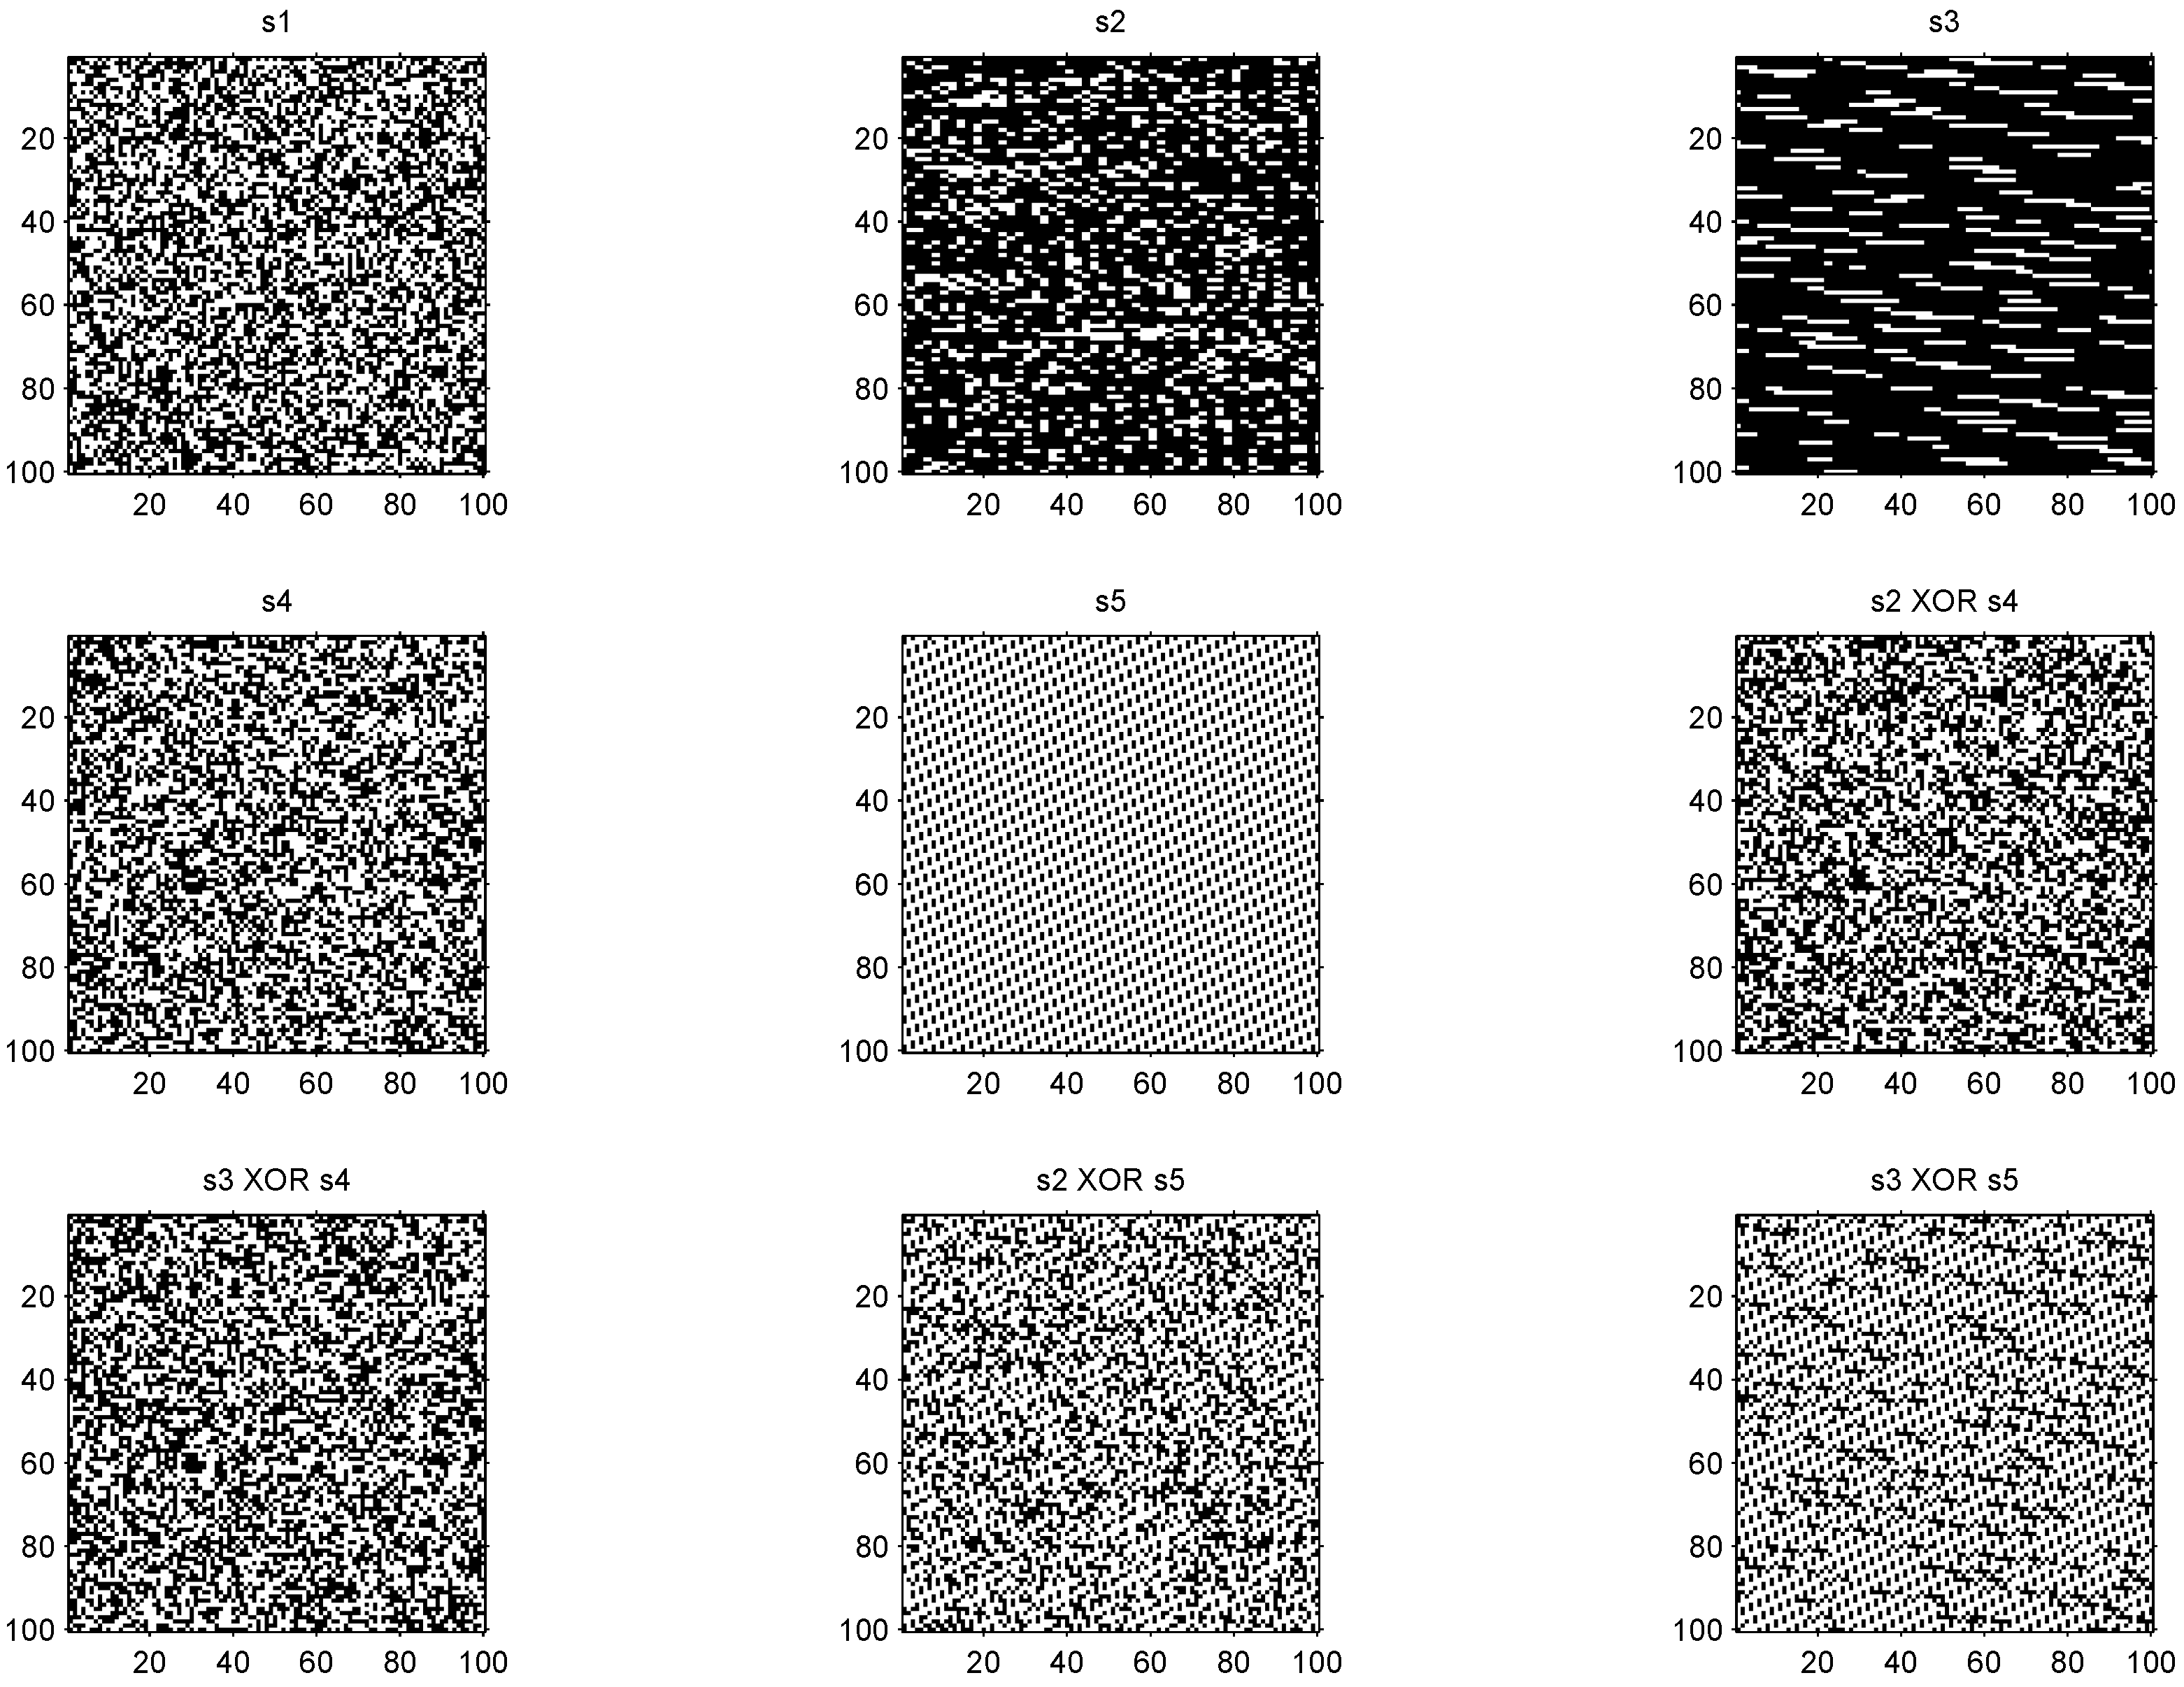
Various chaotic bit sequences were created either from a single-source (generator) or by using the XOR operation. We list these sequences in Table 1 and mark them as the sequences . As a reference sequence, , we selected a sequence obtained from a commercially available quantum generator QUANTIS manufactured by the Swiss firm ID Quantique as a source of the high-entropy signals [20]. We used the model USB-4M with the serial number . Sequence , as the one with excellent quality parameters, is a reference sequence to which we relate all other chaotic sequences obtained with the XOR operation.
Figure 11 shows examples of the scatter plots of –, each consisting of 10,000 bits stacked in rows of 100 bits. A visual and rather subjective observation of the nine sequences in Figure 11 indicates that the scatter plots of sequences ( XOR ) and ( XOR ) are very close to that of the ideal sequence . The scatter plot obtained from the logistic equation with 32 bit representation (sequence ) also seems to be of good quality, but the same logistic equation yielded a much worse scatter plot if only 10 bits were used (sequence ). The scatter plots of sequences and seem to be of low quality when compared to the scatter plot of . Sequences and and their scatter plots depend heavily on the threshold value of the threshold unit in Figure 1 and on the method of registering of chaotic bits and the frequency of the internal clock. Those parameters should be adjusted experimentally for various chaotic systems. The scatter plot of ( XOR ) confirms, at least visually, that the low quality sequence was improved after the XOR operation. The sequence was generated by the system in Figure 2. There is a danger of having a repeated, identical sequences , if the system uses the same initial seed value. Furthermore, having a finite number of bits available to represent initial condition (seed value), there is a danger of inserting the same seed value after many repeated cycles of using a single input logistic map based output. Such a generator will output sequences that have already been generated before. This and other related issues are discussed in [22].
4.2. The ent Test Results
The above visual observations of the scatter plots in Figure 11 were, to a large extent, confirmed by the results of the six ent tests [23] (see Appendix B), which are analyzed below. We used the ent tests because of a relatively short lengths of the analyzed bit sequences –. The results shown in Table 2 for sequences (Lorenz binary chaotic sequence) and (Chua binary chaotic sequence) indicate a relatively low entropy level, much lower than the desired value of around 8 (see the sequence s1 in Table 1). This was caused by the bias phenomenon—long intervals of the same bits. Thus, neither nor can be considered a random sequence with high levels of entropy, and the von Neumann correction [24] is certainly recommended for those individual sequences. The logistic chaotic bit sequence performed surprisingly well with a high entropy level (the length of data in is 32 bits; see Figure 1), and much poorer if the length was only 10 bits (sequence in Table 2). In order to secure a much wider diversity in creating chaotic sequences with excellent randomness features, we examined how the sequences obtained from our mixed-mode XORing operations performed in the six tests. The sequences and (obtained with the XOR operations) had very good test results, certainly comparable with the results for sequence . One may argue that there was no significant improvement in the test when considering and (or ) sequences. However, even in this case, by using the mixed-mode signals, we had the comfort of not having identical sequences that could be obtained when only a logistic map is used with the same initial seed values. Clearly, if we used the logistic map only with data of 10 bits (sequence ), then such a single-source generator would fail most of the tests, and would be of a low entropy level. XORing either with or with in our mixed-mode generator created sequences and , respectively. These sequences had better test results than alone: the entropy level was increased two-fold. The compression levels, values and MC percentages for and sequences were also improved when compared to the sequence. Our results of the MC test were at the desired 1–2% level for and . Such results are typically obtained with much longer sequences [25]. The results of the test for and are also much better than those of and (and even of ). As described in [25], the values of weakly random sequences are large, but are small for truly random sequences. This is clearly shown in Table 2. Those results are also confirmed by the lower compression levels for and , which are in the range of 1–2%, comparable with the compression level for . Furthermore, let us not forget that none of the sequences , , and underwent the von Neumann correction. Overall, these sequences have good characteristics of random sequences, often comparable with those obtained from the professional quantum random number generators, such as the one used in this paper to generate sequence .
5. Conclusions
At the present time, the methods of designing chaotic bit generators lack protection against problems involving finite lengths of bits in number representations, which may result in low entropy levels for the generated chaotic signals. Furthermore, the possibility of reusing of the same seed values (initial conditions) is not properly addressed [7,8,9]. To deal with those serious problems, we have proposed a technique of mixing for chaotic bit sequences that yields an increased level of chaotic quality (increased parameter K in the 0-1 test) and increased entropy levels. The improvement is due to mixing two independent chaotic inputs (continuous and discrete). The performed computational analysis confirmed the strong chaotic nature of the resulting output, as evidenced by the K values close to 1 and the irregularity of the shapes in the 0-1 test.
The monitoring system built to check the real-time performance of the mixed-mode generator (based on our XORing technique) can utilize a graphical result in the form of a 2D plot, supplemented by the easy to interpret number K from the 0-1 test. A decrease in K would indicate worsening of the quality of chaotic output and could indicate improper work of such a generator, due to a failure of electronic circuits generating the two input sequences. Another reason for decreasing the values of K could be unauthorized hardware modifications defined as hardware attacks or hardware Trojans [26]. They occur in the forms of parameter or circuit diagram changes, and have lately become a hot research topic [27,28,29,30]. Similarly, the interdisciplinary research topic (physics-electronics) of untrusted devices has become important in recent years, too [31].
Finally, the method presented in this paper can be applied to any chaotic signals, irregardless on whether or not they come from a system with one or many chaotic attractors [32,33]. One area of research worth examining is to check how the 0-1 test for chaos behaves when the number of chaotic attractors increases.
Author Contributions
Conceptualization, M.M. and W.M.; methodology, software and validation, M.M.; formal analysis, W.M.; investigation, resources, visualization and data curation, M.M.; original draft preparation, reviewing, editing and supervision W.M. All authors have read and agreed to the published version of the manuscript.
Funding
This research received no external funding.
Conflicts of Interest
The authors declare no conflict of interest.
Appendix A. The 0-1 Test (for Chaos)
The 0-1 test was developed by Gottwald and Melbourne [13,14,15]. Certain problems with using the 0-1 test for continuous dynamical systems have been reported in [16]. Here is a concise summary of the test.
The test results have two forms: a single real number , and a two-dimensional graph of variables [13]. When a chaotic sequence is fed into the test, the number K should be close to 1, whereas for regular sequences the number K should be close to 0. There are two methods of computation K: regression or correlation. For a time-series , , with the recommended value , the and are computed by
with and a randomly chosen real number . Then, the quantity , , called the mean square displacement of and , is computed as follows:
with the recommended value . If the regression method is applied, then the value, the asymptotic growth rate of the mean square displacement, is computed as follows:
For the correlation method, we create two vectors:
and the correlation coefficient is obtained as follows:
with the cov and var denoting their covariance and variance, respectively [13]. In both the regression and correlation methods, the above steps are repeated for values of c chosen randomly from the interval . It is recommended that . Computing the median of the values of yields the number K. All sequences tested in this paper by the 0-1 test had a length of 5000 real values.
Appendix B. The ent Test (for Random Signals)
The binary sequences used in this paper were tested by the ent software and its various tests for randomness [25]. A sequence of bits was first transformed by ent into ASCII characters. Then the sequence of ASCII characters underwent six independent tests, as follows.
- Entropy level test. For a sequence of ASCII characters, we obtain randomness if the entropy level is around the value of 8. The lower the entropy level, the more likely it is to have a non-random sequence of ASCII characters.
- Compression test. Random sequences should have their compression levels close to .
- (chi-square) test. Randomness is confirmed in this test if a sequence falls into the interval of to . As explained in [25], such an interval is achieved primarily in cases of radioactive isotope decay. Furthermore, the chi-square distribution is calculated for the stream of bytes in the sequence and expressed as two values (see Table 2): an absolute number and a percentage which indicates how frequently a truly random sequence should exceed the calculated value. For example, for sequence , the distribution is , and randomly should exceed this value of the time.
- Arithmetic mean value (AMV) test with the output value close to for random sequences. In this test all input bytes are summed up and divided by the total number of bytes.
- The Monte-Carlo (MC ) test indicating a random sequence if the result is a single percentage digit. For very long input streams this value will be close to 0, meaning an accurate approximation of .
- The serial correlation coefficient (SCC) test yielding the number close to for random sequences. This test checks the dependence of each byte on the previous one. If there is no dependence between bytes, then the SCC value is close to .
More details of the tests can be found in [25].
References
- Kanaso, A.; Smaoui, N. Logistic chaotic for binary numbers generations. Chaos Solitions Fractals 2009, 40, 2557–2568. [Google Scholar] [CrossRef]
- Yalcin, M.E.; Suykens, J.A.K.; Vandewalle, J. True random bit generation from a double-scroll attractor. IEEE Trans. Circuits Syst. I Regul. Pap. 2004, 51, 1394–1404. [Google Scholar] [CrossRef]
- Posadas-Castillo, C.; Cruz-Hernandez, C.; Lopez-Gutierrez, R.M. Experimental realization of synchronization in complex networks with Chua’s circuits like nodes. Chaos Solitons Fractals 2009, 40, 1963–1975. [Google Scholar] [CrossRef]
- Wu, X.; Chen, G.; Cai, J. Chaos synchronization of the master-slave generalized Lorenz systems via linear state error feedback control. Physica D 2007, 229, 52–80. [Google Scholar] [CrossRef] [Green Version]
- Yang, J.; Zhu, F. Synchronization for chaotic systems and chaos-based secure communications via both reduced-order and step-by-step sliding mode observers. Commun. Nonl. Sci. Numer. Simul. 2013, 18, 926–937. [Google Scholar] [CrossRef]
- Cuomo, K.M.; Oppenheim, A.V.; Strogatz, S.H. Synchronization of Lorenz-based chaotic circuits with applications to communications. IEEE Trans. Circuits Syst. II Analog Digit. Signal Process. 1993, 40, 626–633. [Google Scholar] [CrossRef] [Green Version]
- Persohn, K.J.; Povinelli, R.J. Analyzing logistic map pseudorandom number generators for periodicity inducted by finite precision floating-point representation. Chaos Solitions Fractals 2012, 45, 238–244. [Google Scholar] [CrossRef]
- Alvarez, G.; Li, S. Breaking an encrypted scheme based on chaotic baker map. Phys. Lett. A 2006, 352, 78–82. [Google Scholar] [CrossRef] [Green Version]
- Özkaynaka, F.; Yavuzb, S. Security problems for a pseudorandom sequence generator based on the Chen chaotic system. Comput. Phys. Commer. 2013, 184, 2178–2181. [Google Scholar] [CrossRef]
- Handkiewicz, A.; Katarzynski, P.; Szczesny, S.; Naumowicz, M.; Melosik, M.; Sniatala, P.; Kropidłowski, M. Design automation of a lossless multiport network and its application to image filtering. Expert Syst. Appl. 2014, 41, 2211–2221. [Google Scholar] [CrossRef]
- Handkiewicz, A.; Szczesny, S.; Naumowicz, M.; Katarzynski, P.; Melosik, M.; Sniatala, P.; Kropidłowski, M. SI-Studio, a layout generator of current mode circuits. Expert Syst. Appl. 2015, 42, 3205–3218. [Google Scholar] [CrossRef]
- Jiang, C.; Wu, S. A valid algorithm of converting chaos sequences to uniformity pseudo-random ones. In Proceedings of the International Symposium on Information Engineering and Electronic Commerce (IEEC-2009), Ternopil, Ukraine, 16–17 May 2009; pp. 295–298. [Google Scholar]
- Gottwald, G.A.; Melbourne, I. A new test for chaos in deterministic systems. Proc. R. Soc. Lond. 2003, 460, 603–611. [Google Scholar] [CrossRef] [Green Version]
- Gottwald, G.A.; Melbourne, I. Testing for chaos in deterministic systems with noise. Physica D 2005, 212, 100–110. [Google Scholar] [CrossRef] [Green Version]
- Gottwald, G.A.; Melbourne, I. On the implementation of the 0–1 test for chaos. SIAM J. Appl. Dyn. Syst. 2009, 8, 129–145. [Google Scholar] [CrossRef]
- Melosik, M.; Marszalek, W. On the 0-1 test for chaos in continuous systems. Bull. Pol. Acad. Sci. Tech. Sci. 2016, 64, 521–528. [Google Scholar] [CrossRef] [Green Version]
- Walczak, M.; Marszalek, W.; Sadecki, J. Using the 0-1 test for chaos in nonlinear continuous systems with two varying parameters: Parallel computations. IEEE Access 2019, 7, 154375–154385. [Google Scholar] [CrossRef]
- Marszalek, W.; Walczak, M.; Sadecki, J. Testing deterministic chaos: Incorrect results of the 0-1 test and how to avoid them. IEEE Access 2019, 7, 183245–183251. [Google Scholar] [CrossRef]
- Matsumoto, T.; Chua, L.O.; Komuro, M. The double scroll. IEEE Trans. Circuits Syst. 1985, 32, 798–818. [Google Scholar] [CrossRef]
- ID Quantique SA, White Paper Version 3.0. Random Number Generation Using Quantum Physics. 2019. Available online: http://www.idquantique.com (accessed on 12 December 2021).
- IDQ Random Numbers. 2019. Available online: https://www.idquantique.com/random-number-generation/overview/ (accessed on 12 December 2021).
- Melosik, W.; Marszalek, W. Trojan attack on the initialization of pseudo-random bit generators using synchronization of chaotic input sources. IEEE Access 2021, 9, 161846–161853. [Google Scholar] [CrossRef]
- Yu, W.K.; Li, S.; Yao, X.R.; Liu, X.F.; Wu, L.A.; Zhai, G.J. A protocol based on compressed sensing for high-speed authentication and cryptographic key distribution over a multiparty optical network. Appl. Opt. 2013, 52, 7882–7888. [Google Scholar] [CrossRef] [Green Version]
- von Neumann, J. Various techniques used in connection with random digits. Appl. Math. Ser. 1951, 12, 36–38. [Google Scholar]
- Walker, J. ENT A Psudorandom Number Sequence Test Program. 2019. Available online: http://www.fourmilab.ch/random/ (accessed on 12 December 2021).
- Tehranipoor, M.; Wang, C. (Eds.) Introduction to Hardware Security and Trust; Springer: New York, NY, USA, 2012. [Google Scholar]
- Marszalek, W.; Trzaska, Z. Mixed-mode oscillations in a modified Chua’s circuit. Circuits Syst. Signal Process. 2010, 29, 1075–1087. [Google Scholar] [CrossRef]
- Marszalek, W. Circuits with oscillatory hierarchical Farey sequences and fractal properties. Circuits Syst. Signal Process. 2012, 31, 1279–1296. [Google Scholar] [CrossRef]
- Marszalek, W.; Trzaska, Z. Memristive circuits with steady-state mixed-mode oscillations. Electr. Lett. 2014, 50, 1275–1277. [Google Scholar] [CrossRef]
- Melosik, M.; Marszalek, W. Using the 0-1 test for chaos to detect hardware trojans in chaotic bit generators. Electr. Lett. 2016, 52, 919–920. [Google Scholar] [CrossRef]
- Colbeck, R.; Kent, A. Private randomness expansion with untrusted devices. J. Phys. A Math. Theor. 2011, 44, 095305. [Google Scholar] [CrossRef]
- Lai, Q.; Kuate, P.D.K.; Liu, F.; Iu, H.H.-C. An extremely simple chaotic system with infinitely many coexisting attractors. IEEE Trans. Circuits Syst. II Express Briefs 2020, 67, 1129–1133. [Google Scholar] [CrossRef]
- Lai, Q.; Wan, Z.; Kengne, L.K.; Kuate, P.D.K.; Chen, C. Two-memristor-based chaotic system with infinite coexisting attractors. IEEE Trans. Circuits Syst. II Express Briefs 2021, 68, 2197–2201. [Google Scholar] [CrossRef]
Figure 1.
Schematic diagram of the XORing process of two mixed-mode signals.

Figure 2.
Digital fixed-point implementation of the logistic map.

Figure 3.
The 0-1 test results. Variables for: (a) logistic map only with yielded , (b) sequence of 7th bits from logistic map with yielded , (c) logistic map only with yielded and (d) sequence of 7th bits from logistic map with yielded .
Figure 3.
The 0-1 test results. Variables for: (a) logistic map only with yielded , (b) sequence of 7th bits from logistic map with yielded , (c) logistic map only with yielded and (d) sequence of 7th bits from logistic map with yielded .

Figure 4.
The 0-1 test results. Variables for: (a) a sequence of 7th bits of logistic map with XORed with chaotic bits of the Chua (Matsumoto) circuit yield ; (b) as in part (a) but for , resulting in .
Figure 4.
The 0-1 test results. Variables for: (a) a sequence of 7th bits of logistic map with XORed with chaotic bits of the Chua (Matsumoto) circuit yield ; (b) as in part (a) but for , resulting in .

Figure 5.
The 0-1 test results (K values) for various numbers of bits between 8 and 32 (horizontal axis): (a) sequence of 7th bits from the logistic map only with , (b) same as in part (a) but the sequence of 7th bits from the logistic map was XORed with the bits resulting from the continuous Chua (Matsumoto) circuit.

Figure 6.
The 0-1 test results. Variables without (a) and with (b) the XOR operation with the chaotic bits from the Chua (Matsumoto) circuit. The logistic map with used in (a,b) for a sequence of 7th bits with numbers of length 18 bits. The in (a) and in (b).
Figure 6.
The 0-1 test results. Variables without (a) and with (b) the XOR operation with the chaotic bits from the Chua (Matsumoto) circuit. The logistic map with used in (a,b) for a sequence of 7th bits with numbers of length 18 bits. The in (a) and in (b).

Figure 7.
The 0-1 test results: (a) K values for various numbers of bits of (see Figure 2) between 8 and 32 (horizontal axis) and the sequence of 7th bits from a logistic map with ; (b) variables for a sequence of 7th bits when the total length of each number is 21 bits. (see Figure 6a for number of bits = 21).

Figure 8.
Sequences , and obtained from the Chua (Matsumoto) system and logistic map with . The first 100 bits are shown from each sequence of 5000 bits.
Figure 8.
Sequences , and obtained from the Chua (Matsumoto) system and logistic map with . The first 100 bits are shown from each sequence of 5000 bits.

Figure 9.
Sequences , and obtained from the Lorenz system and logistic map with . The first 100 bits are shown from each sequence of 5000 bits.
Figure 9.
Sequences , and obtained from the Lorenz system and logistic map with . The first 100 bits are shown from each sequence of 5000 bits.

Figure 10.
Sequences , and obtained from the Chua (Matsumoto) circuit and logistic map with and a relatively small number of precision bits resulting in a nonchaotic sequence . The first 100 bits are shown from each sequence of 5000 bits.
Figure 10.
Sequences , and obtained from the Chua (Matsumoto) circuit and logistic map with and a relatively small number of precision bits resulting in a nonchaotic sequence . The first 100 bits are shown from each sequence of 5000 bits.

Figure 11.
Scatter plots of sequences –, each with bits.


Table 1.
Sources of bit sequences used in this paper.
| Sequence | Source |
|---|---|
| s1 | QUANTIS (reference sequence of high entropy) [20,21] |
| s2 | chaotic bits from Lorenz system |
| s3 | chaotic bits from Chua circuit |
| s4 | chaotic bits from logistic eqn. (32 bits , see Figure 2) |
| s5 | chaotic bits from logistic eqn. (10 bits , see Figure 2) |
| s6 | sequence s2 XOR sequence s4 |
| s7 | sequence s3 XOR sequence s4 |
| s8 | sequence s2 XOR sequence s5 |
| s9 | sequence s3 XOR sequence s5 |
Table 2.
Results of the six ent tests performed on sequences s1–s9.
| sn | Entropy | Comp. % | Value; % | AMV | MC % | SCC |
|---|---|---|---|---|---|---|
| s1 | 7.869559 | 1 | 213.91; 95 | 127.4415 | 1.07 | 0.005292 |
| s2 | 3.884870 | 51 | 36,200.14; 0.01 | 62.4149 | 21.87 | 0.119915 |
| s3 | 1.829749 | 77 | 162,993.87; 0.01 | 39.1188 | 27.32 | 0.111901 |
| s4 | 7.850575 | 1 | 263.07; 50 | 131.5946 | 4.81 | 0.051919 |
| s5 | 2.845031 | 64 | 44,492.49; 0.01 | 181.7886 | 44.22 | 0.037565 |
| s6 | 7.851689 | 1 | 251.59; 50 | 129.7392 | 2.06 | 0.013551 |
| s7 | 7.837249 | 2 | 270.84; 25 | 131.6376 | 2.67 | 0.043232 |
| s8 | 6.266494 | 21 | 5044.32; 0.01 | 155.7672 | 16.14 | 0.102282 |
| s9 | 4.512645 | 43 | 22,535.47; 0.01 | 166.5360 | 32.67 | 0.073107 |
Publisher’s Note: MDPI stays neutral with regard to jurisdictional claims in published maps and institutional affiliations. |
© 2022 by the authors. Licensee MDPI, Basel, Switzerland. This article is an open access article distributed under the terms and conditions of the Creative Commons Attribution (CC BY) license (https://creativecommons.org/licenses/by/4.0/).
Share and Cite
MDPI and ACS Style
Melosik, M.; Marszalek, W. Strengthening Quality of Chaotic Bit Sequences. Electronics 2022, 11, 272. https://doi.org/10.3390/electronics11020272
AMA Style
Melosik M, Marszalek W. Strengthening Quality of Chaotic Bit Sequences. Electronics. 2022; 11(2):272. https://doi.org/10.3390/electronics11020272
Chicago/Turabian StyleMelosik, Michal, and Wieslaw Marszalek. 2022. "Strengthening Quality of Chaotic Bit Sequences" Electronics 11, no. 2: 272. https://doi.org/10.3390/electronics11020272
Note that from the first issue of 2016, this journal uses article numbers instead of page numbers. See further details here.