Article

Performance Evaluation of Message Routing Strategies in the Internet of Robotic Things Using the D/M/c/K/FCFS Queuing Network

1
Programa de Pós-Graduação em Ciência da Computação, Campus Universitário Ministro Petrônio Portella, Universidade Federal do Piauí (UFPI), Ininga, Teresina-Piauí 64049-550, Brazil
2
Konkuk Aerospace Design-Airworthiness Research Institute (KADA), Konkuk University, Seoul 05029, Korea
3
Department of Aerospace Information Engineering, Konkuk University, Seoul 05029, Korea
*
Author to whom correspondence should be addressed.
Electronics 2021, 10(21), 2626; https://doi.org/10.3390/electronics10212626
Submission received: 3 October 2021 / Revised: 25 October 2021 / Accepted: 25 October 2021 / Published: 27 October 2021

Abstract

:
The Internet of Robotic Things (IoRT) has emerged as a promising computing paradigm integrating the cloud/fog/edge computing continuum in the Internet of Things (IoT) to optimize the operations of intelligent robotic agents in factories. A single robot agent at the edge of the network can comprise hundreds of sensors and actuators; thus, the tasks performed by multiple agents can be computationally expensive, which are often possible by offloading the computing tasks to the distant computing resources in the cloud or fog computing layers. In this context, it is of paramount importance to assimilate the performance impact of different system components and parameters in an IoRT infrastructure to provide IoRT system designers with tools to assess the performance of their manufacturing projects at different stages of development. Therefore, we propose in this article a performance evaluation methodology based on the D/M/c/K/FCFS queuing network pattern and present a queuing-network-based performance model for the performance assessment of compatible IoRT systems associated with the edge, fog, and cloud computing paradigms. To find the factors that expose the highest impact on the system performance in practical scenarios, a sensitivity analysis using the Design of Experiments (DoE) was performed on the proposed performance model. On the outputs obtained by the DoE, comprehensive performance analyses were conducted to assimilate the impact of different routing strategies and the variation in the capacity of the system components. The analysis results indicated that the proposed model enables the evaluation of how different configurations of the components of the IoRT architecture impact the system performance through different performance metrics of interest including the (i) mean response time, (ii) utilization of components, (iii) number of messages, and (iv) drop rate. This study can help improve the operation and management of IoRT infrastructures associated with the cloud/fog/edge computing continuum in practice.

1. Introduction

The Internet of Robotic Things (IoRT) is an emerging computing paradigm for robotic systems in factories, which is expected to revolutionize the whole manufacturing industry [1,2]. In particular, the IoRT adopts the advanced computing capabilities and features of the fog and cloud computing paradigms, such as (i) virtualization technologies, (ii) layered services, and (iii) the agile provisioning capabilities of local/remote computing resources, while integrating into the Internet of Things (IoT) infrastructure associated with its enabling technologies (e.g., sensors and actuators embedded in smart devices) to make the design and implementation of new applications more flexible for the robotic manufacturing systems [3]. The IoRT is also considered as the evolution of cloud robotics [4], by integrating the IoT to leverage and expand the use of robots in industry. Indeed, big tech enterprises have poured huge investments into the technological revolution of both robotics and the IoT. According to Gartner’s report, 20 billion devices would be affected by the IoT by 2020, and the IoT business would reach USD 300 billion. The IoT is considered one of the top five trends in recent years [5].

1.1. IoRT Performance Evaluation

However, one of the challenges of the IoRT is to allow the offloading of computationally intensive tasks from IoT devices embedded in robots to the outer fog/cloud systems. In turn, the decision about offloading requires a rigorous and unified architecture that can handle complex issues. In particular, a single robot can comprise hundreds of sensors and actuators. The robots require a high degree of communication and processing to perform or even simulate tasks. Meanwhile, real-time constraints are often required to complete the tasks in these scenarios. For the betterment of the performance in operations and management, the IoRT systems should perform different tasks, considering the limitation of available computing resources and the predictability of congestion or failures. Given that these resources are distributed across individual robots or the robots that collaborate in a network, from geographically local or distant data centers, i.e., the fog and cloud, it is apparently a challenging problem to (i) allocate adequate resources and (ii) configure the capacity of specific resources to perform tasks with a desired mean response time. Therefore, there is a critical need to develop a performance evaluation methodology and models to assimilate the performance and impact of system components/parameters on the performance of such intense and busy data transactions in IoRT infrastructures for autonomous factories.

1.2. Literature Review

Previous studies have contributed great progress to the introduction and adoption of the IoRT along with its computing infrastructures in various applications, which indicates the potentials of IoRT infrastructures in Industry 4.0. Andò et al. presented the first attempt at pattern authoring in the IoRT context, specifically for ambient assisted living scenarios in [6]. The authors pointed out the significance of adopting the cloud-based IoT framework for robotic systems and, thus, the necessity of identifying and defining patterns due to the presence of humans along with their interactions with robots. Reference [7] demonstrated the use of IoT devices to help control a YuMi® robot and collect sensor data through a TCP/IP connection. The work presented a practical example of the IoRT in which a robot can be controlled and all IoT devices and sensors can be accessed to collect data through an Internet connection. On the other hand, Reference [8] proposed an IoT-aided robotics platform equipped with an augmented online approach that helps identify kidnapping events in an indoor mobile robotic operation. The works [2,9] presented comprehensive reviews on the recent developments and adoption trends of the IoRT in various smart and critical domains such as in the Internet of Medical Things (IoMT), manufacturing, surveillance, and so on, in which the integration of the IoT and robotic agents is the backbone for the development of new-generation devices in Industry 4.0. In particular, in the work [10], Ghazal et al. proposed an edge/fog/cloud architecture for the detection of thermal anomalies in aluminum factories, in which mobile IoT edge nodes were carried on autonomous robots, companion drones were involved as fog nodes, and a cloud backend was used for advanced artificial-intelligence-based analyses of thermal anomalies. The previous studies signify the need for the integration of the cloud/fog/edge IoT architecture and robotic systems to harmonize and strengthen the operations and data communication among robot agents in a complete robotic infrastructure to bring about a high level of productivity and applicability in both industrial and academic domains. Although many works demonstrated different applications of the IoRT in practice, few previous studies in the literature have addressed the challenging problems related to performance and the impact of system components/parameters on the performance indices of the cloud/fog/edge computing backbone in IoRT infrastructures. A reference multilayer architectural model for the IoRT was proposed in [3] and analyzed in [11]. Models for the perception and control of robots in physical space and their applications were proposed in [12,13,14,15]. However, few studies explored the adoption of queuing networks for IoRT modeling and planning. Queuing models have been applied to the IoRT successfully for memory management accessed by sensors and actuators [16] and delivery services operated by robots [17]. However, such models based on queuing theory nor the models above considered the IoRT computing architecture as a whole. In other words, existing works do not address congestion management between layers and load balancing issues.

1.3. Our Approach

In this work, we propose a queuing network model to assimilate the performance of a computing infrastructure for the IoRT. Queue models offer a theoretical and experimental framework for performance analysis and planning of computer systems [
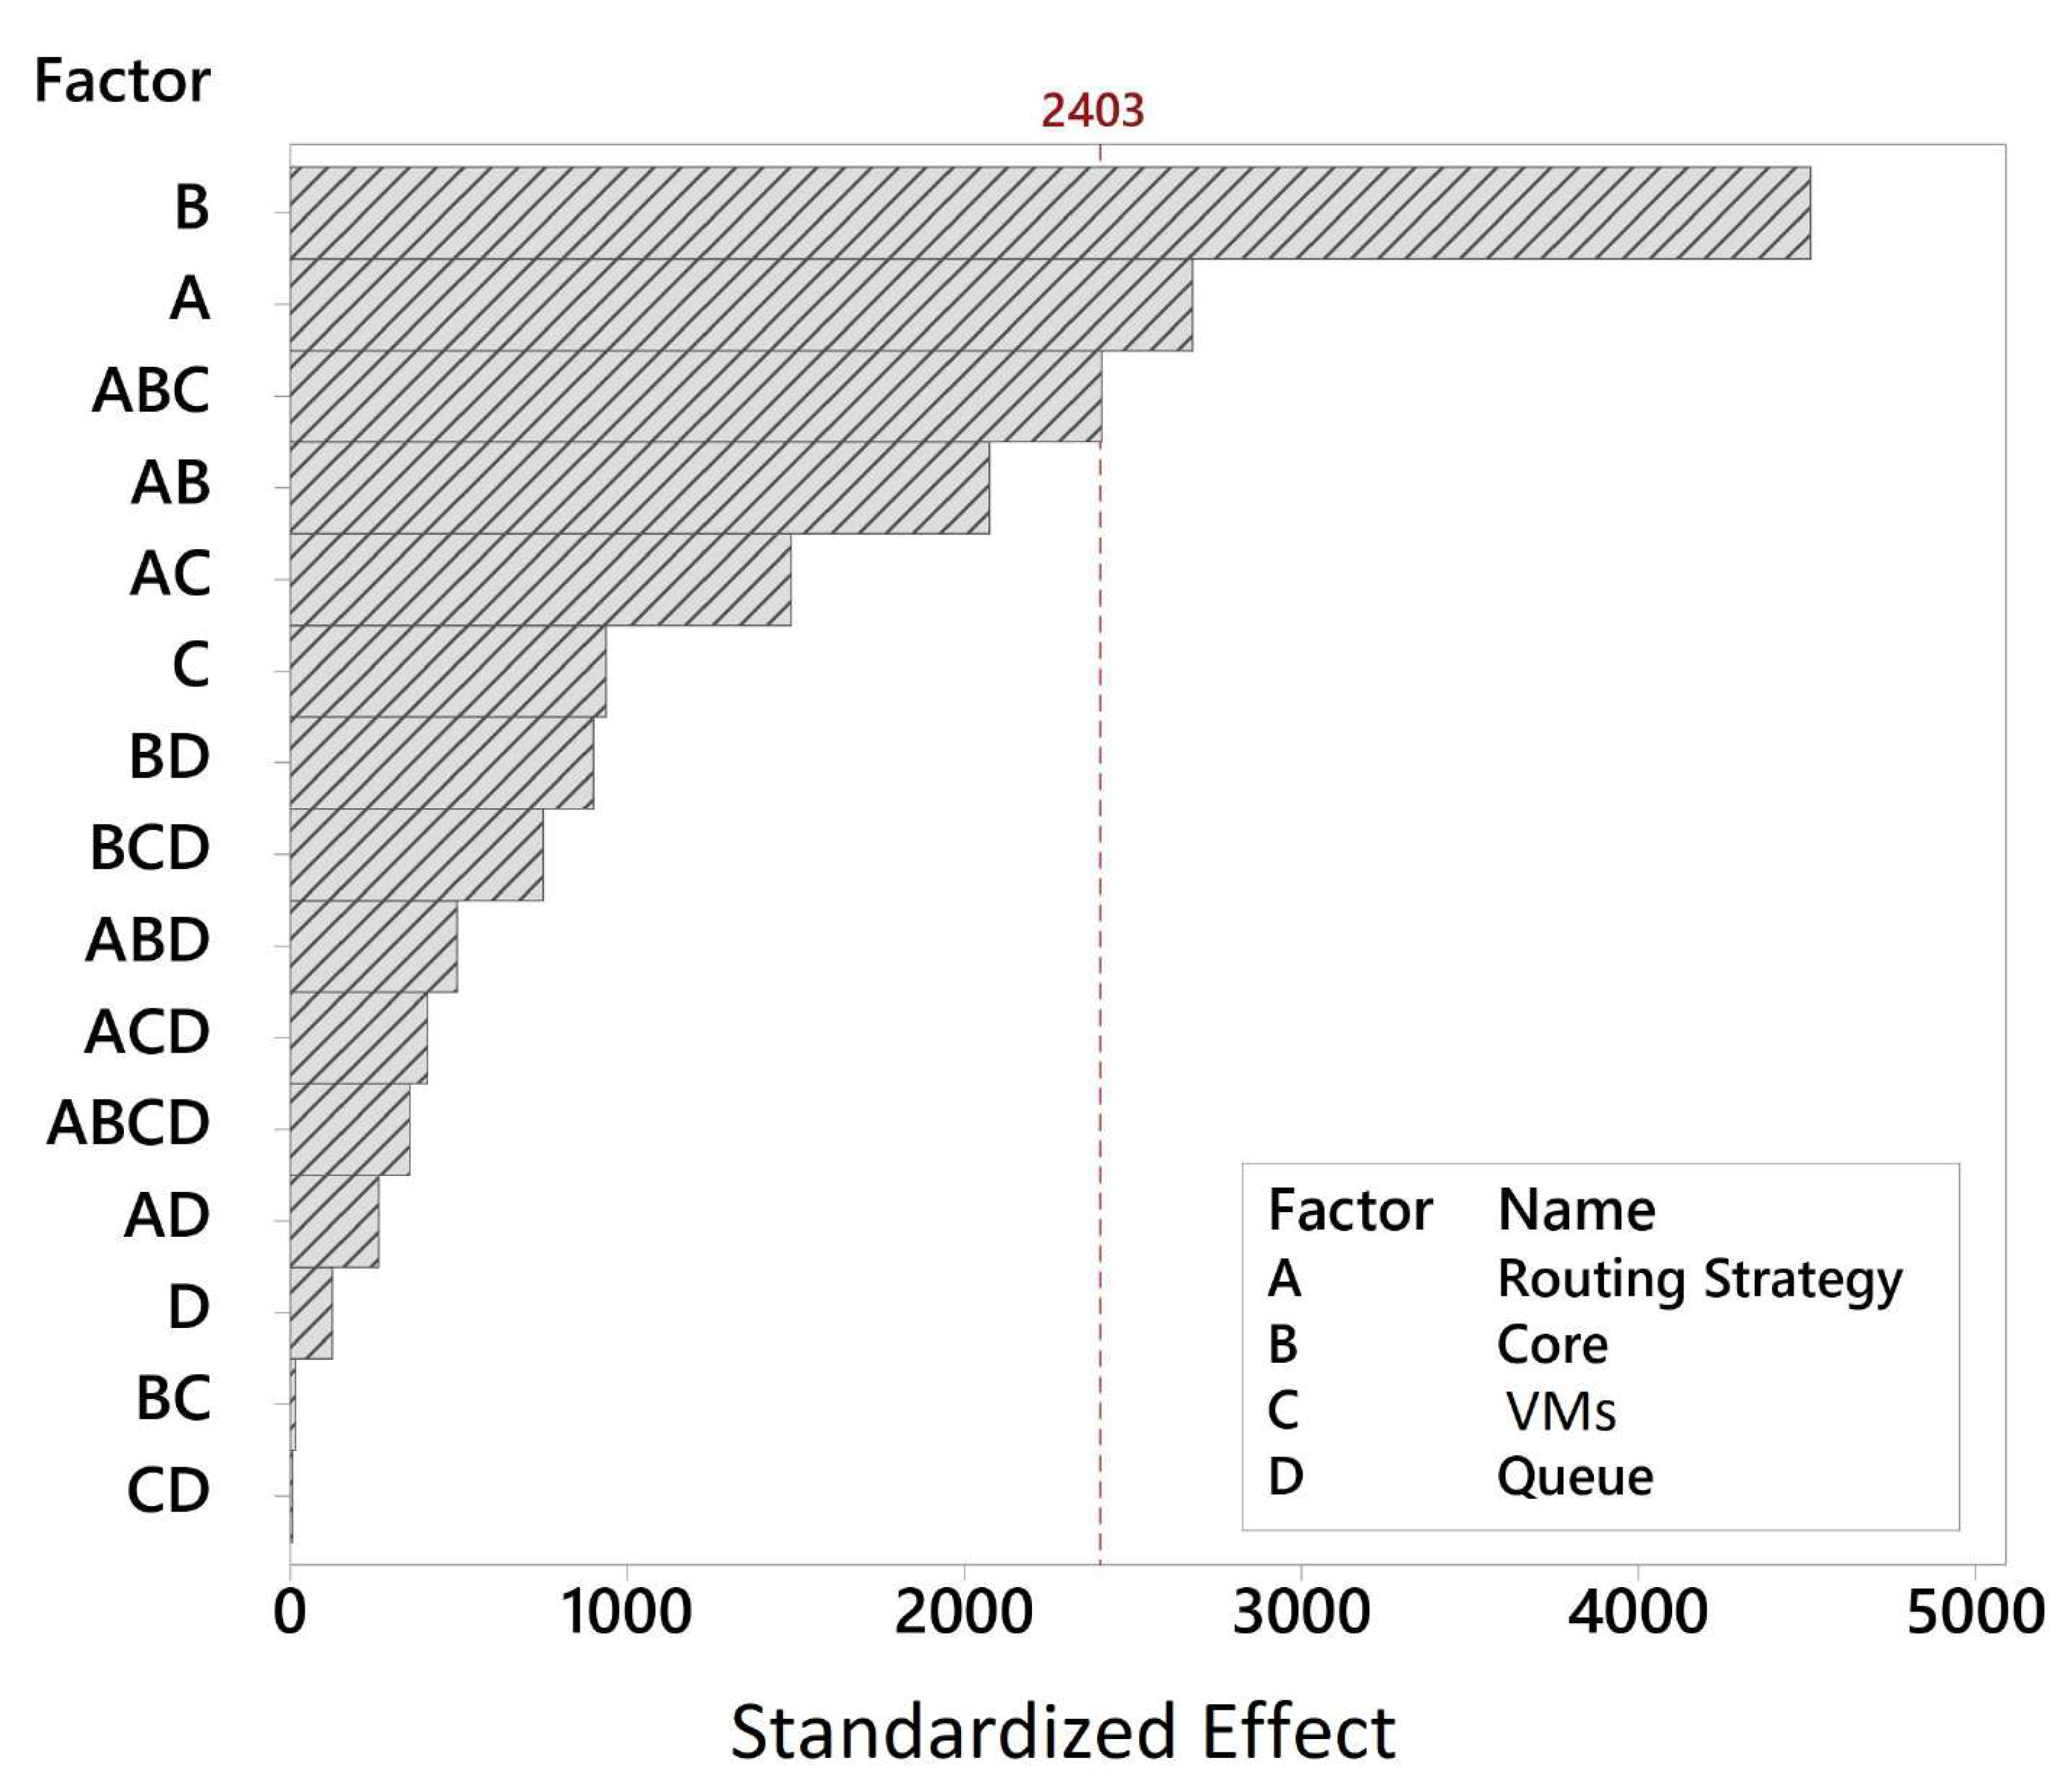
18]. The proposed model considers the processing and transmission of data generated by robots in a multilayer computing architecture. This model enables exploring the impact of architectural configuration alteration, considering the computing capacity of the layers: edge, fog, or cloud. Simulations were performed with two classic load balancing algorithms including round-robin (even distribution) and weighted round-robin strategies for the multilayer IoRT computing infrastructure. Critical performance metrics related to the quality of service were evaluated, specifically the (i) mean response time, (ii) utilization of computing layers, (iii) number of messages, and (iv) rate of dropped tasks. This study extends current progress in previous works by performing a comprehensive sensitivity analysis based on the Design of Experiments (DoE) to find the factors that expose the highest impact on the system performance, then adopting the obtained values of these factors in the performance model in different practical scenarios for performance evaluation. From the knowledge of the impact factors discovered in the DoE, we evaluated the performance impact of different load balancing algorithms and the variation in the capacity of several system components and parameters.

1.4. Contributions

To the best of our knowledge, this work presents an extension of the current progress in the performance evaluation of IoRT infrastructure by the following key contributions:
  • The proposed performance evaluation methodology and model based on queuing theory, which allow IoRT system designers to analyze the impact of architecture component configurations on the performance of a system before its implementation. The model is highly capable of being adjusted by the alteration of different system parameters such as transmission time, service time, queue size, resource capacity, and routing strategies;
  • The performed sensitivity analyses adopting the DoE to empirically identify the most impactful factors on system performance regarding various system components in different computing layers of the IoRT infrastructure under consideration;
  • The conducted comprehensive performance evaluation to assimilate the most critical factors to enhance the system performance, such as load balancing algorithms, along with different computing cores per node.

1.5. Research Remarks

The following findings were obtained through the analysis results:
  • The number of computing cores of VMs in fog nodes is exposed as the most decisive factor for the system efficiency of the IoRT infrastructure adopting edge/fog/cloud computing continuum. This means that the processing power of the machines in the fog/cloud computing layers is a critical factor to enhance the overall system performance of the IoRT computing infrastructure under consideration;
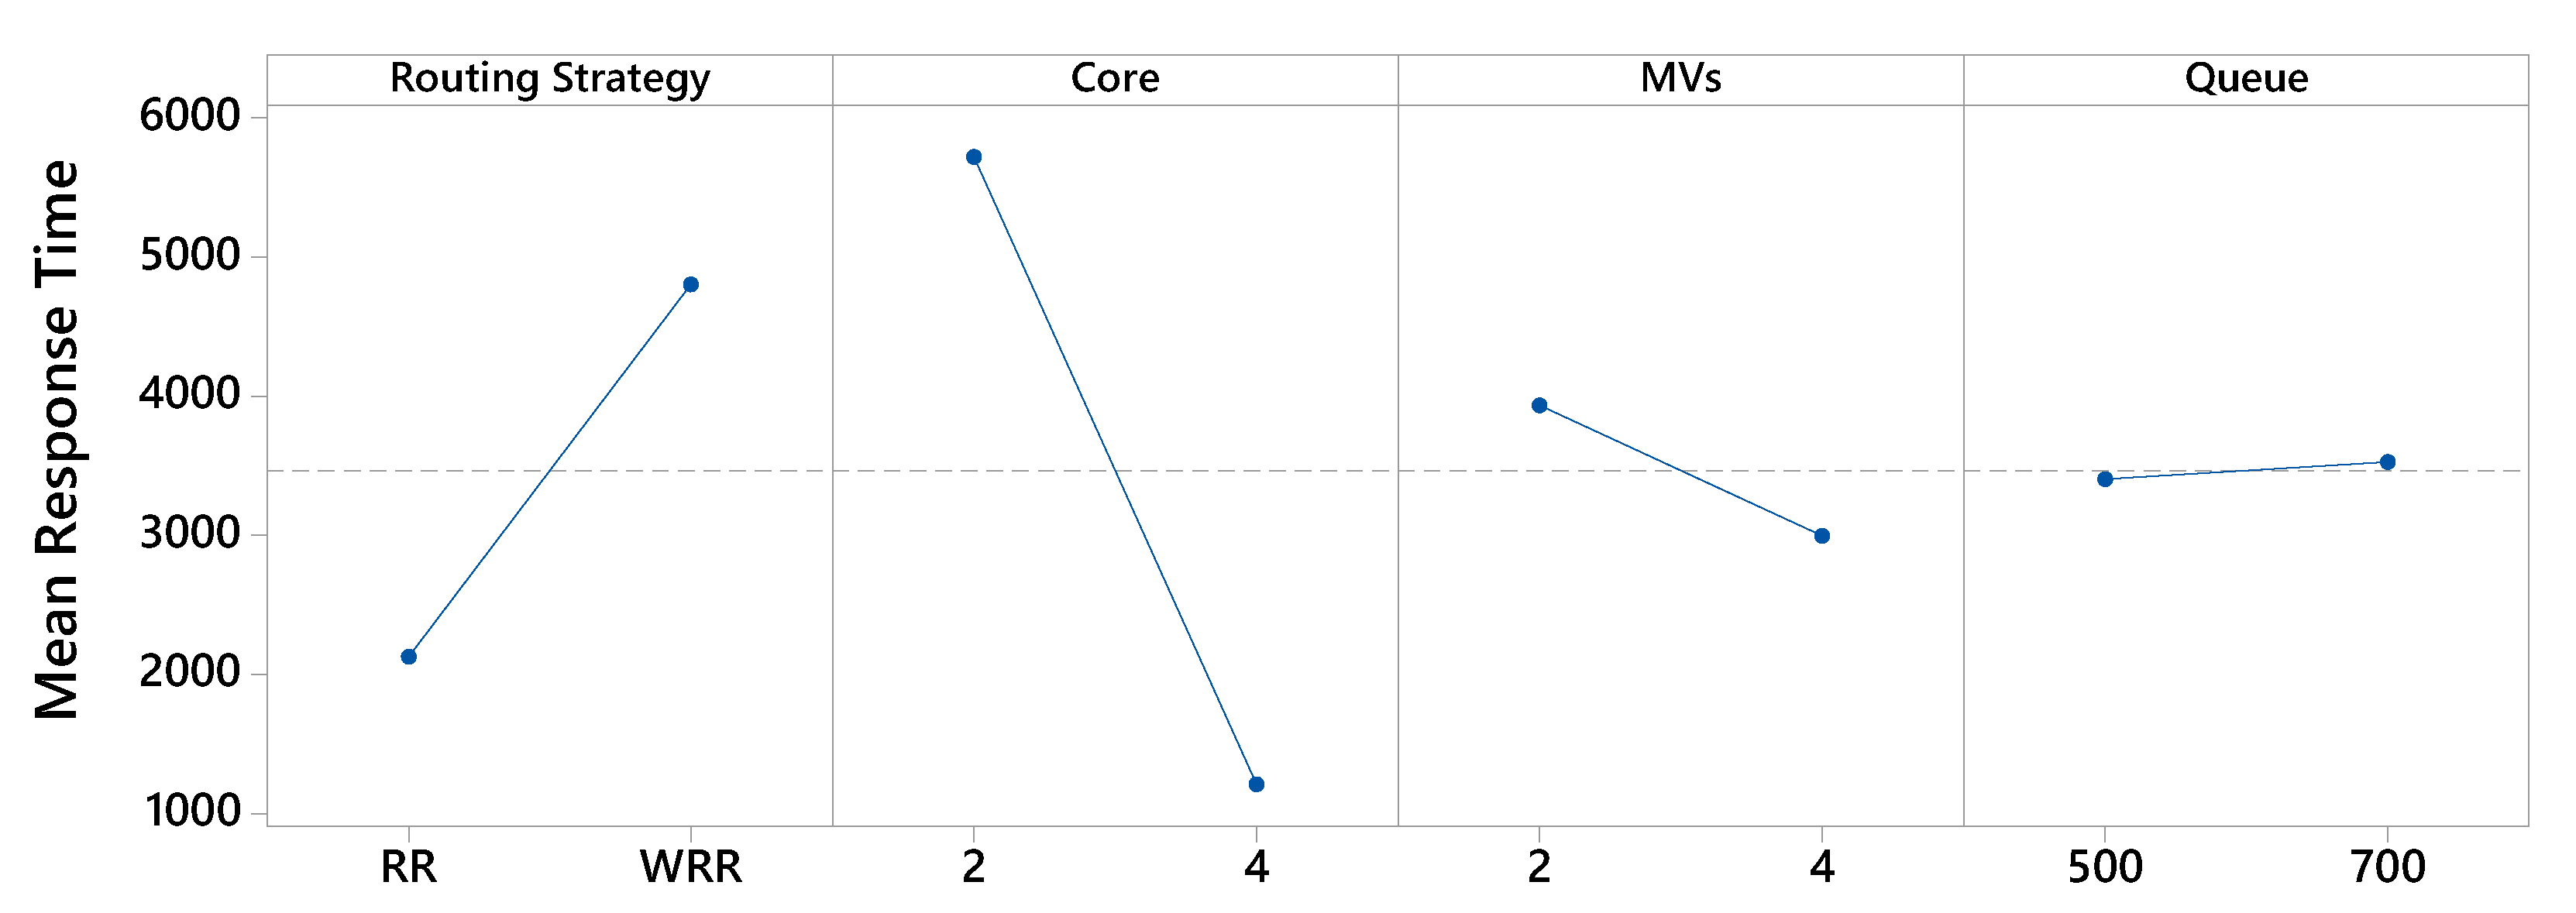
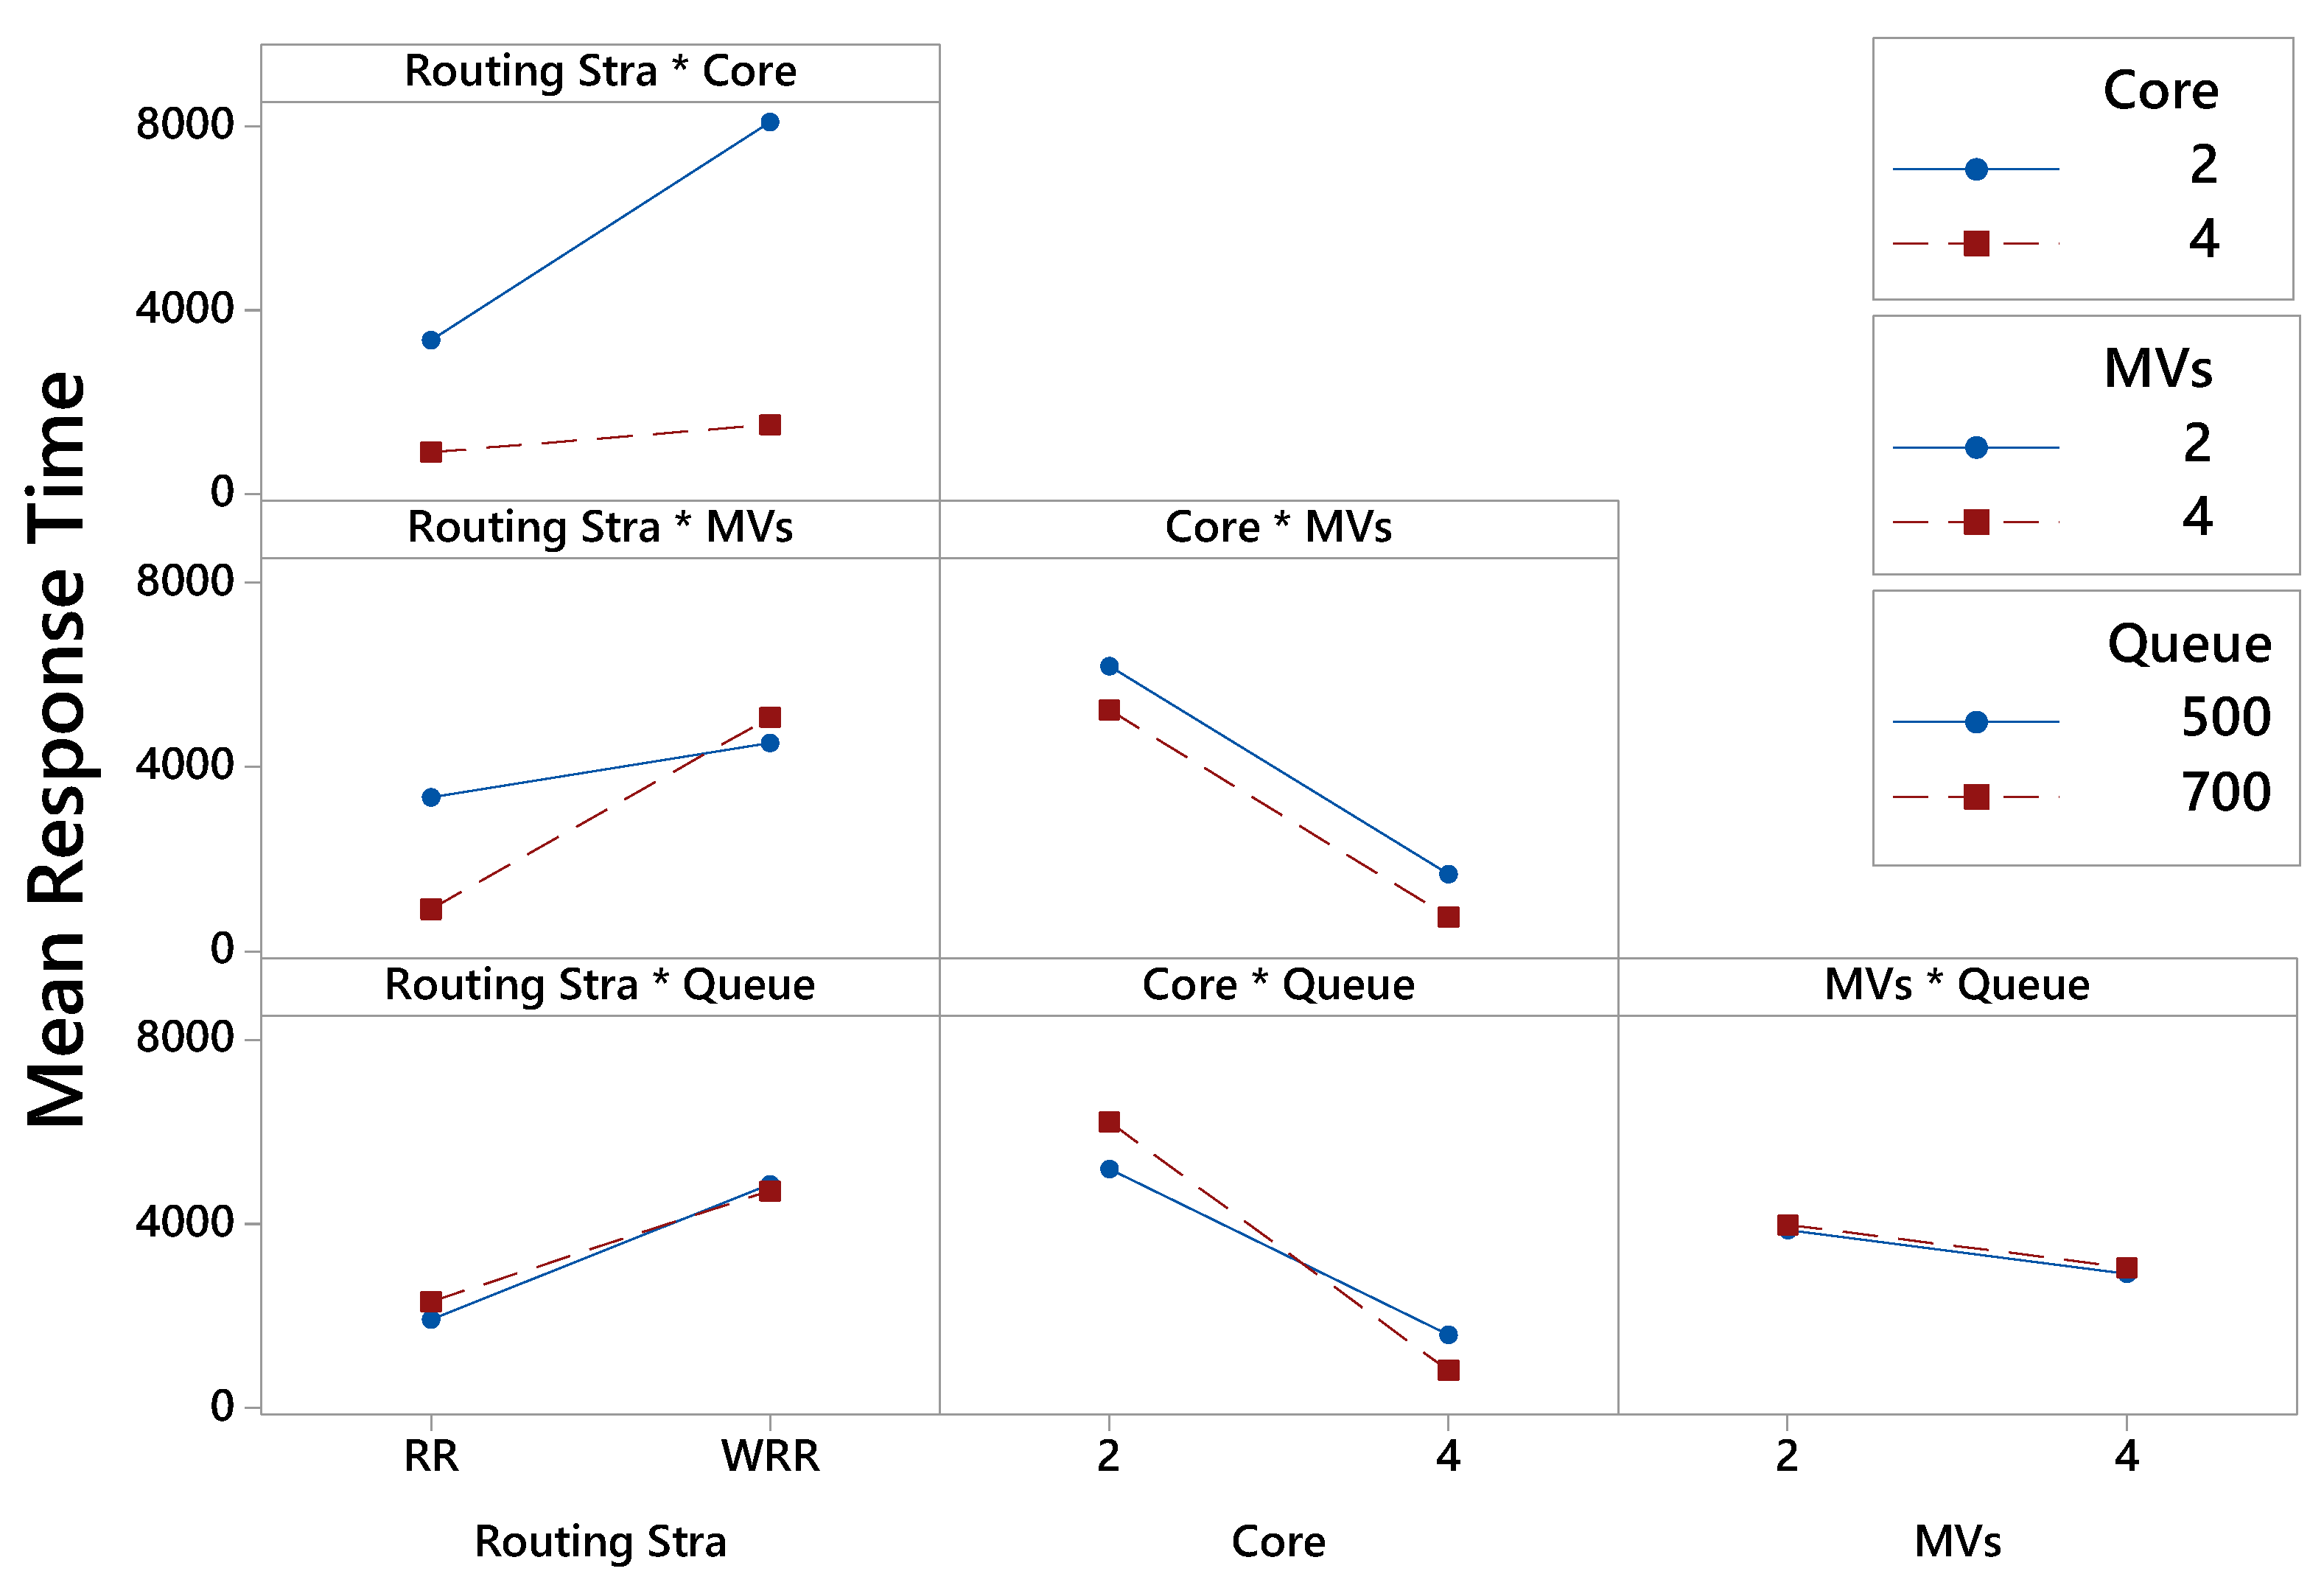
  • The weights for message routing and the distribution to each computing layer in the weighted round-robin strategies should be designed under the awareness of the specific processing capacity of virtual machines in the corresponding computing layer. Therefore, the computing in the IoRT infrastructure is more efficient with weighted round-robin strategies than using the simple round-robin strategy. Furthermore, the greater number of computing cores can drastically reduce the MRT compared to the smaller one. However, a higher weight with a low capacity selected for a specific computing layer can lead to significant package losses of messages;
  • When comparing the results by the computing layers in the three specific scenarios, it was observed that the fog had the lowest MRT, which as smaller than the private cloud, which in turn had a lower MRT than the public cloud. Therefore, it is important to note that the weights of load balancing strategies among computing layers expose a major impact on the MRT of the overall IoRT infrastructure. This result greatly influences the allocation processes of the fog/private cloud/public cloud computing resources to satisfy the required latency levels;
  • Our analysis pointed out that a higher processing power should be assigned to the fog computing layer whenever the data traffic increases (i.e., shorter arrival time) to this layer, which could be the culprit of resource shortages due to utilization overload;
  • The obtained results can be a practical guide for performance analysis using the proposed model in a practical application of the IoRT.

1.6. Paper Organization

The remaining sections of this paper are organized as follows. In Section 2, the related works are discussed. The IoRT architecture for this paper is presented in Section 4. We describe the proposed queue model for the processing and communication analysis in Section 5. In Section 6, the sensitivity analysis of the IoRT components that most impact the system is performed, while the performance analysis of these factors using the proposed queue model and the discussion of their results are presented in Section 7. The conclusions are given in Section 8.

2. Related Work

In this section, research works related to architectural modeling and infrastructure planning for the IoRT are presented. Starting with seminal articles in this area, the definition of the IoRT and its architectural principles was proposed in [3] as a multilayer architecture. This architecture focused on the communication components with the robot sensors and the Internet layer connecting robots to the fog and cloud. Subsequently, in [11], a similar architecture was analyzed with a focus on the optimization and security of the communication protocols. In turn, in [2], the authors identified the main application domains for the IoRT and pointed out the applications that should support Industry 4.0 cyberspace. Motivated by the above works, this study focuses on performance a modeling evaluation of IoRT computing infrastructures.
Models for perception and control of robots and their applications have been widely studied in the IoRT. Most of the efforts in this line [12,13,14,15] deal with mapping robot movement in physical space based on Petri Net (PN) models. In [12], a framework for the automatic generation of robots’ coordinated mission based on PN was proposed in conjunction with an experimentation platform, while in [13], the PN was used to model and improve the navigation of multiple robots in a competition simulating a soccer match. A PN model for automatic robot travel planning based on movement identification via Radio Frequency (RFID) was proposed in [14]. In the same line of research, in [15], the use of RFID for positioning and teaching robots in the mapping of environments based on PN was evaluated.
Even earlier than the proposal of IoRT concepts, cloud infrastructures were already used in robotics to extend robots’ skills for the sake of the interaction between humans and robots associated with the respective environmental sensing, which is well known as cloud robotics. In [19], a service based on a robot named Kubo was proposed to offer elderly assistance for independent living, in which the robotic computing and services rely on cloud resources to extend the robot’s capabilities for human interaction. The robot’s main tasks were based on speech recognition and knowledge retrieved from a knowledge database in a distant cloud for the robot’s perception of the surrounding context and environment. However, real-time constraints were not considered for the robot tasks due to performance issues. A framework targeting data retrieval from a cloud for multiple robots to perform near-real-time tasks was investigated in [20]. In this work, the authors granted robots asynchronous access to the cloud using market-based management strategies modeled as a Stackelberg game. The above works dealt with the problem of sharing resources in the cloud efficiently for multiple robots. Nevertheless, these works did not explore promising architectures to satisfy real-time constraints in the consideration of the simultaneous consumption of computing resources for real-time robot tasks.
Multilayer architectures that leverage communication in even more complex robot systems spreading over wide sensing environments are the challenges in IoRT research and development. In [1], different approaches based on graph models were proposed to efficiently maintain connectivity among various mobile robots for a desired Quality of Service (QoS) level. The authors evaluated their approaches considering the compromise between communication coverage and QoS in communication. In [21], a Human Support Robot (HSR) service based on the IoRT was proposed to monitor the behavioral disorders of patients with dementia in which the assisted patients interacted with the fellow robots. The HSR service explored the use of various components in the various computing layers of the IoRT architecture from actions and data collection via sensors and wearable devices to anomaly detection tasks coupled with cloud processing. A multilayer architecture for robotic telesurgery was proposed in [22]. The authors employed cloud and fog tiers managed by software-defined network controllers to provide real-time telesurgery services. The work also presented a queuing model to evaluate the performance of the telesurgery system architecture with a focus on the metrics of deadline hit ratios in telesurgery services.
Finally, queuing models offer a theoretical and experimental framework for the performance analysis and planning of computer systems [18]. In [16], a queuing model was proposed to analyze the efficiency of robotic systems in the collection of data in sensors and the response via actuators. This model helped designers avoid data loss in sensors, which is a typical IoRT problem. Similarly, a queuing model for the performance analysis of inventory services and the delivery of materials controlled by robots was proposed in [17]. The authors considered several autonomously guided vehicles receiving requisitions, collecting materials on shelves, and then, delivering them to a central collector. Robot jams occurred at the central collector, and an M/G/1 queue model was used to estimate the average requisition time and service flow. In [23], an M/M/s queuing model with impatient customers was adopted to estimate the part flow for a pick-and-place task with a multirobot system. The authors showed by simulation that their estimation approach improved the task completion rate of the system compared to estimations based on the Monte Carlo strategy and the M/M/1 queuing modeling method.
The above-mentioned works revealed the capability of adopting queue models for performance evaluation of IoRT infrastructures. However, in this literature review, none of the proposed queuing models considered dealing with the multilevel computing architecture of IoRT infrastructures as a whole. In Table 1, we present a comparison of the previous works as discussed above to distinguish the contributions of this study.
The related works that used mostly IoRT-related subjects associated with analytical models were [12,13,14,15]. The more evaluation metrics were used, the better the comprehension of the system’s behaviors was. This study considers even more performance metrics including the Mean Response Time (MRT), the utilization of computing layers, the waiting time in queues, and the discard rate. Analyzing the resource capacity to support the generation of IoRT data is essential. Among the related works, only the works [17,25] performed different variations of resource capacity. On the other hand, the proposed model in this study is unique in representing several points of load balancing aiming at the greater use of resources. The sensors grouped by location criteria refers to how the proposed model represents different groups of sensors. The selected works in the literature employed only a single group of sensors, which therefore could only generate a single arrival rate, which was also not practical since there are often a huge number of robots and their associated sensors and actuators to generate heterogeneous data. On the contrast, the model proposed in this work allows assigning different arrival rates by location. This unique feature aims to reflect the practical operations because these sensors can have different critical levels depending on the location. The model in this work also has the exclusive feature of representing the number of processing cores per machine. Both the fog and cloud are represented with multiple Virtual Machines (VMs) with multiple cores in each VM. The model enables varying the capacity of the number of machines and also enables computing the average response times per layer. In this way, the calculated MRTs enable assimilating the impact of each part on the overall system performance. This study provides various extensions and advantages in comparison with previous works in the literature on the performance valuation of IoRT infrastructures.

3. Performance Evaluation Methodology

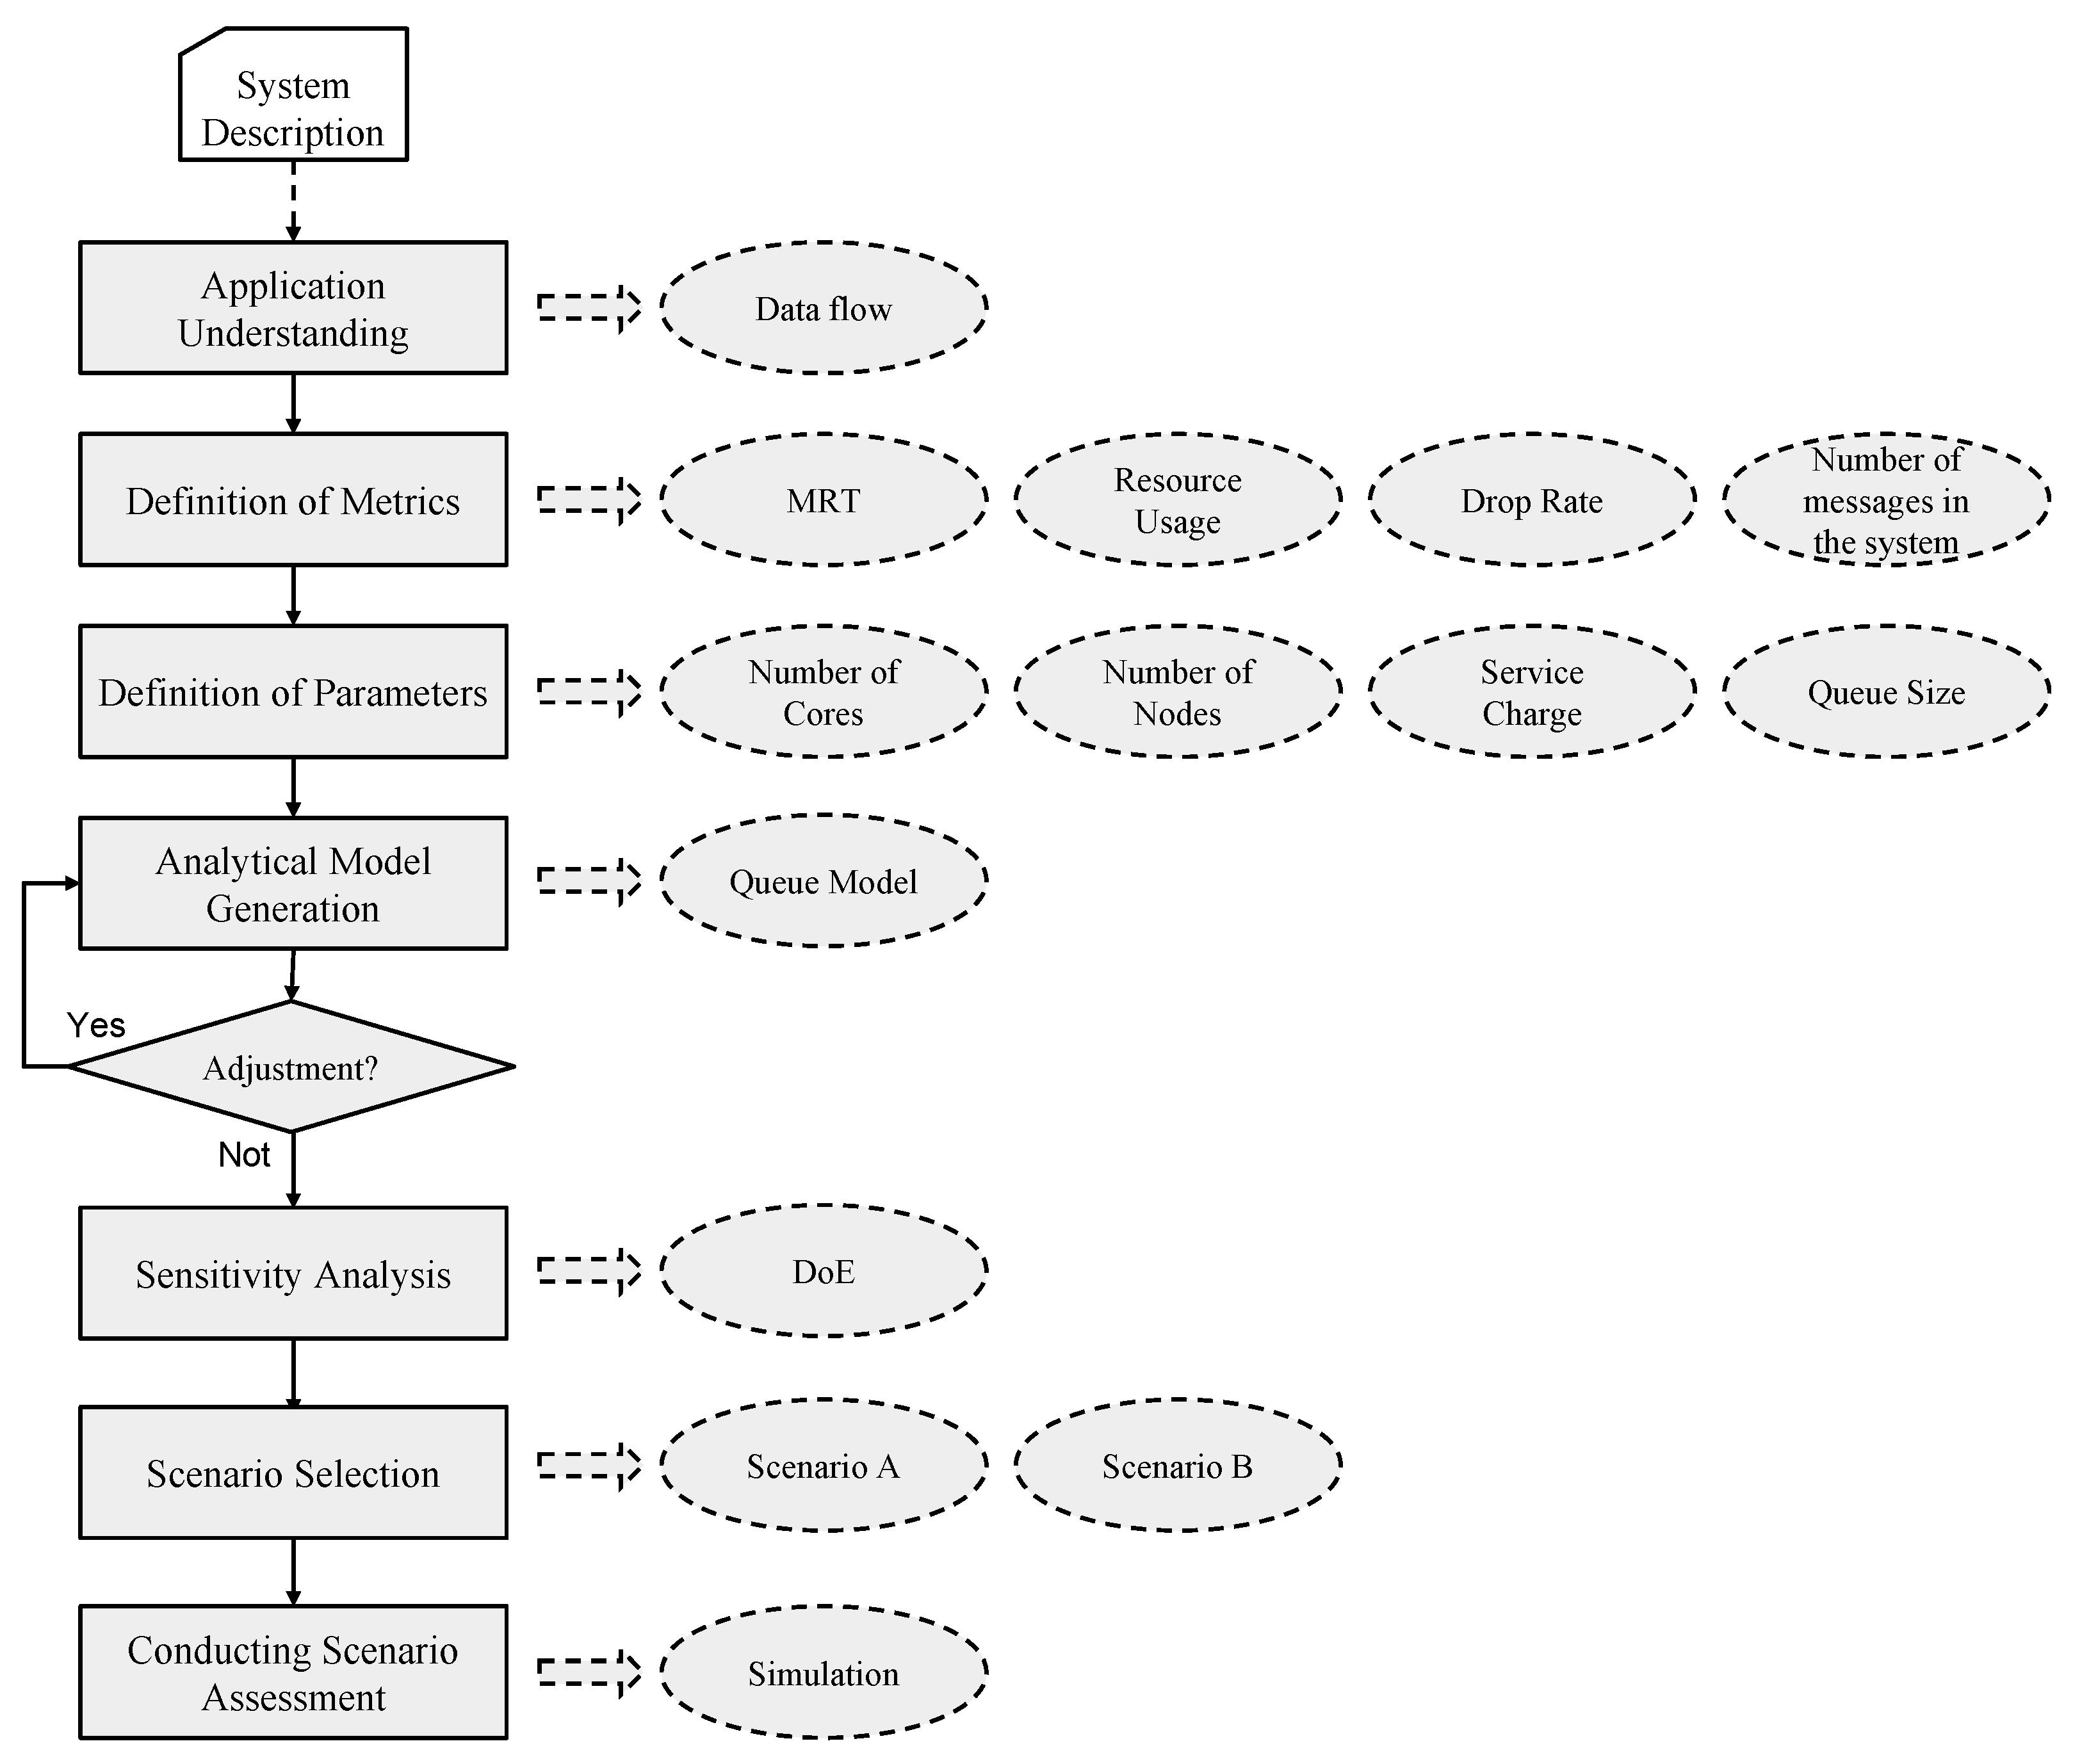
Figure 1 presents a flowchart that abstracts our methodology of the performance evaluation of IoRT infrastructures using the queuing-network-based performance model. The ultimate goal was to develop a queuing-network-based performance model that can assimilate IoRT system performance for robots performing tasks in manufacturing factories in which the computing is associated with the edge, fog, and cloud computing continuum. Furthermore, a number of different operational scenarios were considered to evaluate the proposed performance model. More importantly, the sensitivity analysis and performance evaluation were conducted to determine the most impactful metrics.
The first step of the methodology concerns the application understanding. It is important to comprehend how the application works, define how many components are involved, and the system’s data flow, for example, where the data are delivered after passing through a given component. The next step encompasses the metrics’ definition, in which various performance metrics of interest are identified considering the model’s knowledge to diagnose the system performance. In this work, we adopted important performance metrics for the end user’s perception and system administrators’ utility including the MRT, resource utilization, number of messages in the system, and message discard rate. The definition of parameters is the step where we set the model parameters regarding the behavior and capability of each component. These parameters were the number of cores, number of nodes, service rate, and queue size in this work. Thus, we conducted the analytical model generation based on queuing theory, considering the defined metrics and parameters and the expected results. The choice of the queuing model in this approach can satisfactorily abstract the complexity of the IoRT architecture so that system administrators and researchers can focus on the system’s most important components. In the template validation, the model validation was implemented using a programming language that considers different components of the system architecture. The results collected in the validation were compared with the results returned by the model. The model was validated if sufficient values were found similarly for both. Otherwise, the model parameters must be adjusted. If more adjustment was realized after the validation step, we needed to return to the analytical model generation step. We adopted the DoE to perform sensitivity analyses considering predefined factors and critical levels. The analyses can identify the most relevant factors for a given metric and how the interaction between the factors and variations in their levels impacts the system performance. Given the sensitivity analysis, some practical scenarios, i.e., the scenario selection step, were taken into consideration for the system performance analysis. In this way, the most important factors were analyzed with the proposed performance model. Finally, the selected scenarios were evaluated using the queuing model through numerical evaluation in the conducting the scenarios assessment step. In each scenario, we varied the most important factors, and the chosen metrics were analyzed, allowing us to observe the system configurations that expose a required satisfactory level of system performance.

4. The Internet of Robotic Things

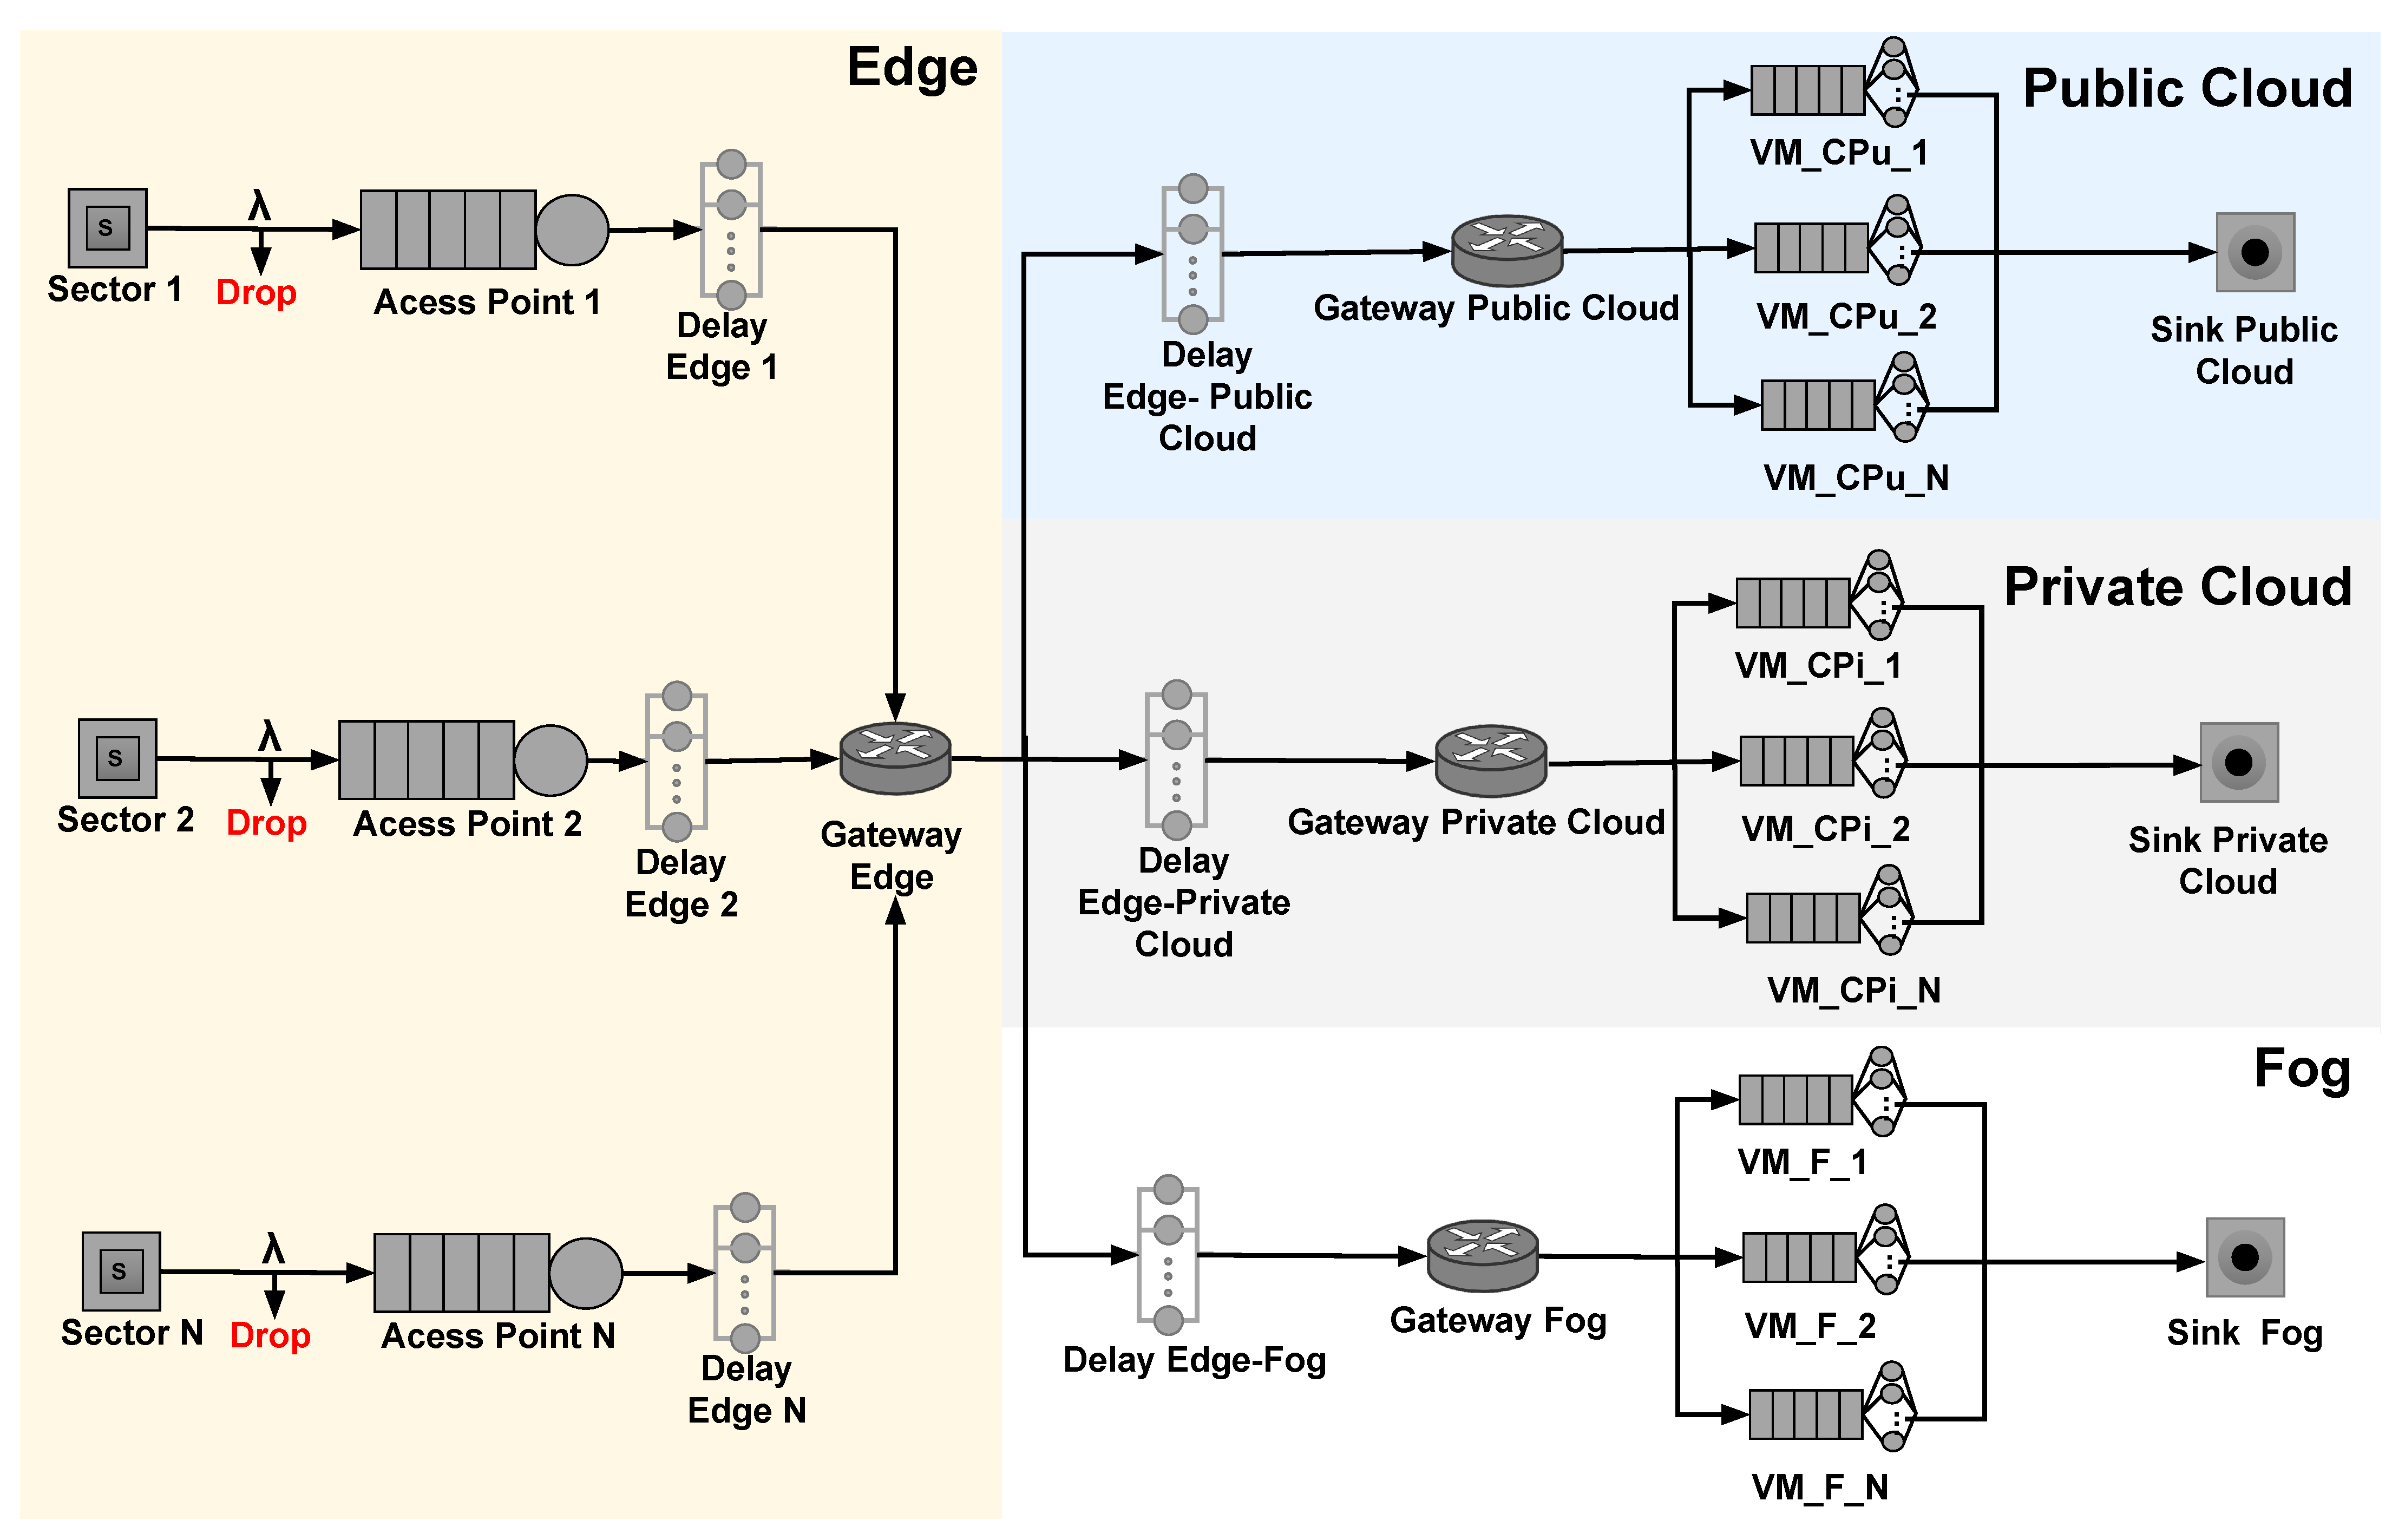
In this section, a typical IoRT system architecture is presented for the sake of performance the modeling and analysis, as shown in Figure 2 [3,11]. The IoRT infrastructure is supposed to adopt a multilayer architecture that integrates (i) the edge layer, the edge of the robotic network of robots and smart devices located in delimited workspaces or sectors (e.g., production lines or offices) in different places (e.g., factories or buildings, and (ii) the fog and cloud computing layers for data processing and to provide supplementary computing storage. The fog layer allocates processing power closer to the edge of the network to support local computing, and it is also a decentralized architecture in which the data and computing capabilities are distributed between the data source and a cloud. On the other hand, the cloud layer can be further divided into (i) the private cloud in which computing resources are for exclusive common use within a class of users or companies and (ii) the public cloud in which the computing resources are used by subscribed users who purchase their computing plans.
The purpose of this architecture is to process data streams originating from robot sensors or actuators in factories while performing tasks in various application domains [2], such as those mentioned in Section 2. In the edge layer, robots with different sensors and actuators are connected via a wireless network through wireless access points to perform tasks in individual or collaborative manners based on the tasks performed by the robots in the industrial production line. This layer is further composed of an edge gateway for data aggregation and forwarding through a router to the fog or cloud computing layers in accordance with load balancing policies between the layers or the requirements of computing power. In turn, the fog or cloud layers are composed of (i) a number of computing nodes (i.e., virtual machines) for parallel processing of tasks regardless of their source and (ii) a fog/cloud gateway for the aggregation and forwarding of computing jobs to the fog/cloud virtual machines based on the load balancing policy adopted in their respective tier.
Message lifecycle: The architecture in Figure 2 also indicates the lifecycle of data packets and the accompanying operational processing behaviors for data streams generated by robots in industrial production lines. Fundamentally, when processing capabilities in the edge layer (i.e., in the robots themselves) are insufficient to process the edge data periodically generated in the edge layer, it is critical to forward the data processing jobs to the fog or cloud layers for more powerful processing capabilities. In such a sophisticated processing pattern of messages in the IoRT infrastructure, it is critical to assimilate (i) how the periodic interval variation for the data generated in the edge computing layer and (ii) how a specific configuration of each component of a layer impact the performance of the IoRT infrastructure evaluated via metrics such as the average time response and the throughput of tasks. In particular, data processing jobs are delivered over a wireless network to an edge device for the data to be encapsulated and aggregated. If the edge device is busy, data can be put in an edge queue, which will be served in order of arrival (first come, first served (FIFO) policy). However, if the edge device queue is completely occupied, the data will be discarded as a consequence. These alerts are then transmitted to the fog via a fog gateway. The edge/fog/cloud gateways play a role in the data distribution and load balancing for the public, private, and fog nodes. Load balancing is performed so that all fog and cloud nodes receive the same amount of processing requests, which is important to avoid overloading and queuing problems in one node while other nodes are idle, causing data congestion. Messages are processed in fog and cloud nodes. As with the edge device, fog and cloud nodes also have a queue capacity limit, and if that limit is reached, the data will be discarded as a consequence. To assimilate the impact of system parameters and components on the overall system performance, some research questions may arise in this study, including: (i) “What is the impact of the request arrival rate on a system’s performance metrics?”; (ii) “How does a specific resource capacity setting impact a system’s performance metrics? “.
Assumptions: To simplify the modeling, some assumptions about the architecture under consideration are provided as below:
  • [a1]: Data generation was modeled for all active robots in a room connected to an edge device that is also installed in the same room to cover the data transmission from the robots;
  • [a2]: The communication latency between sensors and high-end devices was not considered to simplify the queuing-network-based performance model. We assumed the establishment of noninterrupted wireless communication and high-quality data transactions between the robots and edge devices to minimize the negative impact of latency in the high-end short-haul communication on the overall performance metrics;
  • [a3]: The data collection of the robot was independent of each other. However, the arrival rate of the messages was assumed to be deterministic;
  • [a4]: Sophisticated load balancing strategies were not considered in the cloud/fog layers since the forwarding mechanisms can help reduce the overload of the cloud/fog layers. Thus, jobs arriving at the cloud/fog gateways are distributed evenly to each of the cloud/fog nodes;
  • [a5]: The message generation at the robots was supposed to statistically comply with a deterministic distribution, while the service of processing cores at the computing layers complied with an exponential distribution. Different distribution types of data arrival and processing time can also be adopted to reflect the practical arrival and processing of jobs at the edge/fog/cloud of the network.

5. Proposed Performance Model

Figure 3 illustrates a queuing-network-based performance model for the IoRT infrastructure under consideration. Java Modeling Tools (JMT) [26] was used to model and evaluate the proposed scenarios. JMT is an open-source toolkit for simulating and evaluating the performance of communication systems based on queuing theory [27].
The flow of data is illustrated from the left side to the right side of the model, which captures the data transmission throughout the IoRT from the sensors/actuators on each robot at the edge to the fog and cloud computing centers. Sensors generate requests within a predefined time interval following a particular probabilistic distribution (e.g., exponential distribution). The model has multiple entries corresponding to different groups of robots in individual manufacturing sectors at the edge of the IoRT infrastructure. Each sector has a number of robots all connected to a wireless access point in which the data generated by the robots following an exponential distribution are aggregated and received to forward to the upper layers for further processing and analysis. The access point can be, for example, a router, and the computing nodes can be processing cores. A queue and multiple computing nodes in the proposed model were used to represent each access point. The arrival rate depends on the number of robots and the distribution of the data generation from the robots’ sensors. Robot sectors are supposed to be placed at different areas of the same or different manufacturing factories. Each robot sector is located at different distances from the other layers; therefore, the delay to the computing layers needs to be taken into account (i.e., delays from the edge to the fog, public cloud, and private cloud computing layers). The delay components in the proposed model do not carry any specific service: it is just a component to represent the network delay in the transmission of a request.
The fog, public cloud, and private cloud were modeled in a similar manner. An input gateway distributes data following a specific load balancing strategy. The cloud and fog layers have a service time related to their data processing tasks. It is noteworthy that the cloud layer has greater computing capacity than the fog layer. It was assumed that the arriving requests in each element of the overall system would be processed considering a First Come, First Served (FCFS) policy. By the Kendall notation [28], a queuing network follows the pattern D/M/c/K/FCFS. The main parameters of the stations are the queue size, service time, and several internal servers (the computing layers considered as processing cores). The generation rate follows a deterministic pattern (D) as the sensors were calibrated to a fixed generation interval. On the other hand, the service time (M) of a server often complies with exponential distributions, which usually feature continuous-time Markovian processes. Service stations have a number (c) of servers. The last queues have a fixed size (K) and adopt the FCFS service policy. Each access point can have a different arrival rate. Since they are often relatively infinitesimal values, we assumed neglecting the communication latency between sensors and access points. The Delay components (e.g., “Delay Edge 1”,..., “Delay Edge N”) encapsulate any associated time from the exit of an access point to a gateway device. In this work, we assumed that the VMs are in charge of specific processing tasks. However, if an appraiser needs to represent such tasks as a storage delay, the appraiser must consider such respective times to feed the model. More layers of remote processing can be added to the model, but we chose to represent only the three most popular existing computing layers. A common difference between the public and private cloud relates to the level of data security and privacy. However, we assumed not to consider this requirement in the modeling.

6. Sensitivity Analysis

In this section, we investigate the factors that can impact the performance of an IoRT infrastructure using our queuing model. This analysis aimed at assimilating how a change in the main components of the IoRT infrastructure impact the system’s performance. In this way, we first describe our statistical framework for sensitivity analysis, and afterwards, we discuss our results.

6.1. Design of Experiments

In this work, we adopted the Design of Experiments (DoE) techniques for sensitivity analysis. The DoE corresponds to a collection of statistical techniques that deepen the knowledge about a product or process under consideration [29]. It can also be defined by a series of tests in which a research engineer changes the set of variables or input factors to observe and identify the reasons for the changes in the output response.
The DoE-based sensitivity analyses adopt three categories of graphs, which are usually recommended in the literature [30,31]:
  • The Pareto chart is represented by bars in descending order, and the higher the bar, the greater the impact of a given factor (e.g., architecture component) is, representing the influence of this factor on the analyzed measure (i.e., the dependent variable);
  • The main effects graphs use lines to represent the differences between the level of impact for one or more factors, and the higher the slope of the line, the greater the magnitude of the main effect is, whereas a horizontal line has no main effect, i.e., each level affects the response in the same way;
  • The interaction graphs use lines to identify the impact of interactions between factors, i.e., the influence of a given factor on the result is impacted by the changes in another factor’s level, and parallel lines in the graph means there is no interaction between the factors. Otherwise, there is an interaction between the factors.
We conducted experiments for the considered IoRT architecture. Accordingly, the four tiers and the configuration of the components in each tier were explored in the sensitivity analysis. The MRT metric was the output response measure to be analyzed through the DoE. The choice of the MRT was due to its direct impact on the perception of the end user. The resource utilization level, for example, is a metric considered to be of a secondary type.
Four factors were adopted in this study: (i) load balancing algorithms, (ii) number of nodes, (iii) number of CPU cores, and (iv) queue size. All factors have two levels. The factor of the load balancing algorithms has the level of round-robin and the level of weighted round-robin considering the routing from the edge to the computing tiers, public cloud, private cloud, and fog with the weights of { 1 , 2 , 3 } , respectively. The number of nodes refers to the number of servers (i.e., VMs) in each tier, given as 2 and 4. In turn, the number of cores in the server is also given as 2 and 4. The queue size refers to the number of requests in the server queue. Its two levels are 500 and 700. Table 2 summarizes the factors and levels chosen to perform the DoE using the MRT metric. They must be combined to define how the experiments should be performed. Table 3 shows the combinations among all defined factors and their respective levels.

6.2. Analysis Results

Figure 4 depicts the Pareto graph for the factors related to the MRT metric. In the Pareto chart, the absolute values of the standardized effects are presented from the biggest effect to the smallest one [32]. A standardized effect size is a unitless measure of the effect size, which is in turn some quantity used to capture the magnitude of the effect under consideration [33]. We used Minitab® to generate the Pareto chart to highlight the standardized effect values of the significant factors and interactions [34]. The Pareto chart enables one to estimate and measure the difference in the absolute values of the effects of each factor or interaction under consideration. Considering the MRT (in milliseconds) as a response, the significant variables at a α = 0.05 significance level are the (i) routing strategy, (ii) cores (number of cores), (iii) VMs (number of nodes), and (iv) queue (queue size) (as shown in Table 3). In the Pareto chart, a reference line is plotted to indicate the statistically significant effects with a 95% statistical confidence. The impact of a factor on the output metric of interest is indicated by the level of difference in magnitude of the obtained output metric values when compared to each other. Furthermore, the interaction between the factors can expose a specific impact on the output metric of interest, which is also depicted in the Pareto graph. The higher values reflect the greater significance of the factor under consideration indicated via the vertical axis. The graph enables us to investigate the factors and their interaction effects that manifest significant impacts on the output metric of interest. The bars that cross the red reference line are considered statistically significant, considering the 95% statistical confidence with the terms of the current model. The factor of the number of cores exposes the greatest relevance among the considered factors in this study. Therefore, the number of computing cores in the fog nodes is the most impacting factor for the system performance. The load balancing algorithms also expose a high relevance of the MRT. The queue size and the number of nodes are the factors that expose far less influential impact. As the Pareto plot displays the absolute value of the effects, one can determine which effects are large, but it cannot determine which effects increase or decrease the response time.
Figure 5 presents the main effects graph for the MRT metric. The dashed line in the graph breaks down the resulting values in each level for easier analysis of the continuous lines, which represent the differences between the impact of the factors. The more horizontal the line is, the less influence that factor exposes as it indicates the different levels of the factor that similarly influence the results. All factor levels interfere with the MRT metric in some way. The factors of the load balancing algorithms and the number of computing cores expose the greatest effect. Regarding the algorithms, weighted round-robin led to the highest mean response time (about 5000 ms), while in the case of round-robin, this time was much lower (almost 2000 ms). Therefore, the computing in the IoRT infrastructure is more efficient using the simple round-robin. Regarding the number of cores factor, it can be seen that the MRT is much higher when using two cores instead of four cores. When using four cores, the processing speed doubles. As a consequence, the MRT drastically reduces.
Figure 6 shows the interaction of each possible factor combination. Two factors interact with each other if the effect of one depends on the remaining. We observed that there was an interaction between all factors even though the variation of effects was low in some cases. The largest variation occurred for two cores in the interaction between the load balancing algorithms and the number of cores. In this case, the MRT was above 8000 ms for weighted round-robin and less than 4000 ms for round-robin. When considering the interaction between the load balancing algorithms and the number of nodes, the greatest variation occurred in the case of four nodes, where the MRT was close to 0 ms for round-robin and reached more than 4000 ms for weighted round-robin. As one can observe, the combination of interactions that included the load balancing algorithms, number of nodes, and number of cores showed the highest variance ranges for the MRT. On the other hand, in the interaction between the number of nodes and queue size, the MRT metric exposed a stable behavior (i.e., around 4000 ms) for both levels of these factors. Thus, they were the least interacting factors in the experiment.

7. Performance Analyses

In this section, we present numerical performance analyses based on the proposed queuing network model for the IoRT infrastructure, considering the variation of the two factors that exposed the most impact on the system performance of the IoRT infrastructure recognized by the DoE sensitivity analyses in Section 6. First, we analyzed the impact of the alteration of two load balancing algorithms and then the variation of the number of computing cores in each node of the computing edge/fog/cloud layers.

7.1. Load Balancing Algorithms

The main purpose of load balancing is to prevent a single server from being overloaded and possibly failing. Load balancing improves service availability and helps prevent downtime. In addition, when the amount of workload that a certain server receives is within an acceptable level, it would have sufficient computing resources (e.g., CPU, RAM) to process requests within acceptable response times. Importantly, a rapid response with a short time is vital to end user satisfaction and productivity. It is worth noting that the use of this approach has not been verified in the literature with queuing networks. Table 4 shows the input parameters used for each component of the model. The letter x indicates that the component does not have a specific value of the queue capacity. The column “Time (ms)” represents the service time for each component of the model. The delay components represent the transmission times for messages from one component to the other. In this work, the processing nodes in the cloud and fog layers were VMs with different numbers of processing cores. However, the appraiser can consider any other computing element such as containers.
Table 5 presents three specific scenarios for the performance evaluation denoted as R R , W R R A , and W R R B . Scenario R R explores the round-robin algorithm, while scenarios W R R A and W R R B explore the weighted round-robin strategy with different weights. The purpose of these scenarios was to demonstrate the capabilities of adopting the proposed performance model to evaluate specific configurations of an IoRT infrastructure that impact its performance. Furthermore, it is critical to identify the compromise between computing power and communication delays in the IoRT infrastructure adopting the multilayer computing pattern of edge/fog/cloud continuum in which the use of weights in load balancing can further optimize this aspect in order to decrease mean response times and decrease the drop rate.
Figure 7 shows the results observed in the three scenarios. The results were produced based on five metrics of interest including the (i) MRT, (ii) utilization, (iii) number of messages in the system, and (iv) drop rate. An appraiser can use any load balancing strategy, but in this work, we limited ourselves to adopting two existing strategies due to the readiness of those strategies in the JMT analysis tool [26].
Figure 7a shows the MRT referring to the system’s exit point, that is three MRTs were calculated for each of the three computing layers. In the comparison of the three scenarios, we observed that the greatest impact of the alteration of the balancing algorithms on the MRT occurred in the fog while obtaining similarity in the scenarios R R and W R R A reaching a value of ≈94.00 ms. However, the MRT exposed a considerable increase in scenario W R R B , which reached 403.243 ms. It was observed that in the public and private cloud, there were similar values of ≈2023.00 ms and ≈31.00 ms, respectively. Therefore, the smallest MRTs were obtained with the configuration of scenarios R R and W R R A . Additionally, scenario W R R A was superior to scenario W R R B because a heavier weight was given to the cloud, which doubled in the processing capacity compared to the fog regarding the number of cores, thus offering a shorter service time. When comparing the results by layer in the three scenarios, it was observed that the fog had the lowest MRT compared to the private cloud, which in turn, had a lower MRT than the public cloud. This result greatly influenced the location of the three fog/private cloud/public cloud computing resources with their latencies of 100 ms, 500 ms, and 2000 ms, respectively. Observing scenario W R R B specifically, we see that the MRT of the fog was very close to the result of the private cloud, while the greater weight of the load balancing strategy was allocated to the fog. Therefore, it is important to note that the weights had a major impact on the MRT.
Figure 7b shows the utilization of the components in each layer, including the edge layer. When compared to each other, it could not be distinguished which of the three approaches in the three scenarios had the best results in the utilization, generally. However, the utilization of the edge layer and public cloud remained constant in the three scenarios. This utilization at the edge layer occurred because the adoption of load balancing strategies was not considered before reaching the edge access point devices. In turn, this utilization in the cloud layer occurred because the cloud had a lower arrival rate due to its greater distance from the edge layer (edge–cloud delay), which resulted in a low utilization. The fog layers across the three scenarios achieved a notable variation in the utilization. The lowest utilization occurred in scenario W R R A (with 38 % ). The highest utilization values for the fog happened in scenario W R R B because the fog had a greater weight, thus receiving more messages for processing. Observing the private cloud, the variation in the utilization metric was not significant. The lowest utilization of the private cloud occurred in scenario W R R B ( 6.2 % ).
Figure 7c shows the mean number of messages processed within the system including all processing points and queue buffers. In principle, fewer messages should remain within the system, indicating a high processing capability and a high data throughput. However, it should be carefully observed whether the occasional low number of messages is due to a high drop rate. The number of messages was different for the three scenarios. Scenario W R R A maintained the highest number of messages (728 msg). Scenario W R R B resulted in the lowest number of messages (428 msg).
In order to understand the low number of messages in scenario W R R B , one must also pay attention to the utilization graphs (Figure 7b) and drop rate (Figure 7d). In scenario W R R B , a greater weight was given to the fog layer. Thus, more messages were directed to that layer. With more messages, the resources became overloaded at some points, as seen in the fog’s use. This saturation caused scenario W R R B to have a higher drop rate and, therefore, a smaller number of messages. Therefore, the low number of messages in scenario W R R B is a negative impact. Dropped messages can generate inconsistencies in the robots’ requests.

7.2. Number of Cores Per Node

The number of cores was one of the two factors that exposed the most impact on the overall performance of the IoRT infrastructure. The increase in the number of cores avoided processing overloads, which therefore, resulted in longer response times. On the other hand, the number of cores should be increased gradually to prevent the underutilization of computing resources, then excessive and unnecessary investments in the deployment of the IoRT architecture. In Table 6, we consider three scenarios to analyze different configurations of the computing cores in the nodes, which are denoted as scenarios I, I I , and I I I . In scenario I, we explored the nodes with low processing power in terms of the number of cores. In scenario I I , the processing capacity was two-times bigger to explore an intermediate system. Finally, scenario I I I represents the computing system with a high processing power in which the number of cores in the nodes is three-times higher than in the first scenario I. The purpose of these scenarios was to demonstrate how the proposed model could evaluate specific configurations when deploying the IoRT computing infrastructure and their impact on system performance. Furthermore, this analysis can help identify the trade-offs between computing power and communication delays in an IoRT infrastructure adopting multiple fog/cloud computing layers.
Figure 8 shows the numerical analysis results in the three scenarios I, I I , and I I I , representing different configurations of the computing layers. We analyzed the same metrics of interest as presented in the previous section including the MRT, utilization, number of messages in the system, and messages drop rate metrics.
In Figure 8a, we show the MRT for each of the three computing tiers of the remote computing resources (fog, private cloud, and public cloud). As one can observe, the fog layer exposed the highest MRT variation for the three configurations of computing capacities. In particular, scenario I showed the longest MRT at approximately 790.00 ms, whereas a sharp drop to approximately 95.00 ms occurred in scenario I I I . The public and private cloud layers maintained the same MRT in all three scenarios. For the public cloud, the MRT remained stable at approximately 2023.00 ms in the three scenarios. In the case of the private cloud, it stayed at 525.00 ms. Therefore, the deployment of a minimum configuration of the public and private clouds along with a high-level configuration of the fog layer can apparently gain better values for the MRT metric.
Figure 8b shows the utilization of the computing resources in each of the four computing layers of the IoRT infrastructure. We included the edge layer in this figure to show that the proposed scenarios did not affect the utilization of this specific layer. However, they affected the other layers and, therefore, the overall system performance. The resource utilization in the public and private clouds was lower due to the longer task interarrival times in these layers, i.e., a greater distance led to greater communication delays between the edge and cloud. Additionally, the utilization decreased as we increased the processing power from configuration I to I I I , i.e., from 40 % to 10 % utilization. In the fog layer, in turn, one can observe resource overload with 100 % utilization in scenarios I and I I and 60 % utilization in scenario I I I , given an increase in the processing power of scenario I I I . Our analysis showed that the fog required a higher processing power when the traffic of task arrival increased (i.e., shorter arrival time) to this layer, which may cause resource shortages due to utilization overload.
Figure 8c shows the average number of messages processed within the overall system, including the four layers. Fewer messages remaining within the system at a time indicate a higher performance, reflecting high processing power and high throughput. However, it is necessary to take into account the culprit of the message drop rate, as shown in Figure 8b. For example, Figure 8c shows that scenario I I I had the lowest number of messages (1747 msg), while scenario I and scenario I I had a higher number of 1948 messages and 1956 messages, respectively. However, scenario I exposes an inferior performance compared to scenario I I since the highest drop rate was in scenario I, as shown in Figure 8b. This was due to the lower processing capability in scenario I ( 50 % lower compared to scenario I I ), which led to a greater number of messages in the system (i.e., lower throughput and higher drop rate) as new tasks arrived in the system. By contrast, in scenario I I I , the system had the highest processing capacity, which resulted in fewer messages and, at the same time, a lower discard rate.
The above performance analyses pointed out the insights into the performance-related behaviors of the IoRT infrastructure and also reflected the capability of adopting the proposed queuing-network-based performance model to assimilate a number of performance metrics of interest. The analysis results can help improve the design and selection of system configuration and architecture of an IoRT infrastructure.

8. Conclusions

In this paper, we proposed a performance model adopting a D/M/c/K/FCFS queuing network to assimilate the behaviors and performance of message transmission within an IoRT infrastructure that employed the edge/fog/cloud computing continuum. Different arrival rates in the model were used to capture the clustering and data generation of robots by groups at different places in practical manufacturing factories. The adoption of the proposed performance model helped measure and comprehend a variety of performance metrics of interest including the average response time, utilization, and drop rate, and the calculation of other performance metrics can be further extended. The proposed model elaborated some load balancing strategies for computing at different strategic locations (i.e., at the edge/fog/private cloud/public cloud gateways) in the whole computing system. DoE analyses were carried out to assess the most impactful factors on the overall system performance. A set of different configurations was given under the combination of the factors (i) load balancing algorithms, (ii) number of processing cores, (iii) number of processing nodes, and (iv) capacity of queues in different computing layers. In particular, among the considered system parameters, the processing capacity of the virtual machines was exposed to be the most impacting factor. Based on the output results of the DoE, a detailed performance evaluation was carried out to assess the impact of the variation of the computing servers’ processing capacity on the system performance in different scenarios. The performance evaluation was also conducted according to different routing strategies. Three different routing scenarios were evaluated adopting two popular routing algorithms, which were round-robin and weighted round-robin with different weights. The simulation results pointed out that a higher weight with a low capacity selected for a specific computing layer can lead to significant package losses of messages. Therefore, the weights for message routing and distribution to each computing layer in the weighted round-robin strategy should be designed under the awareness of the specific processing capacity of the virtual machines in the corresponding computing layer. Furthermore, through the analysis results, the research finding was that the processing capacity of the machines was exposed to be the most impactful factor on the overall system performance of the IoRT computing infrastructure. Simulation results highlighted the capability to adopt the proposed performance model to assimilate sophisticated behaviors in performance based on the variation of the configuration and the impacting factors of the IoRT infrastructure. The use of the proposed performance model enabled us to design system configurations to obtain the desired performance in a typical IoRT infrastructure.

Author Contributions

Conceptualization, F.A.S.; Data curation, L.F. and G.G.; Formal analysis, L.F. and G.G.; Funding acquisition, J.W.L. and F.A.S.; Investigation, T.A.N. and F.A.S.; Methodology, F.A.S.; Project administration, T.A.N., J.W.L. and F.A.S.; Resources, G.G.; Software, L.F. and G.G.; Supervision, G.G., J.W.L. and F.A.S.; Validation, L.F., G.G.and T.A.N.; Visualization, L.F. and G.G.; Writing—original draft, L.F., G.G. and F.A.S.; Writing—review & editing, T.A.N. All authors have read and agreed to the published version of the manuscript.

Funding

This paper was supported by Konkuk University in 2018.

Conflicts of Interest

The authors declare no conflict of interest.

References

  1. Razafimandimby, C.; Loscri, V.; Vegni, A.M. Towards efficient deployment in Internet of Robotic Things. In Integration, Interconnection, and Interoperability of IoT Systems; Springer: Cham, Switzerland, 2018; pp. 21–37. [Google Scholar]
  2. Romeo, L.; Petitti, A.; Marani, R.; Milella, A. Internet of Robotic Things in Smart Domains: Applications and Challenges. Sensors 2020, 20, 3355. [Google Scholar] [CrossRef] [PubMed]
  3. Ray, P.P. Internet of robotic things: Concept, technologies, and challenges. IEEE Access 2016, 4, 9489–9500. [Google Scholar] [CrossRef]
  4. Wang, X.V.; Wang, L.; Mohammed, A.; Givehchi, M. Ubiquitous manufacturing system based on Cloud: A robotics application. Robot. Comput.-Integr. Manuf. 2017, 45, 116–125. [Google Scholar] [CrossRef]
  5. Masuda, Y.; Zimmermann, A.; Shirasaka, S.; Nakamura, O. Internet of robotic things with digital platforms: Digitization of robotics enterprise. In Human Centred Intelligent Systems; Springer: Singapore, 2021; pp. 381–391. [Google Scholar]
  6. Andò, B.; Cantelli, L.; Catania, V.; Crispino, R.; Guastella, D.C.; Monteleone, S.; Muscato, G. An Introduction to Patterns for the Internet of Robotic Things in the Ambient Assisted Living Scenario. Robotics 2021, 10, 56. [Google Scholar] [CrossRef]
  7. Michalík, R.; Janota, A.; Gregor, M.; Hruboš, M. Human-Robot Motion Control Application with Artificial Intelligence for a Cooperating YuMi Robot. Electronics 2021, 10, 1976. [Google Scholar] [CrossRef]
  8. Ismail, Z.H.; Bukhori, I. Efficient Detection of Robot Kidnapping in Range Finder-Based Indoor Localization Using Quasi-Standardized 2D Dynamic Time Warping. Appl. Sci. 2021, 11, 1580. [Google Scholar] [CrossRef]
  9. Razdan, S.; Sharma, S. Internet of Medical Things (IoMT): Overview, Emerging Technologies, and Case Studies. IETE Tech. Rev. 2021, 1–14. [Google Scholar] [CrossRef]
  10. Ghazal, M.; Basmaji, T.; Yaghi, M.; Alkhedher, M.; Mahmoud, M.; El-Baz, A.S. Cloud-Based Monitoring of Thermal Anomalies in Industrial Environments Using AI and the Internet of Robotic Things. Sensors 2020, 20, 6348. [Google Scholar] [CrossRef] [PubMed]
  11. Afanasyev, I.; Mazzara, M.; Chakraborty, S.; Zhuchkov, N.; Maksatbek, A.; Yesildirek, A.; Kassab, M.; Distefano, S. Towards the Internet of robotic things: Analysis, architecture, components and challenges. In Proceedings of the 2019 12th International Conference on Developments in eSystems Engineering (DeSE), Kazan, Russia, 7–10 October 2019; pp. 3–8. [Google Scholar]
  12. Nejkovic, V.; Petrovic, N.; Tosic, M.; Milosevic, N. Semantic approach to RIoT autonomous robots mission coordination. Robot. Auton. Syst. 2020, 126, 103438. [Google Scholar] [CrossRef]
  13. Ponsini, D.; Yang, Y.; Kim, S.Y. Analysis of soccer robot behaviors using time petri nets. In Proceedings of the 2016 IEEE 17th International Conference on Information Reuse and Integration (IRI), Pittsburgh, PA, USA, 28–30 July 2016; pp. 270–274. [Google Scholar]
  14. Gunardi, Y.; Hanafi, D.; Supegina, F. Design of Navigation Mobile Robot Using Mirror Petri Net Method and Radio Frequency Identification. In Proceedings of the 2018 Electrical Power, Electronics, Communications, Controls and Informatics Seminar (EECCIS), Batu, Indonesia, 9–11 October 2018; pp. 102–107. [Google Scholar]
  15. Da Mota, F.A.; Rocha, M.X.; Rodrigues, J.J.; De Albuquerque, V.H.C.; De Alexandria, A.R. Localization and navigation for autonomous mobile robots using petri nets in indoor environments. IEEE Access 2018, 6, 31665–31676. [Google Scholar] [CrossRef]
  16. Larkin, E.; Kotov, V.; Kotova, N.; Antonov, M. Data buffering in mobile robot control systems. In Proceedings of the 2018 4th International Conference on Control, Automation and Robotics (ICCAR), Auckland, New Zealand, 20–23 April 2018; pp. 50–54. [Google Scholar]
  17. Wang, W.; Wu, Y.; Qi, J.; Wang, Y. Design and performance analysis of robot shuttle system. In Proceedings of the 2020 International Conference on Artificial Intelligence and Electromechanical Automation (AIEA), Tianjin, China, 26–28 June 2020; pp. 255–259. [Google Scholar]
  18. Harchol-Balter, M. Performance Modeling and Design of Computer Systems: Queueing Theory in Action; Cambridge University Press: Cambridge, UK, 2013. [Google Scholar]
  19. Manzi, A.; Fiorini, L.; Esposito, R.; Bonaccorsi, M.; Mannari, I.; Dario, P.; Cavallo, F. Design of a cloud robotic system to support senior citizens: The KuBo experience. Auton. Robot. 2017, 41, 699–709. [Google Scholar] [CrossRef] [Green Version]
  20. Wang, L.; Liu, M.; Meng, M.Q.H. Real-Time Multisensor Data Retrieval for Cloud Robotic Systems. IEEE Trans. Autom. Sci. Eng. 2015, 12, 507–518. [Google Scholar] [CrossRef]
  21. Simoens, P.; Mahieu, C.; Ongenae, F.; De Backere, F.; De Pestel, S.; Nelis, J.; De Turck, F.; Elprama, S.A.; Kilpi, K.; Jewell, C.; et al. Internet of robotic things: Context-aware and personalized interventions of assistive social robots. In Proceedings of the 2016 5th IEEE International Conference on Cloud Networking (Cloudnet), Pisa, Italy, 3–5 October 2016; pp. 204–207. [Google Scholar]
  22. Sedaghat, S.; Jahangir, A.H. RT-TelSurg: Real Time Telesurgery Using SDN, Fog, and Cloud as Infrastructures. IEEE Access 2021, 9, 52238–52251. [Google Scholar] [CrossRef]
  23. Huang, Y.; Chiba, R.; Arai, T.; Ueyama, T.; Zhang, X.; Ota, J. Queuing theory based part-flow estimation in a pick-and-place task with a multi-robot system. J. Adv. Mech. Des. Syst. Manuf. 2018, 12, JAMDSM0061. [Google Scholar] [CrossRef]
  24. Macedo, D.; Guedes, L.A.; Silva, I. A dependability evaluation for Internet of Things incorporating redundancy aspects. In Proceedings of the 11th IEEE International Conference on Networking, Sensing and Control, Miami, FL, USA, 7–9 April 2014; pp. 417–422. [Google Scholar]
  25. Sun, Y.; Tong, F.; Zhang, Z.; He, S. Throughput modeling and analysis of random access in narrowband Internet of Things. IEEE Internet Things J. 2017, 5, 1485–1493. [Google Scholar] [CrossRef]
  26. Bertoli, M.; Casale, G.; Serazzi, G. JMT: Performance engineering tools for system modeling. ACM SIGMETRICS Perform. Eval. Rev. 2009, 36, 10–15. [Google Scholar] [CrossRef]
  27. Fishman, G.S. Discrete-Event Simulation: Modeling, Programming, and Analysis; Springer: New York, NY, USA, 2013. [Google Scholar]
  28. Ferreira, M.A.M.; Andrade, M.; Filipe, J.A.; Coelho, M.P. Statistical Queuing Theory with Some Applications. Int. J. Latest Trends Financ. Econ. Sci. 2011, 1, 190–195. [Google Scholar]
  29. Kleijnen, J.P. Sensitivity analysis and optimization in simulation: Design of experiments and case studies. In Proceedings of the Winter Simulation Conference Proceedings, Arlington, VA, USA, 3–6 December 1995; pp. 133–140. [Google Scholar]
  30. Costa, I.; Araujo, J.; Dantas, J.; Campos, E.; Silva, F.A.; Maciel, P. Availability Evaluation and Sensitivity Analysis of a Mobile Backend-as-a-service Platform. Qual. Reliab. Eng. Int. 2016, 32, 2191–2205. [Google Scholar] [CrossRef]
  31. Santos, L.; Cunha, B.; Fé, I.; Vieira, M.; Silva, F.A. Data Processing on Edge and Cloud: A Performability Evaluation and Sensitivity Analysis. J. Netw. Syst. Manag. 2021, 29, 1–24. [Google Scholar] [CrossRef]
  32. Cumming, G. The New Statistics. Psychol. Sci. 2014, 25, 7–29. [Google Scholar] [CrossRef] [PubMed]
  33. Cumming, G. Understanding the New Statistics; Routledge: Oxfordshire, UK, 2013. [Google Scholar] [CrossRef]
  34. Hardwick, C. Practical Design of Experiments: DoE Made Easy! 1st ed.; CreateSpace Independent Publishing Platform: Scotts Valley, CA, USA, 2013; p. 50. [Google Scholar]
Figure 1. Analytical model development methodology.
Electronics 10 02626 g001
Figure 2. Illustration of the architecture of an IoRT system supported by remote computing resources.
Electronics 10 02626 g002
Figure 3. Overall queuing-network-based performance model of a typical IoRT computing infrastructure.
Electronics 10 02626 g003
Figure 4. Impact of different factors on the MRT metric (response is the MRT (milliseconds), ( α = 0.05 ) ).
Electronics 10 02626 g004
Figure 5. Main effects for the average response time.
Electronics 10 02626 g005
Figure 6. Interaction of factors regarding their impact on the MRT metric. The * mark means the relationship between the two factors.
Electronics 10 02626 g006
Figure 7. Simulation results with the proposed model considering different load balancing algorithms. (a) Mean response time. (b) Utilization. (c) System number of messages. (d) Drop rate.
Electronics 10 02626 g007
Figure 8. Model numerical results considering the variation of the number of cores per node. (a) Mean response time. (b) Utilization. (c) System number of messages. (d) Drop rate.
Electronics 10 02626 g008
Table 1. A comparison of the related work.
WorkMetricsCapacity VariationLoad BalancingSensors Grouped by LocationRepresents the Number of Processing Cores per MachineAverage Response Time per Layer
[24]Rating, failure rate, standby failure rate, switching mechanism, common cause failures:×××××
[13]Achievement rate×××××
[25]System yield××××
[16]Data buffer×××××
[15]Mapping, tracking, motion control×××××
[14]Mobile robot movement×××××
[12]MRT×××××
[17]System processing capacity, order cycle time××××
[23]Part flow, computation time, task completion success rate×××××
[22]Deadline hit ratio, delay, packet loss ratio××××
[19]Success rate××××
[20]Time of response, CPU load, bandwidth usage××××
This workEdge usage, public cloud usage, private cloud usage, fog usage, Msg number, disposal rate, MRT
Table 2. DoE factors and levels.
FactorLevel 1Level 2
Routing StrategyRound-RobinWeighted Round-Robin
Number of Nodes24
Number of Cores24
Queue Size500700
Table 3. Factors and their respective level combinations.
Load Balancing AlgorithmsNumber of CoresNumber of NodesQueue SizeMRT
Round-Robin247009,208,937
Round-Robin227006,561,712
Weighted Round-Robin447005,870,973
Round-Robin445009,201,967
Weighted Round-Robin4250039,584,223
Weighted Round-Robin445005,969,696
Weighted Round-Robin2470098,485,536
Weighted Round-Robin2270075,990,773
Round-Robin245009,259,595
Round-Robin427009,046,203
Round-Robin2250049,746,342
Weighted Round-Robin225005,652,527
Weighted Round-Robin2450092,825,589
Round-Robin425009,160,168
Weighted Round-Robin427009,059,349
Round-Robin44700901,238
Table 4. Fixed input parameters used to feed the model.
TypeComponentTime (ms)# Queue Size
Station with QueueAccess Point21000
Fog Nodes10250
Public Cloud (VMs)10250
Private Cloud (VMs)30100
Delay StationDelay Edge-Gateway 16x
Delay Edge-Gateway 212x
Delay Edge-Gateway 324x
Delay Edge-Fog100x
Delay Edge-Private Cloud500x
Delay Edge-Public Cloud2000x
Table 5. Explored scenarios in the analysis of the load balancing algorithms.
Weight
ScenariosLoad Balancing StrategiesPublic CloudPrivate CloudFog
RRRound-Robinxxx
WRR-AWeighted Round-Robin321
WRR-BWeighted Round-Robin123
Table 6. Configurations of the computing layers for the performance trade-off analyses.
Cores
ScenariosPublic CloudPrivate CloudFog
I884
I I 16168
I I I 242412
Publisher’s Note: MDPI stays neutral with regard to jurisdictional claims in published maps and institutional affiliations.

