1. Introduction
In recent years, many products have been developed for AMI (Advanced Metering Infrastructure) [
1], SCADA (Supervisory Control And Data Acquisition) [
2], HAN (Home Area Network) [
3] and IoT (Internet of Things) systems. However, there is a lack of devices working at the edge of those networks that concentrate data and create datasets for managing and monitoring electrical grids. At the Department of Radio Communication Systems and Networks, at the faculty of Electronics, Telecommunications and Informatics of the Gdańsk University of Technology is being realized the project entitled “Power data concentrator with innovative decision functionality and gate functionality in AMI, SCADA, HAN, IoT environments” with the acronym KODEŚ [
4]. This project is realized with strong cooperation with DGT company which is a Polish producer and integrator of modern ICT systems. The aim of the project is the development of the data concentrator that enables the work of AMI systems at the interface of SCADA, HAN and IoT for energy networks. The KODEŚ concentrator will be equipped with elements capable of making independent decisions at the networks interface (edge computing), gateway functions in terms of DNP3/DLMS (Distributed Network Protocol version 3/Device Language Message Specification) and the innovative multilink algorithm enabling automatic choice of the radio communication link based on the transmission quality and the purpose of the interfaces. The device presented in this paper is prepared to work in electric networks; however, such a device can merge different technologies and data from other fields, e.g., in harbors or sea vessels where many different communication devices and technologies are used.
KODEŚ device is equipped with two commercially available radio modules. The first one is the NeoWay N27 module to cover NB-IoT (Narrow Band Internet of Things) technology. The second one is Quectel RM500Q-GL which enables, among others, radio communication in LTE (Long Term Evolution) cellular network. The data concentrator will decide which communication interface should be used for particular data, based on the importance and the amount of this data. To make such a decision there must be also knowledge about the present quality of a particular communication link. Obviously, a communication link is strongly connected with available communication interfaces in the KODEŚ device. In this paper, the authors are interested in ways of forecasting if a packet of data can be sent via radio interfaces working in NB-IoT and LTE technologies. As KODEŚ is planned to be a commercial product, it was decided to integrate with KODEŚ available commercial radio modules, to make it less expensive. Hence, there is a lack of possibility to perform signal processing. Nevertheless, utilized radio modules measure standardized quality parameters of received signal called also Key Performance Indicators (KPI), such as RSRP (Reference Signal Received Power), RSRQ (Reference Signal Received Quality), SINR (Signal to Interference plus Noise Ratio), RSSI (Received Signal Strength Indicator), MCS (Modulation and Coding Scheme) and CQI (Channel Quality Indicator) [
5,
6].
In this paper, the authors proposed a decision algorithm (called Multilink—ML) for link quality monitoring which allows forecasting if a particular connection is working (packet sent through this connection will be successfully received). The ML algorithm is based on quasi-real-time measurements in a real cellular network (LTE and LTE NB-IoT).
The possibility of the transmission quality estimation is important for adjusting transmission parameters to maximize the effectiveness of resource utilization. KPI parameters are mainly utilized by a network to realize the handover procedure [
7,
8,
9,
10]. A different utilization of signal quality parameters is presented in [
11] where authors compare a couple of machine learning algorithms to estimate throughput in the LTE system. Worth mentioning is that the resulting probability of correct estimation in [
11] is similar to that one we achieve for the LTE system, while our algorithm needs less computational power. Another difference in approach in [
11] presented in this article, emerges from the measurement stand. We use a commercial radio module, without specialized measurement applications and devices, which makes our solution more suitable for developed data concentrator KODEŚ. KPIs may also be used to estimate network load [
12,
13]. In [
12], measurements were done by RF scanners. In [
13], presented results gathered by a commercial smartphone and Nemo device. In the paper [
14], authors cover the issue of cell reselection based on RSRP and RSRQ values measured by an RF scanner; however, compared to bars shown by iPhone 5. In [
15], the authors present RSRP, RSRQ and SNR measurements for LTE for different cellular operators. Those measurements were done with the utilization of the G-NetTrack Pro app. Unfortunately, these measurements are not compared with real transmission quality. In [
16], the authors used the build-in cellular modem signal parameters measurement mechanisms to research the correlation between achieved download speed, upload speed, latency, jitter and KPIs available in LTE. Despite interesting analysis, those results are insufficient to build our multilink algorithm.
NB-IoT is an emerging technology well suited for wireless IoT end devices [
17,
18]. There is a wide range of possible applications. Most common are those connected with the smart cities field [
19], especially with energy grids [
20] also for monitoring marine energy generation [
21]. However, NB-IoT may be utilized in other areas of the economy for example in agriculture [
22]. In literature are analyses of NB-IoT coverage [
23,
24] and performance in selected environments. Those research suggest that NB-IoT is very robust even in deep indoor, so the choice of NB-IoT for our data concentrator became obvious. Nevertheless, there was a need to conduct own measurements to implement mentioned before multilink algorithm.
This paper is organized as follows: in part 2 there is a description of the developed data concentrator KODEŚ. Part 3 covers the measurement stand. Consecutive parts present results accordingly for NB-IoT and LTE.
2. Realized Data Concentrator Device—KODEŚ
KODEŚ is an intelligent device, supposed to work as a sophisticated, specialized NB-IoT router and data concentrator realizing edge computing within the boundaries of the network. It is going to enable connection, scheduling, selection and optimization of the quality of data transmission between wireless and wired interfaces for AMI systems, SCADA, HAN and IoT. The proposed concentrator will be equipped with specialized functions. First of all, there will be a decisive function (DF) as part of edge computing whose aim would be the detection of malfunction and undesirable states of the energetic network, to improve the response time of service. This is especially important in a situation when there is no connection with the management center due to e.g., terrorist act. DF will make a decision based on information gathered from energy meters, controllers, disconnectors, sensors, predictions and known profiles of work of energetic network elements. Another important functionality would be a gateway function (GF) which would allow to convert data streams between different protocols according to the specification of a given network, act as a data concentrator, control the network and work as a specialized router for WWAN (Wireless Wide Area Network) interfaces. To support the last functionality, in KODEŚ must be implemented a multilink functionality (MF), a decisive algorithm to choose the most appropriate radio network for transmission based on the state of the network, the priority of transmission and required quality.
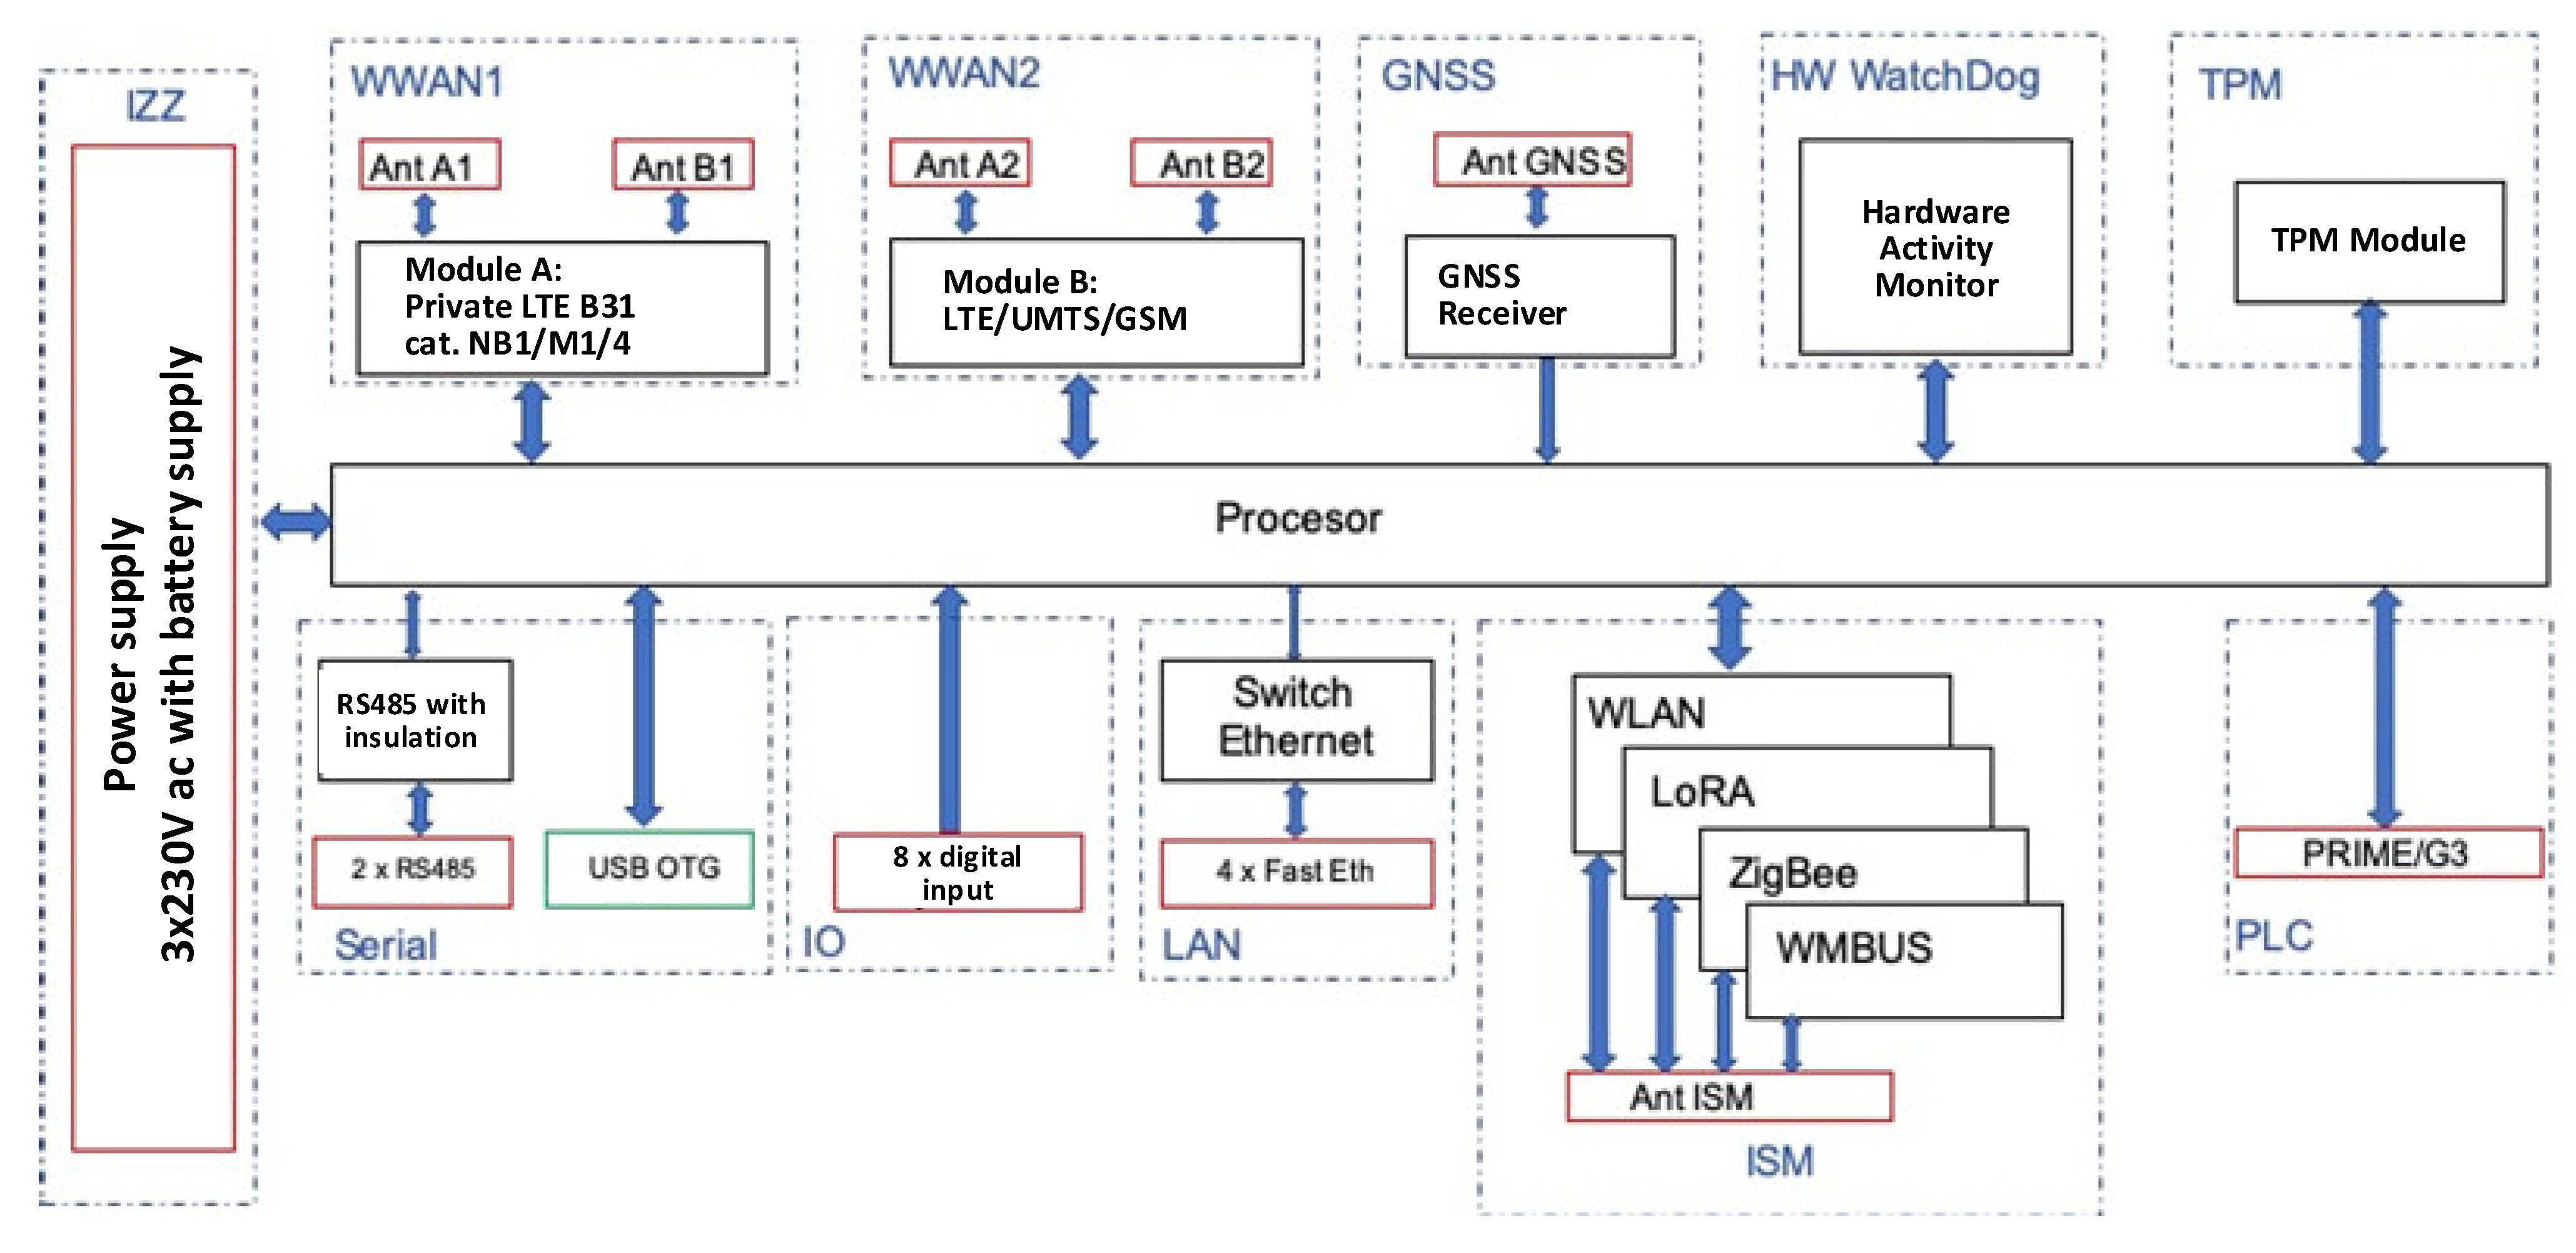
Figure 1 presents the block diagram of the KODEŚ device which was described in detail in article [
4]. As was mentioned before, realized data concentrator needs to support interfaces that can work in different networks.
For this reason, in the KODEŚ device, many interfaces are provided. Some of them can support a connection in different technologies e.g., ISM, Serial and WWAN. The data concentrator has to periodically analyze the state of all provided interfaces to decide which of them is the most suitable to send user data. The authors of this paper are mostly interested in WWAN interfaces, that support all fully functional cellular networks. As for purpose of machine-to-machine communication in a deep indoor environment, NB-IoT technology was developed therefore, the WWAN1 interface is intended to work in this technology. Whereas the WWAN2 may switch utilized technology between GSM, UMTS or LTE, depending on which one can realize transmission with the best quality for a specific application.
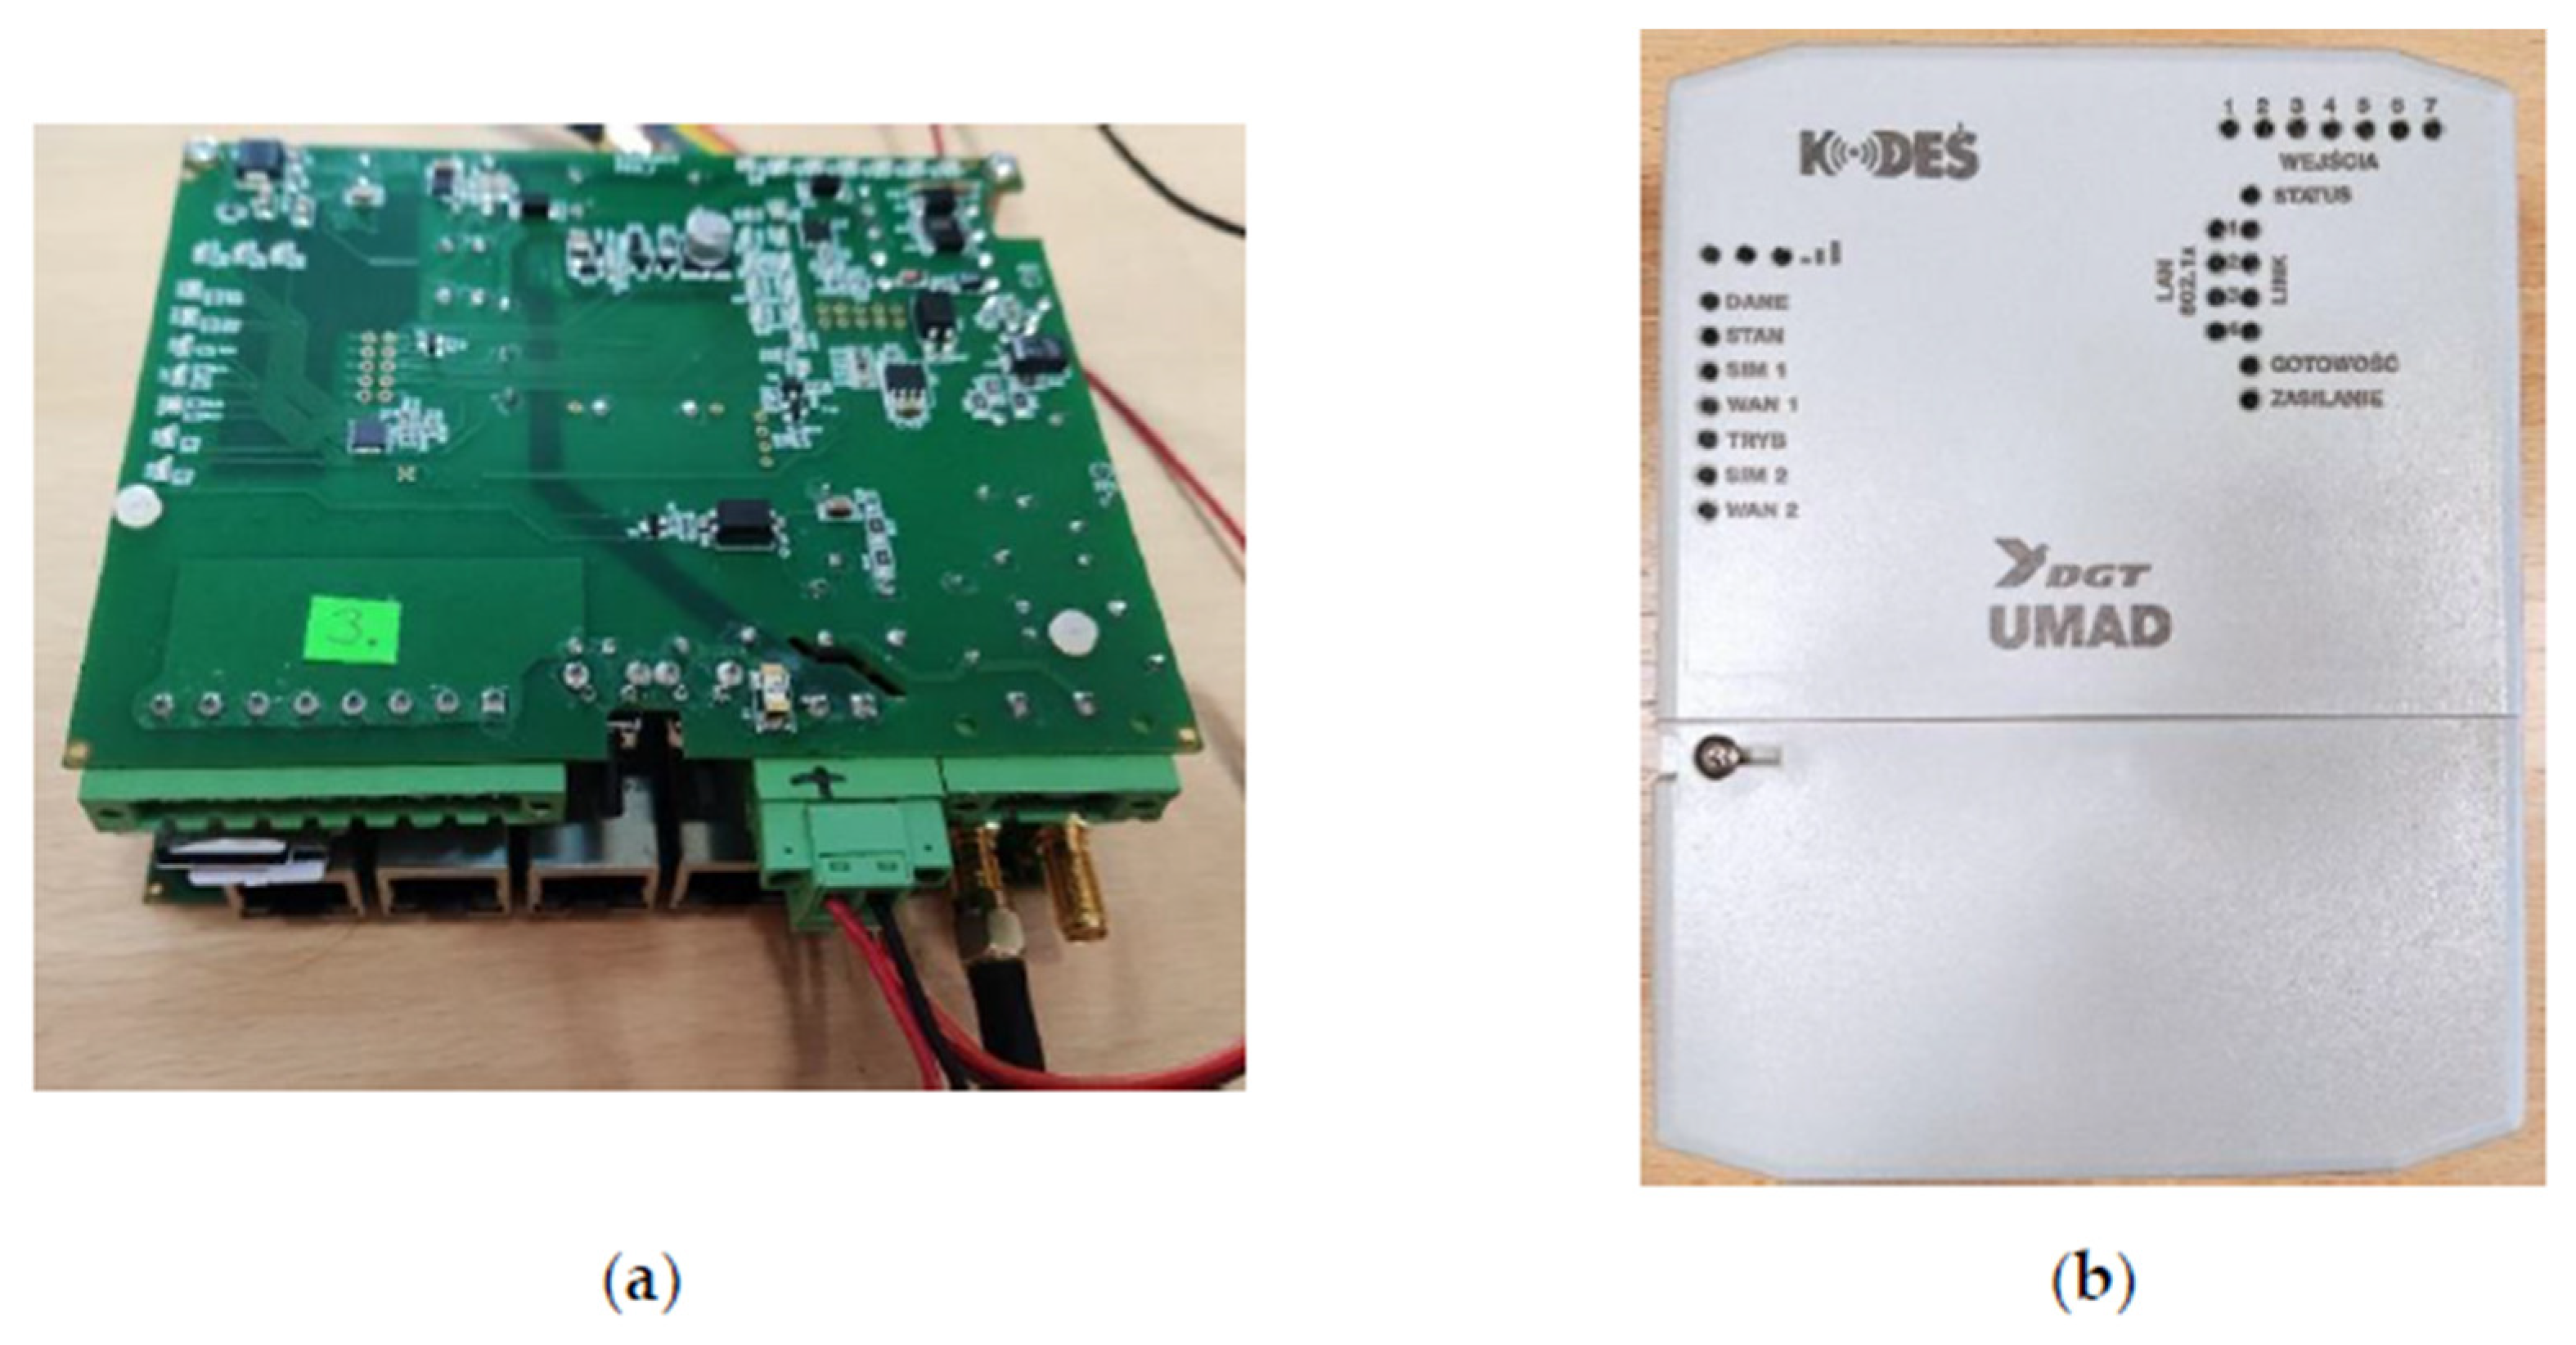
Figure 2 shows the device in cover (b) and without cover (a). In
Figure 2a can be seen two antenna ports, four Ethernet ports, digital input IO, two SIM card slots and a power supply connection.
3. Measurements
To implement the Multilink (ML) algorithm a knowledge of the correlation between values available in particular cellular technology quality parameters and the quality of realized transmission is needed. To gain this knowledge a set of measurements was conducted. In the article [
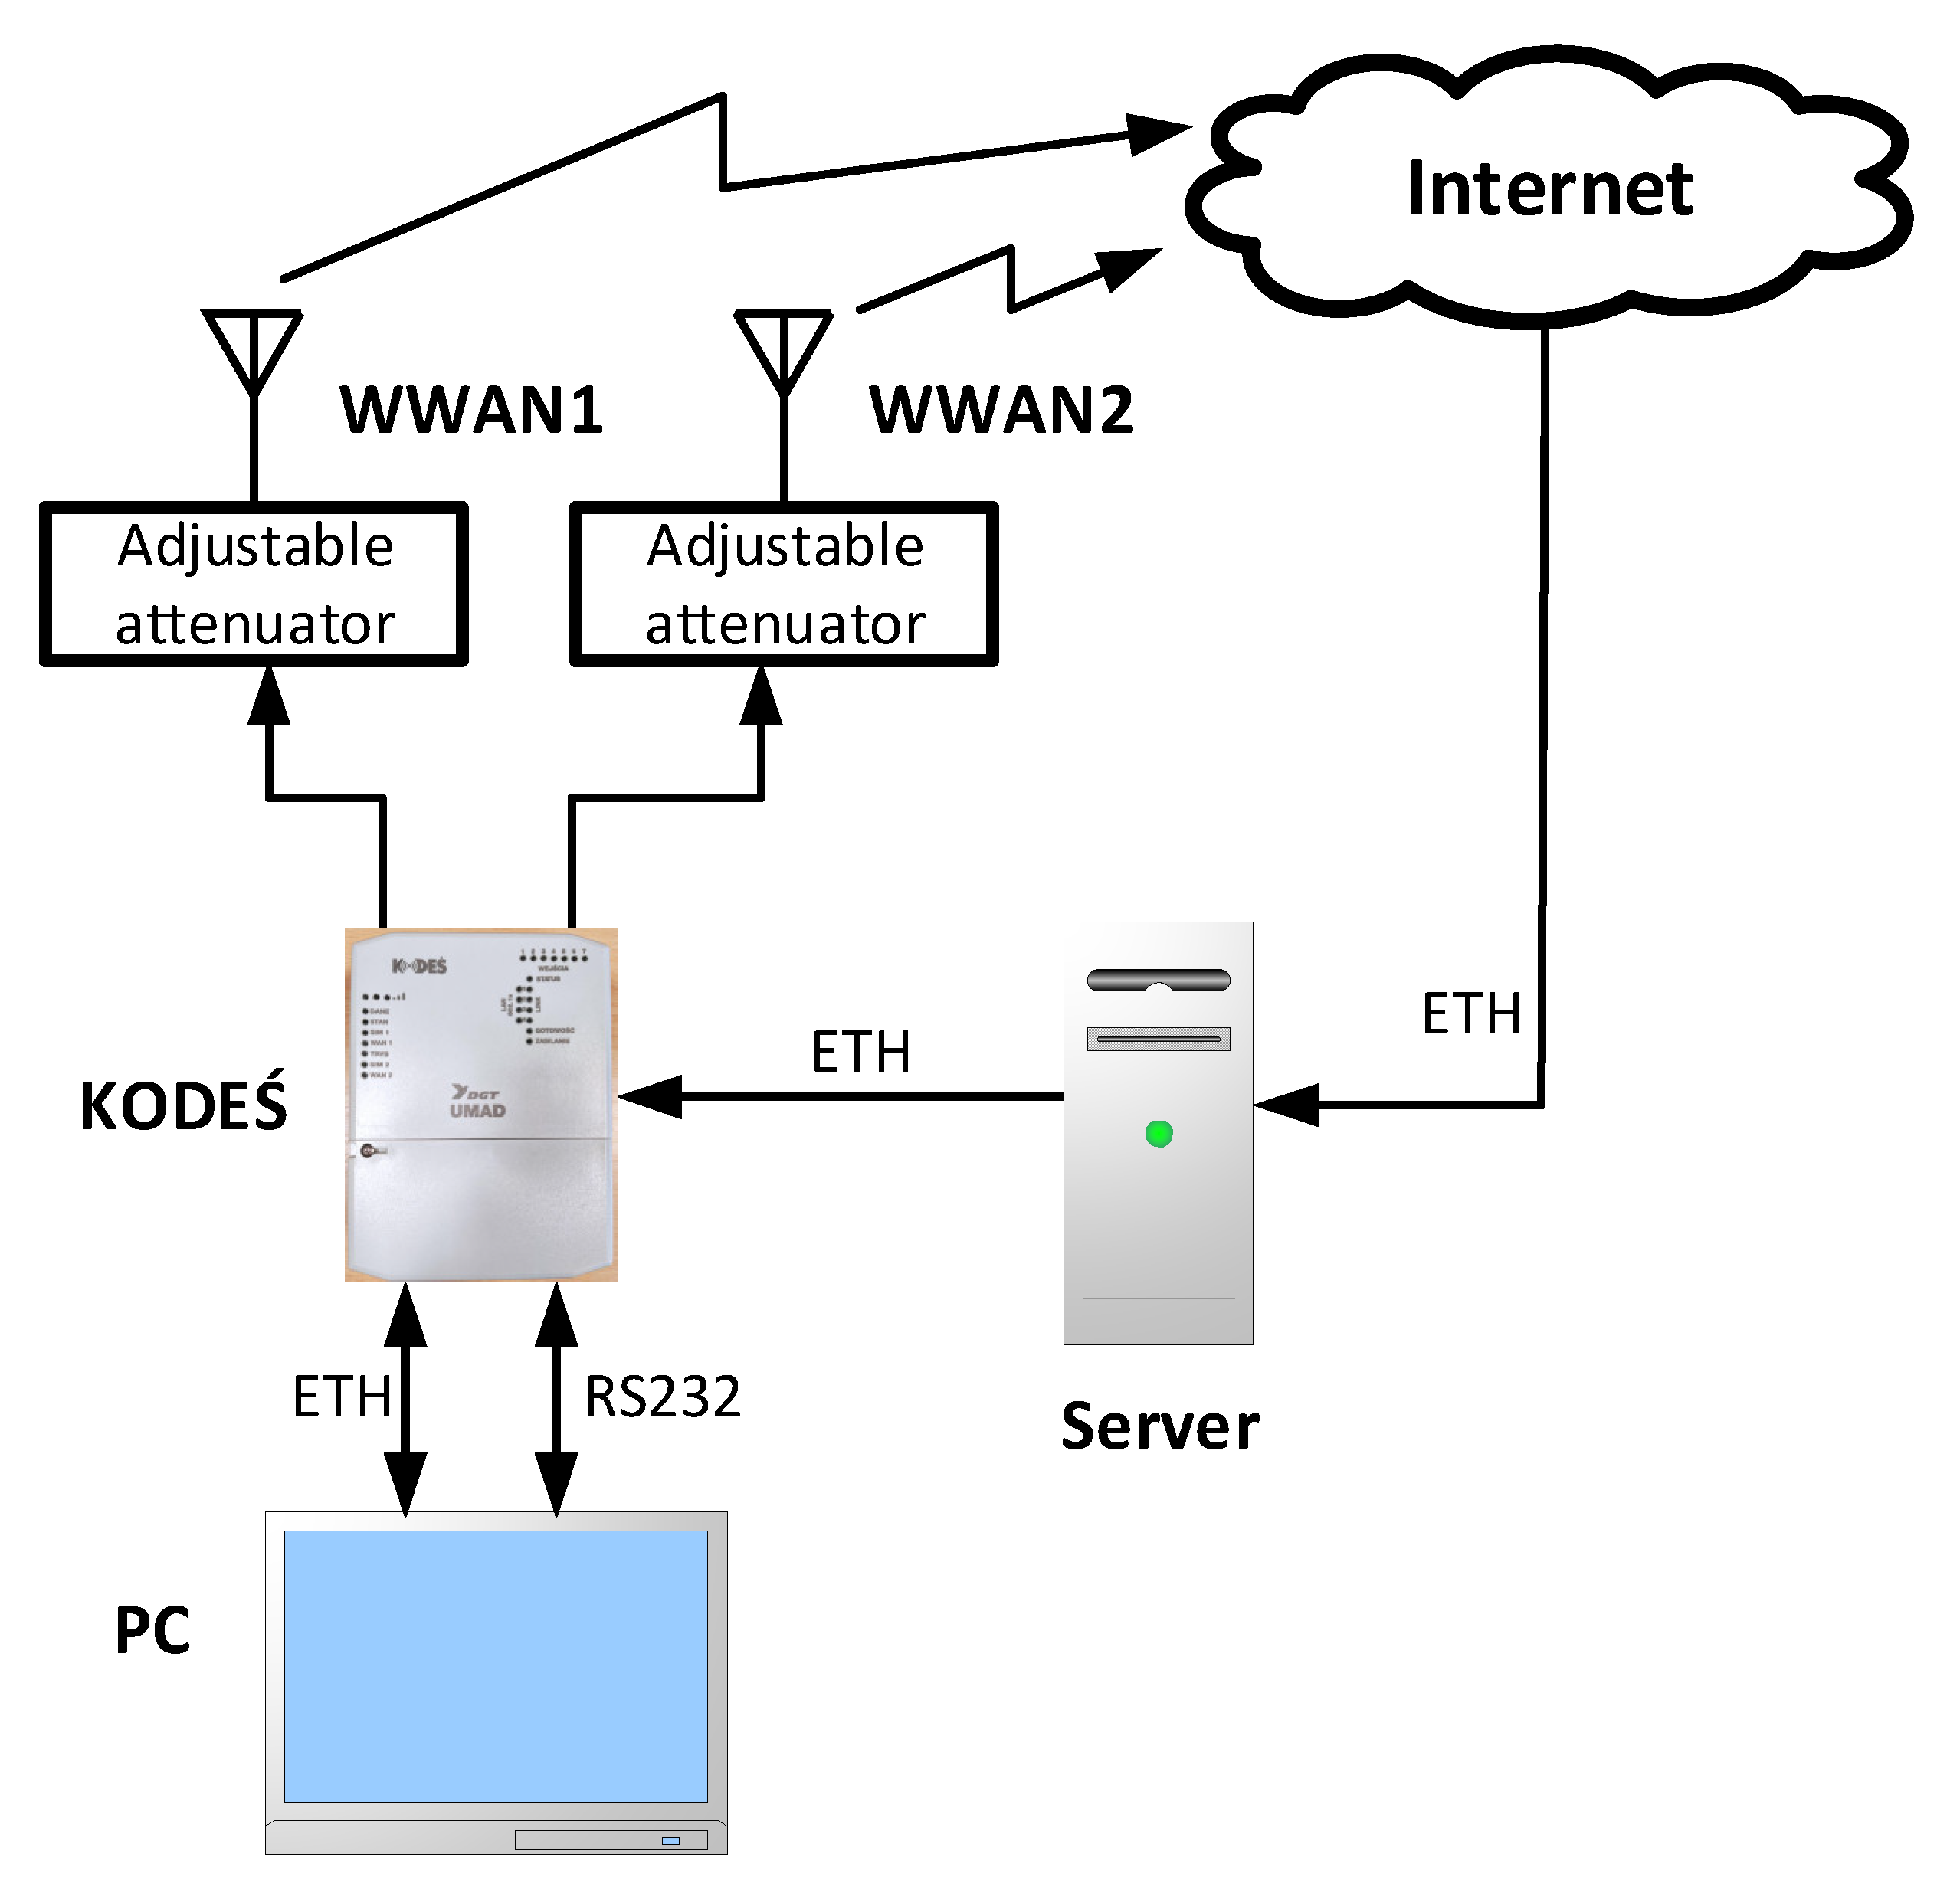
5], the authors presented results and analysis of measurements performed with the utilization of radiocommunication tester Rohde & Schwarz CMW500. As the propagation conditions were controlled during measurements, there could be analyzed the correlation between different quality parameters with BLER (BLock Error Rate). While in the present article authors would like to present results for measurements performed in a real cellular network. For this purpose, a laboratory stand was prepared, and which block diagram is presented in
Figure 3. Presented KODEŚ device is a prototype and needs a PC where a TFTP server is set with data necessary to start the operating system on KODEŚ. It is realized by Ethernet connection. To get access to KODEŚ an RS232 connection is used. The data concentrator is connected via LAN with a Server. This Server has a public IP address and an Internet connection. To change the quality of the received signal for measurement purposes adjustable attenuators were put between WWAN antennas and WWAN interfaces in KODEŚ. Measurements are initialized by the Server in the following steps:
The server prepares UDP (User Datagram Protocol) packet and sends it via LAN to KODEŚ;
KODEŚ redirect this packet to WWAN1 and WWAN2;
KODEŚ reads and saves quality parameters from both radio interfaces;
The packet is sent through both WWAN interfaces to Server on different ports;
Server register time of packets reception;
Steps 1–5 are repeated until the required quantity of packets is sent.
User Datagram Protocol was used instead of Transmission Control Protocol (TCP) as it has not built-in mechanisms to guarantee data reception. Nevertheless, the block error rate could not be measured in described research as there was no access to the physical layer. Moreover, because of the upper layers of the ISO-OSI model, during all measurements, none of the corrupted packets was received. For this reason, the quality parameters’ results of each cellular radio access technology were compared to information if a UDP packet was received in Server. To collect measurements for different environment conditions i.e., quality of the received signal, at the beginning of each measurement adjustable attenuators were set to 0 dB and then the attenuation was gradually slowly increased until a particular radio module lost connection. Then for this module attenuation was turned off (0 dB) and all procedure was repeated. For each measurement, a 3-second timeout was set.
4. Results for NB-IoT
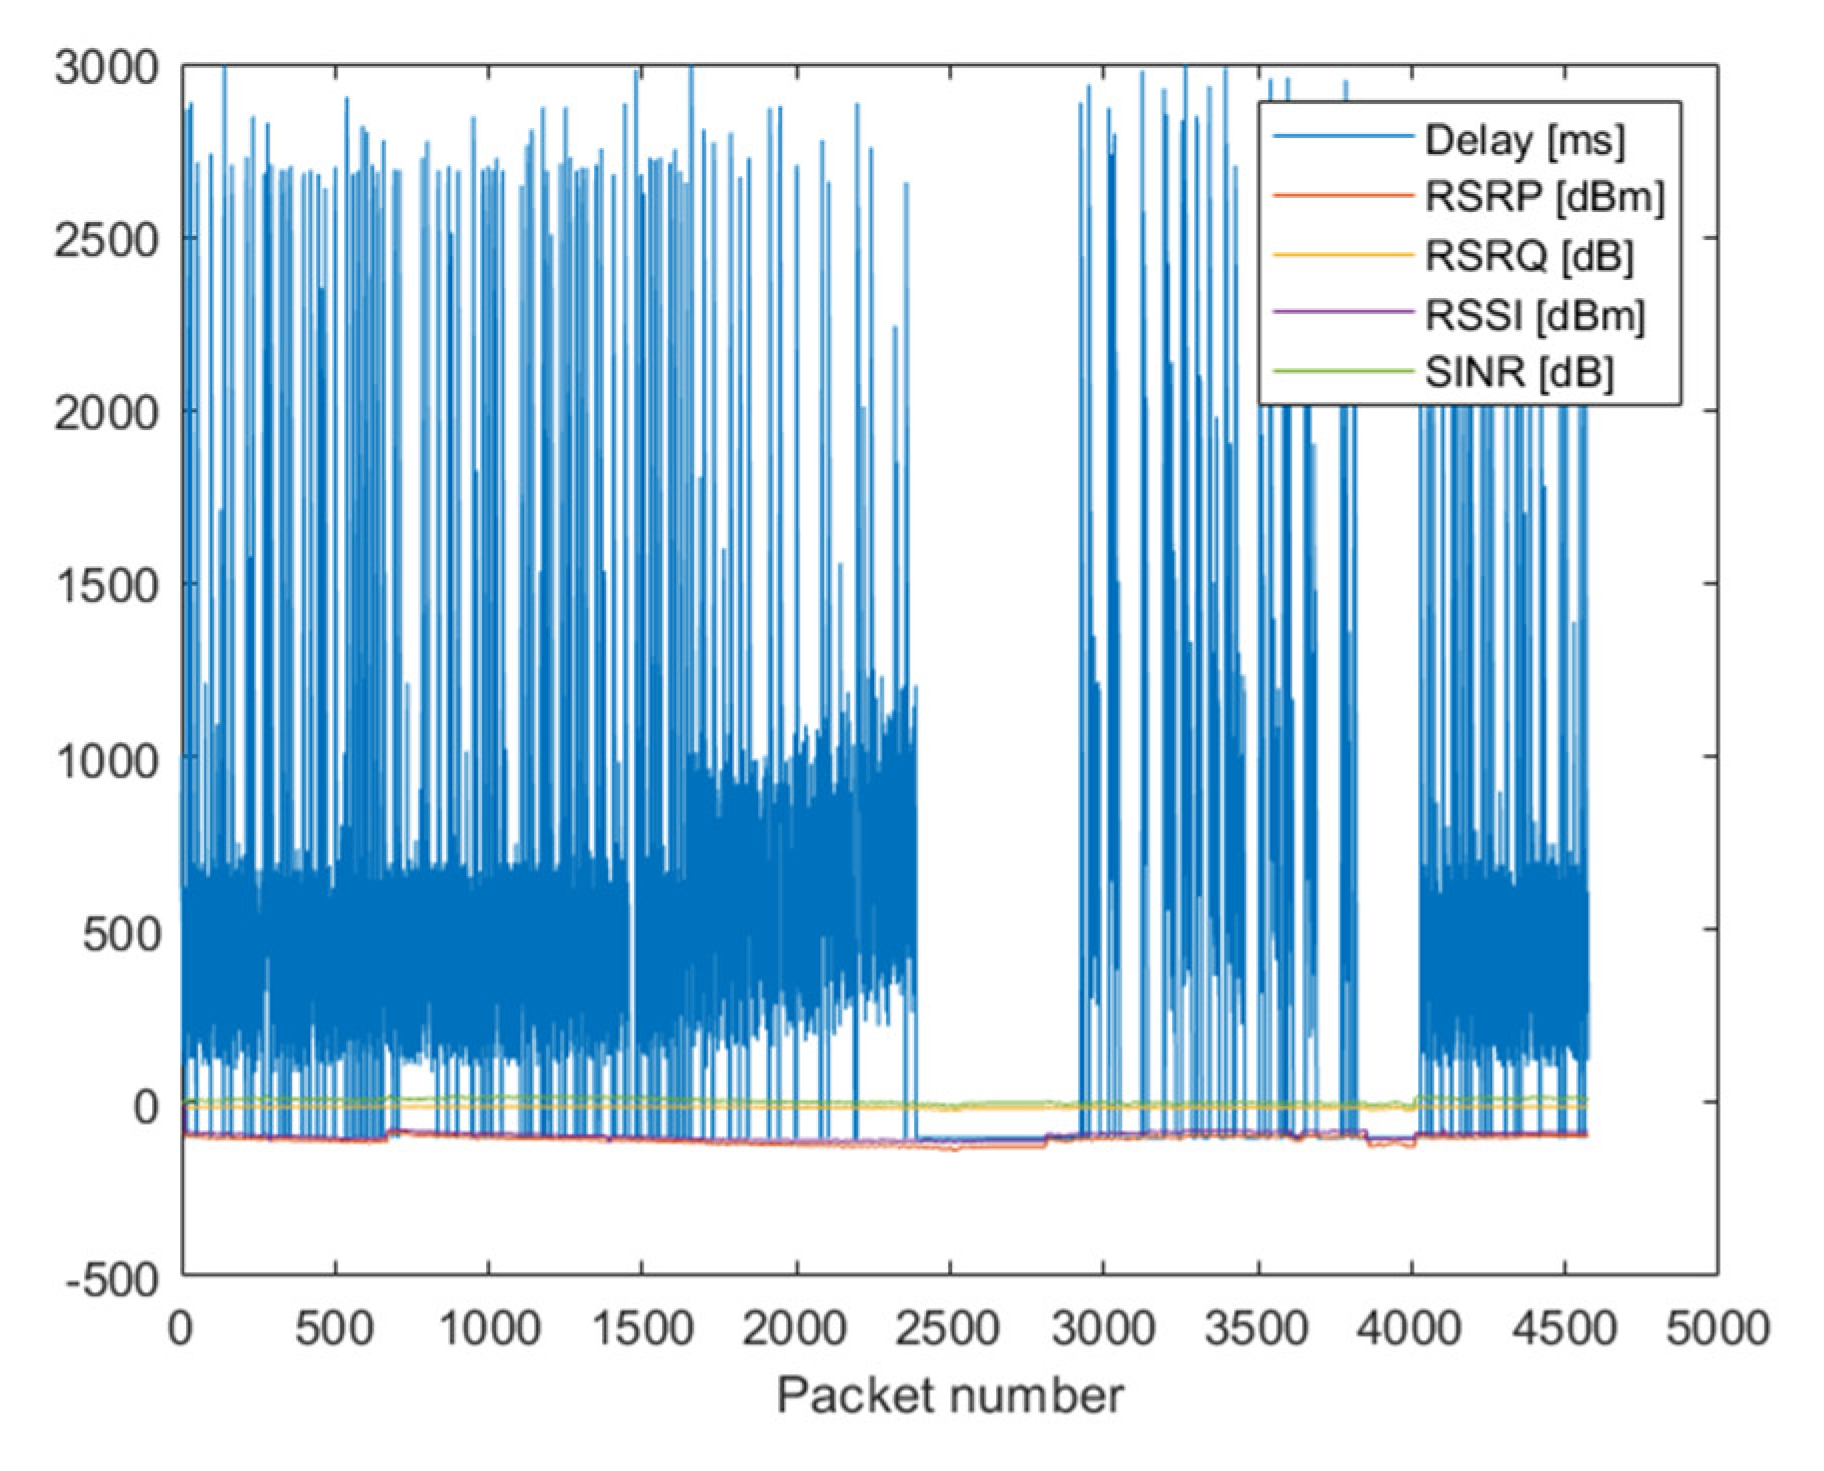
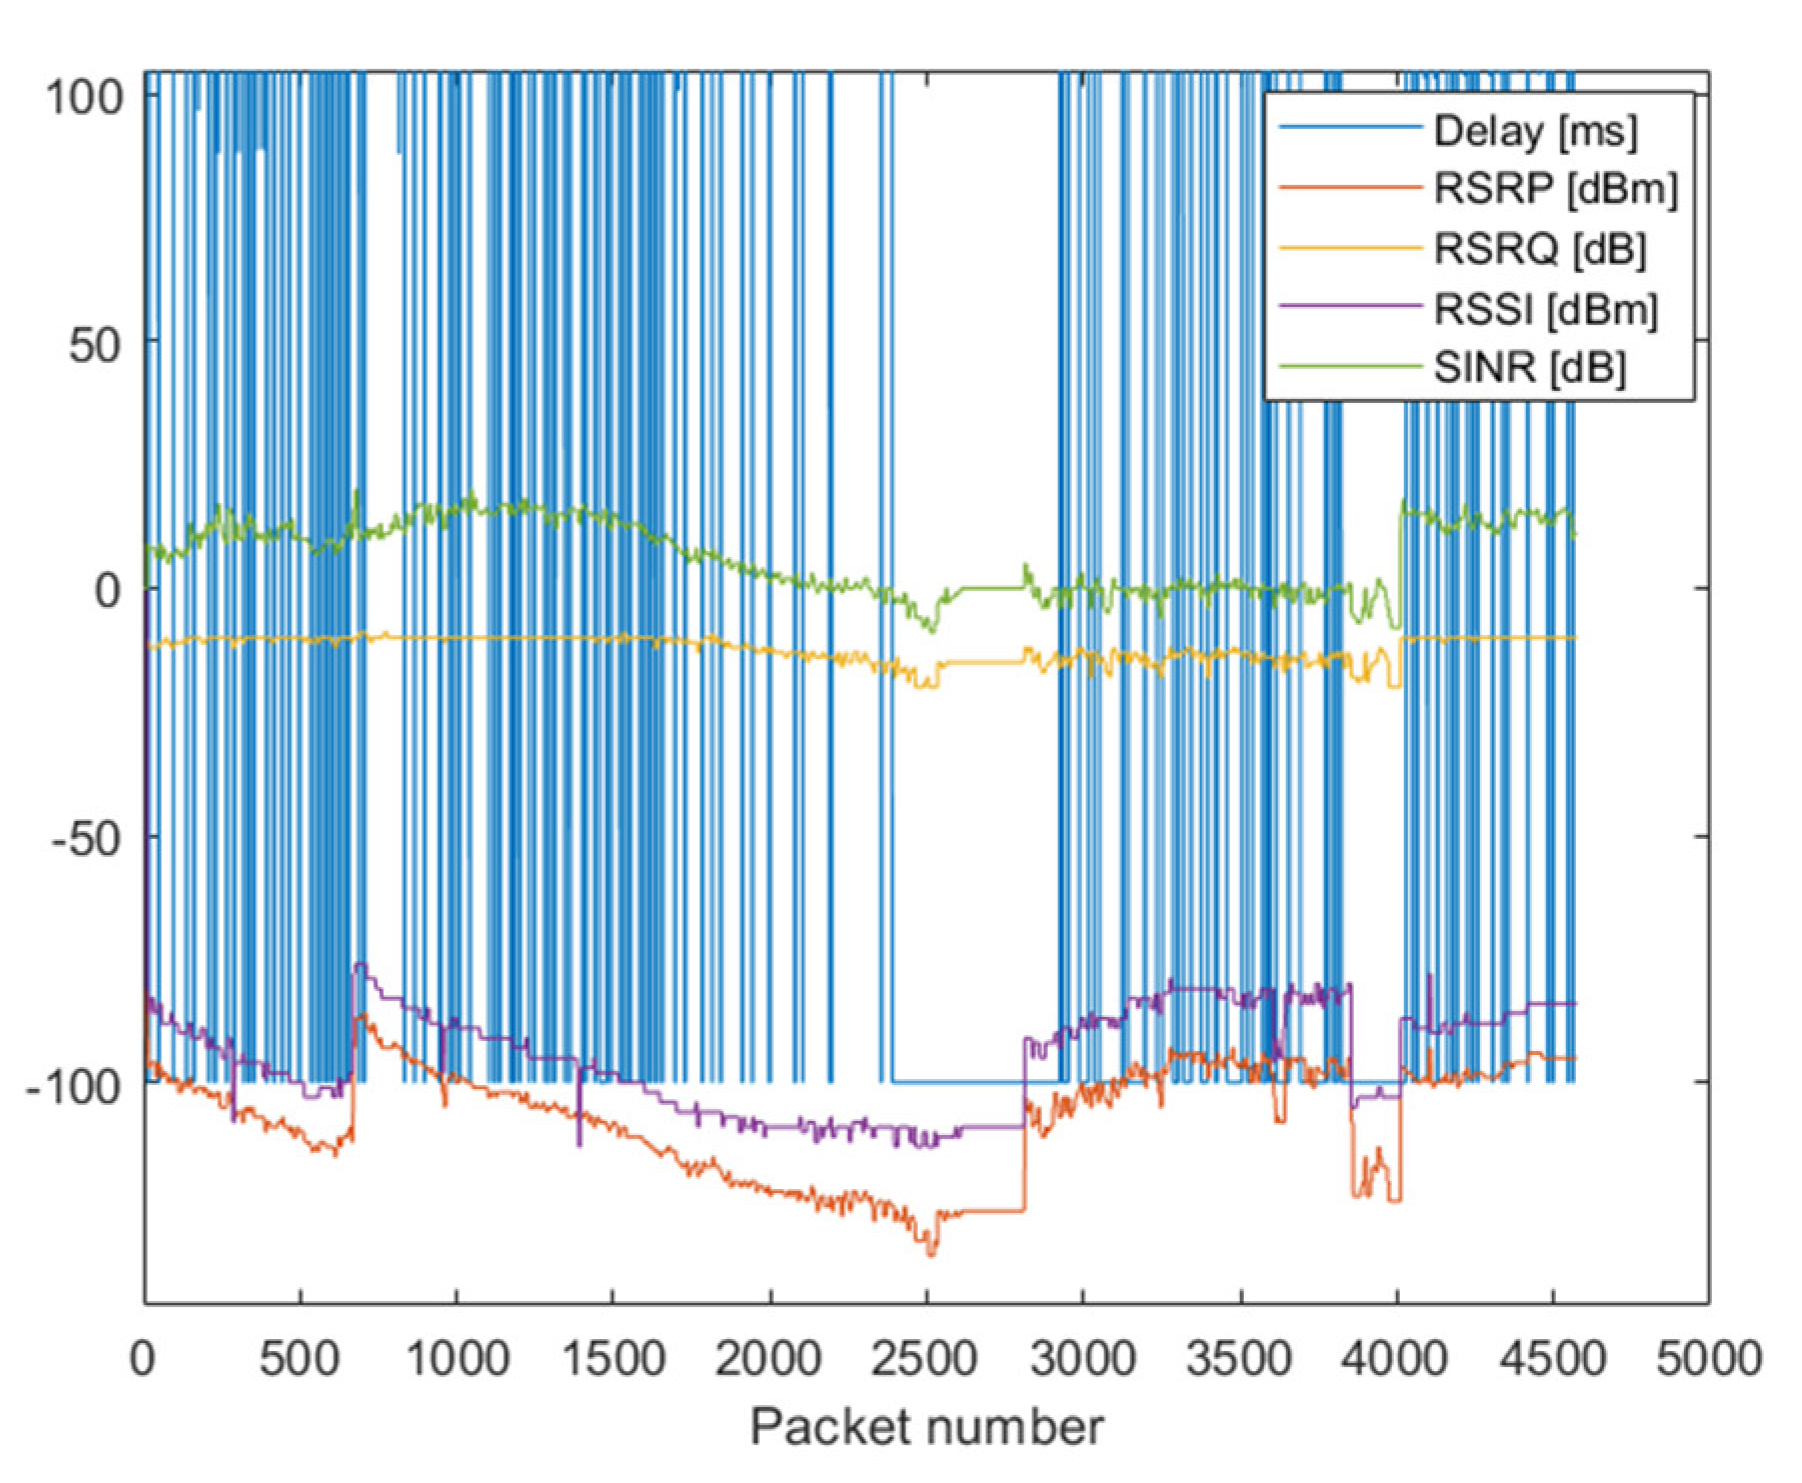
NB-IoT connection in KODEŚ is realized with the utilization of the Neoway N27 radio module. It reports the following signal parameters: RSRP, RSRQ, RSSI and SINR. For NB-IoT technology, 4500 measurements were done—UDP packets were sent from Server. Each packet had 100 bits in length. Simultaneously to each transmission attempt, all reported parameters by the radio module were saved. In
Figure 4 are presented all realized measurements. A delay lower than 0 means that a particular packet was not received. It can be seen that delay values strongly fluctuated; however, the mean value was evidently increasing while the transmission quality deteriorates (adjustable attenuation increased). Due to the high values of the delay,
Figure 4 is difficult to analyze. The scale on ordinate axes was changed and presented in
Figure 5.
In
Figure 5 it can be noticed that due to increased attenuation the RSRP and RSSI parameters decreased, while from the RSRQ and SINR parameters the radio link availability could not be predicted.
The conducted research aimed to develop a multilink algorithm. Multilink must decide, based on the knowledge of RSRP, RSRQ, RSSI and SINR values, if the NB-IoT is suitable for transmission. From
Figure 5 it can be concluded that if values of particular parameters will be lower than some threshold, multilink must decide that the link is not available. To find those thresholds for each possible configuration of quality parameters the probability of correct decision and a probability of false positive decision were calculated for different values of thresholds. The correct decision is calculated as:
where
is the number of correct decisions and
is the number of all made decisions. The false positive decision means that the multilink algorithm considered the link as reliable when the packet could not be received—
is the number of such situations:
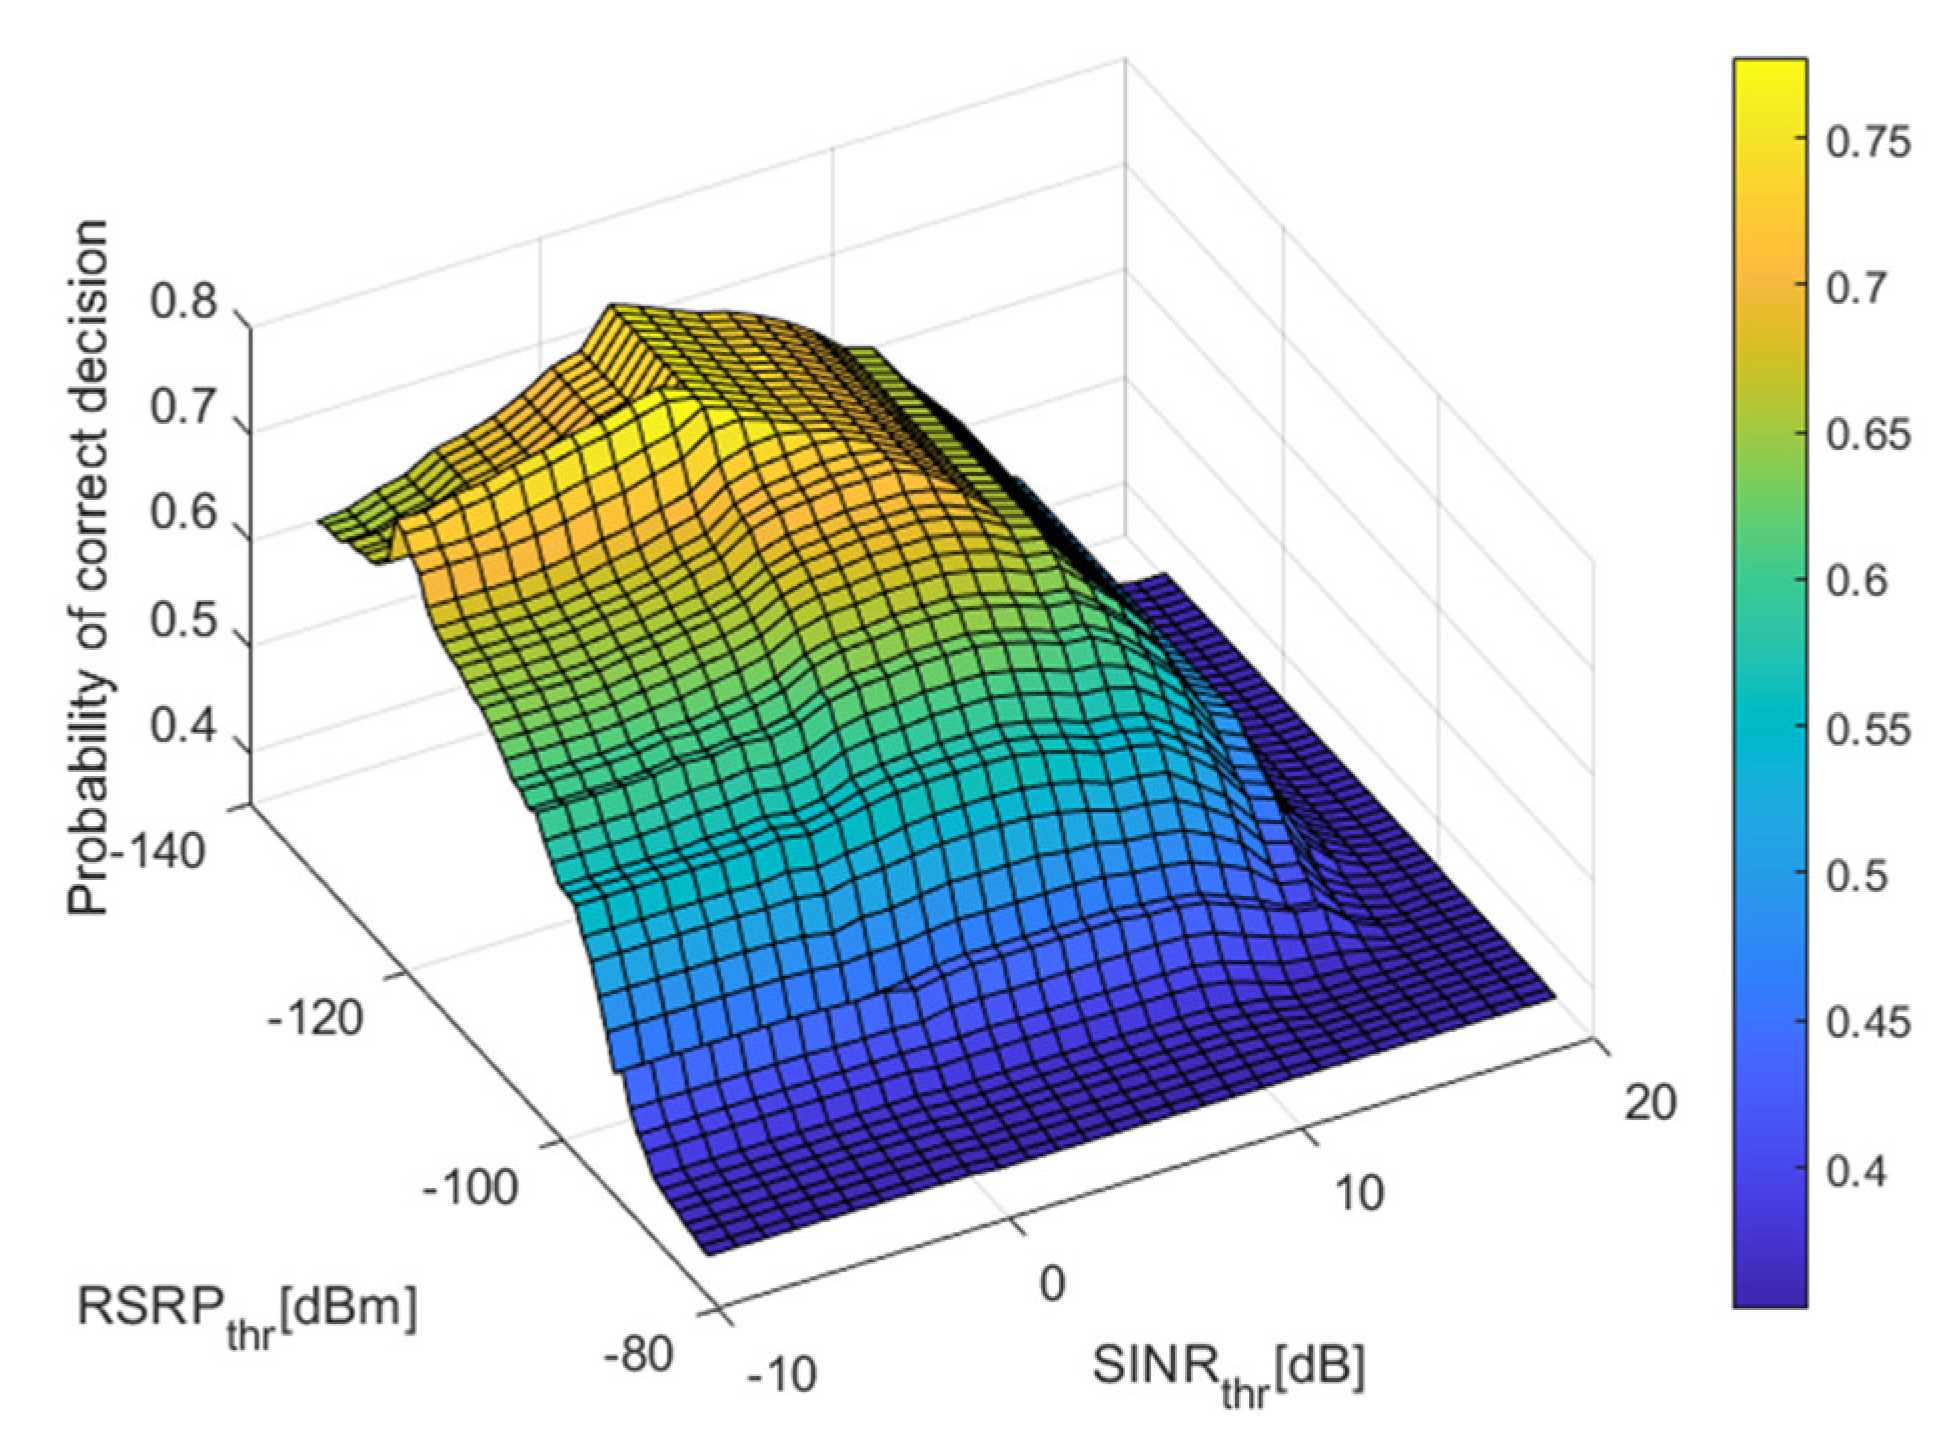
Threshold values for each quality parameter should maximize the probability of a correct decision. However, as constructed data concentrator has two WWAN interfaces, the worst case is when the multilink algorithm will decide to send a packet via an inefficient link. Therefore, thresholds must be chosen such that the probability of a false positive will be the lowest. As this probability does not cover the mistake when the algorithm decides that the link is inefficient while transmission could be realized with success, both probabilities ( and ) must be analyzed simultaneously and compromised values must be chosen. Moreover, as KODEŚ has implemented more interfaces than one, the authors decided that particular link quality must be evaluated with a probability not less than 70% and the probability of a false decision should not be greater than 30%. Therefore, we looked for the highest value of and the lowest value of . It was found that the multilink algorithm should decide that the NB-IoT connection has enough quality for transmission when:
RSRP −125 dBm and
RSRQ −20 dB and
RSSI −114 dB and
SINR 0 dB.
Then the probability of a correct decision is 77.7% and the probability of a false decision does not exceed 18.4%. A probability of correct decision for different threshold values for RSRP and SINR when the threshold for RSRQ was set to −20 dB and the threshold for RSSI was set to −114 dB is presented in
Figure 6 whereas the probability for false positive decision is in
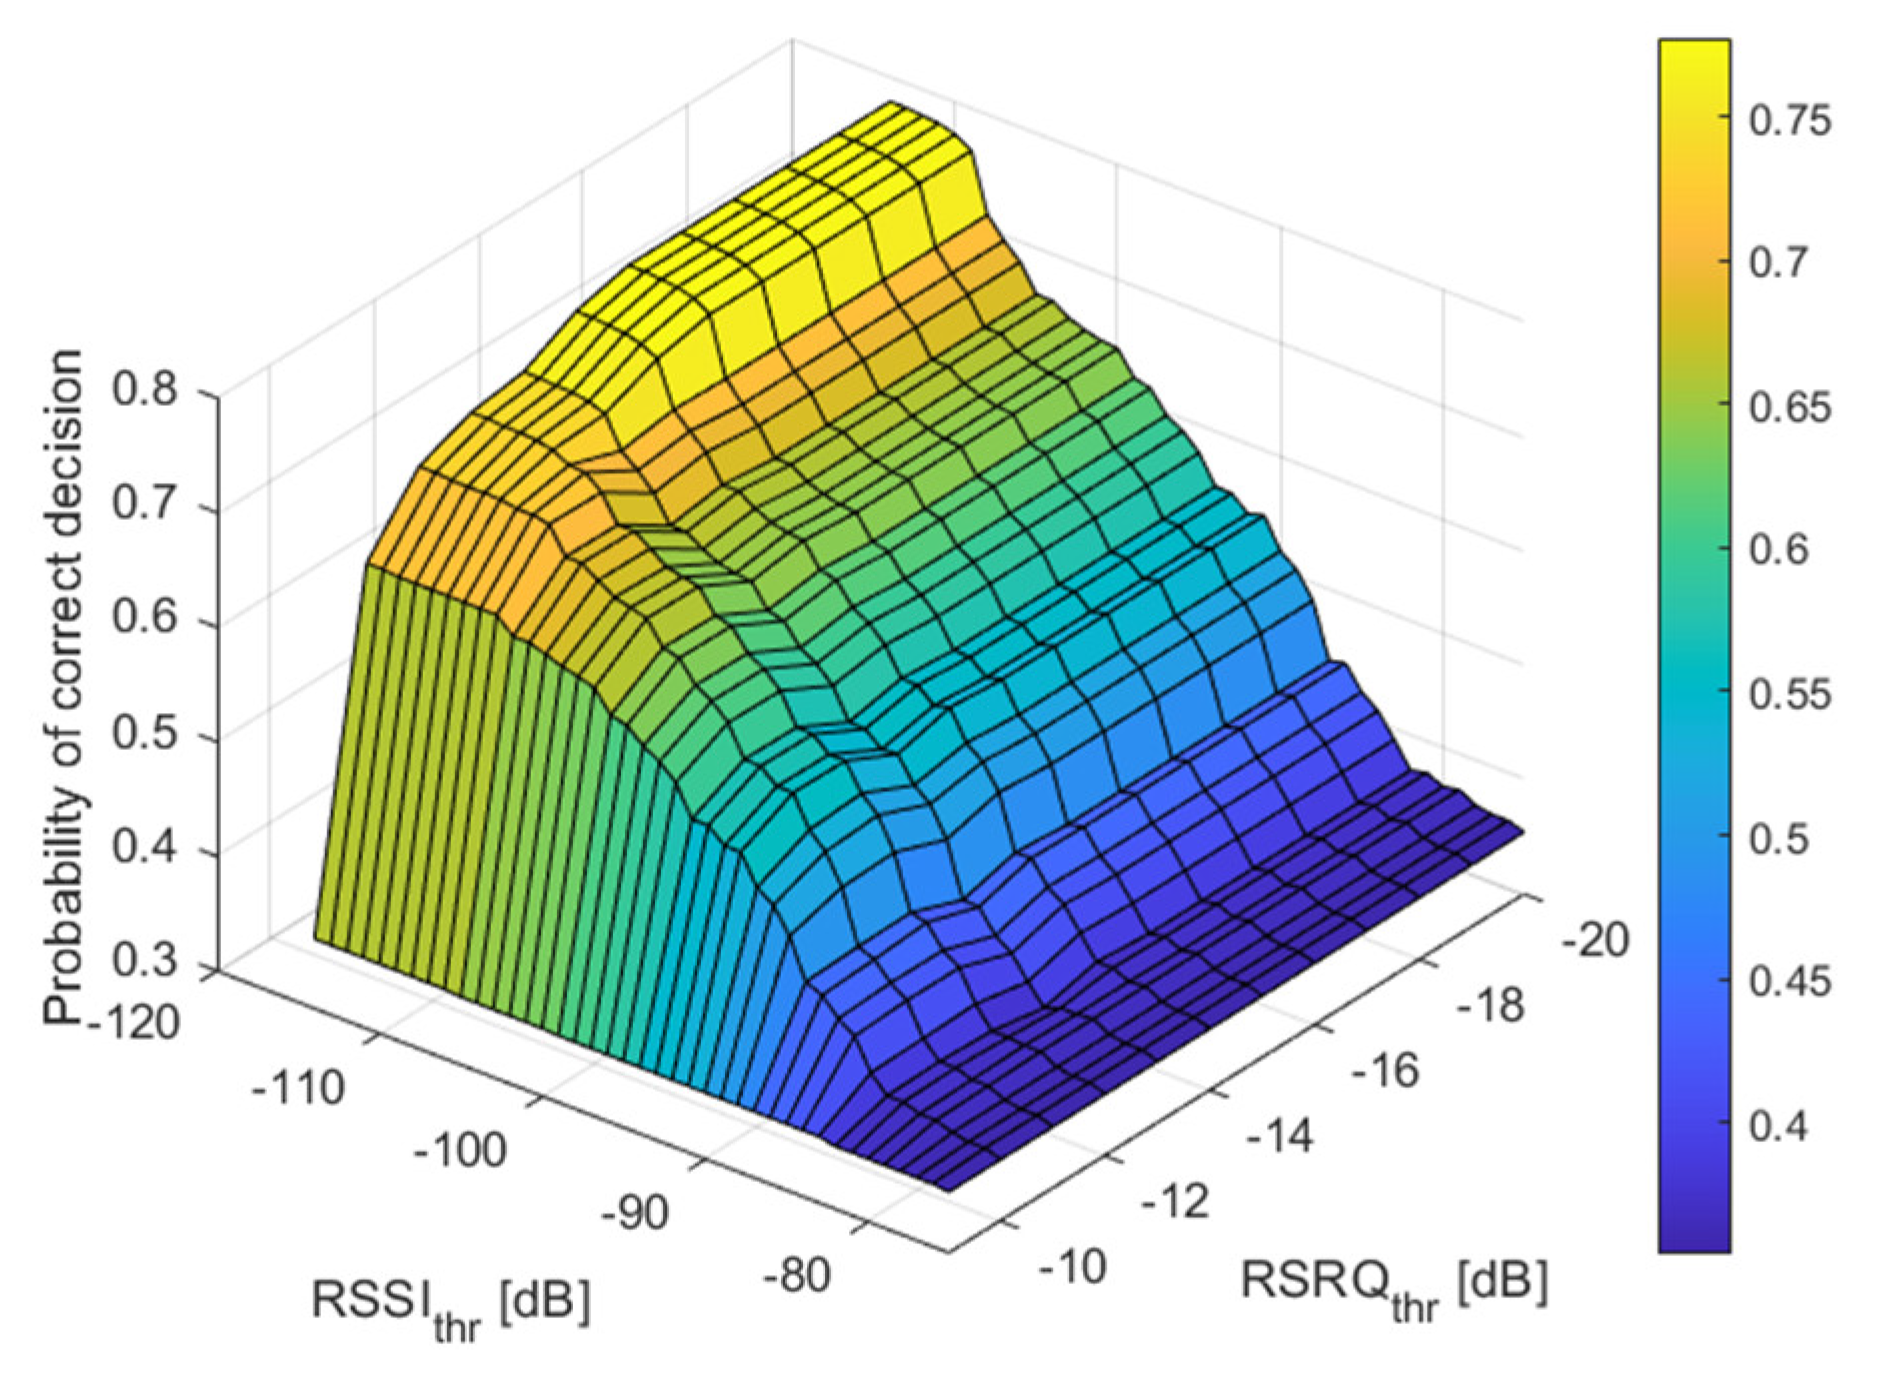
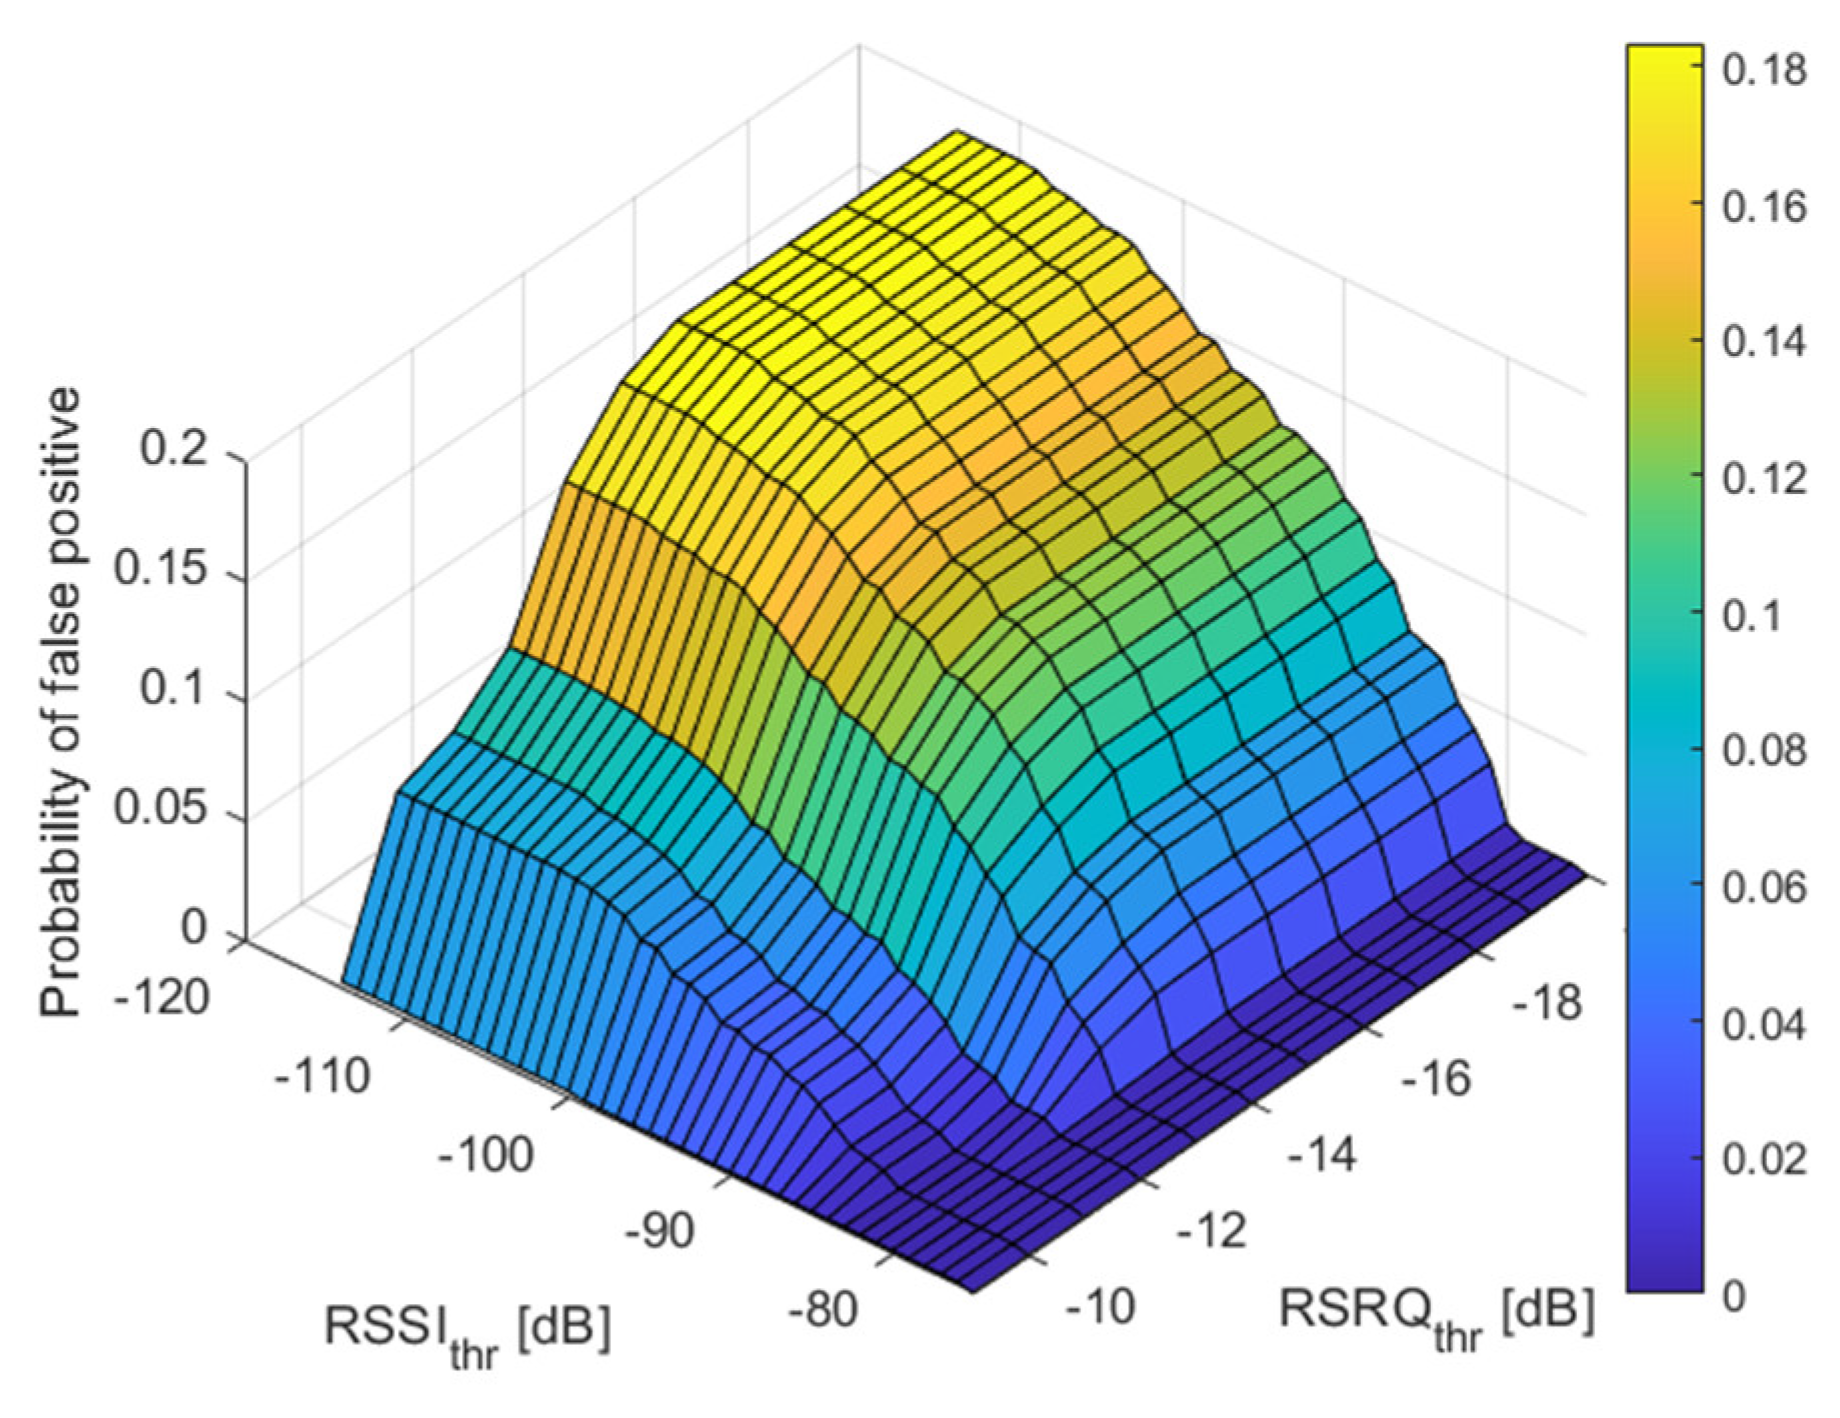
Figure 7. In
Figure 8 the probability of correct decision for different threshold values for RSSI and RSRQ when the threshold for RSRP was set −125 dBm and threshold for SINR was set to 0 dB is presented, while a false positive probability is shown in
Figure 9. The chosen values for those plots are the selected best threshold values for ML algorithm.
5. Results for LTE
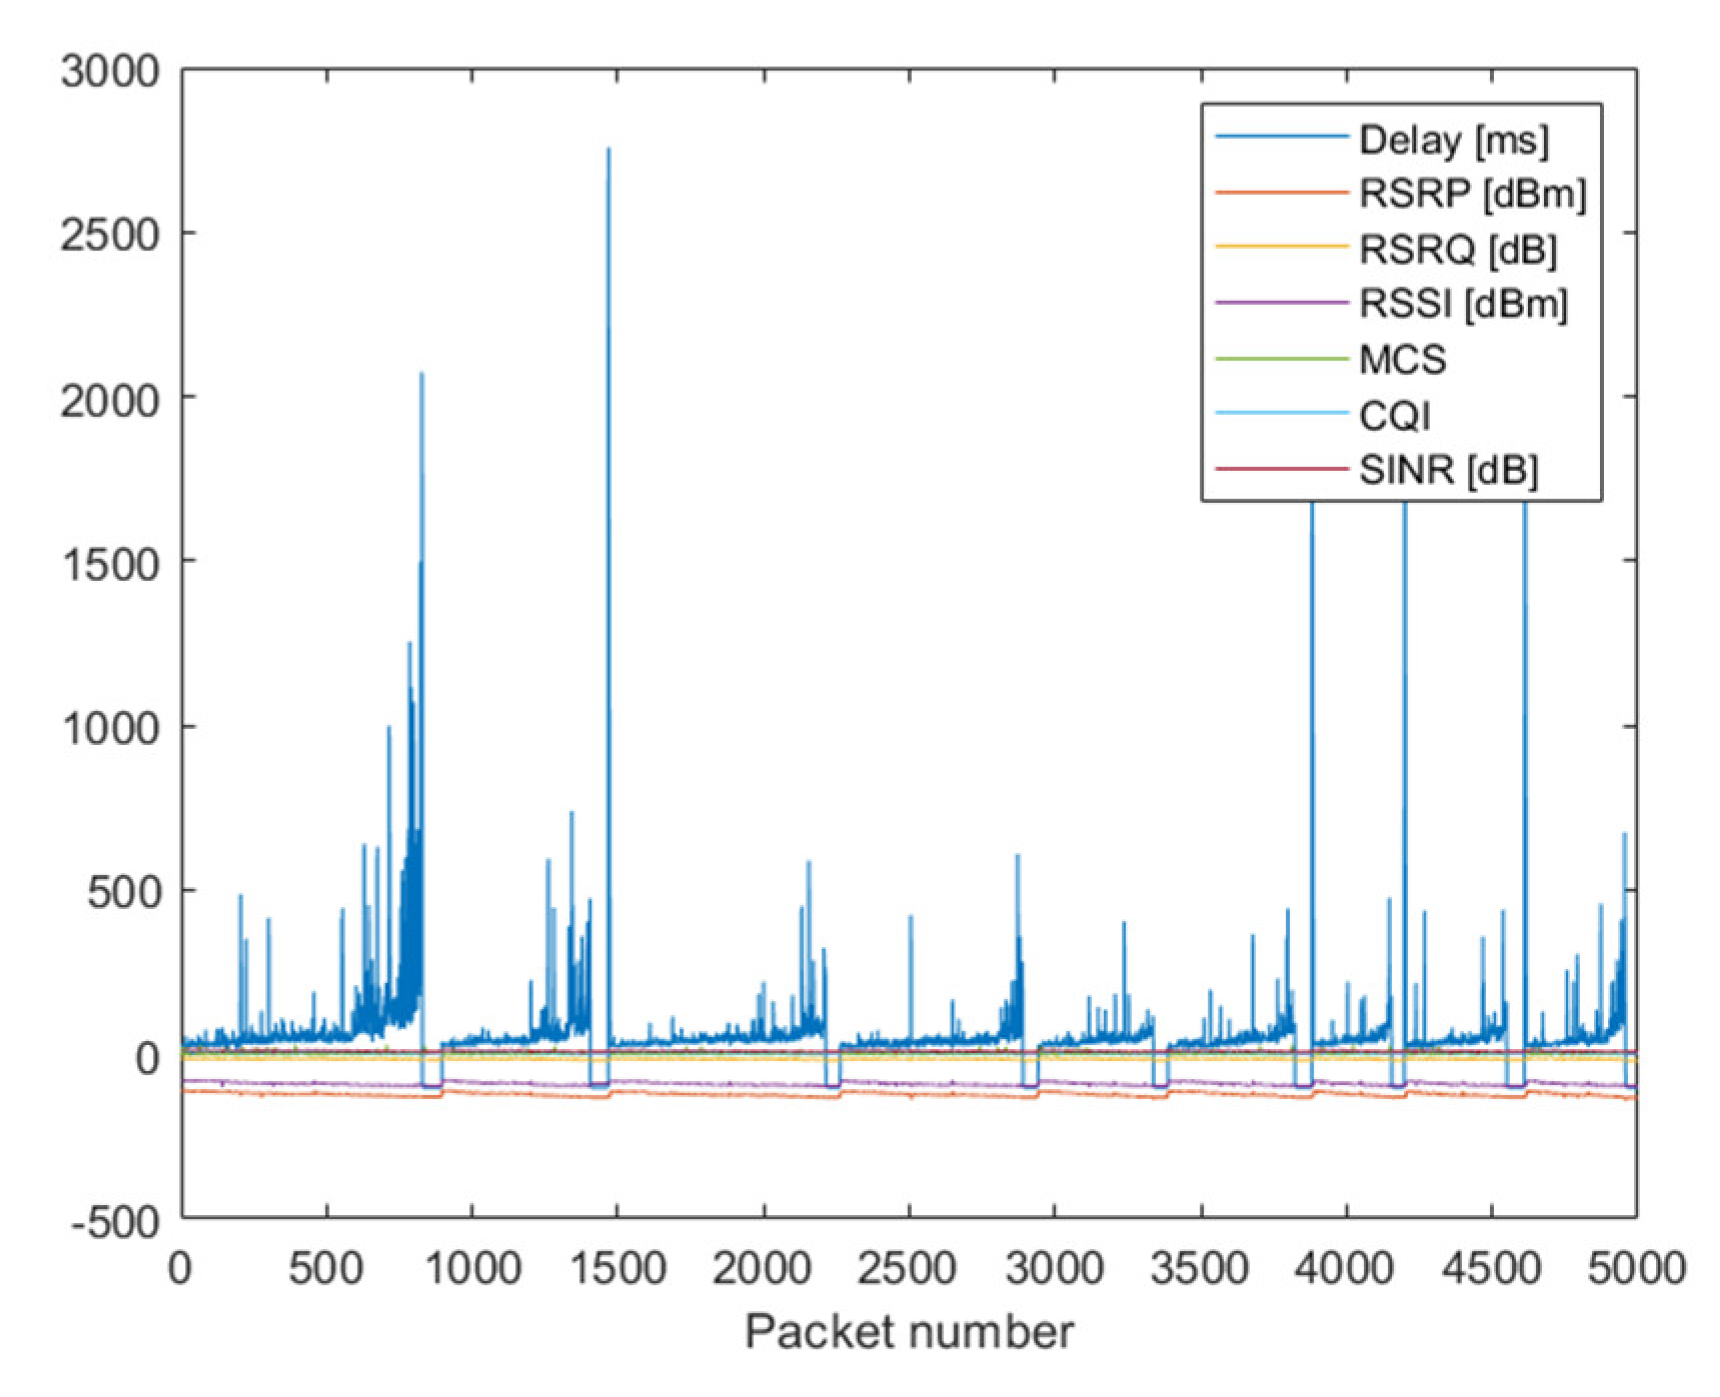
In KODEŚ the LTE technology is utilized in the WWAN2 interface where the Quectel RM500Q-GL radio module is used. This module reports the following values of quality parameters: RSRP, RSRQ, SINR, RSSI, CQI and MCS. Each of those parameters was saved at the time of each realized transmission. During measurements, 5000 UDP packets of length 100 bits were sent. The measurement procedure was the same as with NB-IoT technology. In
Figure 10 are presented all realized measurements. On the plot are presented values of measured delay [ms], RSRP [dBm], RSRQ [dB], RSSI [dBm], MCS, CQI and SINR [dB] for each transmitted packet. A delay lower than 0 means that a particular packet was not received. It is clearly seen that the delay increases as the signal deteriorate—the attenuation increases. Large values of delays at the end of some breaks of transmissions result from the measurements procedures where packets were sent in a predetermined period even when they could not reach the receiver. Due to the high values of the delay in
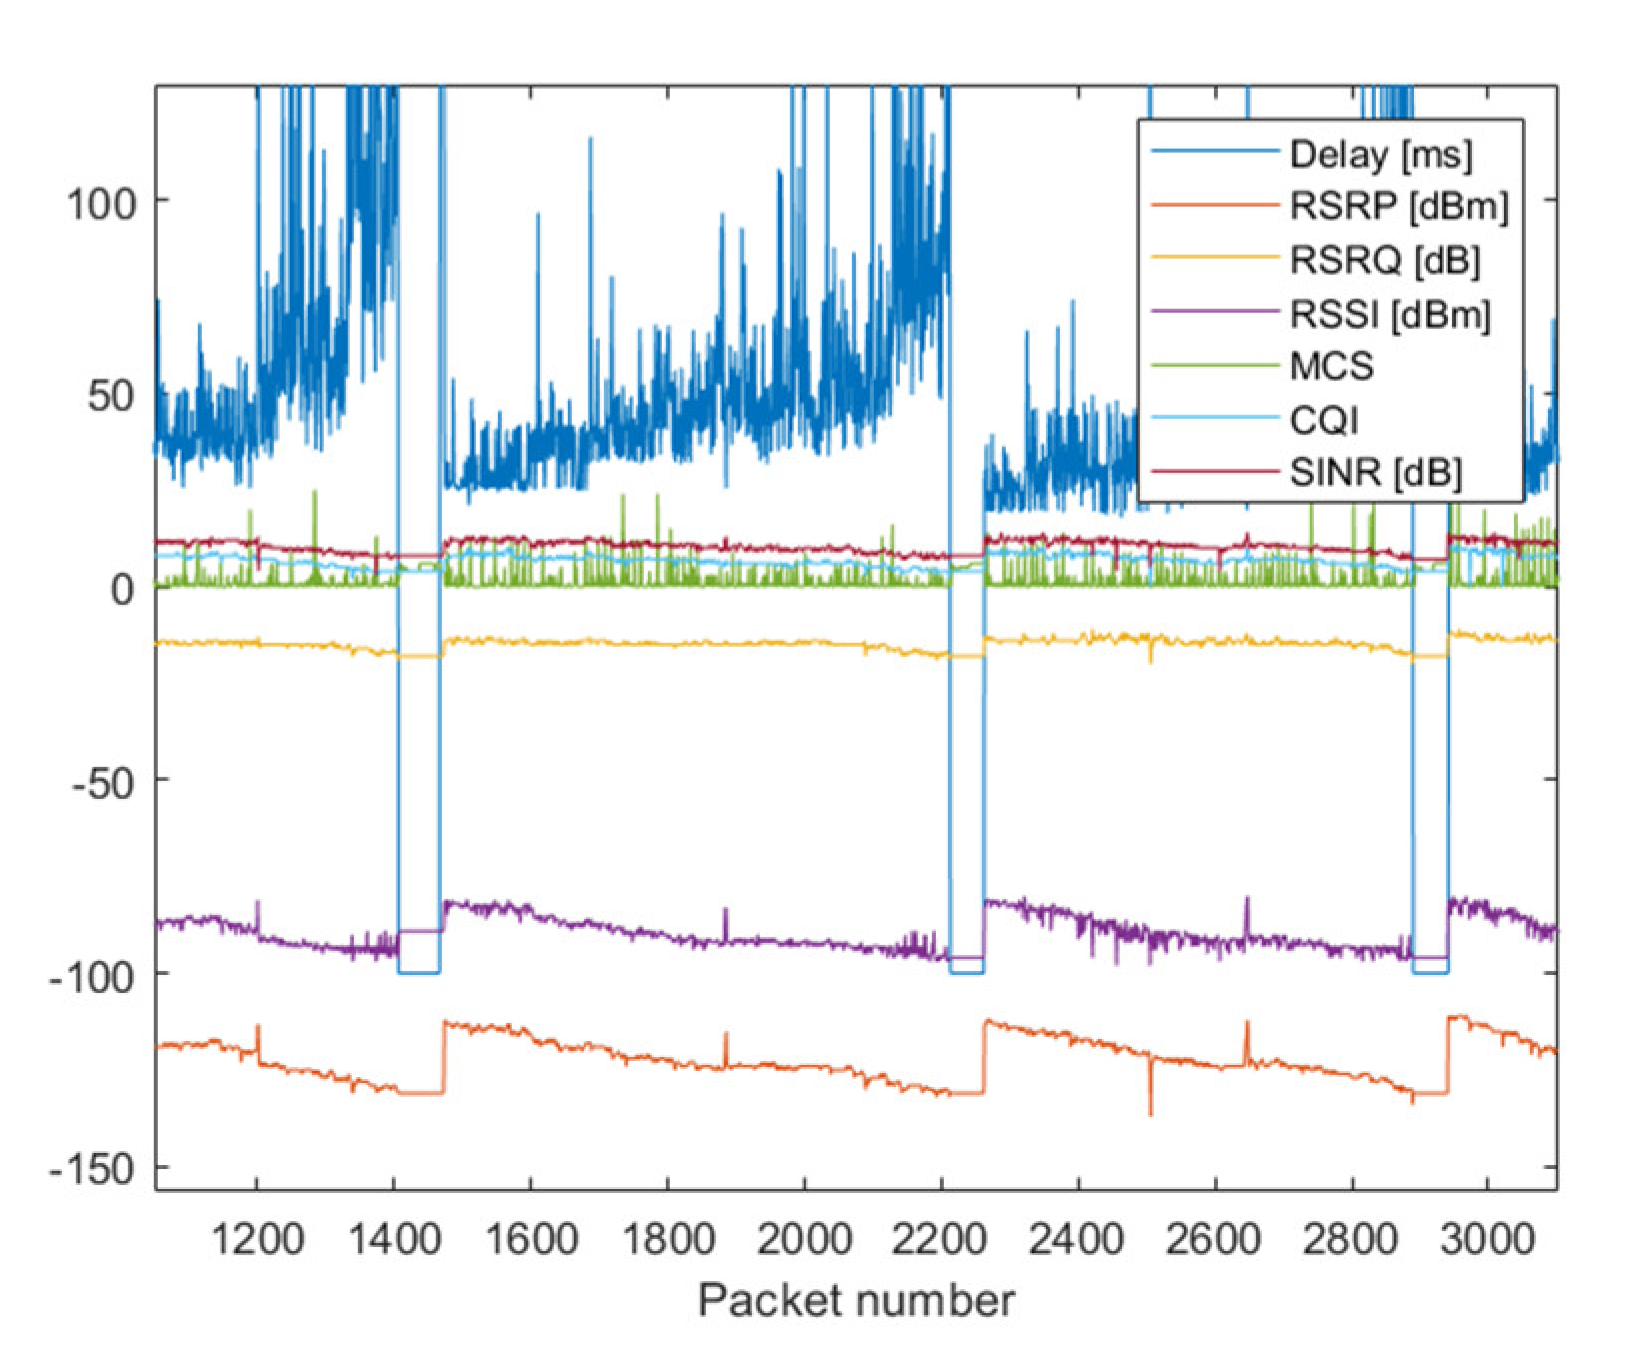
Figure 10, it is difficult to analyze the relations of values of other parameters. To improve the clarity of plots, the scale on ordinate axes was changed and modified plots are presented in
Figure 11. The other parameters, except for MCS, decreased with the increasing attenuation. It leads to a conclusion similar to the one in the previous section. The multilink algorithm must decide that the LTE interface is not available when values of quality parameters get lower than some thresholds. The MCS values do not follow any pattern; however, from previous research [
5], we know that modulation and coding scheme has a great impact on transmission robustness. However, during measurements with the utilization of a commercial cellular network, it was impossible to influence on MCS parameter. Therefore, the search for the most suitable thresholds was conducted without and with the consideration of MCS. In
Table 1 are given the number of transmission and number of lost packets for each possible MCS during measurement. It can be seen that the ratio of realized transmission to lost packets is very good for MCS 0–3 and 8–30 while the ratio is very poor for MCS 4, 5 and 6 when over 50% of packets were not received within the settled timeout. The reasons for such results should be seen in the algorithm of changes in transmission parameters adopted by the cellular operator. Unfortunately, we have no way of viewing this algorithm. Based on data in
Table 1 the MCSs values for which a sufficient number of transmissions for further analysis can be selected. These are 0, 1, 3, 4, 5, 6. For transmissions realized with given modulation and coding schemes and for all realized transmissions (without differentiation on MCS), a similar search for threshold values for each quality parameter was realized as for NB-IoT in the previous section.
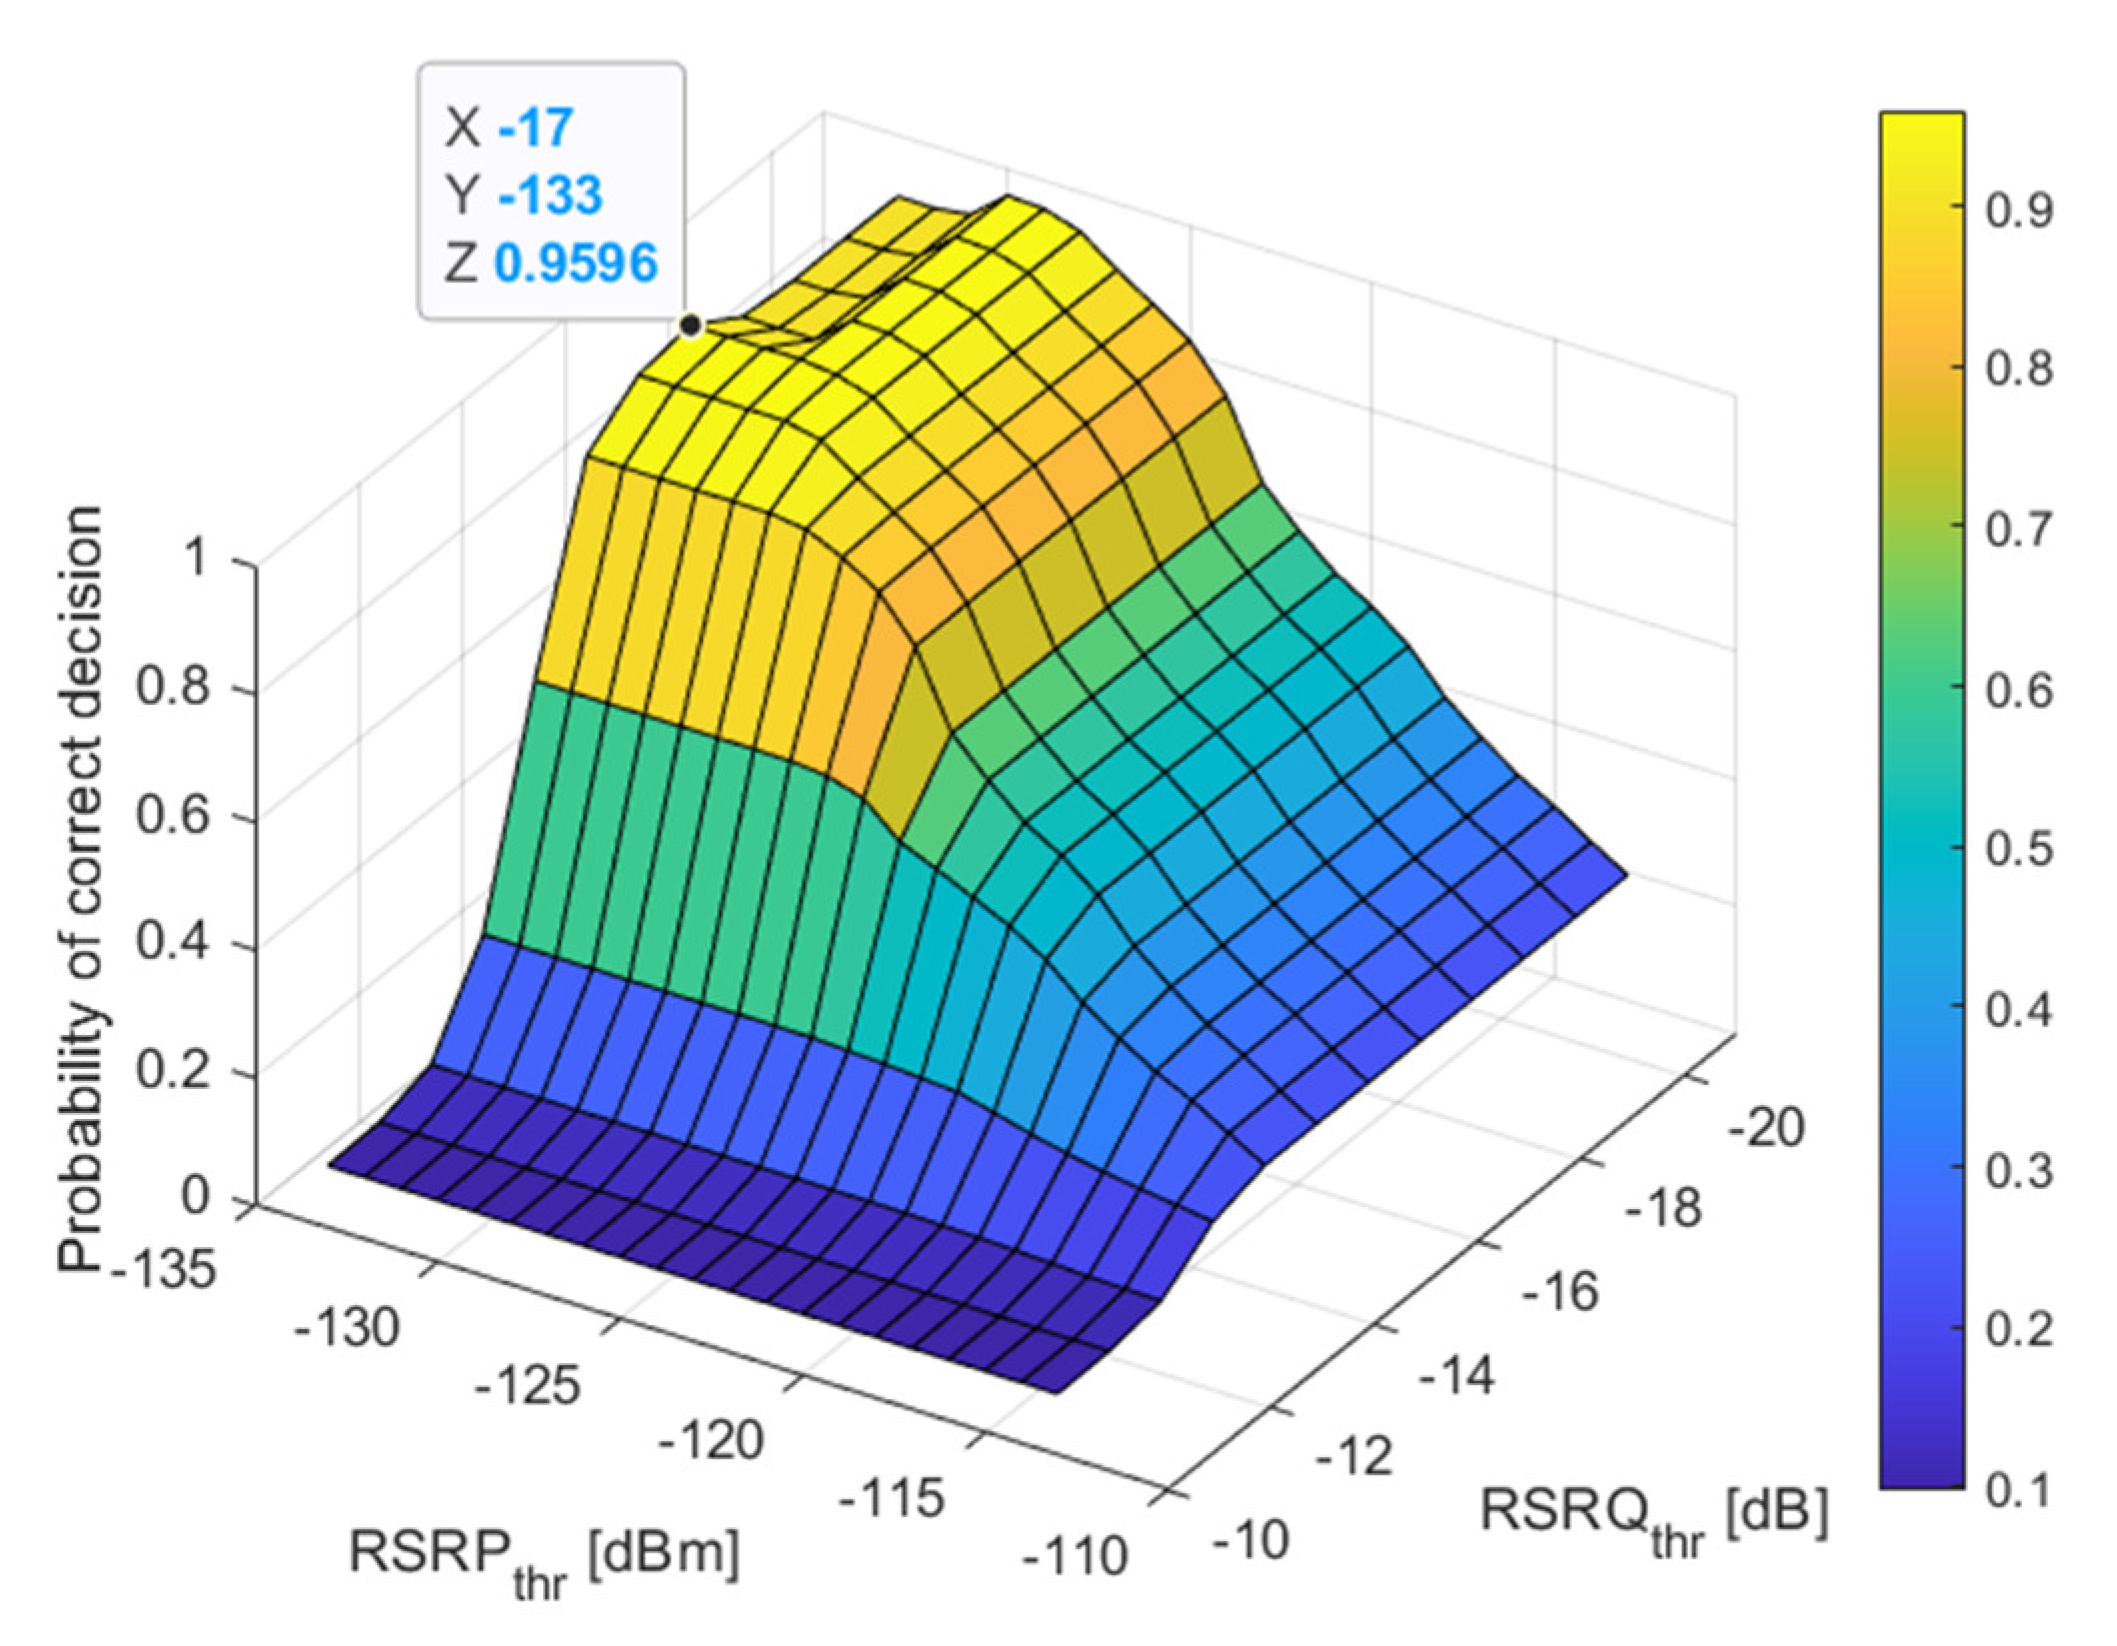
It was found that for all realized transmissions the best threshold values for each quality parameter are:
RSRPthr −133 dBm and
RSRQthr −17 dB and
RSSIthr −100 dB and
SINRthr 0 dB.
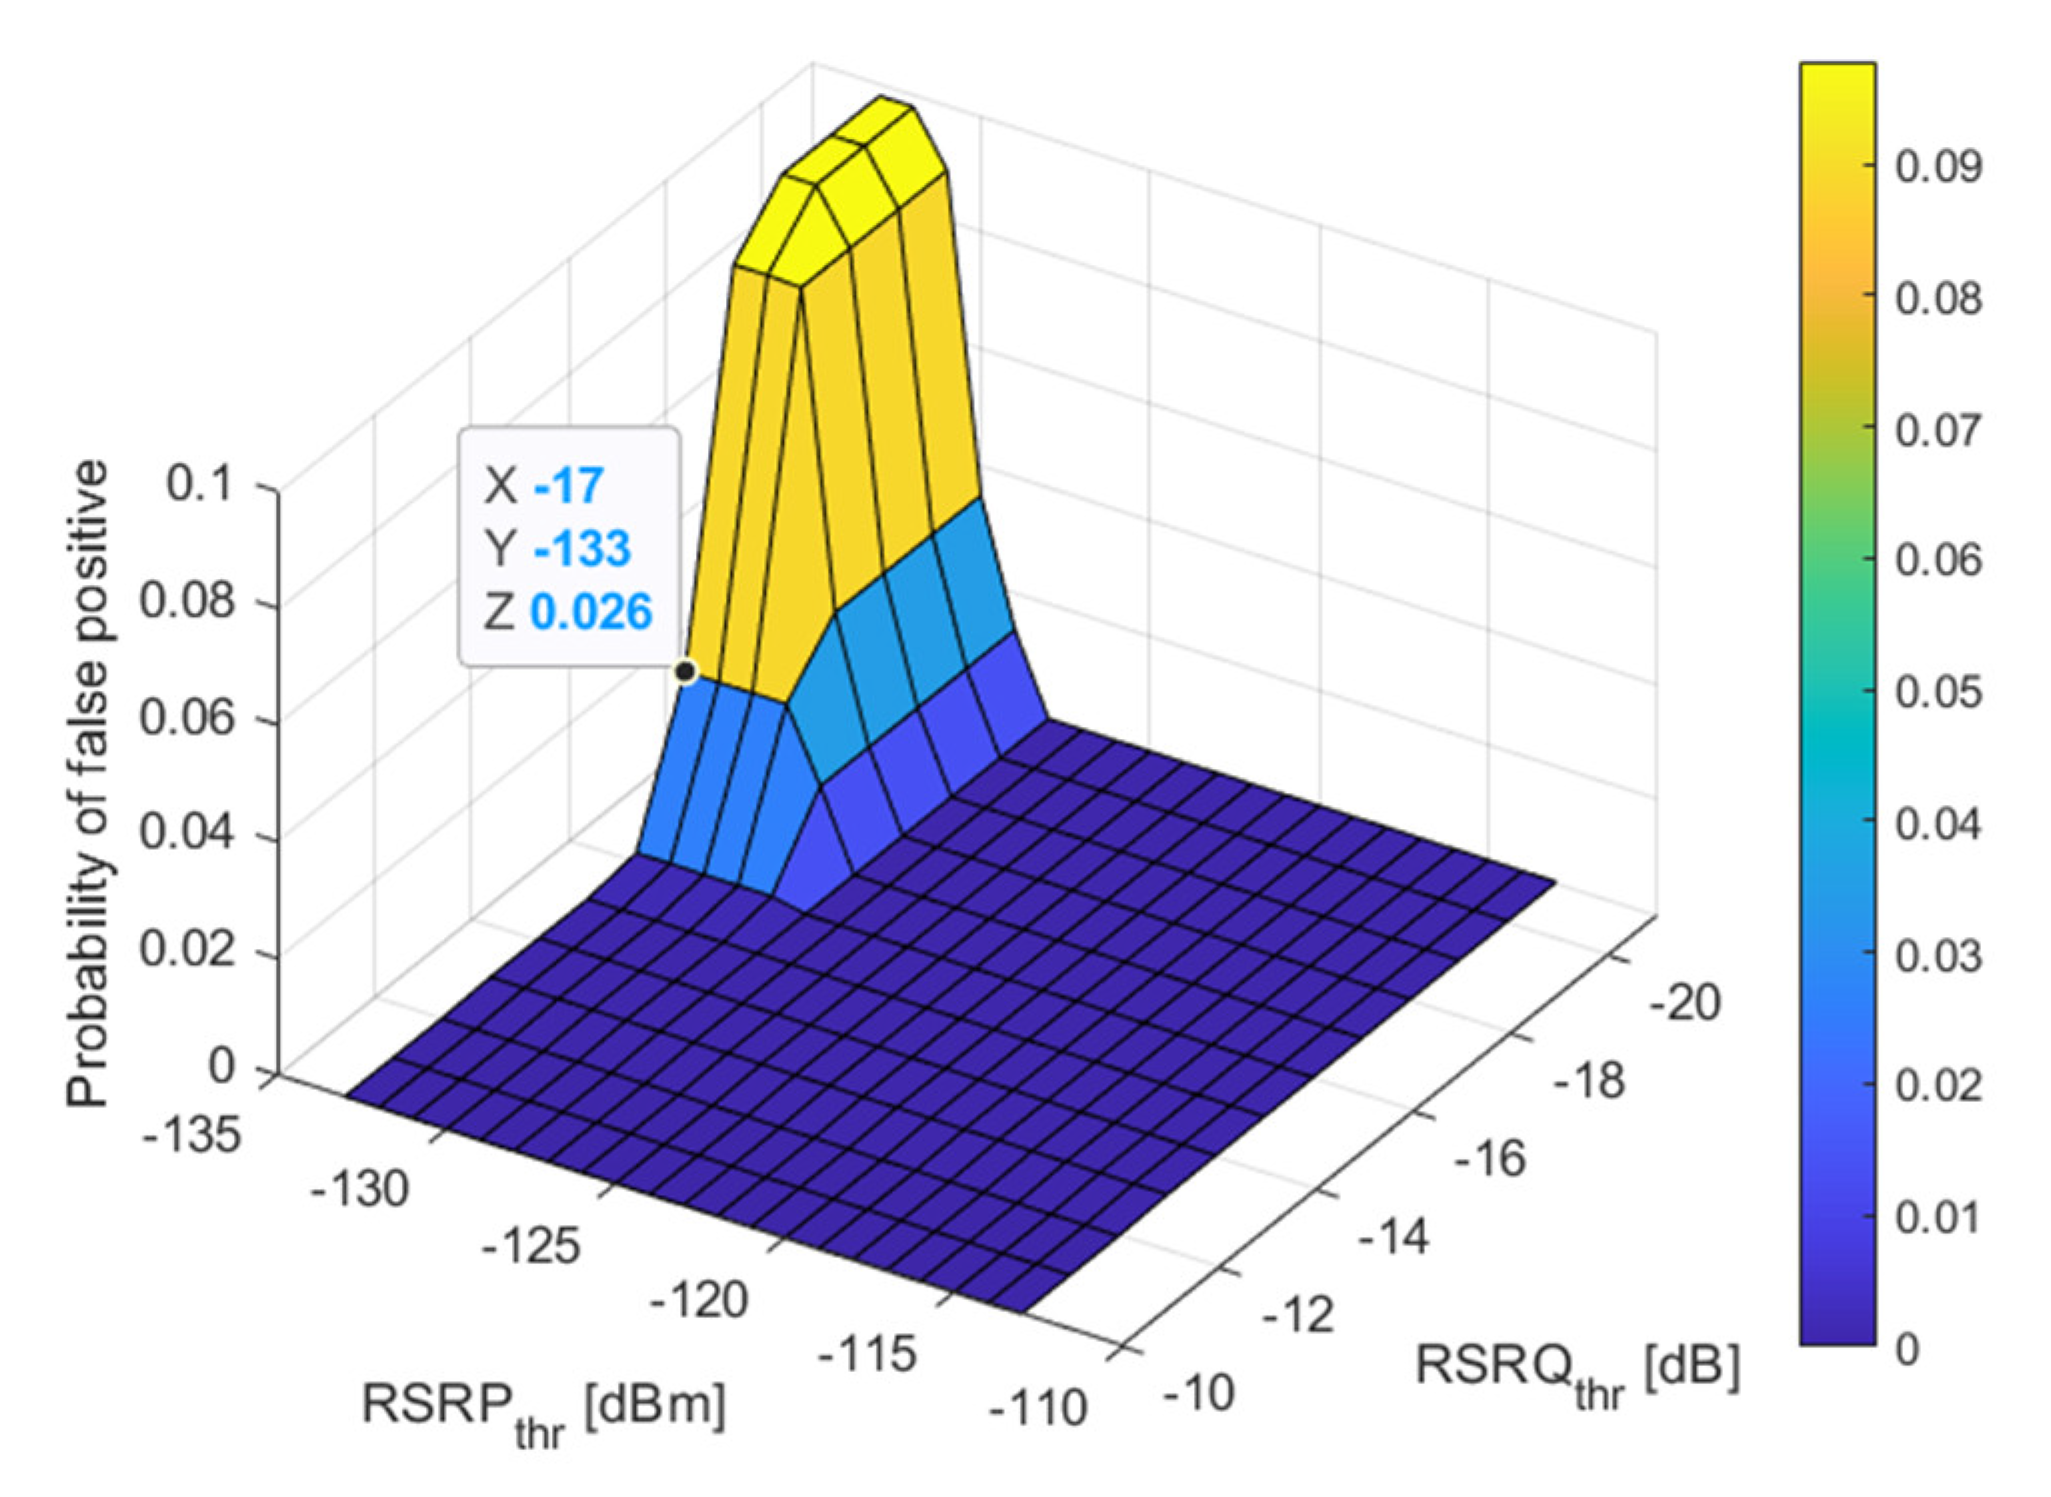
Then the probability of a correct decision is 96% and the probability of a false positive decision is 3%. The CQI was omitted in the multilink algorithm as it is strongly connected with the modulation scheme and MCS parameter. For each individual of selected MCS transmissions, both probabilities were calculated for selected threshold values. Results are presented in rows with white background in
Table 2. For MCS 4 and 6 achieved probability values for such thresholds are very poor. Almost reach assumed limits. As the worst case appears to be for MCS = 4, so for this modulation and coding scheme has performed another search for the best threshold values. These are:
RSRPthr −133 dBm and
RSRQthr −17 dB and
RSSIthr −95 dB and
SINRthr 0 dB.
For this new threshold values were calculated probabilities
and
for each MCS and all transmissions. Results are also given in
Table 2; however, in rows with a grey background. For new threshold values
is always greater than 94% and
lower than 1.3%. Therefore, these thresholds should be implemented in ML for LTE technology.
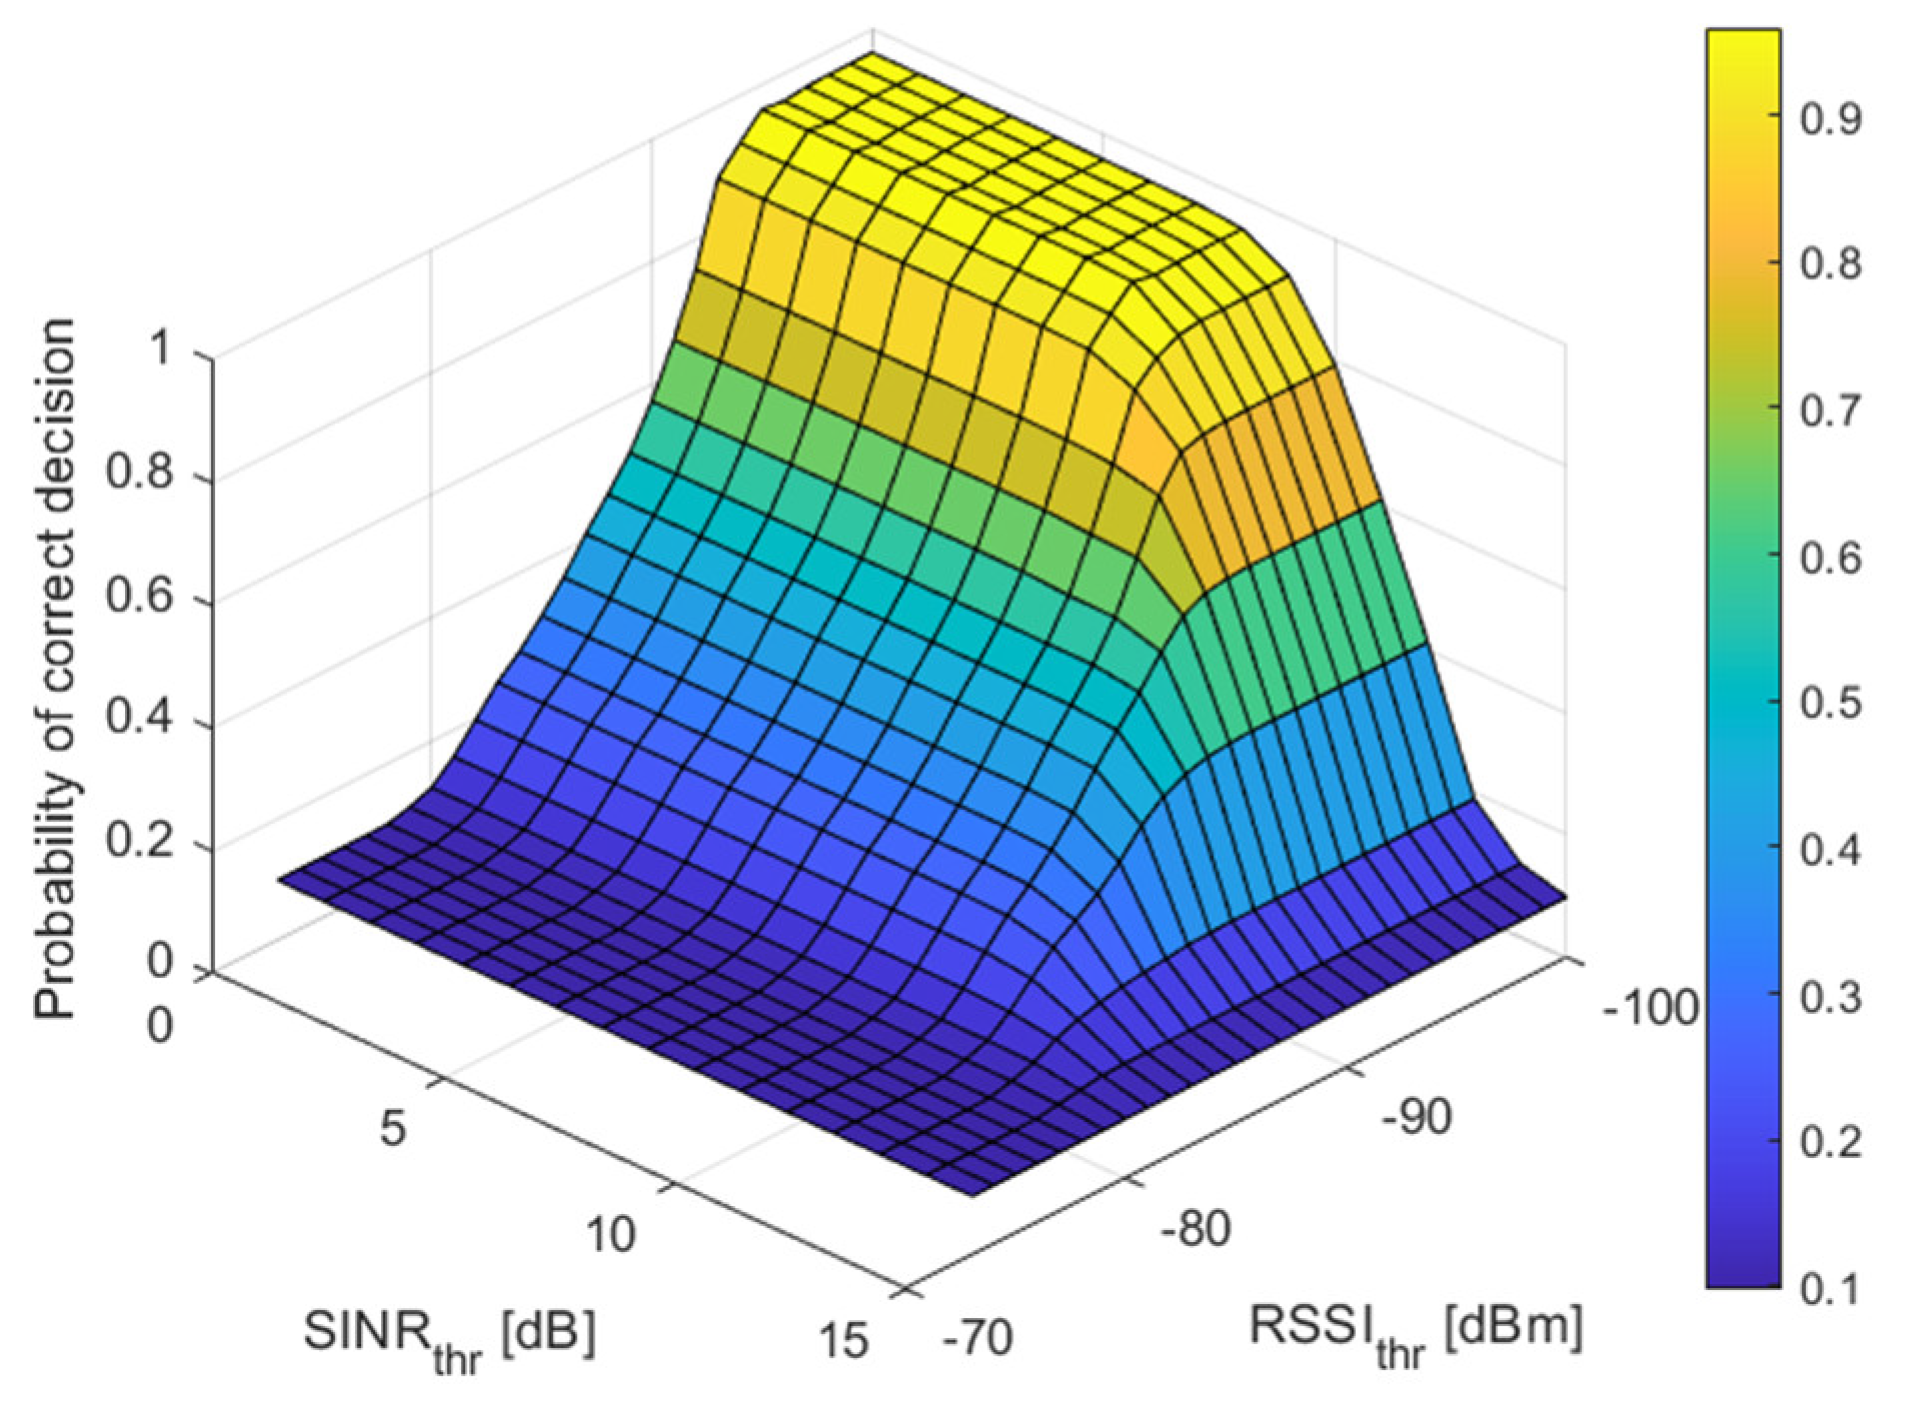
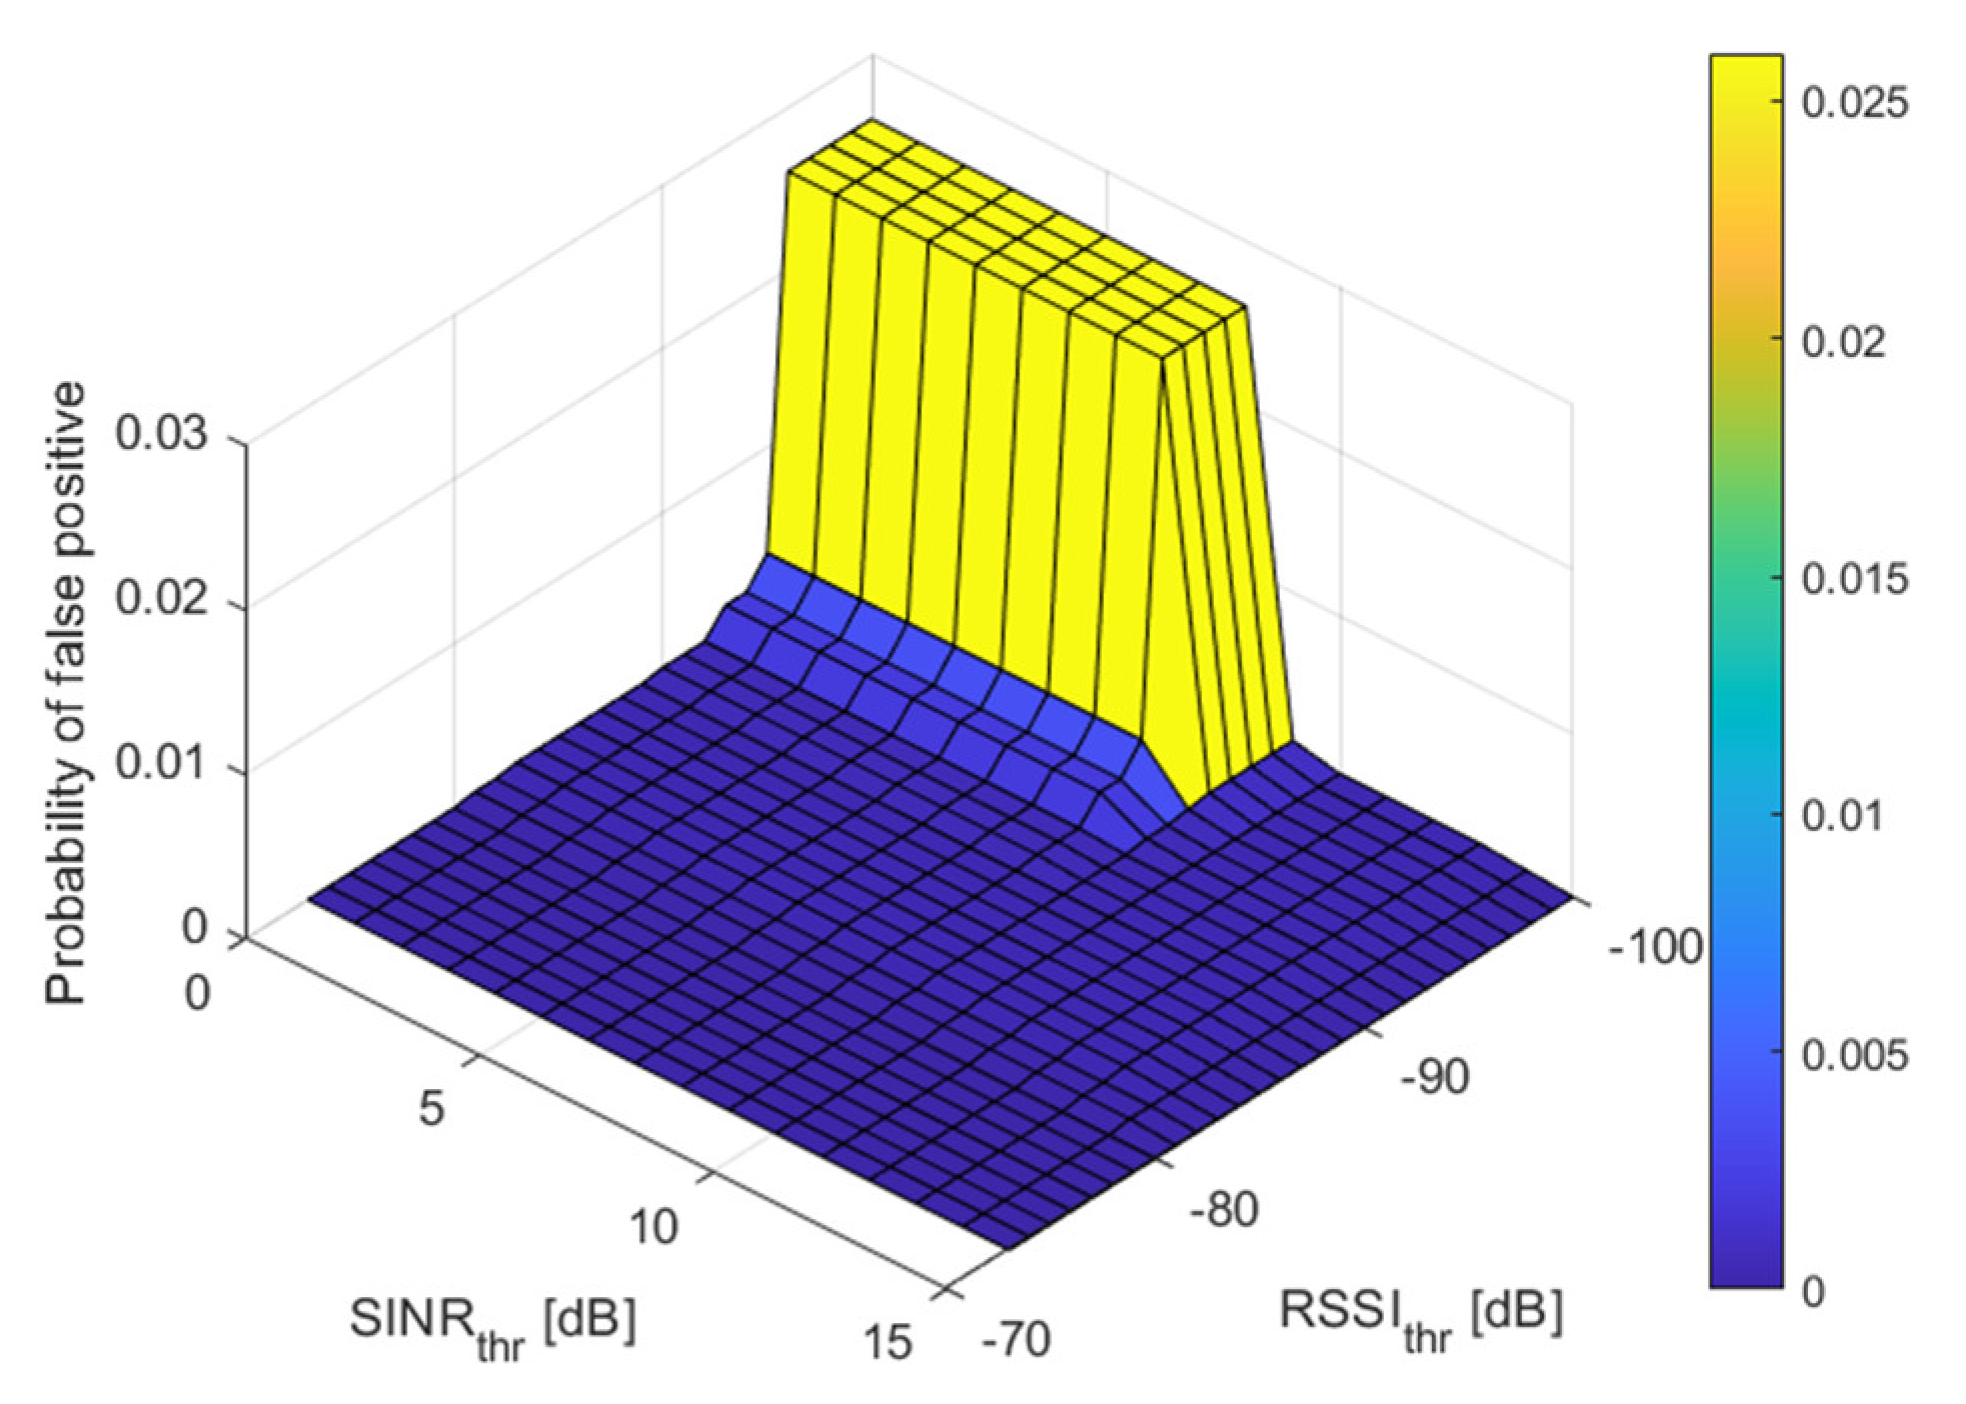
A probability of correct decision for different threshold values for RSRP and RSRQ when the threshold for SINR was set to 0 dB and the threshold for RSSI was set to −100 dB is presented in
Figure 12 whereas the probability for false positive decision is in
Figure 13. In
Figure 14, a probability of correct decision for different threshold values for SINR and RSSI when the threshold for RSRP was set −133 dBm and threshold for RSRQ was set to −17 dB is presented, while a false positive probability is shown in
Figure 15. The chosen values for those plots are the selected best threshold values for ML algorithm.
6. Conclusions
In the article, the authors presented a data concentrator device dedicated to an energy grid that integrates many different communication technologies. Especially, it enables the work of AMI systems at the interfaces of SCADA, HAN and IoT. As this device ought to realize edge computing and has gateway functions it must be equipped with decision algorithms. Among others, those algorithms must decide which of all radio communication interfaces is best for transmission at a particular time and for particular data. To elaborate such an algorithm a measurement campaign was performed with the utilization of a real cellular network. The novelty of these measurements results, among others, from the use of commercial radio modules instead of specialized measuring equipment. This approach enables the assessment of the credibility of the signal quality parameters reported by a given radio module. From the presented research it can be noticed that for NB-IoT technology the connection was broken very often while the module utilizing LTE technology worked very steadily. Despite this inconvenience, for both technologies, it was possible to determine the method of implementation of the ML algorithm. As all of the values of reported quality parameters were decreasing as the quality of signal deteriorated, ML must decide that a particular link is unavailable when all quality parameters get below some thresholds. Thresholds that maximize the probability of a correct decision and minimize the probability of a false positive decision are given in
Table 3. It is worth seeing that, unexpectedly, the SINR parameter has the least impact on the decision making as its found threshold is equal 0 dB.
The presented results show that it is possible to assess the link state for LTE and NB-IoT technologies. Therefore, the current work aims to implement the ML algorithm in the target device and perform field measurements to make final ML validation. It was decided to use this link which enables greater throughput. Therefore, if both LTE and NB-IoT will be available the ML will choose LTE to send packet. Future extensions of the data concentrator will be related to improving its hardware implementation and to expanding the possibilities of its applications not only in electrical grid but also i.e., in harbors.


