Article

Research on Semantic Segmentation Method of Macular Edema in Retinal OCT Images Based on Improved Swin-Unet

School of Computer and Information Engineering, Heilongjiang University of Science and Technology, Harbin 150022, China
*
Author to whom correspondence should be addressed.
These authors contributed equally to this work.
Electronics 2022, 11(15), 2294; https://doi.org/10.3390/electronics11152294
Submission received: 28 June 2022 / Revised: 19 July 2022 / Accepted: 21 July 2022 / Published: 22 July 2022
(This article belongs to the Special Issue Machine Learning for Classification and Analysis of Biomedical Images)

Abstract

:
Optical coherence tomography (OCT), as a new type of tomography technology, has the characteristics of non-invasive, real-time imaging and high sensitivity, and is currently an important medical imaging tool to assist ophthalmologists in the screening, diagnosis, and follow-up treatment of patients with macular disease. In order to solve the problem of irregular occurrence area of diabetic retinopathy macular edema (DME), multi-scale and multi-region cluster of macular edema, which leads to inaccurate segmentation of the edema area, an improved Swin-Unet networks model was proposed for automatic semantic segmentation of macular edema lesion areas in OCT images. Firstly, in the deep bottleneck of the Swin-Unet network, the Resnet network layer was used to increase the extraction of pairs of sub-feature images. Secondly, the Swin Transformer block and skip connection structure were used for global and local learning, and the regions after semantic segmentation were morphologically smoothed and post-processed. Finally, the proposed method was performed on the macular edema patient dataset publicly available at Duke University, and was compared with previous segmentation methods. The experimental results show that the proposed method can not only improve the overall semantic segmentation accuracy of retinal macular edema, but also further to improve the semantic segmentation effect of multi-scale and multi-region edema regions.

1. Introduction

Macular degeneration is one of the three major blindness diseases of the human eye [1], which is mainly caused by the lesions of the macular retina and its underlying nutritional structures, the retinal pigment epithelium and choroid. Patients will encounter clinical symptoms of visual dysfunction and central visual acuity decline. If they are not screened and treated in time, they will face the danger of blindness. In addition, diseases such as diabetes and hypertension may also accumulate lesions in the macular region. Therefore, obtaining parameters related to the number and shape characteristics of key tissue targets, such as fundus macular edema, is of great significance for the diagnosis of macular degeneration and related diseases [2].
With the maturity of optical imaging technology, optical coherence tomography (OCT) technology has been gradually applied to the construction of retinal images. It is an emerging technology firstly proposed by Huang D from the Massachusetts Institute of Technology in 1991 [3]. It adopts optical coherent interferometer and confocal scanning microscopy technology, with a longitudinal resolution of 3–15 microns and about 400 to 27,000 A-scans per second [4,5]. It takes into account the advantages of high security, fast imaging, non-contact and non-invasive, high longitudinal resolution, and lateral resolution, and has become a biomedical optical imaging technology for detecting the internal microstructure of biological tissues in vivo, and can quickly obtain retinal microstructure images [6]. 
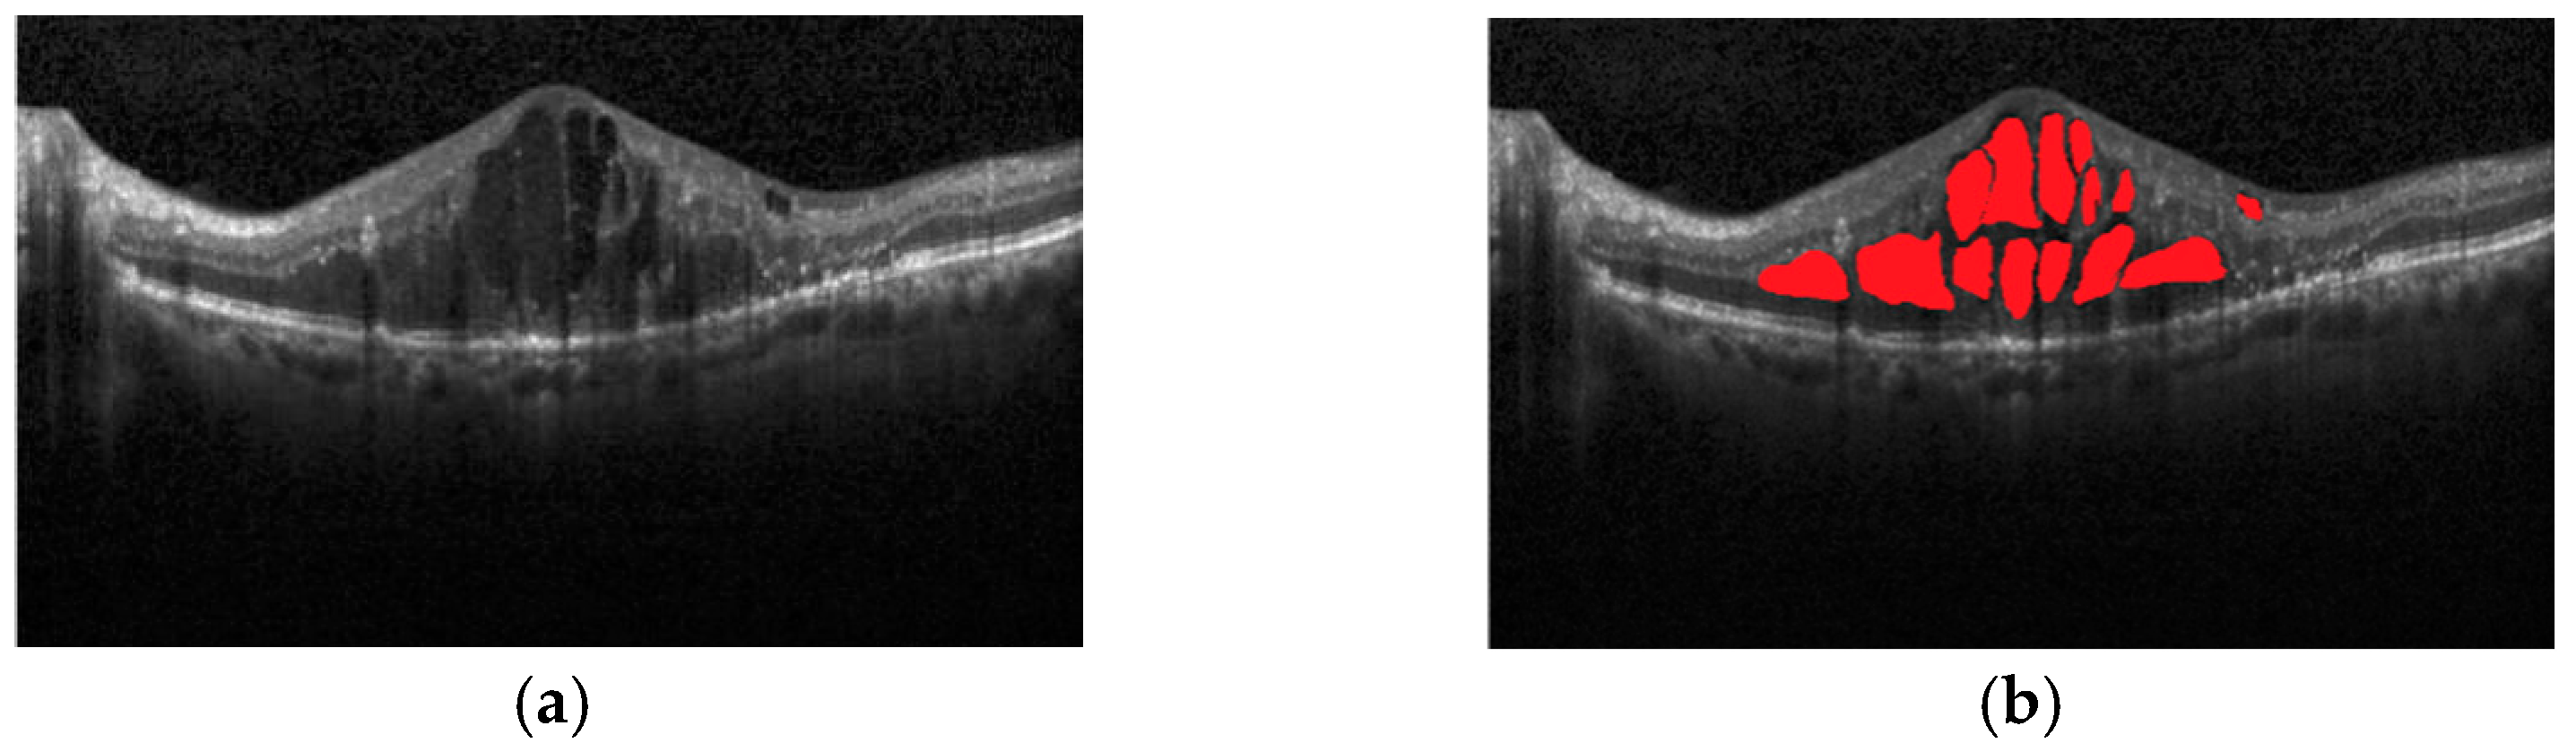
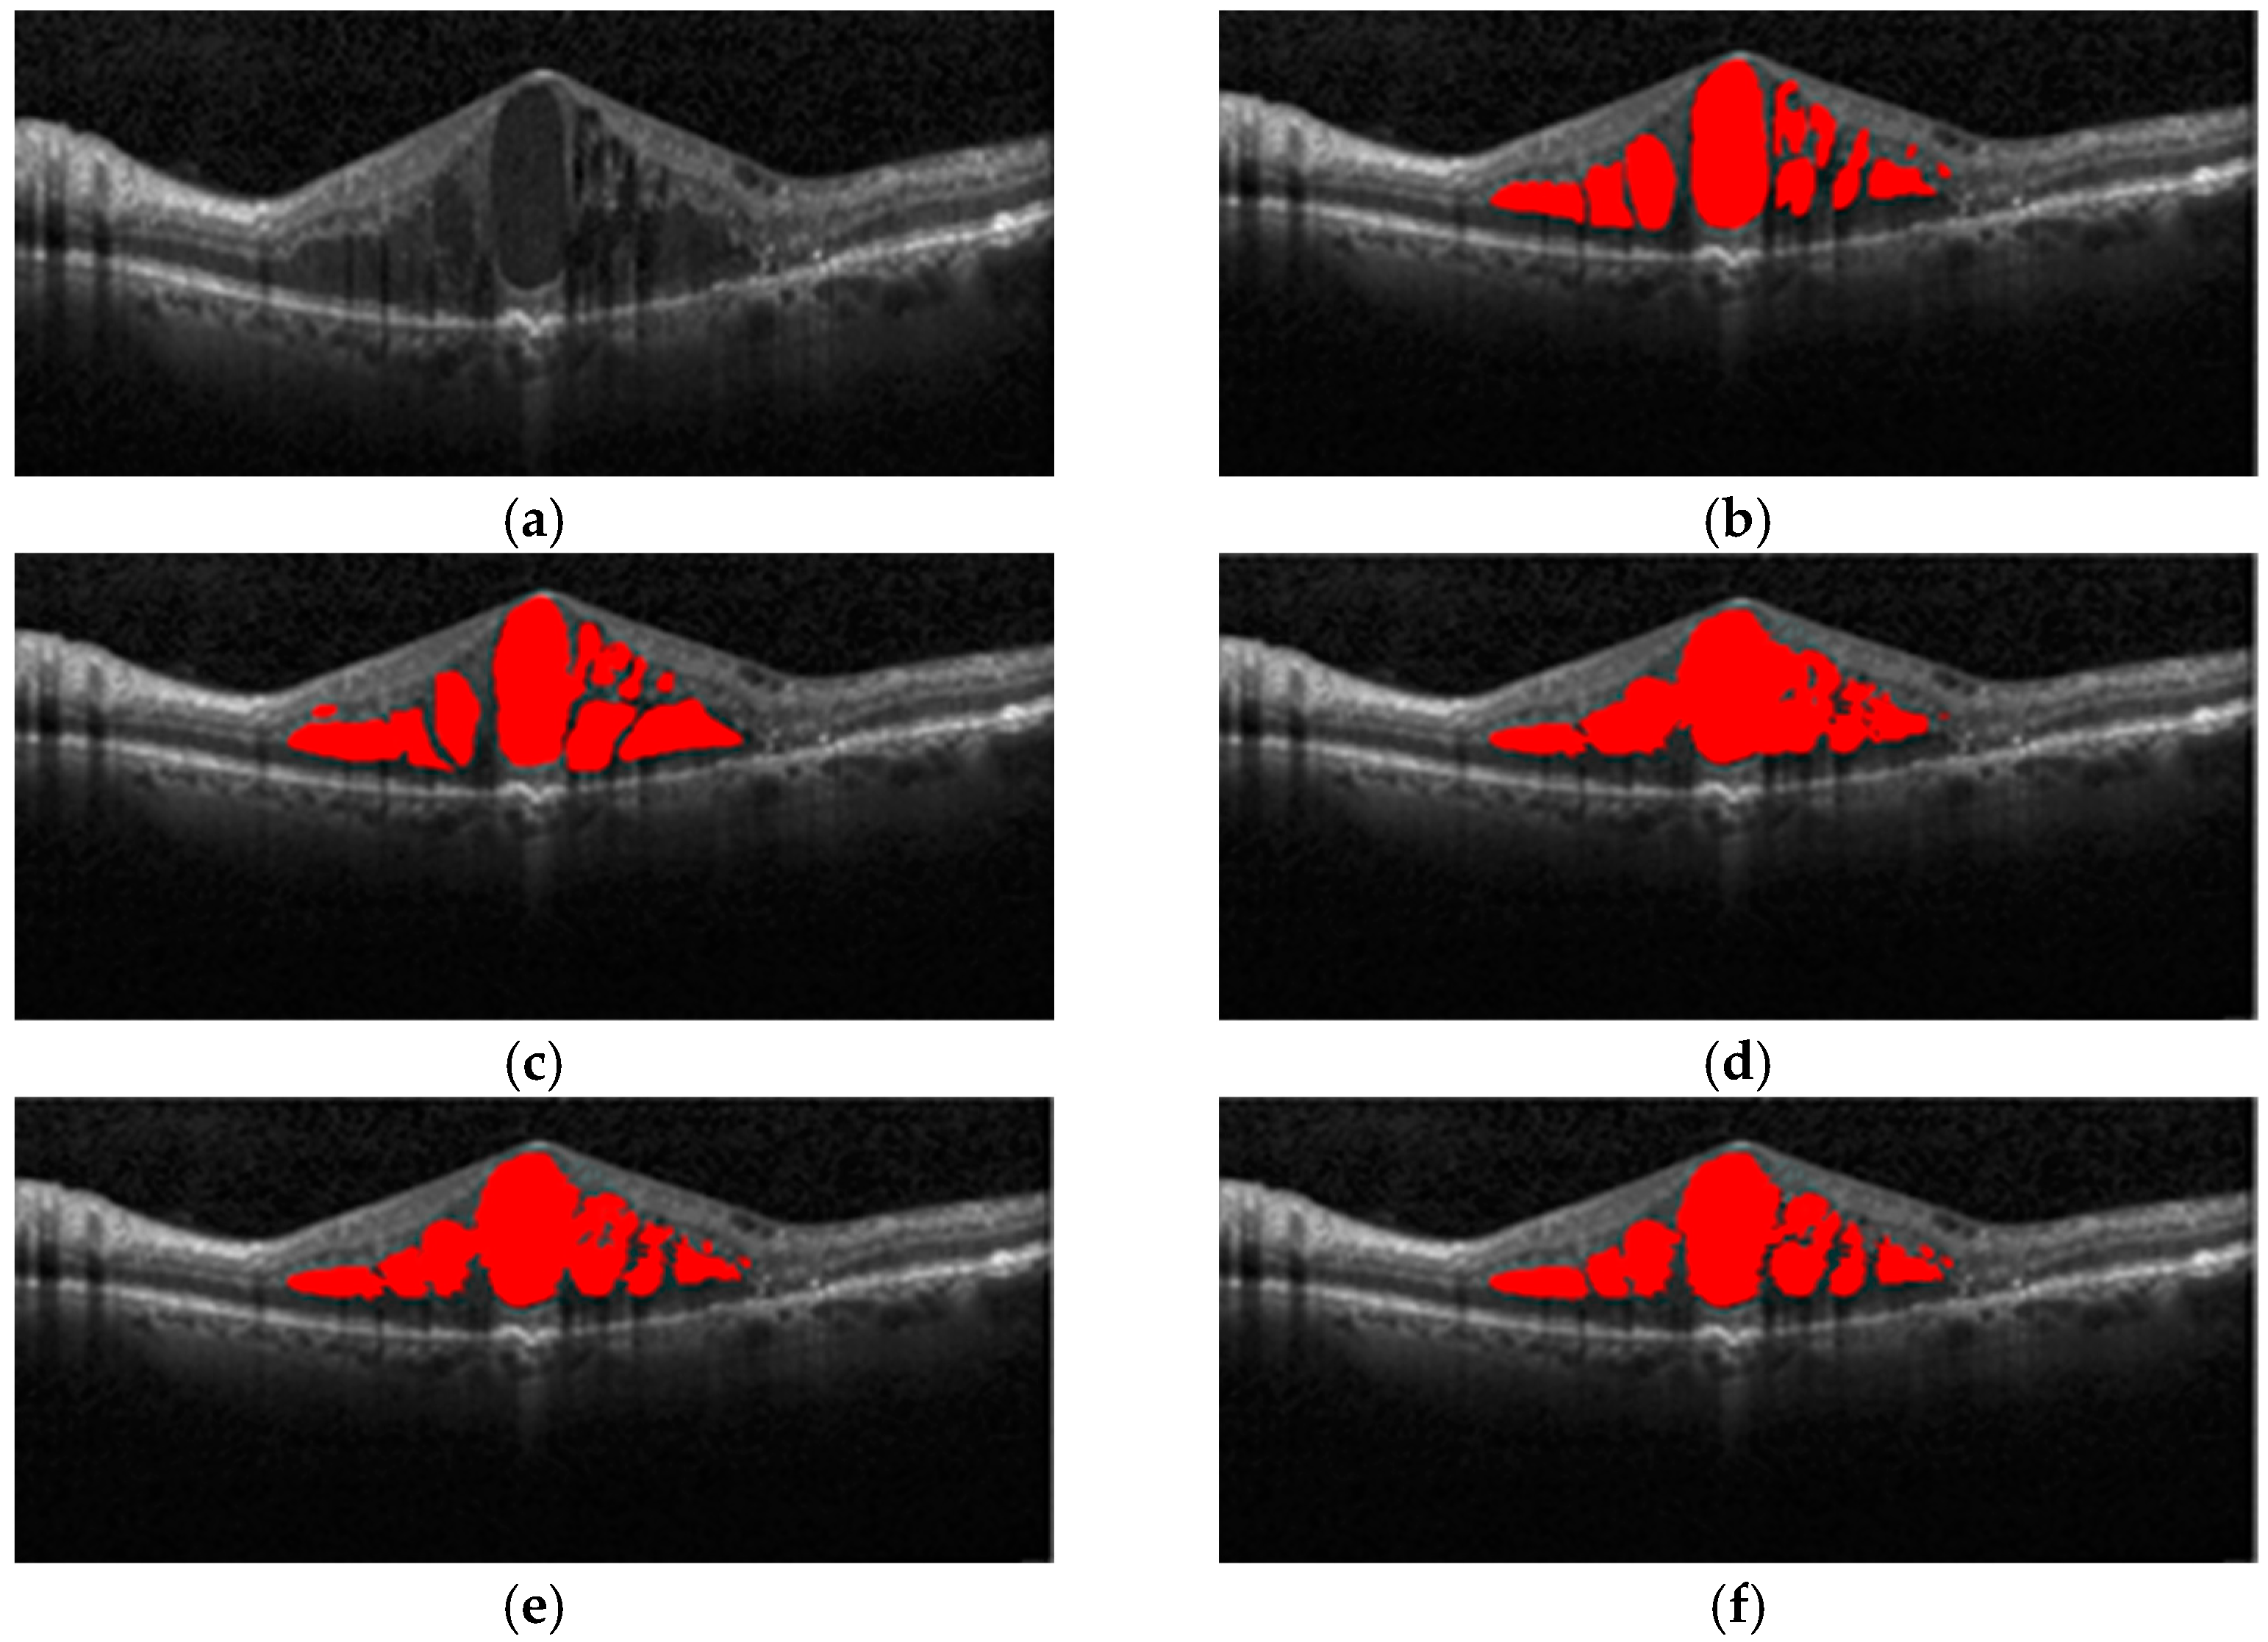
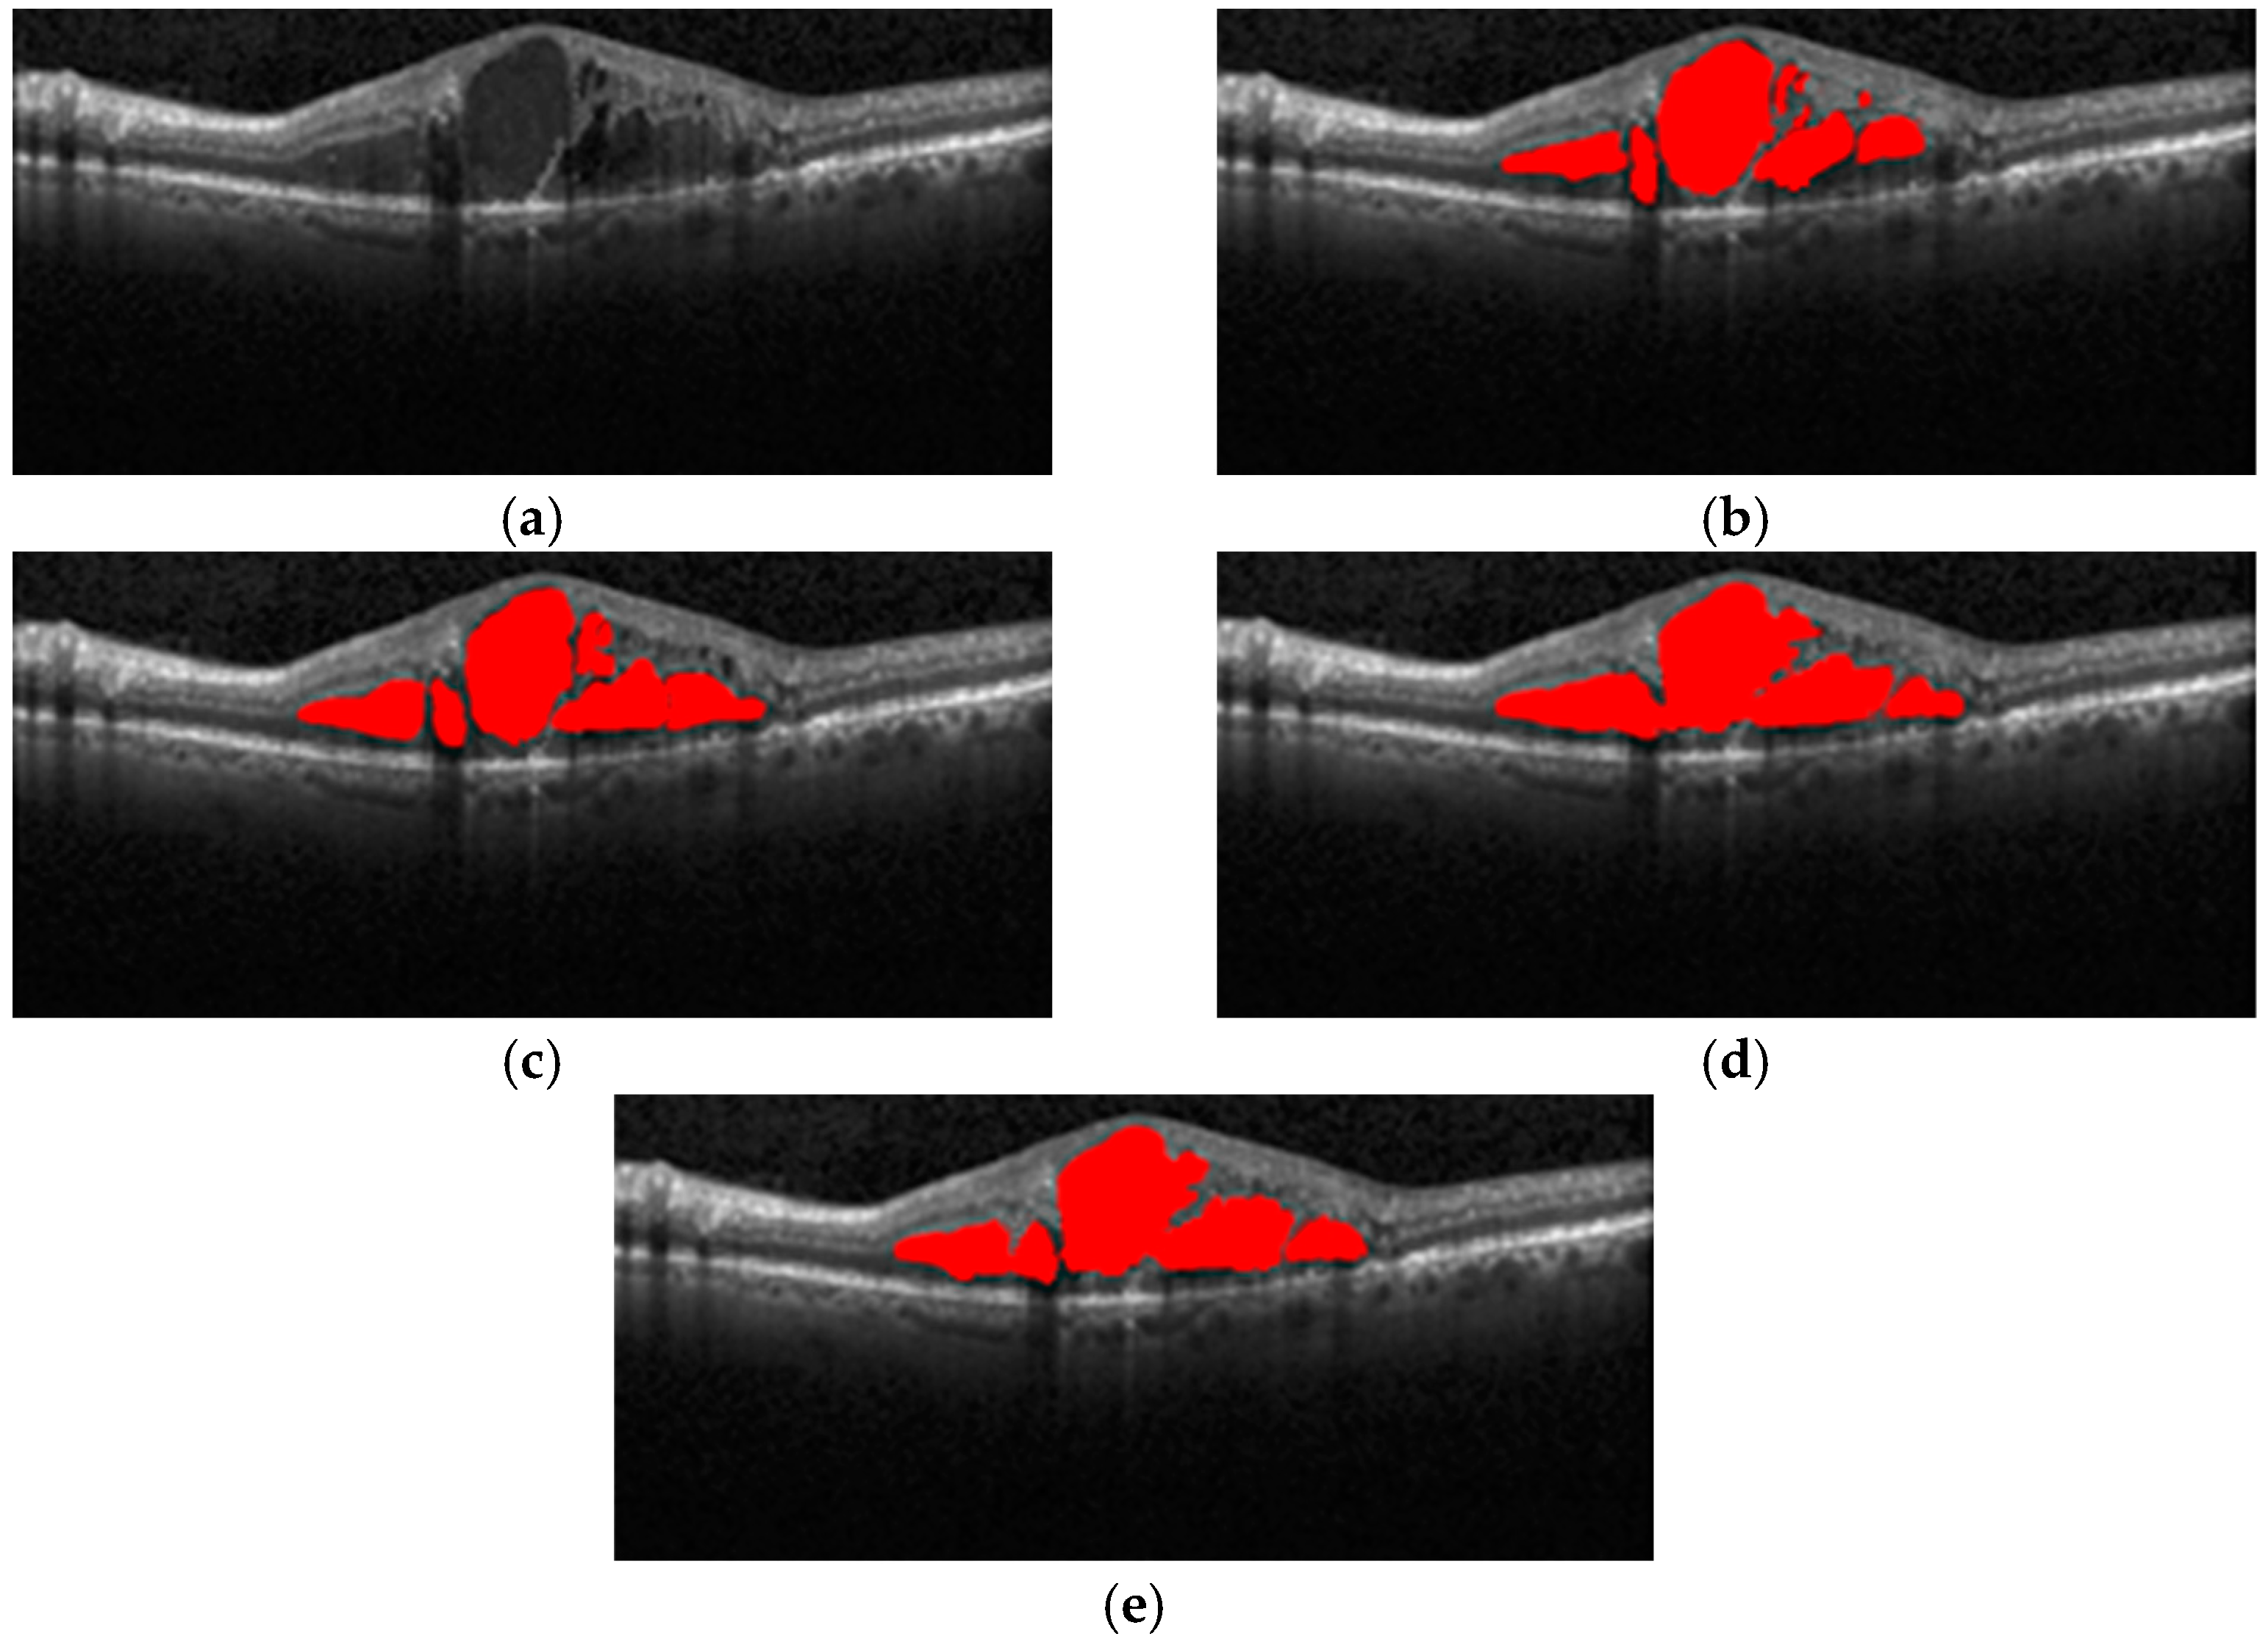
Figure 1a shows OCT images with macular edema, and Figure 1b shows red regions in the image that are annotations of edema lesions. In this way, the image diagnosis information about on the lesions can be quickly obtained, and the ophthalmologist can make an accurate diagnosis or follow-up treatment for the patients with macular degeneration.
The early segmentation of macular edema in retinal OCT images was mainly performed manually by ophthalmologists, which was not only time-consuming and labor-intensive, but also prone to misclassification or omission due to the influence of doctors’ subjective factors. Therefore, in recent years, semi-automatic and fully automatic segmentation of macular edema in retinal OCT images has become a hot spot and focus of research by scholars. These methods can be mainly divided into two categories: traditional methods and semantic segmentation methods based on deep convolutional neural network learning.
Traditional retinal OCT image macular edema segmentation methods mainly include classical image segmentation methods based on graph theory, threshold segmentation, dynamic programming, coarse granularity, and fine granularity, and active contouring. For example, in 2010, Stephanie et al. proposed an automatic segmentation method of retinal layer of spectral domain optical coherence chromatography images based on graph theory and dynamic programming, using a strong gradient method to estimate the edge weights of OCT images, and then through dynamic programming, the shortest path between nodes was obtained to achieve segmentation of the edema region [7]. In 2011, Quan et al. proposed a connected component extraction and localization method based on threshold segmentation that combines global and local. The global threshold segmentation is used to remove the irrelevant information in the image, and the set of connected components in the image is obtained from the global perspective, and then the lesion information in the image is accurately located using the local threshold extraction and locally connected component recognition method. Experimental results show that this method can accurately locate microaneurysms and hard exudates in fundus images of diabetic retinopathy [8]. In 2013, Zheng et al. proposed an automatic segmentation method based on intraretinal fluid and subretinal fluid in OCT images. Firstly, all low-reflection regions in the image were automatically segmented into candidate regions, and then the candidate regions were preprocessed and coarsened. A four-step process approach for segmentation, sub-segmentation, and quantitative analysis [9]. In 2014, Srinivasan et al. proposed an automatic segmentation method of the retinal layer of spectral domain OCT images based on sparse denoising, support vector machine, graph theory and dynamic programming, and obtained better results in segmenting the retinal boundary layer [10]. In 2015, Chiu et al. developed a fully automatic OCT segmentation method based on Kernel Regression classification and analyzed the seven-layer segmentation of retinal macular edema on SD-OCT images, combined this method with graph theory, and dynamic programming methods, and obtained a good segmentation effect [11]. In the same year, Zheng Shan proposed a new multiphase active contour segmentation model under ellipse constraints. According to the different area brightness of the view disc cup in the grayscale image, the model establishes a multiphase active contour model to achieve simultaneous segmentation of the viewer disk cup. The results show that the method can segment the optic disc and optic cup in medical fundus images and provide quantitative shape description information [12].
In traditional methods, there are also 3D-based methods to solve the segmentation problem of medical images. In 2017, by combining the watershed transformation of grayscale labels with robust optimization algorithms, an automatic 3D medical image registration method was proposed by Ruppert et al., and can effectively reduce the number of key points required for registration, resulting in the fast estimation of the mapping function [13].
Due to the expansion of dataset size and the improvement in computer computing performance, deep learning methods have been rapidly developed. In this context, a large number of deep learning-based semantic segmentation methods have also been introduced to the field of medical image segmentation, and these methods have achieved many outstanding achievements in retinal macular degeneration segmentation.
In May 2017, Abhay Shah et al. utilized Convolutional Neural Networks (CNN) to segment surfaces in 3D medical images by learning basic features and transformations from training data, without any human expert intervention, using a regional approach to learn local surface contours, and finally combined surfaces to obtain boundary maps, through this method, effective boundary segmentation is achieved on OCT images with normal and age-related macular degeneration [14]. In the same year, Roy et al. proposed a ReLayNet network of OCT macular edema segmentation using U-Net [15] as a framework, using the encoder’s contraction path to learn the hierarchy of contextual features, and then using the decoder’s expansion path of semantic segmentation, the network achieved end-to-end segmentation of retinal layers and liquid patches for the first time, and achieved good segmentation results [16]. In 2018, Venhuizen et al. proposed a two-stage fully convolutional neural network based on U-Net, including a two-stage architecture. The first stage is used to extract features, and the second stage is used for edema segmentation to reduce the impact of background classes on the segmentation effect [17]. In 2019, in order to solve the class imbalance problem of retinal OCT images, Li et al. used a 2D fully convolutional network for retinal segmentation and modified the network parameters and loss functions. In order to enhance the correlation between corresponding positions between adjacent images in space, a 3D fully convolutional network was proposed for retinal OCT image segmentation with improved segmentation accuracy [18]. In 2020, Liu et al. proposed an enhanced nested U-Net structure using multi-scale input, multi-scale side output, and dual attention mechanism, which achieved excellent segmentation performance on multi-layer segmentation and multi-fluid segmentation [19]. In the same year, Gao et al. used ResNet as the backbone network in U-Net++ [20], redesigned the skip connection structure, used ResNeSt [21] to improve the synthesized structure, studied the edema region in OCT images, and obtained good segmentation results [22]. In the same year, Xie et al. used image enhancement and improved 3D U-Net to implement a fast and automatic hyper-reflection focus segmentation method, and also obtained good segmentation results [23]. In 2021, Acevedo-Jake et al. used anti-angiogenic peptide hydrogel and pro-angiogenic peptide hydrogel to treat neovascular age macular degeneration [24].
After the rise of the U-Net network, the combination of various convolutional neural network model algorithms appeared in the research field of image semantic segmentation. In 2017, Google proposed a Transformer model based on the self-attention mechanism structure to deal with sequence-related problems and achieved good results [25]. In 2020, Dosovitskiy et al. proposed Visio Transformer [26], and many subsequent applications of transformer-based medical image segmentation model algorithms have laid a solid foundation for application, such as Swin Transformer [27] and TransUNet [28].
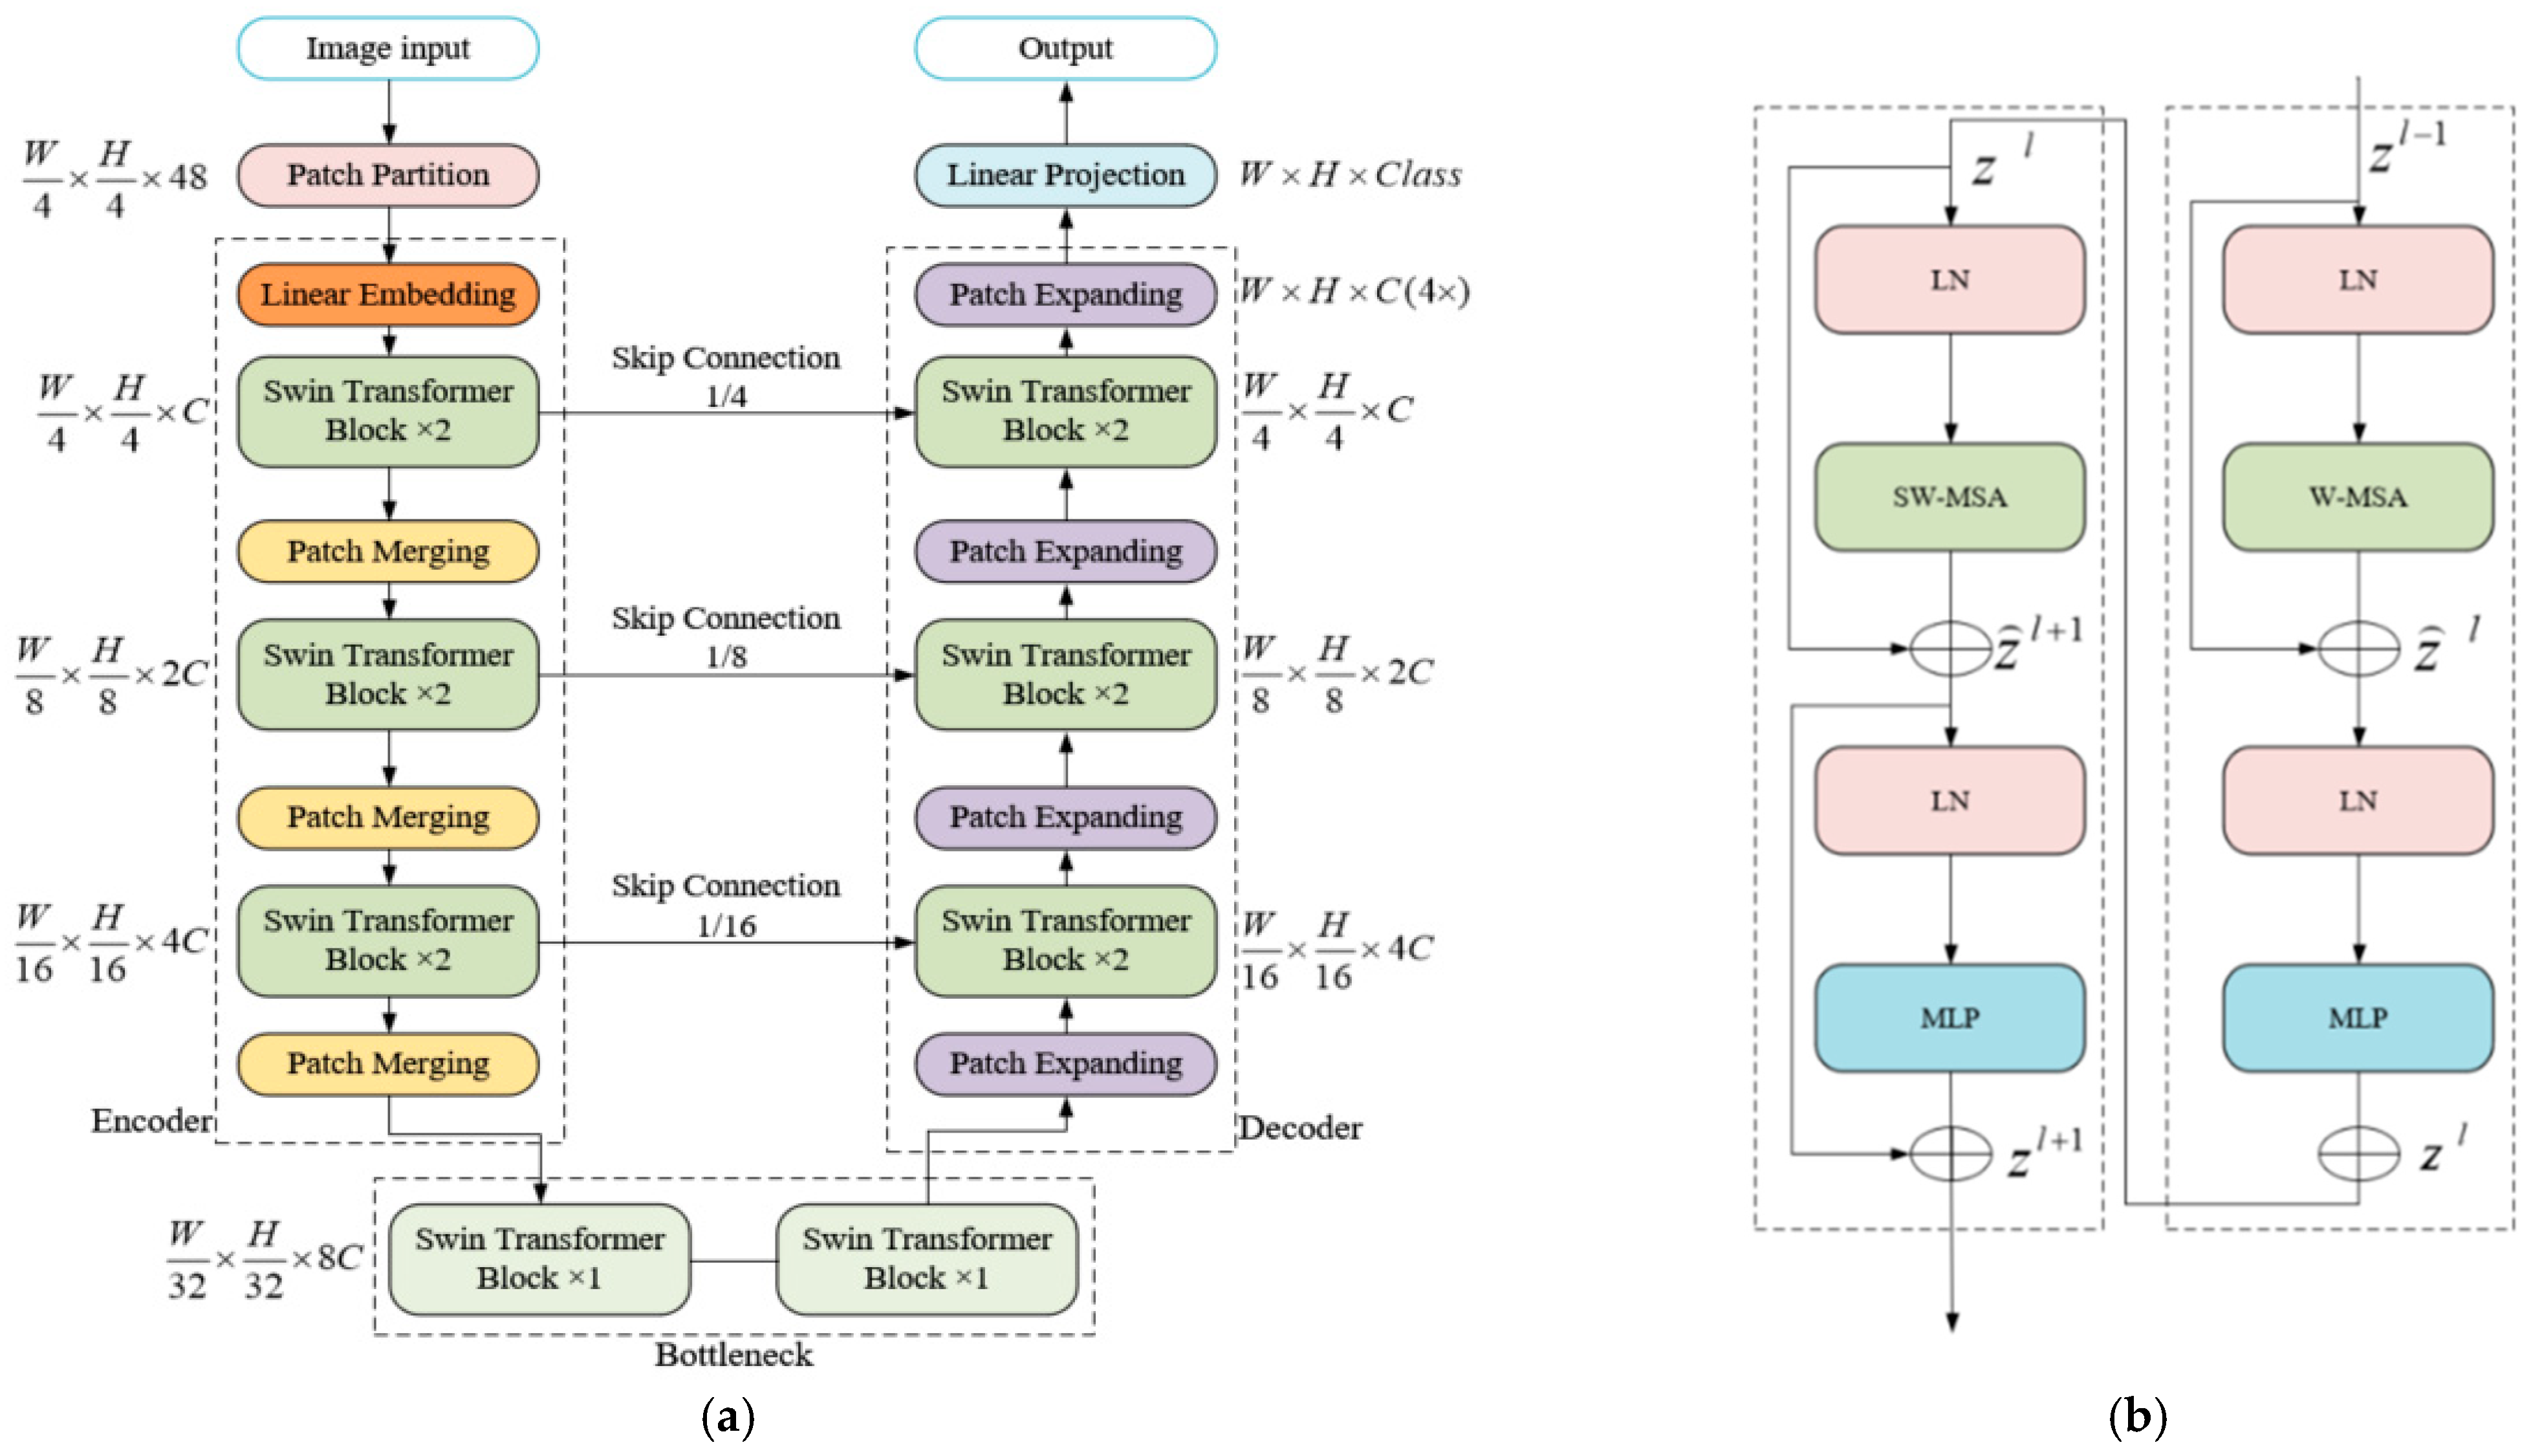
At present, although the Transformer model has a good global capture ability, when performing image segmentation and lesion detection in deep learning, only the global feature representation of the image is considered, and the local representation of learning details needs to be strengthened. In order to overcome the difficult problem of difficult segmentation of macular edema in OCT images with macular degeneration, such as multi-region, multi-scale, irregular shape, non-uniform gray level, and non-fixed position, Swin-Unet [
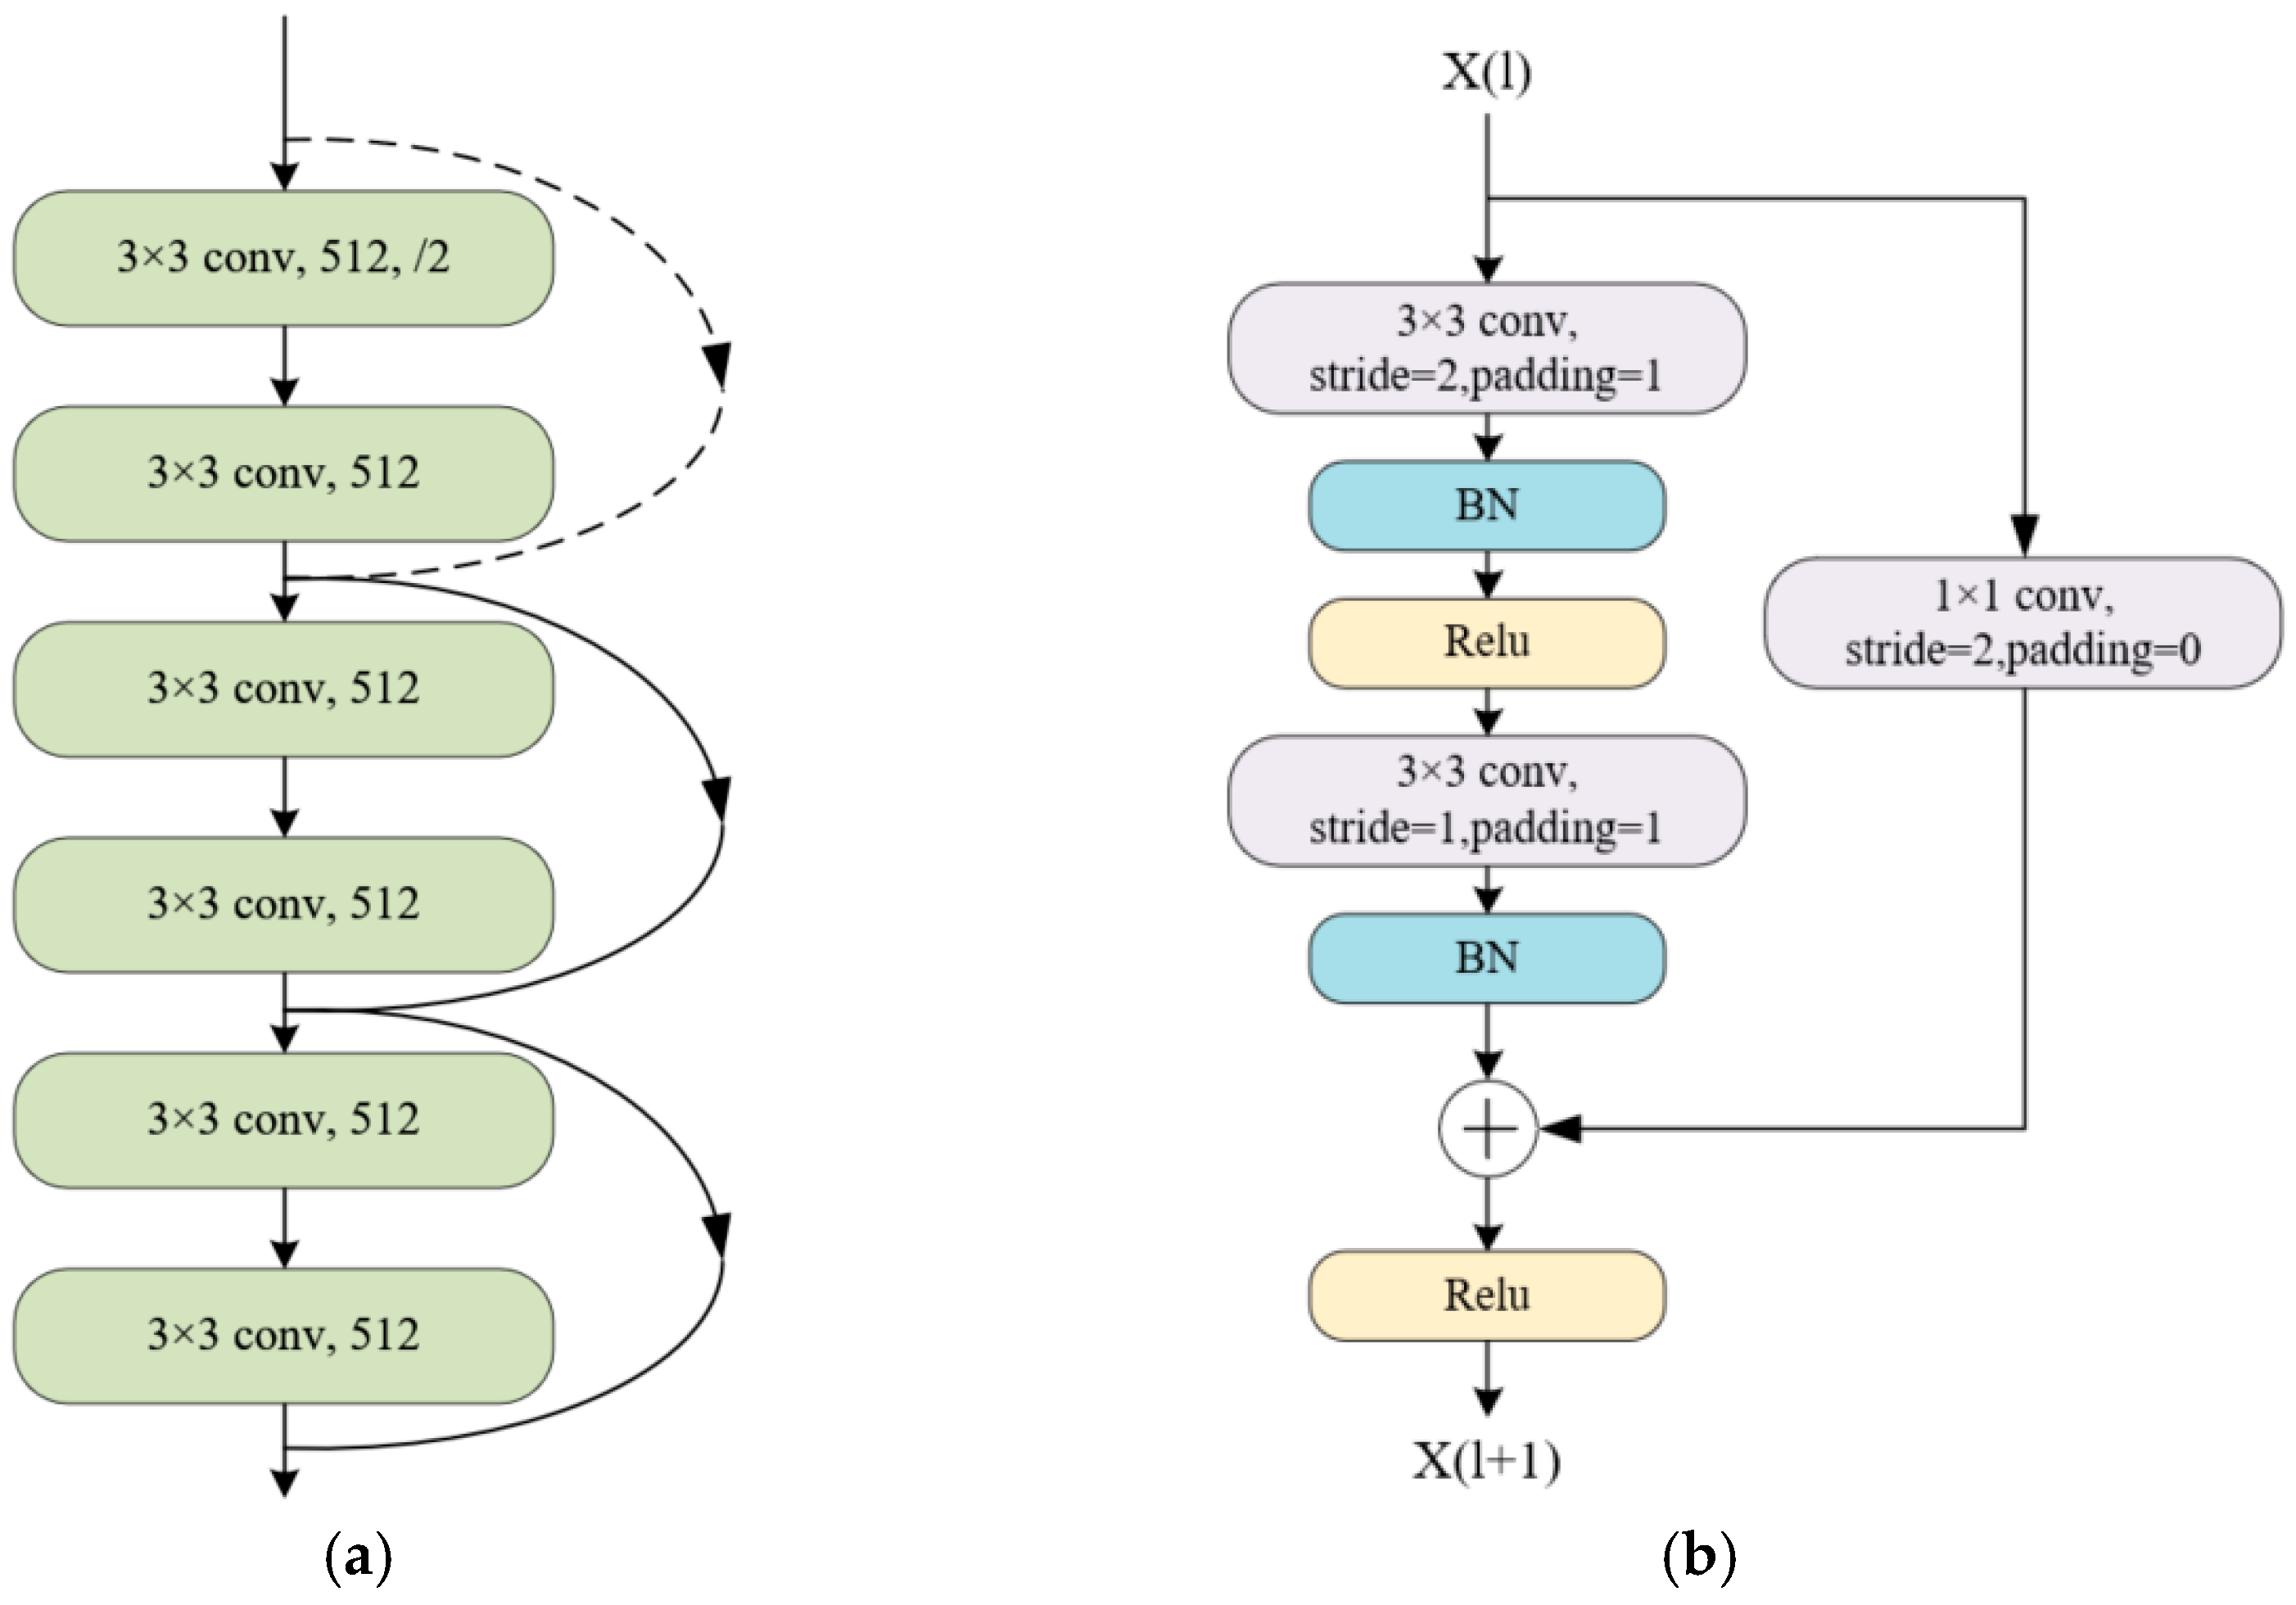
29] has local and global feature semantics. Inspired by learning and pixel-level segmentation features, this paper constructs an improved Swin-Unet model for semantic segmentation of macular edema in retinal OCT images. First of all, this paper uses the network layer of ResNet [30] to improve the bottleneck of Swin-Unet, consequently enhancing the extraction and learning of sub-feature maps and preventing the calculation of image features in a deep transformer network from poot convergence [31]. Second, global and local learning is performed using Swin Transformer blocks and skip-connected structures. Then, morphological processing is performed on the lesion area after the semantic segmentation is completed, and finally, training, testing, and comparative analysis are performed on the OCT image dataset of macular edema patients published by Duke University.
The model utilizes the Swin Transformer block to implement a local-to-global self-attention mechanism in the encoder, and combines the captured global features with the patch extension layer and Swin Transformer block for pixel-level segmentation and prediction in the decoder, and Swin Transformer is based on Transformer, therefore, while reducing the loss of feature extraction in the deep network, it can also improve the segmentation accuracy of macular edema in retinal OCT images.
Specifically, the contributions of this paper can be summarized as:
(1)
By introducing the Swin-Unet model, it can effectively extract context information and restore spatial resolution of the macular edema in retinal OCT images, so that the generalization performance of semantic segmentation for macular edema is improved in retinal OCT images.
(2)
By using the fifth-layer network of ResNet34 as the bottleneck of the Swin-Unet model to increase the extraction of the sub-feature map, which improves the accuracy of lesion area segmentation.
(3)
The edge of the predicted edema area is smoothed and denoised by the morphological opening operation to eliminate speckle noise in the image, improve the segmentation accuracy and increase the visual effect.
The rest of the paper is structured as follows: Section 2 details the Swin-Unet method, and introduces the improved network model, Section 3 describes the dataset and experimental related configurations, and presents the experimental results and comparative analysis, Section 4 gives the discussion and ablation experiments are carried out, and Section 5 summarizes the full text and draws the research conclusions.

2. Materials and Methods

The model in this paper is based on the improved Swin-Unet network model and performs two-level semantic high-precision segmentation operations on the macular edema region and the image background region in retinal OCT images. Figure 2 shows the flow chart of the proposed method, which is divided into five stages. The first stage is the input operation of retinal OCT images. In the second stage, in order to improve the generalization performance of model learning, mirror, rotation, color jitter, random deduction, scale transformation, and shift data amplification are performed on the data. The mirror operation uses the remap function, and the interpolation method uses bilinear interpolation. The rotation angle is 0–15°. Color dither operation is to add a slight noise to the original pixel value of some images. The scaling operation is to change the resolution of some images to 0.6, 0.9 and 1.2 times the original image. The translation operation shifts the original image 20 pixels to the right and 30 pixels to the top. In the third stage, the augmented data is inputted into the improved Swin-Unet model for two-level semantic segmentation. In the fourth stage, in order to eliminate the smoothness of some lesion areas after network segmentation, morphological method [32] is adopted to conduct post-processing operations on the segmented image, so that can achieve the best visualization effect after segmentation. Finally, the morphologically processed image data is outputted in the fifth stage.

2.1. Swin-Unet Network Structure

The Swin-Unet network structure is a U-shaped architecture, and the encoder, bottleneck, and decoder in this network are implemented based on Swin Transformer blocks. The patch merging layer and the patch expanding layer are developed in Swin-Unet. The patch merging layer can increase the feature dimension of the image, and the patch expanding layer can realize the operation of upsampling the image. Additionally, this model has achieved results on the multi-organ segmentation dataset Synapse and the automatic cardiac diagnosis challenge dataset ACDC. In the process of encoding and decoding images, this network structure realizes local-to-global self-attention, performs pixel-level segmentation and prediction tasks from global features, better preserves image features, and effectively prevents the misclassification of the macular edema region in this paper. The network structure of Swin-Unet is shown in Figure 3a, the architecture of Swin-Unet consists of encoder, bottleneck, decoder and skip connections, in which encoder, bottleneck, and decoder are all composed of Swin Transformer blocks. Among them, the Swin Transformer is based on the shift window. As shown in Figure 3b, there are two consecutive Swin Transformer blocks. Each Swin Transformer block includes a LayerNorm (LN) layer, a multi-head self-attention (MSA) module, residual connections, and 2-layer MLP with GELU non-linearity. In two successive Swin Transformers blocks, the window-based multi-head self attention (W-MSA) module and the shifted window-based multi-head self attention (SW-MSA) module are used respectively.
Based on this window division mechanism, continuous Swin Transformer blocks can be represented by Formulas (1)–(4):
z ^ l = W _ M S A ( L N ( z l 1 ) ) + z l 1
z l = M L P ( L N ( z ^ l ) ) + z ^ l
z ^ l + 1 = S W _ M S A ( L N ( z l ) ) + z l
z l + 1 = M L P ( L N ( z ^ l + 1 ) ) + z ^ l + 1
Among them, in Formulas (1)–(4), where z ^ l and z l represent the output of the (S)W-MSA module and the MLP module for the l   th block, respectively. The calculation formula of the self-attention layer is shown in Formula (5):
A t t e n t i o n ( Q , K , V ) = S o f t M a x ( Q K T d + B ) V
where Q , K , V R M 2 × d represents the query matrix, key matrix and value matrix respectively. M 2 represents the number of patches in the window, and d represents the dimension information of the query or key. Since the axial values of the relative positions in the model are all between [ M + 1 , M 1 ] , a smaller deviation matrix needs to be parameterized as B ^ R ( 2 M 1 ) × ( 2 M + 1 ) , and B takes the value from B ^ as the bias.
The annotated image patch is inputted into the encoder in the structure, which uses the Swin Transformer block with a shifted window as the encoder to extract the context information. The multi-dimensional features are up-sampled through the patch expanding layer to restore the spatial resolution of the feature map, and the multi-scale feature fusion is obtained by combining skip connections, so that the prediction effect of further segmentation is achieved.

2.2. Improved Swin-Unet Network

2.2.1. Introducing the Network Layer of ResNet

Swin-Unet is more effective in extracting context information and restoring spatial resolution, but in the deep bottleneck, the transformer module cannot obtain good results in the convergence of image feature calculation. In order to better extract the features of the macular edema area and improve the overall segmentation effect, this chapter makes improvements to the bottleneck in Swin-Unet. Because the design of the residual block in the residual network will not cause the computing power of feature extraction to decrease with the deepening of the network, it is appropriate to replace the two consecutive Swin Transformer blocks in Swin-Unet at the bottleneck position with this residual block.
As a popular architecture in the current neural network, the ResNet network is mainly composed of multiple residual modules. The specific design of the residual module solves the problem of network degradation caused by the deepening of the network level, so that the parameter calculation of the network is realized for the thousands of layers. After optimization and comparison, the ResNet deep network is used as the bottleneck in Swin-Unet to improve the segmentation accuracy of the model for small areas of macular edema in the retina.
In the fifth-layer structure of ResNet34 and the Swin-Unet bottleneck, the image resolution and feature dimension remain unchanged, so the fifth-layer network of ResNet34 is used as the bottleneck of the model in this paper, which can achieve the resolution and dimension of the sub-feature map at the bottleneck, the purpose will not change. As shown in Figure 4a, the fifth-layer network structure of ResNet34 includes 3 residual modules, and is used to replace the two Swin Transformer blocks at the bottleneck in Swin-Unet. Figure 4b shows that the specific structure of each residual module is a residual block layer with two convolution blocks, two layers of Batch Normalization (BN), and a RELU. The structure on the side becomes the shortcut layer. In order to ensure that the number of calculated feature channels from the two channels before the last RELU in each residual block is the same, the calculated channel dimensions in the residual block and shortcut are different, and in a residual block, the channel dimension of shortcut is twice the channel dimension of the residual block. This designed structure can ensure that the feature extraction of the deep convolution can be completed, and the dimension of the feature map can also remain unchanged.

2.2.2. The Network Architecture of This Paper

Using the fifth layer network of ResNet34 to replace the bottleneck in Swin-Unet, the improved Swin-Unet network achieves a significant improvement in the segmentation of macular edema regions in retinal OCT images.
As shown in Figure 2, the improved Swin-Unet network structure in this paper is composed of encoder, bottleneck, and decoder.
In the encoder, firstly, in order to realize the sequence input, the patch partition layer is used to divide the image into patch blocks, and the C-dimensional H/4 × W/4 tokenization operation is performed on the data through the linear embedding layer.
In the patch merging layer, the input patch is divided into four parts, and the four parts are connected together through the patch merging layer, so that the resolution of the patch is resized to 1/2 of the original. In fact, in the patch merging layer, the merged feature dimension has become 4 times the original size, but a linear layer is added on top of the spliced feature to unify the feature dimension to 2 times the original dimension.
At the bottleneck, according to the characteristic that the residual network block in ResNet will not degrade as the layer deepens, this paper uses the fifth-layer network structure in ResNet34 to make up for the inability of the transformer module to converge in the calculation of the deep network. Therefore, deep feature learning and extraction are performed on the lesion area of the OCT image. Using a convolution module at the deep bottleneck can increase feature learning on tokenized data, where the input feature resolution is W/32 × H/16.
In the patch expanding layer, the purpose of image feature upsampling is achieved, and the input feature is first doubled by the dimension of the linear layer feature. Following this, the rearrangement operation is used to double the resolution of the input features, and the feature dimension also becomes 1/4 times the features before the input rearrangement operation.
In the decoder, corresponding to the encoder, the patch expanding layer is used to perform patch expansion and upsampling operations on the extracted deep features, so as to realize the image reconstruction of the feature maps of adjacent dimensions. This process doubles the resolution of the image features, and the corresponding feature dimension becomes 1/2 times the original.
In skip connection, the multi-scale feature of the encoder and the up-sampled feature are fused to connect the shallow features and deep features together to reduce the loss of spatial information caused by down-sampling, and finally, a guaranteed connection feature of the linear layer is the same size as the up-sampling feature.

2.3. Morphological Processing

In order to eliminate the problem of unevenness in some lesion areas after network segmentation, an open operation of the morphological method is used to post-process the segmented images, eliminate speckle noise in the images, improve segmentation accuracy, and increase visualization effects.
The proposed algorithm flow is shown as Algorithm 1.
Algorithm 1 The Proposed Algorithm.
1. Data input
2. Data augmentation of dataset
3. Input augmented dataset into the proposed method
4. While ε has not converged do
5. For t = 0, 1, …, n do
6.  Sample {Xi}m, {Yi}mPdata (H, W, 3) a batch from the dataset
7.   Pdata (H, W) → Pdata (H, W, C)
8.   Patch partition(Pdata)
9.    Linear embedding(Pdata)
10.   Swin transformer(Pdata)
11.  Patch merging(Pdata)
12.   Conv (Pdata)
13.  Patch expanding(Pdata)
14.  Linear projection(Pdata)
15.  Gε(dice) ← ∇wLossdice(Pdata)
16.  εε + ξGε(dice)
17.  end for
18. end while
19. Data morphological processing
20. Output the segmented OCT image.
Where n is the number of iterations, m is the batch size, and ε is the model parameter.

3. Experimental Results

3.1. The Dataset

The proposed method is trained and tested on the DME patient dataset publicly available from Duke University [33], which consists of 110 SD-OCT B-scan images with a size of 512 × 740, these images were obtained from 10 patients with DME. In these 110 pictures, ophthalmology expert 1 and expert 2 mark the macular edema region in the retinal layer. In this experiment, the annotations of expert 1 and expert 2 are used as the gold standard for training the network respectively, and the method proposed is compared and evaluated with the existing main methods.

3.2. Experimental Configuration

In the experiment, the 1.10.1 version of Pytorch (Sunnyvale, CA, USA) was used as the deep learning framework, the Nvidia version (Santa Clara, CA, USA) of the RTX3090 24 GB video memory was used, the 2021.05 version of Anaconda (Austin, TX, USA) and the 11.2 version of Cuda (Menlo Park, CA, USA) were used. The weights pre-trained on ImageNet is used to initialize the model parameters, the impulse of the stochastic gradient descent optimizer is set to 0.9, weight decay is set to 0.0001, and the initial learning rate is set to 0.01, used to optimize the backpropagation of the model. Firstly, the OCT image data is augmented, including data augmentation operations such as mirroring, rotation, color jitter, etc., augment the image data to 50 times the original, and then randomly select 70% as the training set, 20% as the validation set, 10% as a test set. In the experiment, 500 epochs of training were performed on the training set, the batch size of the training was 24, and the quantification index value of the validation set was outputted every 5 epochs of training.

3.3. Quantitative Indicators

The proposed algorithm uses the Dice, IOU, Recall and Precision as quantitative indicators in the experiment, which are calculated as Formulas (6)–(9). The higher the quantization value, the better the effect of model segmentation.
D i c e = 2 × a r e a ( N p N g t ) a r e a ( N p ) + a r e a ( N g t )
I o u = a r e a ( N p N g t ) a r e a ( N p N g t )
R e c a l l = T P T P + F N
P r e c i s i o n = T P T P + F P
where N p represents the predicted area of macular edema, N g t represents the area of macular edema marked by experts, TP is the number of pixels correctly predicted by the model for the area of macular edema, FN is the number of pixels in the non-real area of macular edema predicted by the model, and FP is the number of pixels in the non-real macular edema area predicted by the model.

3.4. Results

In this paper, the existing main methods are introduced to perform macular edema segmentation on OCT images. The results of the proposed segmentation method are compared with the results marked by expert 2 (expert 1), the segmentation results of the FCN [34], TransUNet, and Res-UNet++ methods through quantitative indicators. The comparison results of the corresponding methods are listed in Table 1 below. When the annotation of expert 1 is marked as the golden annotation, the Dice of the proposed method is 0.82, Iou is 0.80, Recall is 0.85 and Precision is 0.82, which are 0.02, 0.02, 0.01 and 0.02 higher than the previous best Res-UNet++ quantization index respectively. When the annotation of expert 2 is marked as the golden annotation, the Dice of the proposed method is 0.80, Iou is 0.81 and Precision is 0.79, which are 0.02, 0.05 and 0.01 higher than the previous best Res-UNet++ quantization index respectively, and Recall were both equal at 0.82. Therefore, the proposed method achieves the best segmentation effect on these four quantitative indexes, it demonstrates that the proposed method has good model generalization performance and strong algorithm robustness.
Excepted where noted, taking the annotation of expert 1 as the golden annotation standard as follows.
The confusion matrix comparison results are shown in Figure 5, in terms of the mean number of pixels for macular edema prediction, it can clearly illustrate that the prediction effect of the proposed method is much better than that of FCN, TransUNet and Res-UNet++ networks. Compared with the existing main method, the mean number of pixels predicted by the proposed method for macular edema is 612, 188, and 62 more, respectively, and the Recall is increased by 16%, 5%, and 1%, respectively. It illustrates that the proposed method has fewer missed and misclassified phenomena, and a better binary segmentation effect.
In the actual area of macular edema, the existence of macular edema area size is irregular, some disease area is large, some disease area is lesser, disease area smaller existing background region of the retina becomes big, and now classified as a kind of unbalanced phenomenon in a data set, namely, the negative samples more than positive samples. In response to this problem, the receiver operating characteristic (ROC) curves are introduced to solve this problem in actual or experimental datasets.
As shown in Figure 6, the ROC curves of the FCN, TransUNet, Res-UNet++ networks and the proposed method are compared, and the area under the ROC curve (AUC) is used as an indicator to evaluate the model. The AUC value of the proposed method is 0.996, which is 0.003, 0.081 and 0.165 higher than FCN, TransUNet and Res-UNet++ respectively. It indicates that the proposed method has a better semantic segmentation effect on unbalanced samples.
As shown in Figure 7, the original image, the image marked by expert 1, the image marked by expert 2, the segmentation results of the TransUNet model, the Res-UNet++ model and the proposed method are shown on two OCT images respectively.
It is not difficult to see from Figure 7 that the macular edemas are difficult to segment in the two OCT images due to factors, such as multi-scale and multi-region, irregular shape, non-uniform grayscale, and non-fixed position. The semantic segmentation results of the proposed method are better close to the golden segmentation standard of Expert 1, and there is almost no misclassification or omission, which further improves the overall semantic segmentation performance of macular edema.
In essence, in the segmentation of macular edema in retinal OCT images, the improvement of the above quantitative indicators and qualitative effects of the proposed semantic segmentation method, which is mainly due to the improvement of the network structure at the bottleneck of the proposed method. The deep convolution operation is used to achieve a better calculation convergence effect, reduce the misclassification or missed classification of multi-scale and multi-regional macular edema, and achieve better segmentation results of multi-scale and multi-regional edema. Further, this paper selects 100 OCT images including multi-scale and multi-region macular edema from the augmented overall data set as the test set to verify the good segmentation effect of this method on multi-scale and multi-region macular edema OCT images.
On the test set of 100 OCT images with multi-scale and multi-region macular edema, the FCN, TransUNet, and Res-UNet++ methods are used to compare with the proposed method. The comparison results are listed in Table 2. When the annotation of expert 1 is marked as the golden annotation, the Dice of the proposed method is 0.83, Iou is 0.82, Recall is 0.86 and Precision is 0.84, which are 0.02, 0.01, 0.01 and 0.02 higher than the previous best Res-UNet++ quantization index respectively. When the annotation of Expert 2 is marked as the golden annotation, the Dice of the proposed method is 0.81, Iou is 0.79, Recall is 0.86 and Precision is 0.84, which are 0.01, 0.02, 0.02 and 0.01 higher than the previous best Res-UNet++ quantization index respectively. Therefore, the proposed method obtains the best segmentation effect on these four quantitative indicators, which demonstrates that the prosed method has good model generalization performance and strong algorithm robustness on OCT images with multi-scale and multi-region macular edema.
In OCT images with multi-scale and multi-region macular edema, the confusion matrix comparison results are shown in Figure 8, in terms of the mean number of pixels for macular edema prediction, it can clearly signify that the prediction effect of the proposed method is better than that of FCN, TransUNet and Res-UNet++ networks. Compared with the other three methods, the mean number of pixels predicted by the proposed method for macular edema is 789, 157, and 63 more, respectively, and the Recall is increased by 22%, 6%, and 1%, respectively. It demonstrates that the proposed method has fewer missed and misclassified in OCT images of multi-scale and multi-regional macular edema, and has and much better binary segmentation effect.
As shown in Figure 9, the ROC curves of the FCN, TransUNet, Res-UNet++ networks and the proposed method are compared, and the area under the ROC curve (AUC) is used as an indicator to evaluate the model. The AUC value of the proposed method is 0.995, which is 0.007, 0.089 and 0.183 higher than FCN, TransUNet and Res-UNet++ respectively. It indicates that the proposed method has a much better semantic segmentation effect on multi-scale and multi-regional macular edema OCT images of unbalanced samples.
Figure 10 shows the original image, the image marked by expert 1, the image marked by expert 2, the segmentation results of the TransUNet model, the Res-UNet++ model, and the proposed method on a macular edema OCT image with multi-scale and multi-region respectively. There are 11 edema areas marked in the expert 1 image, 10 edema areas marked by the expert 2, 6 areas are divided by TransUNet, and there exists a phenomenon that the edema areas are merged and connected, and there are 8 edema areas segmented by Res-UNet++, the proposed method segmented 10 edema regions, and the phenomenon of unsegmented and edema regions merged between regions was greatly reduced. In comparison, the semantic segmentation results of the proposed method are better close to the golden annotation standard of expert 1, with almost no misclassification or omission, which further improves the overall semantic segmentation performance of multi-scale and multi-region macular edema.
As listed in Table 3, on the selected edema OCT image test dataset with multi-scale and multi-region, the average absolute mean error between the number of edema regions segmented by each method and the golden annotation is calculated. The results show that the average absolute error value of the proposed method is 2.37, which is the smallest, which is 2.56, 1.09, and 0.61 smaller than expert 2, TransUNet and Res-UNet++ respectively.

4. Discussion

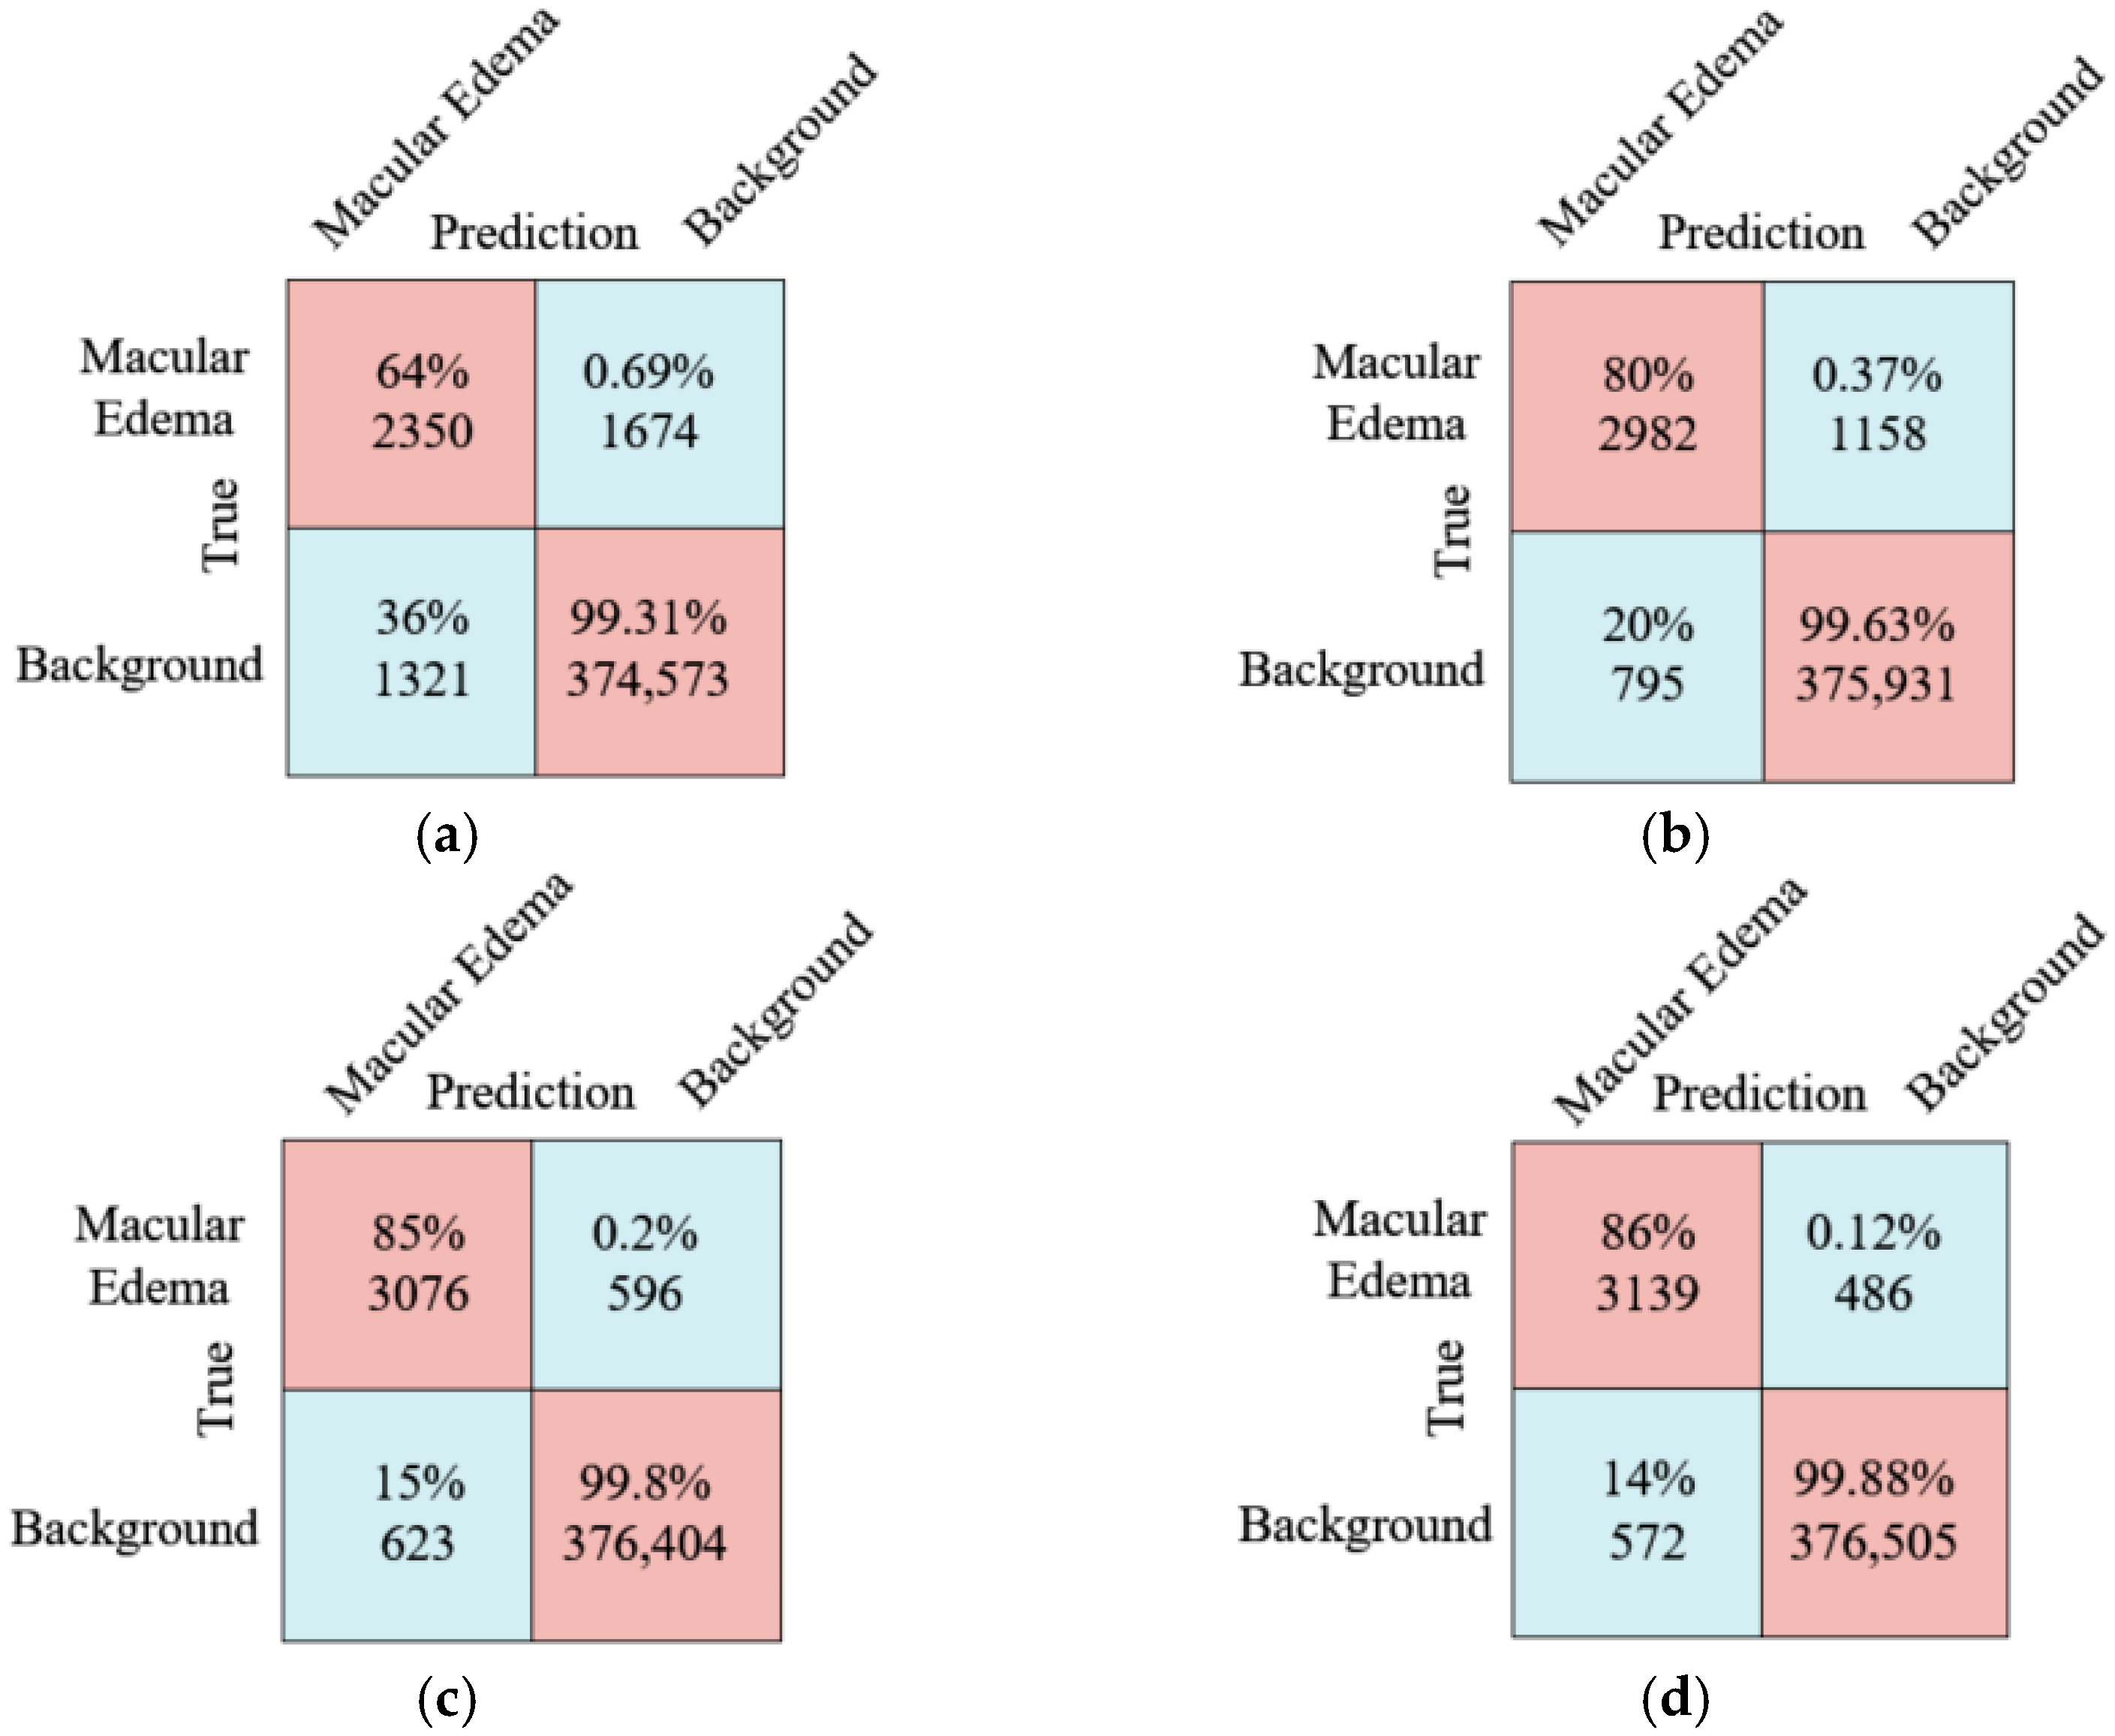
The two improvements of this paper are shown on the whole test set and the macular edema test dataset with multi-scale and multi-region, replacing the bottleneck and morphological processing and the significant effect of the introduced Swin-Unet model on improving the segmentation effect of macular edema in retinal OCT images. Through the ablation experiment, the results of the Swin-Unet method, Swin-Unet+morphological processing, Swin-Unet+replacement bottleneck method and the proposed method are compared on OCT images.
As listed in Table 4, on the whole test dataset, compared with Swin-Unet+ replacement bottleneck method, Swin-Unet+morphological processing method and Swin-Unet method, the proposed method is improved to 0.01, 0.04 and 0.05 on Dice, 0.02, 0.04 and 0.05 on Iou, 0.03, 0.06 and 0.08 on Recall, 0.03, 0.04 and 0.04 on Precision.
As listed in Table 5, on the macular edema test dataset with multi-scale and multi-region, compared with Swin-Unet+replacement bottleneck method, Swin-Unet+ morphological processing method and Swin-Unet method, the proposed method is improved to 0.02, 0.04 and 0.05 on Dice, 0.02, 0.04 and 0.05 on Iou, 0.03, 0.06 and 0.06 on Recall, 0.02, 0.06 and 0.06 on Precision.
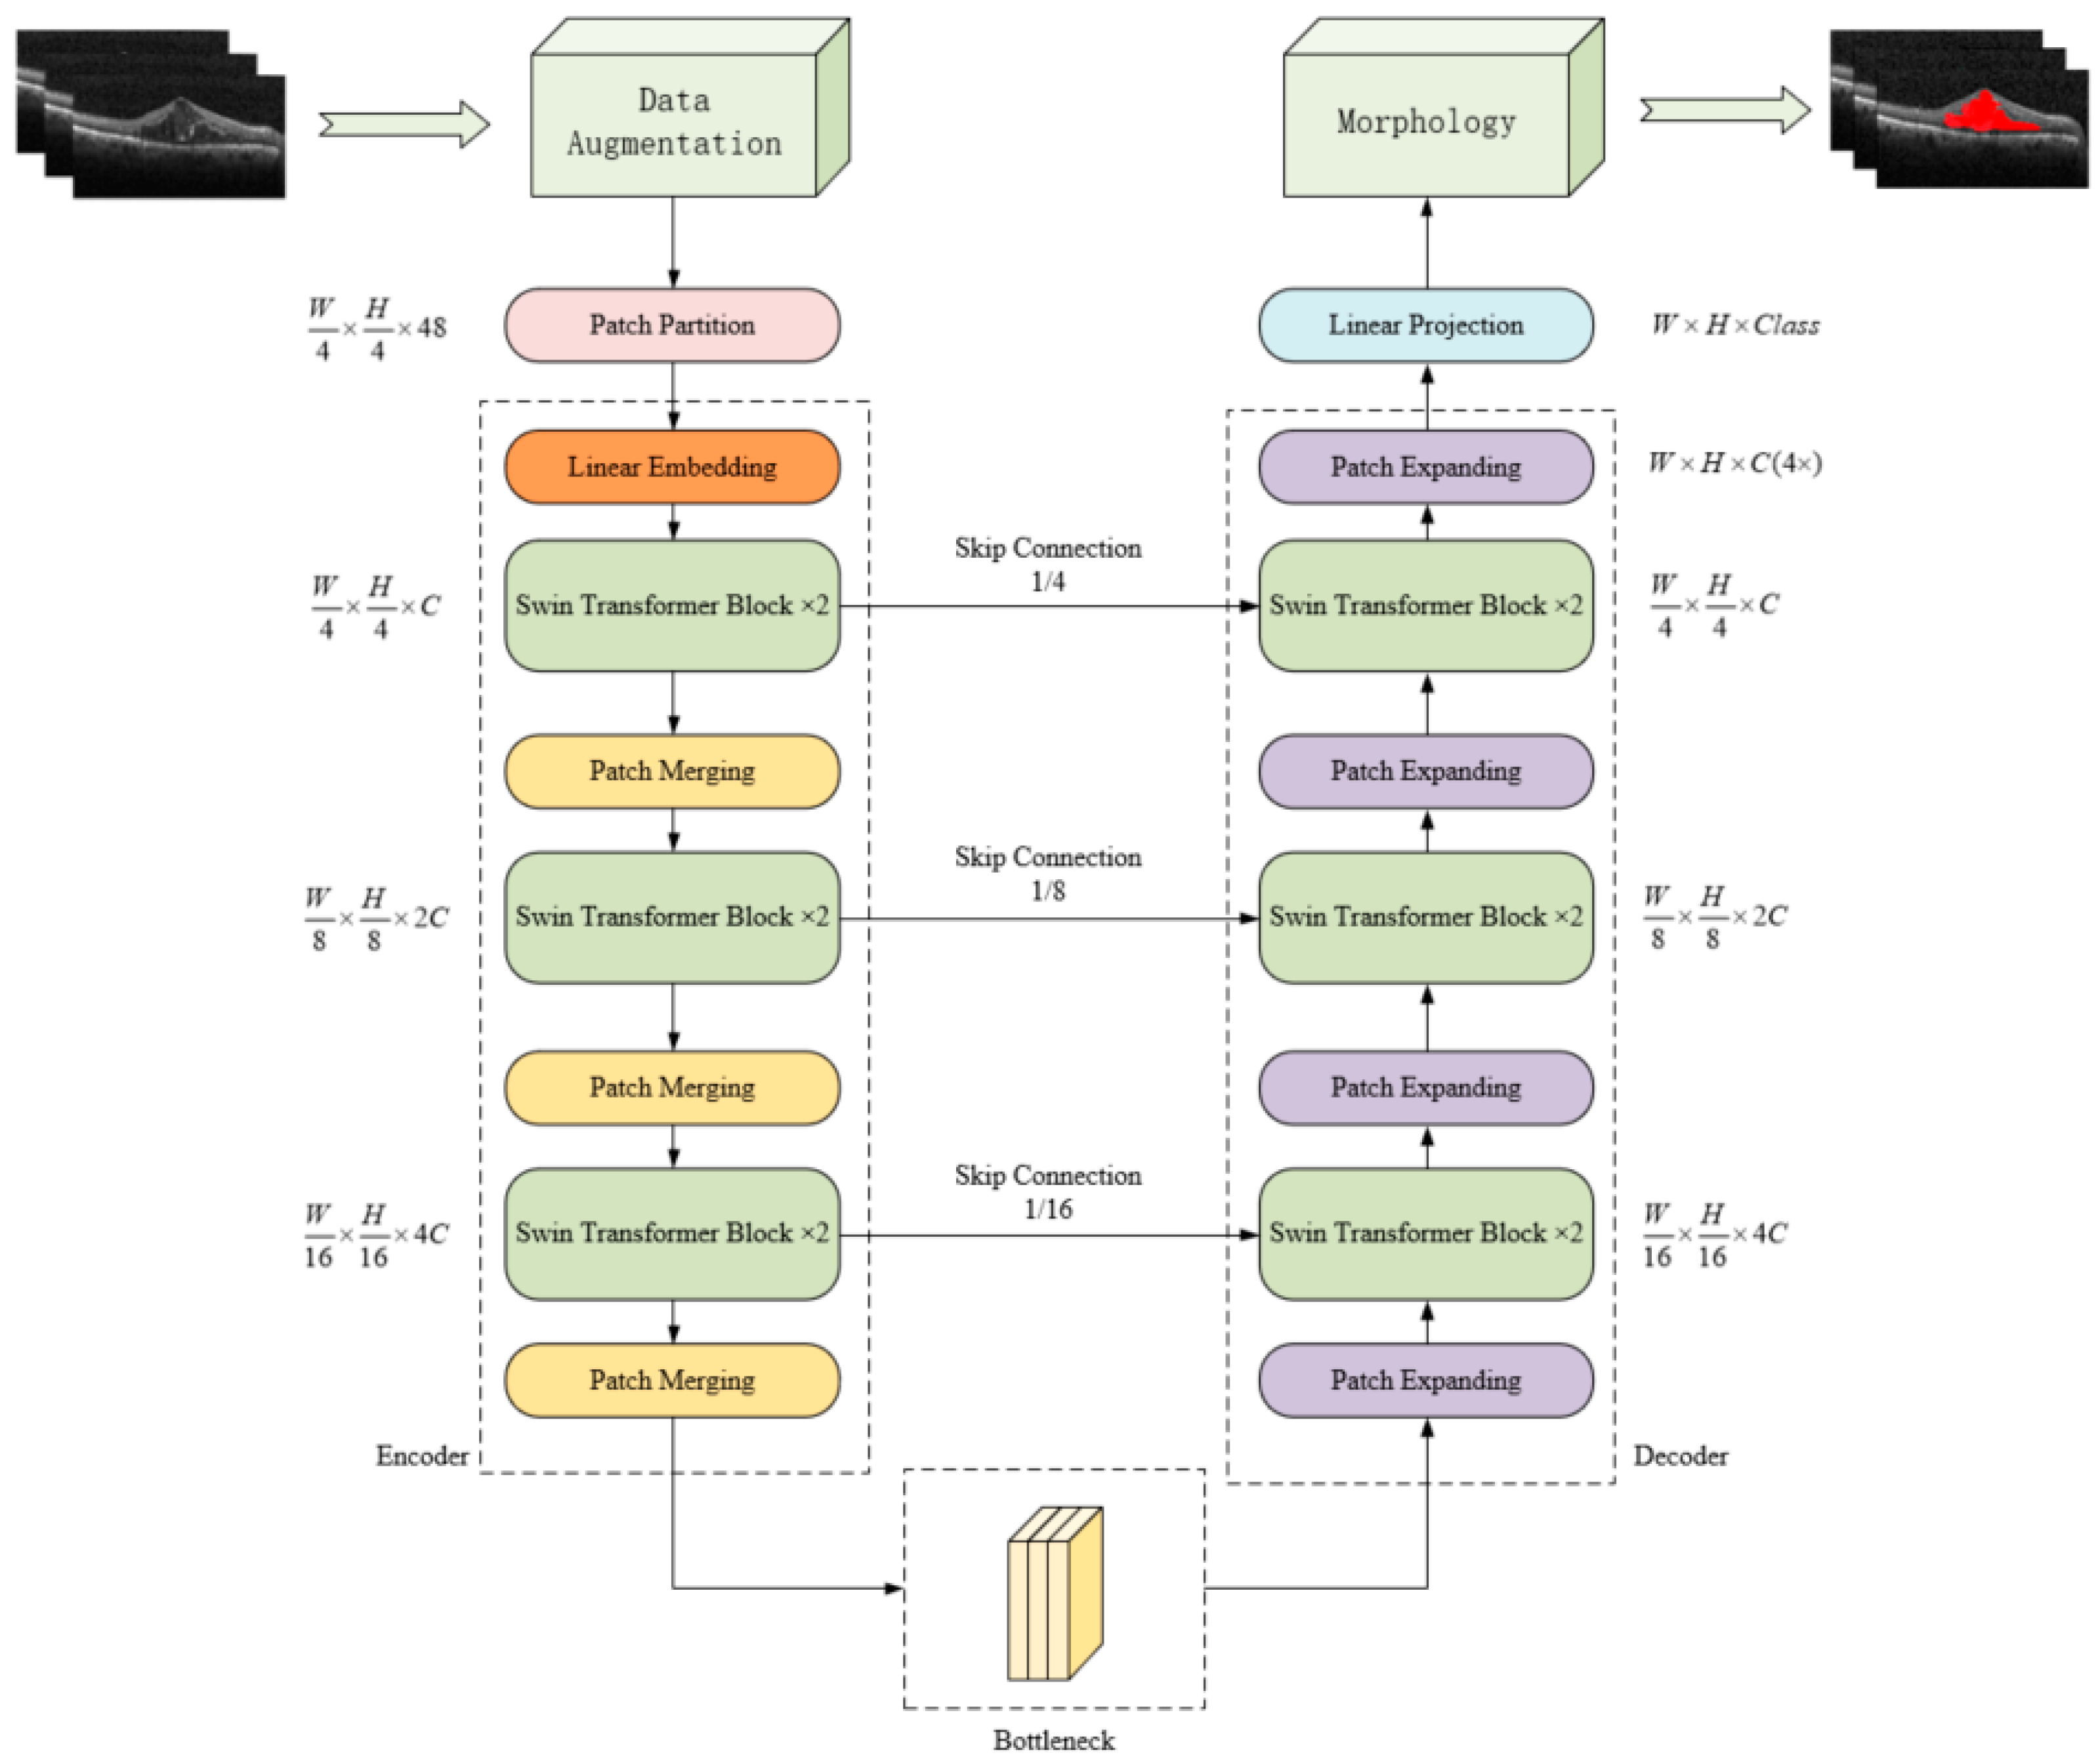
In the Swin-Unet model, the number of skip connections also has an effective influence on the segmentation effect of macular edema in retinal OCT images. As shown in Figure 2, in this model, skip connections are added at positions 1/4, 1/8, and 1/16. As listed in Table 6, in the overall test set, except that the value of Iou with two skip connections is 0.01 higher than that with three hop connections, the other three quantitative indicators are the highest when the jump connection is 3, and the segmentation ability of the model increases as the number of skip connections increases, so the number of skip connections is set as 3 in this work.
Aiming at the bottleneck structure of the Swin-Unet network, the proposed method improves the fifth-layer network introduced by ResNet34. In the existing network, the fifth-layer network structure in ResNet101 is modified as a bottleneck to realize the pairing of sub-features. The deep feature extraction of the graph, and other structures are the same as the model structure of this work. As listed in Table 7, for the two bottleneck replacement models, compared with the network model introduced with ResNet101, except that the model introduced with ResNet34 in this paper reduced by 0.01 in Iou, the ResNet101 network model improved to 0.01, 0.01, and 0.02 in Dice, Recall, and Precision, respectively.
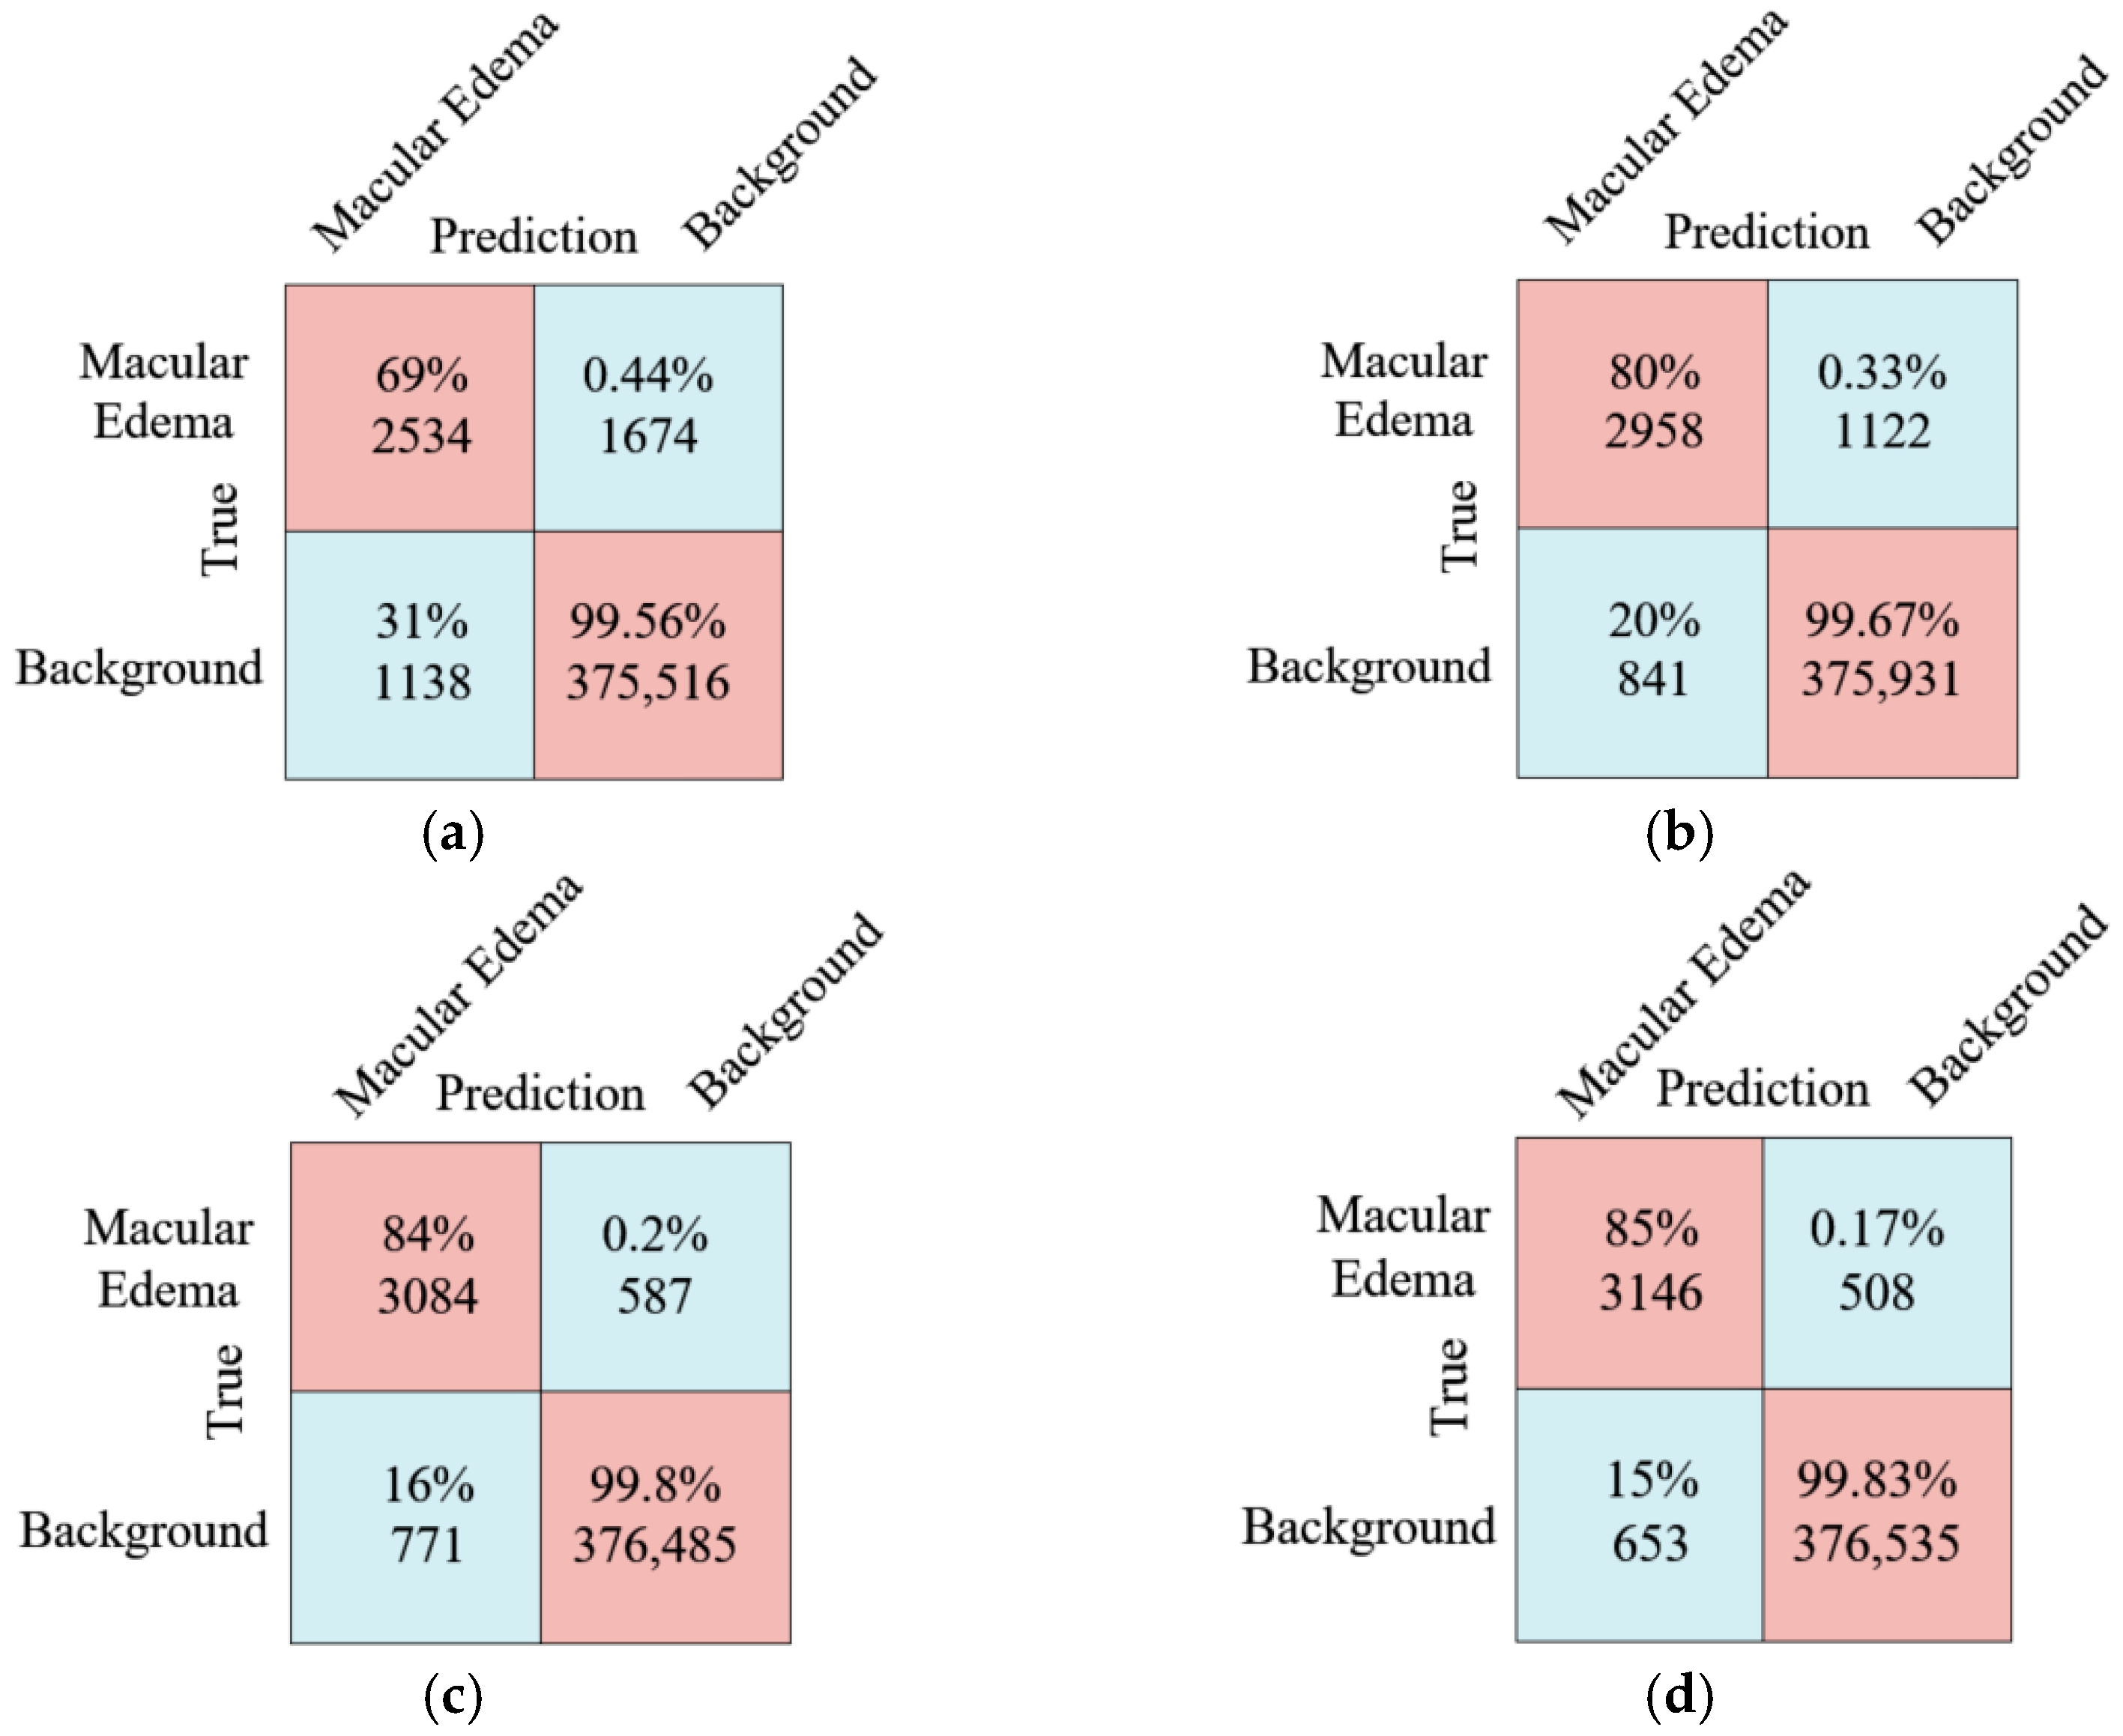
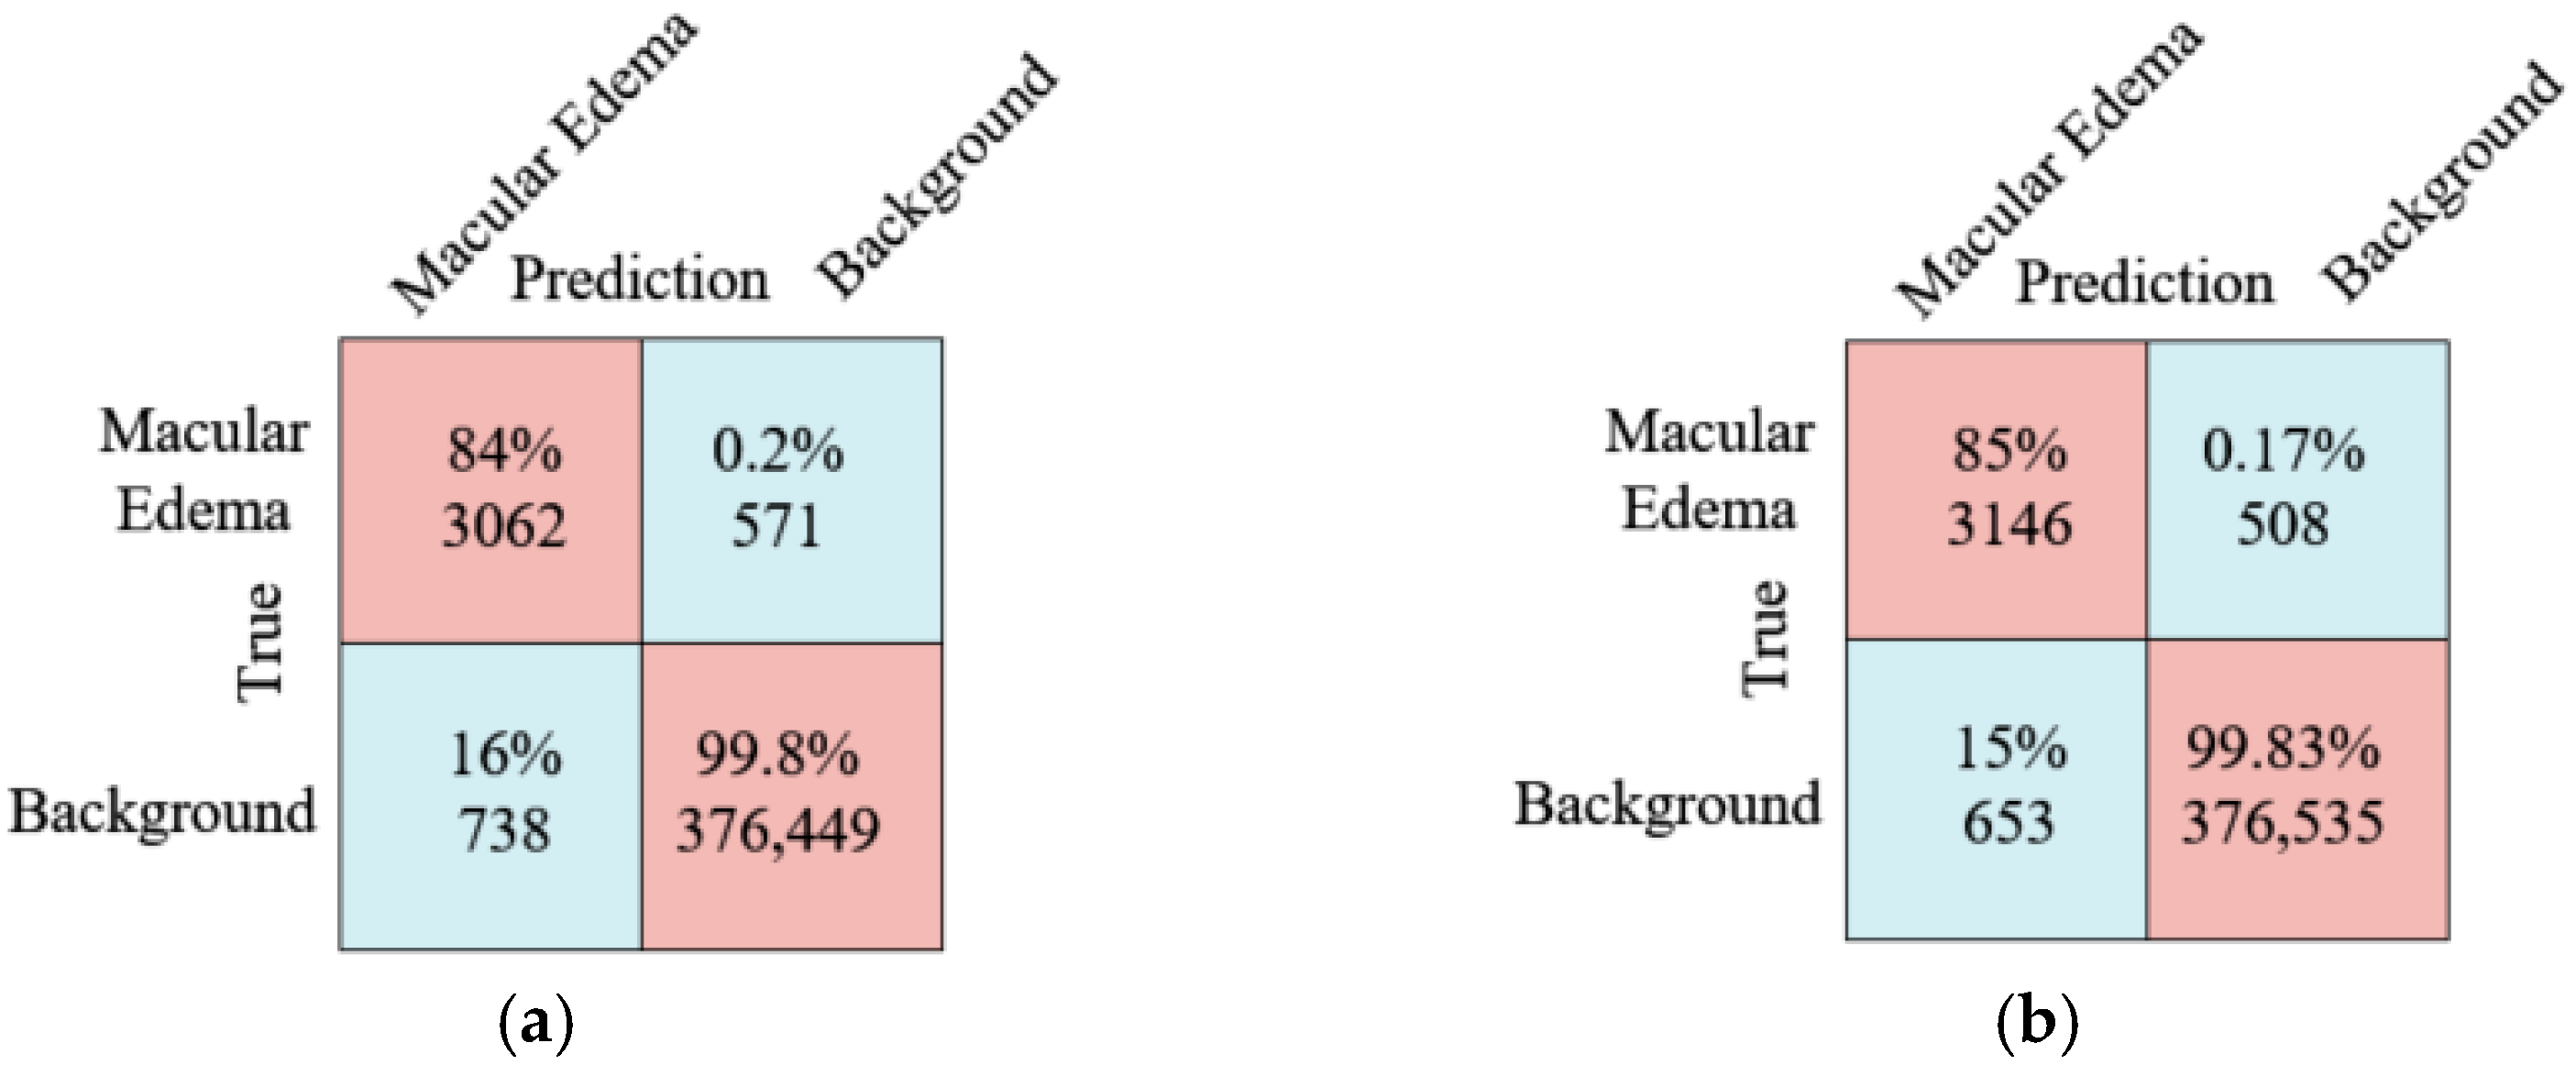
As shown in Figure 11, the confusion matrix comparison diagram shows the comparison results of the model introduced by ResNet101 and the proposed method. For the mean number of pixels in the edema region is predicted, it can be clearly seen from the diagram that the proposed method is 84 more than the ResNet101 network layer, and the Recall improved by 1%. The prediction effect of the proposed method is much better than that of the ResNet101 network layer method.
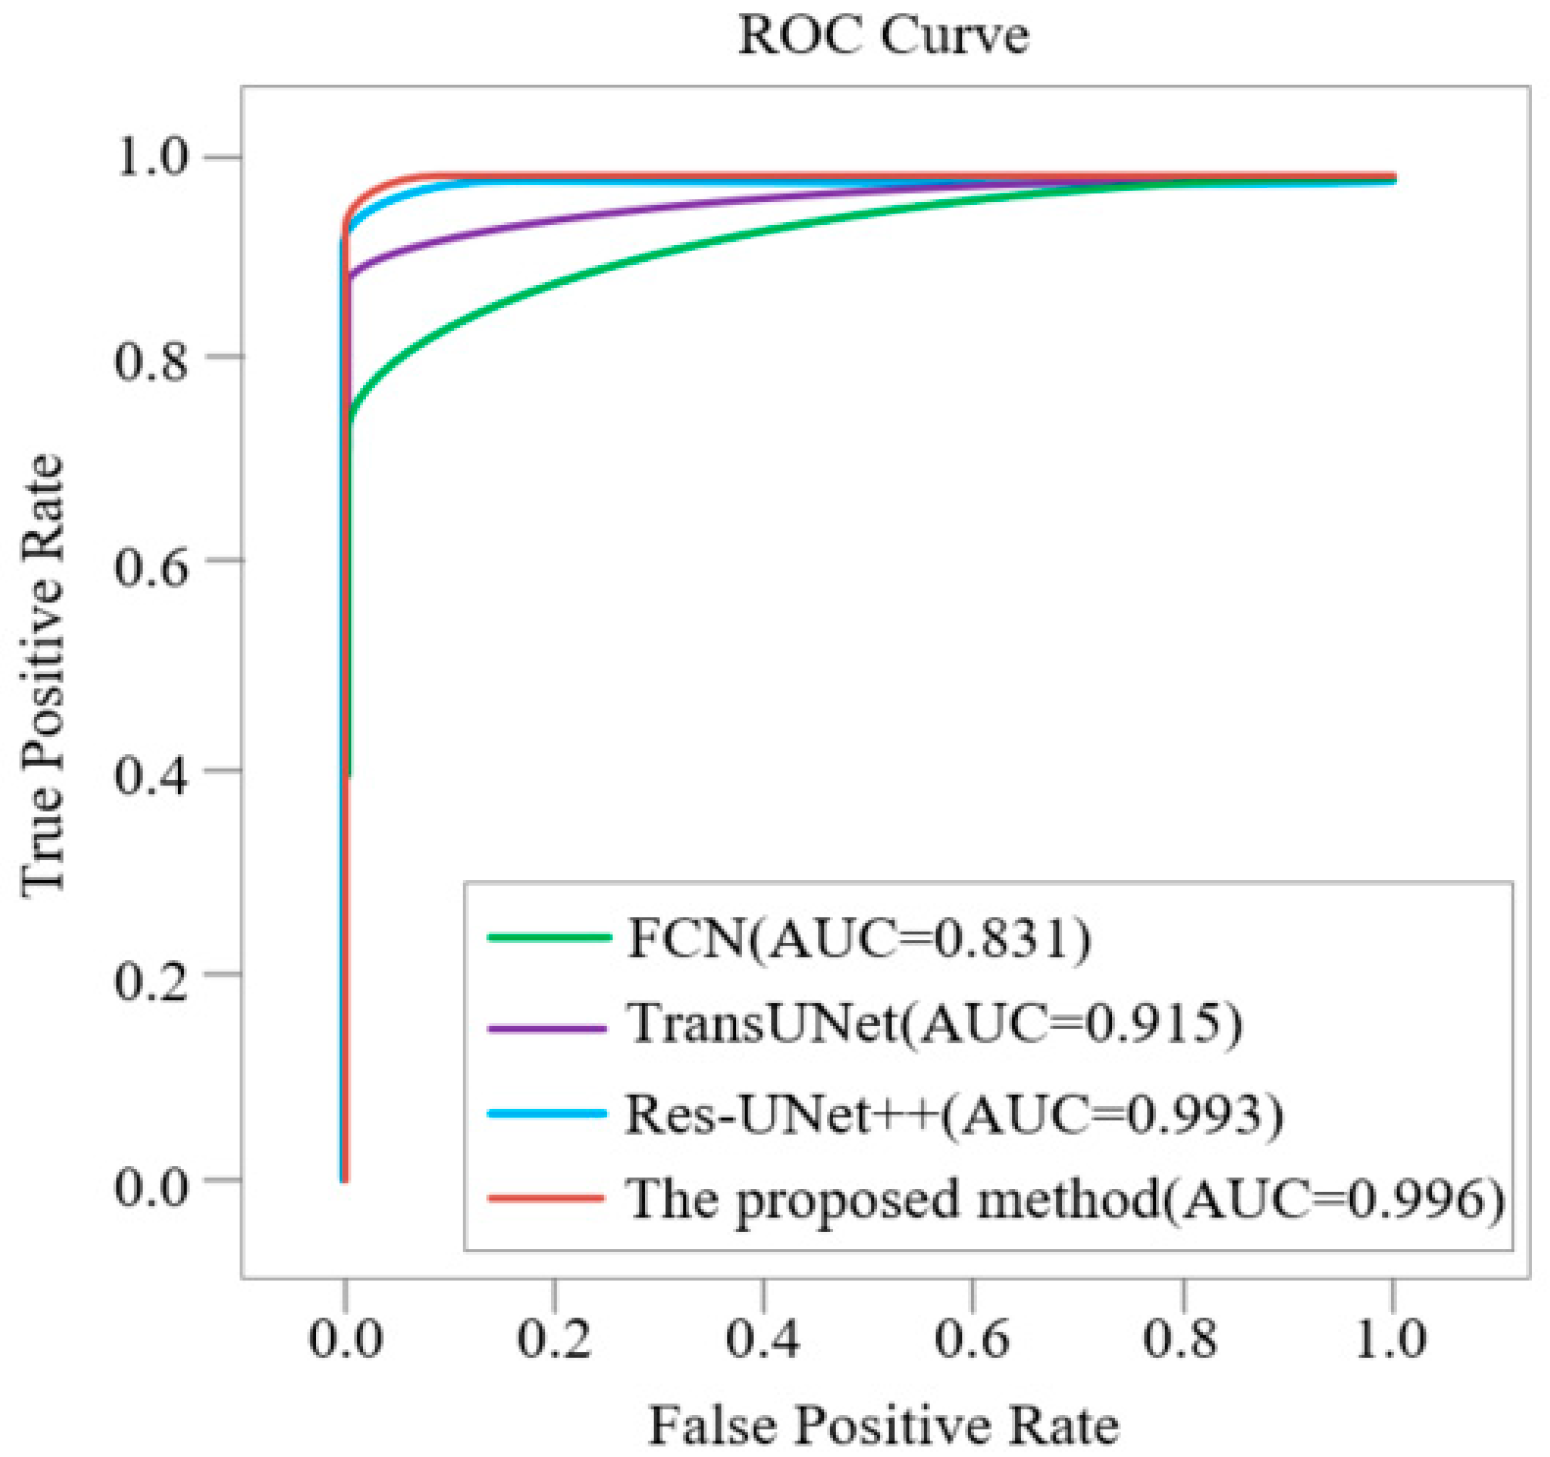
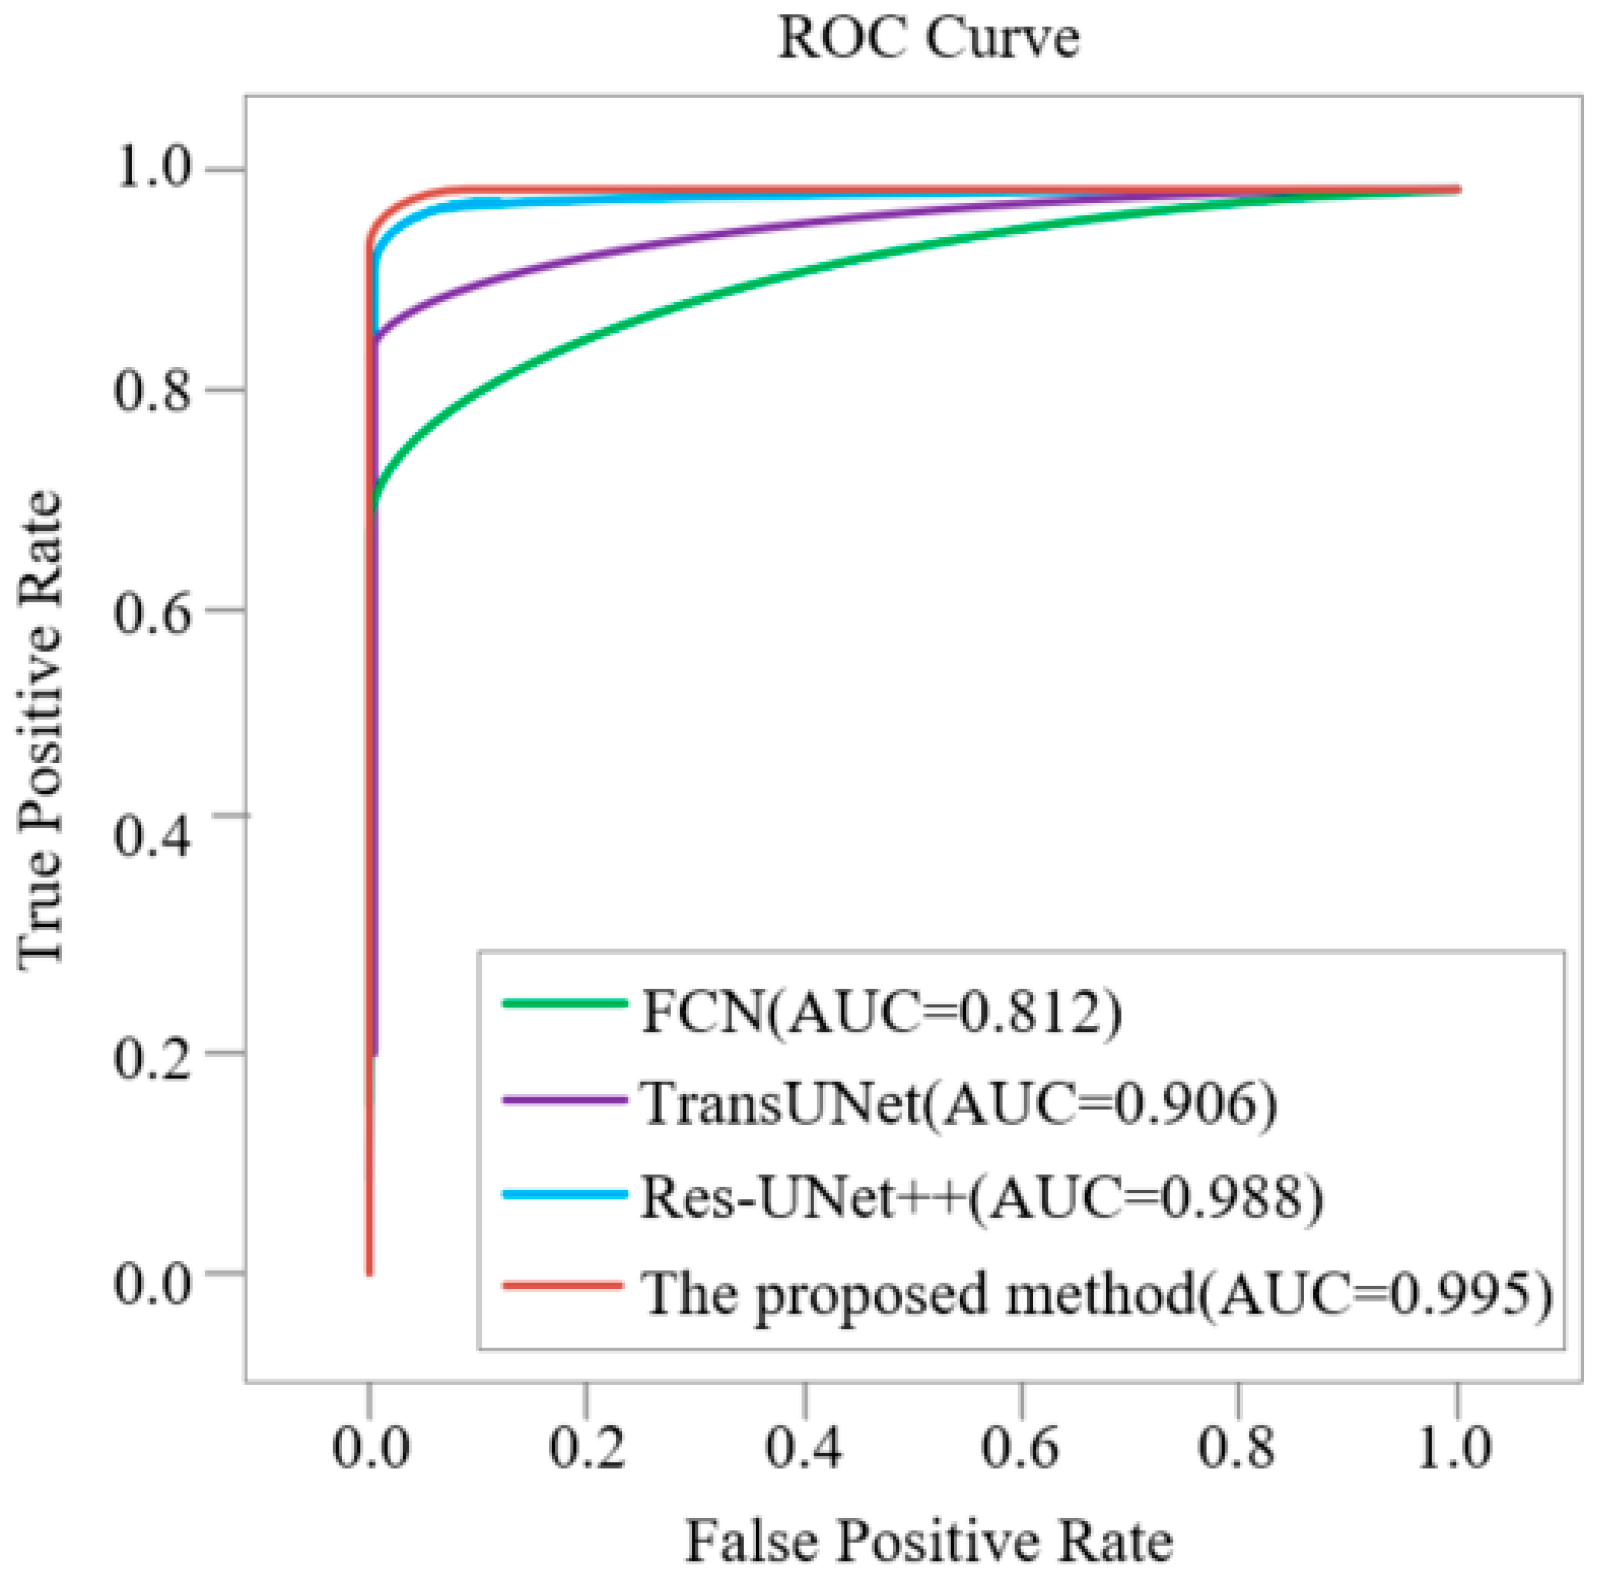
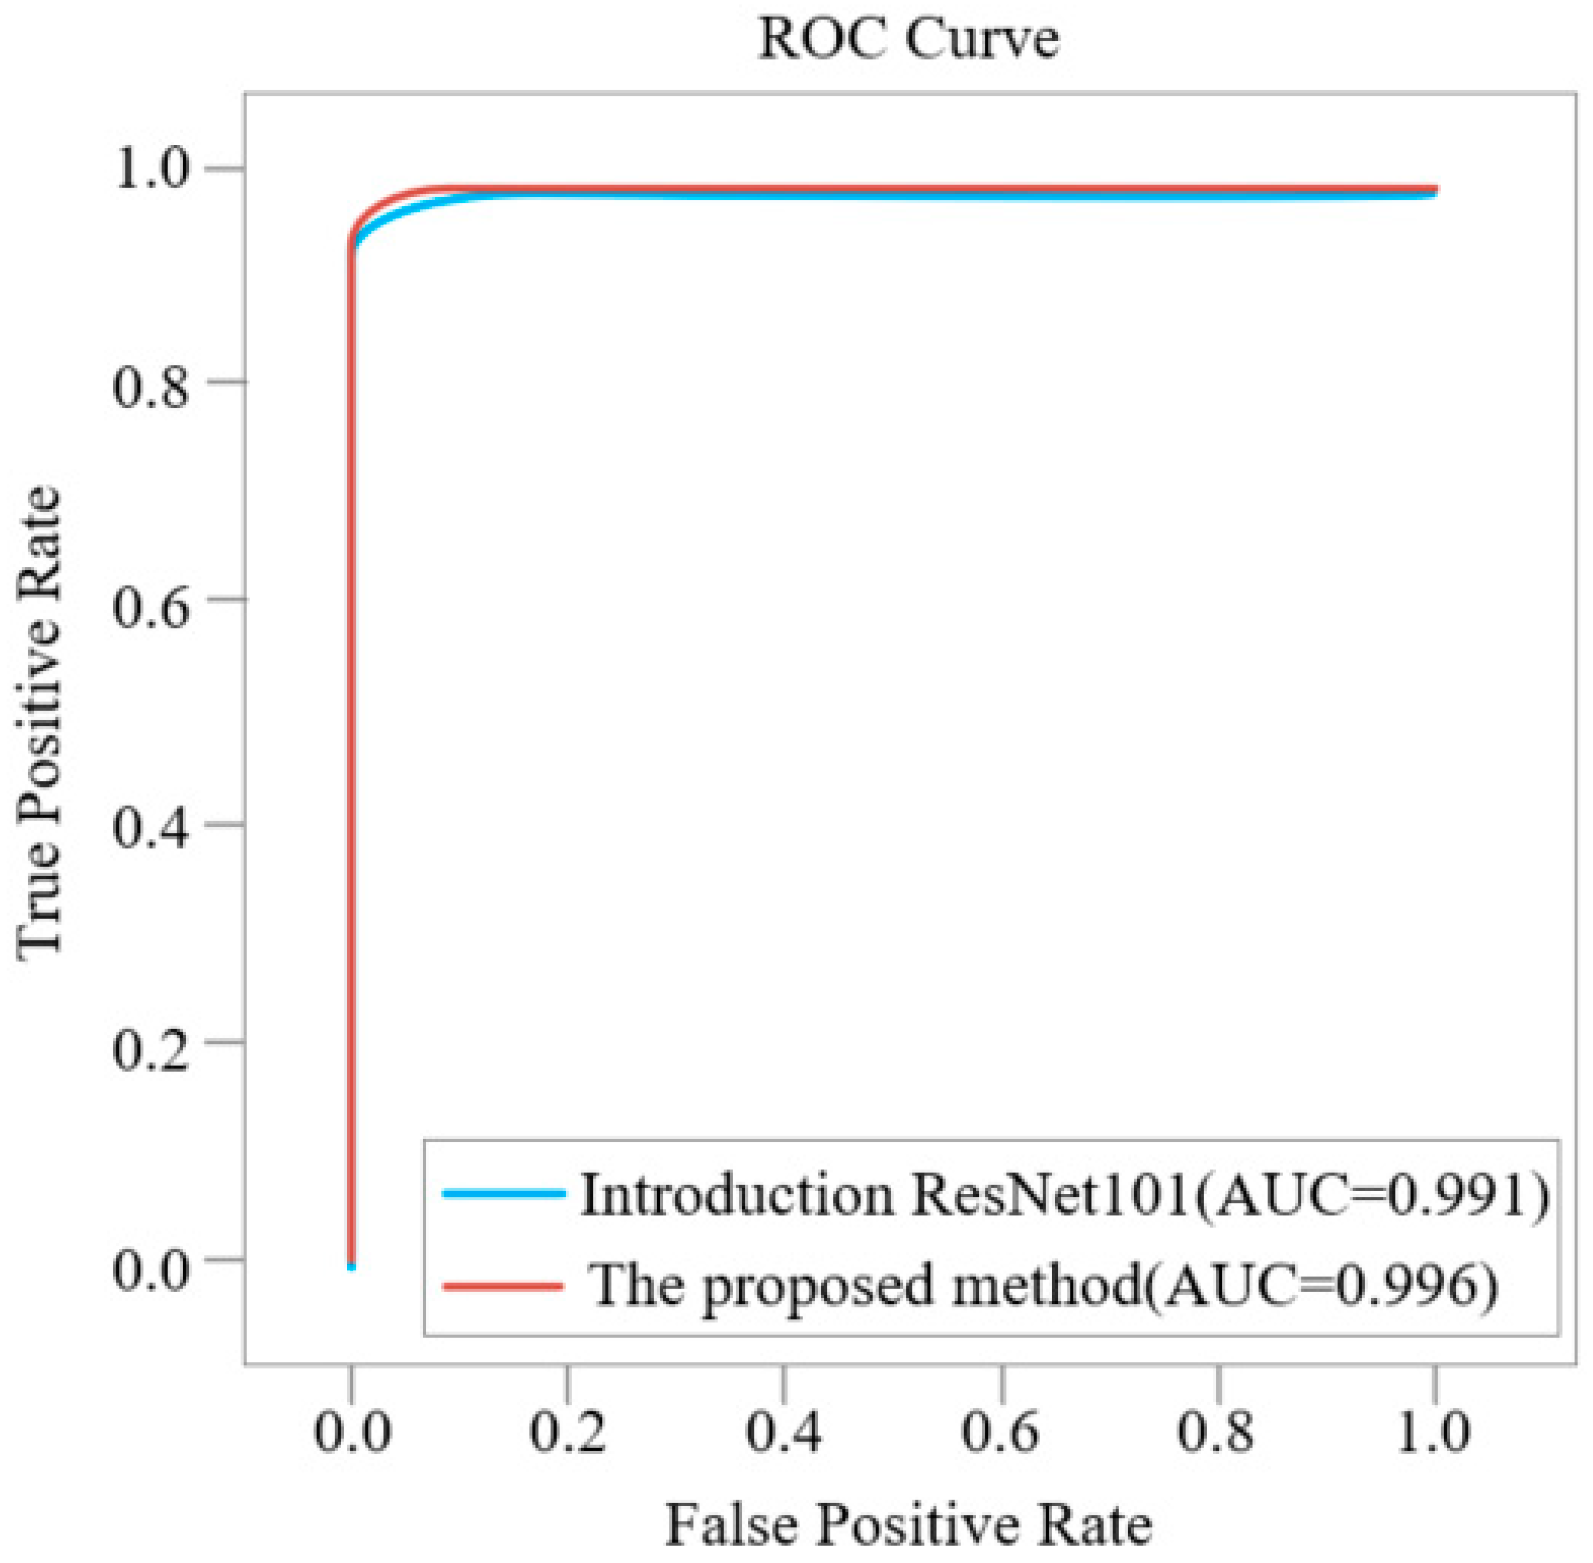
Figure 12 shows the method of introducing the ResNet101 network layer and the ROC curve of this method. It can be clearly seen from the figure that the AUC value of the method in this paper is 0.996, which is 0.005 higher than the AUC value of 0.991 introduced by the ResNet101 network layer model.
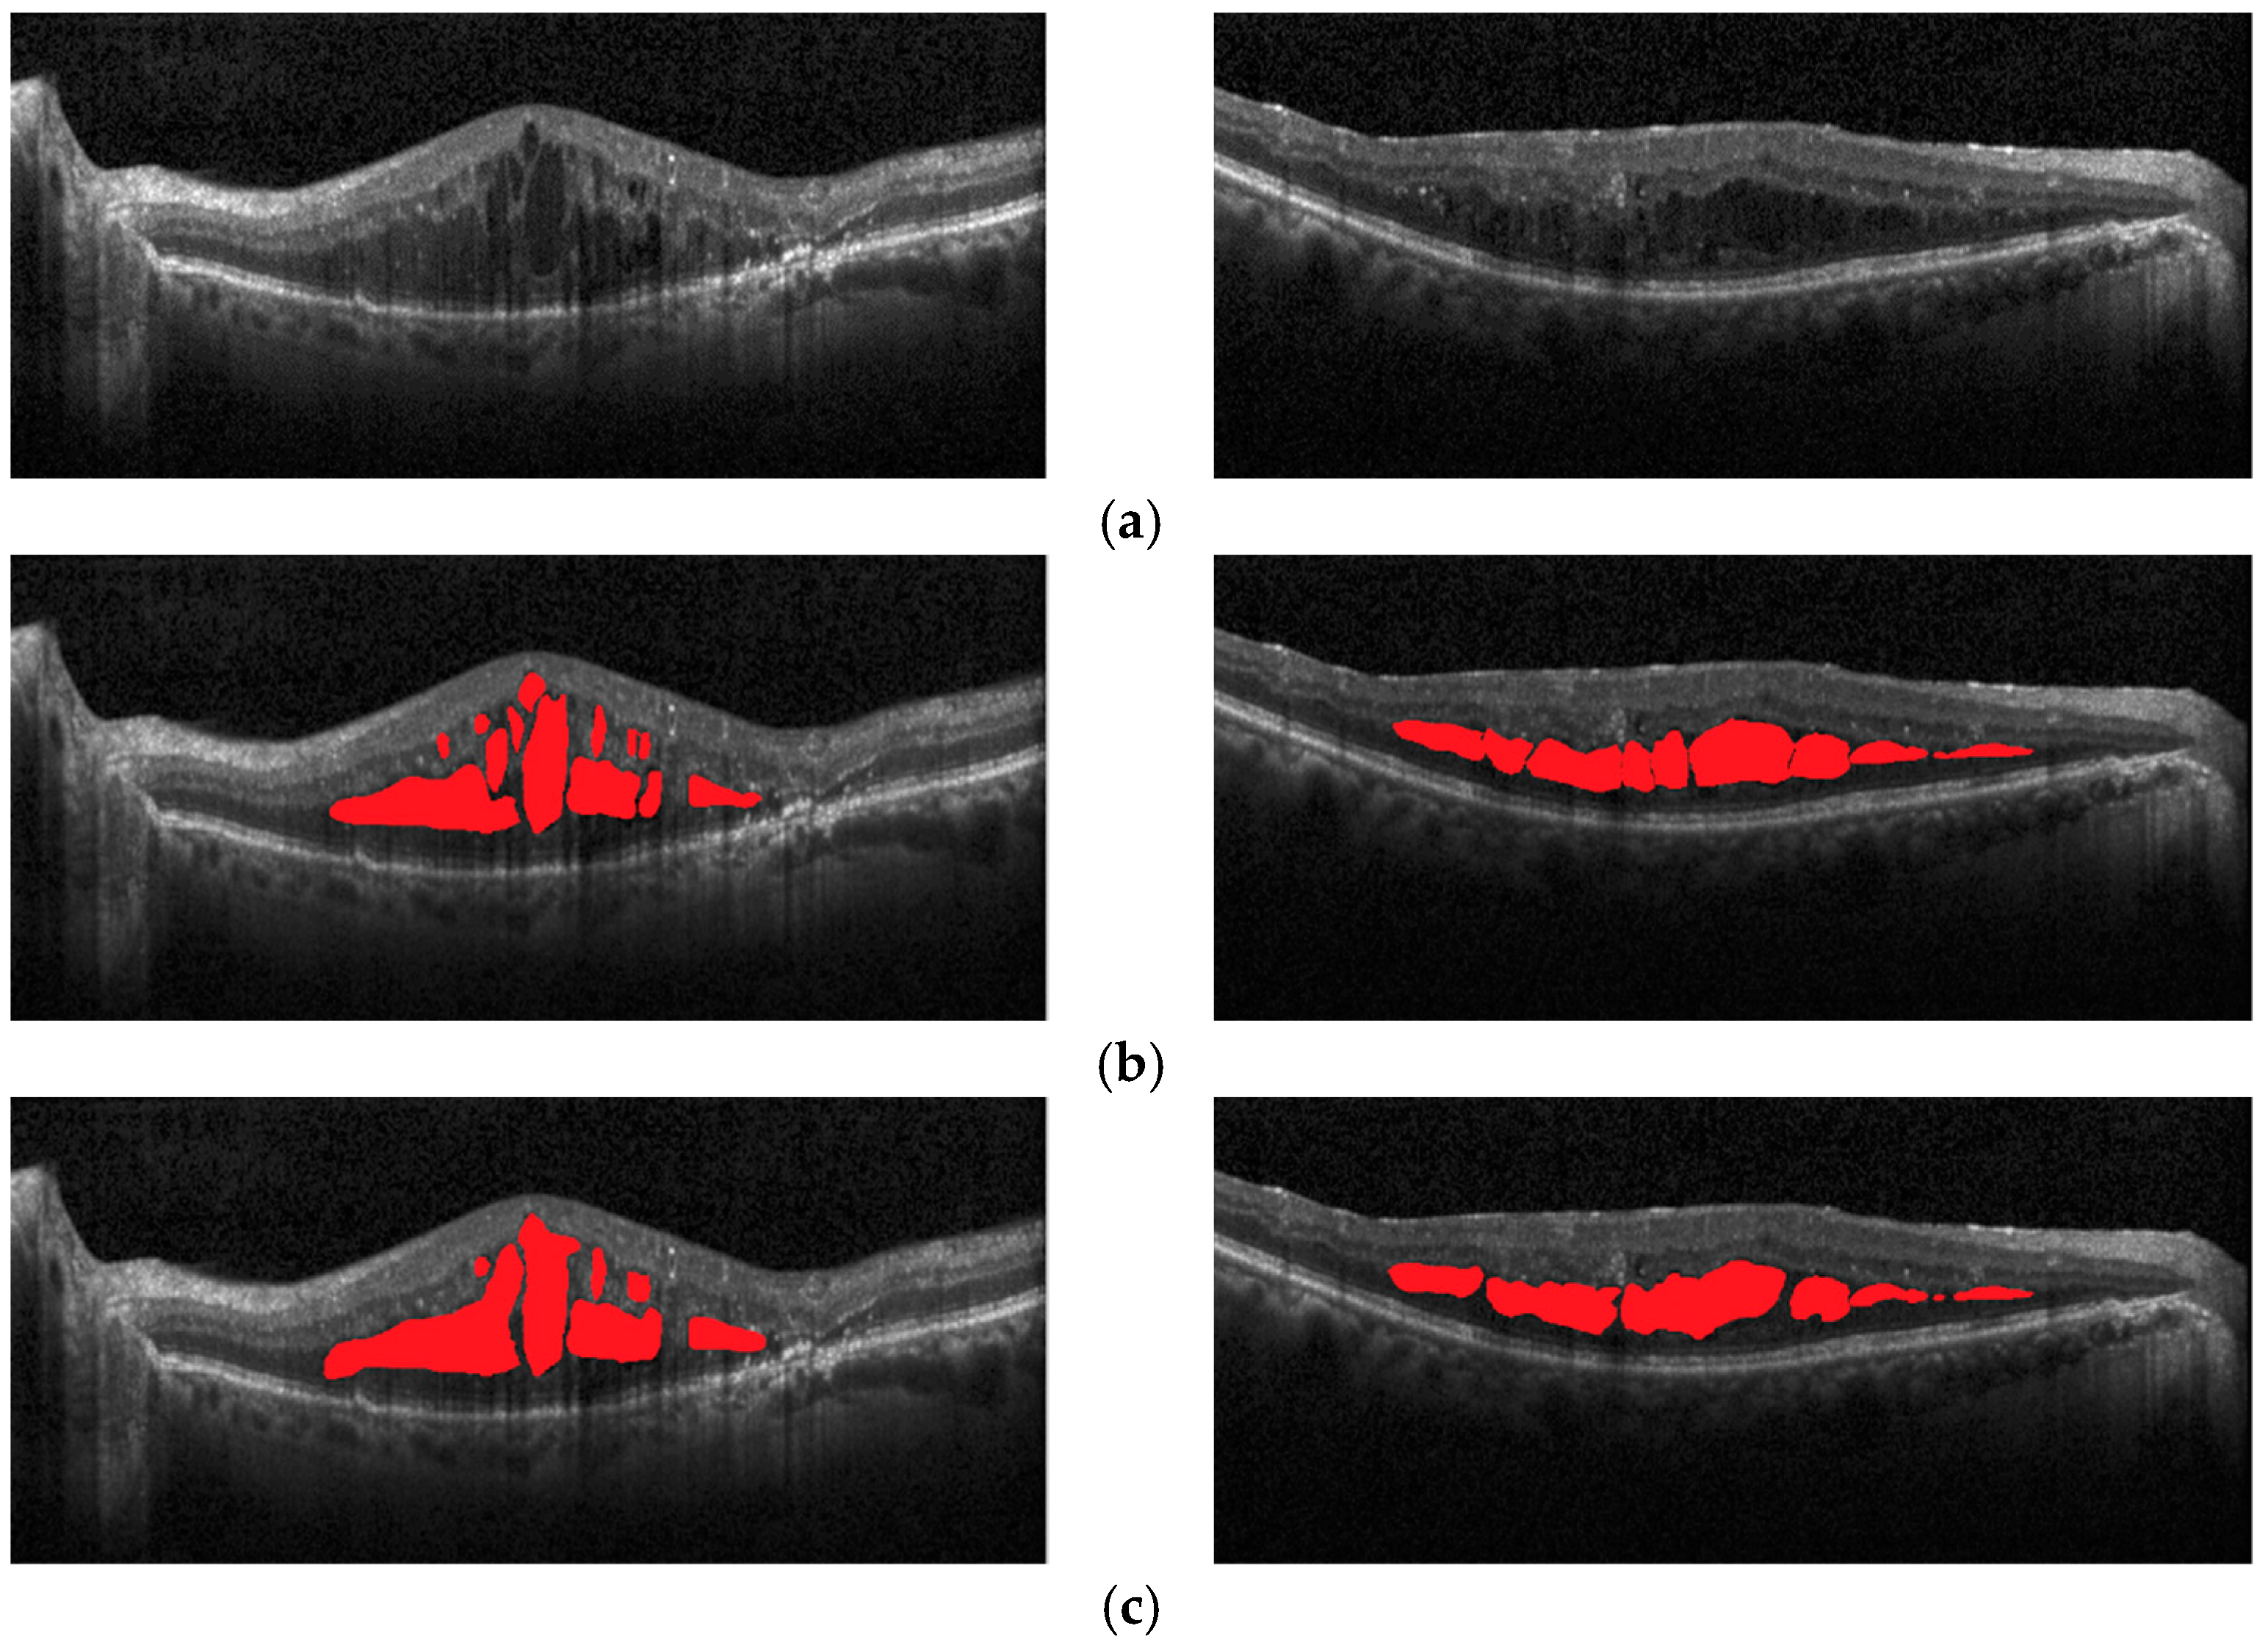
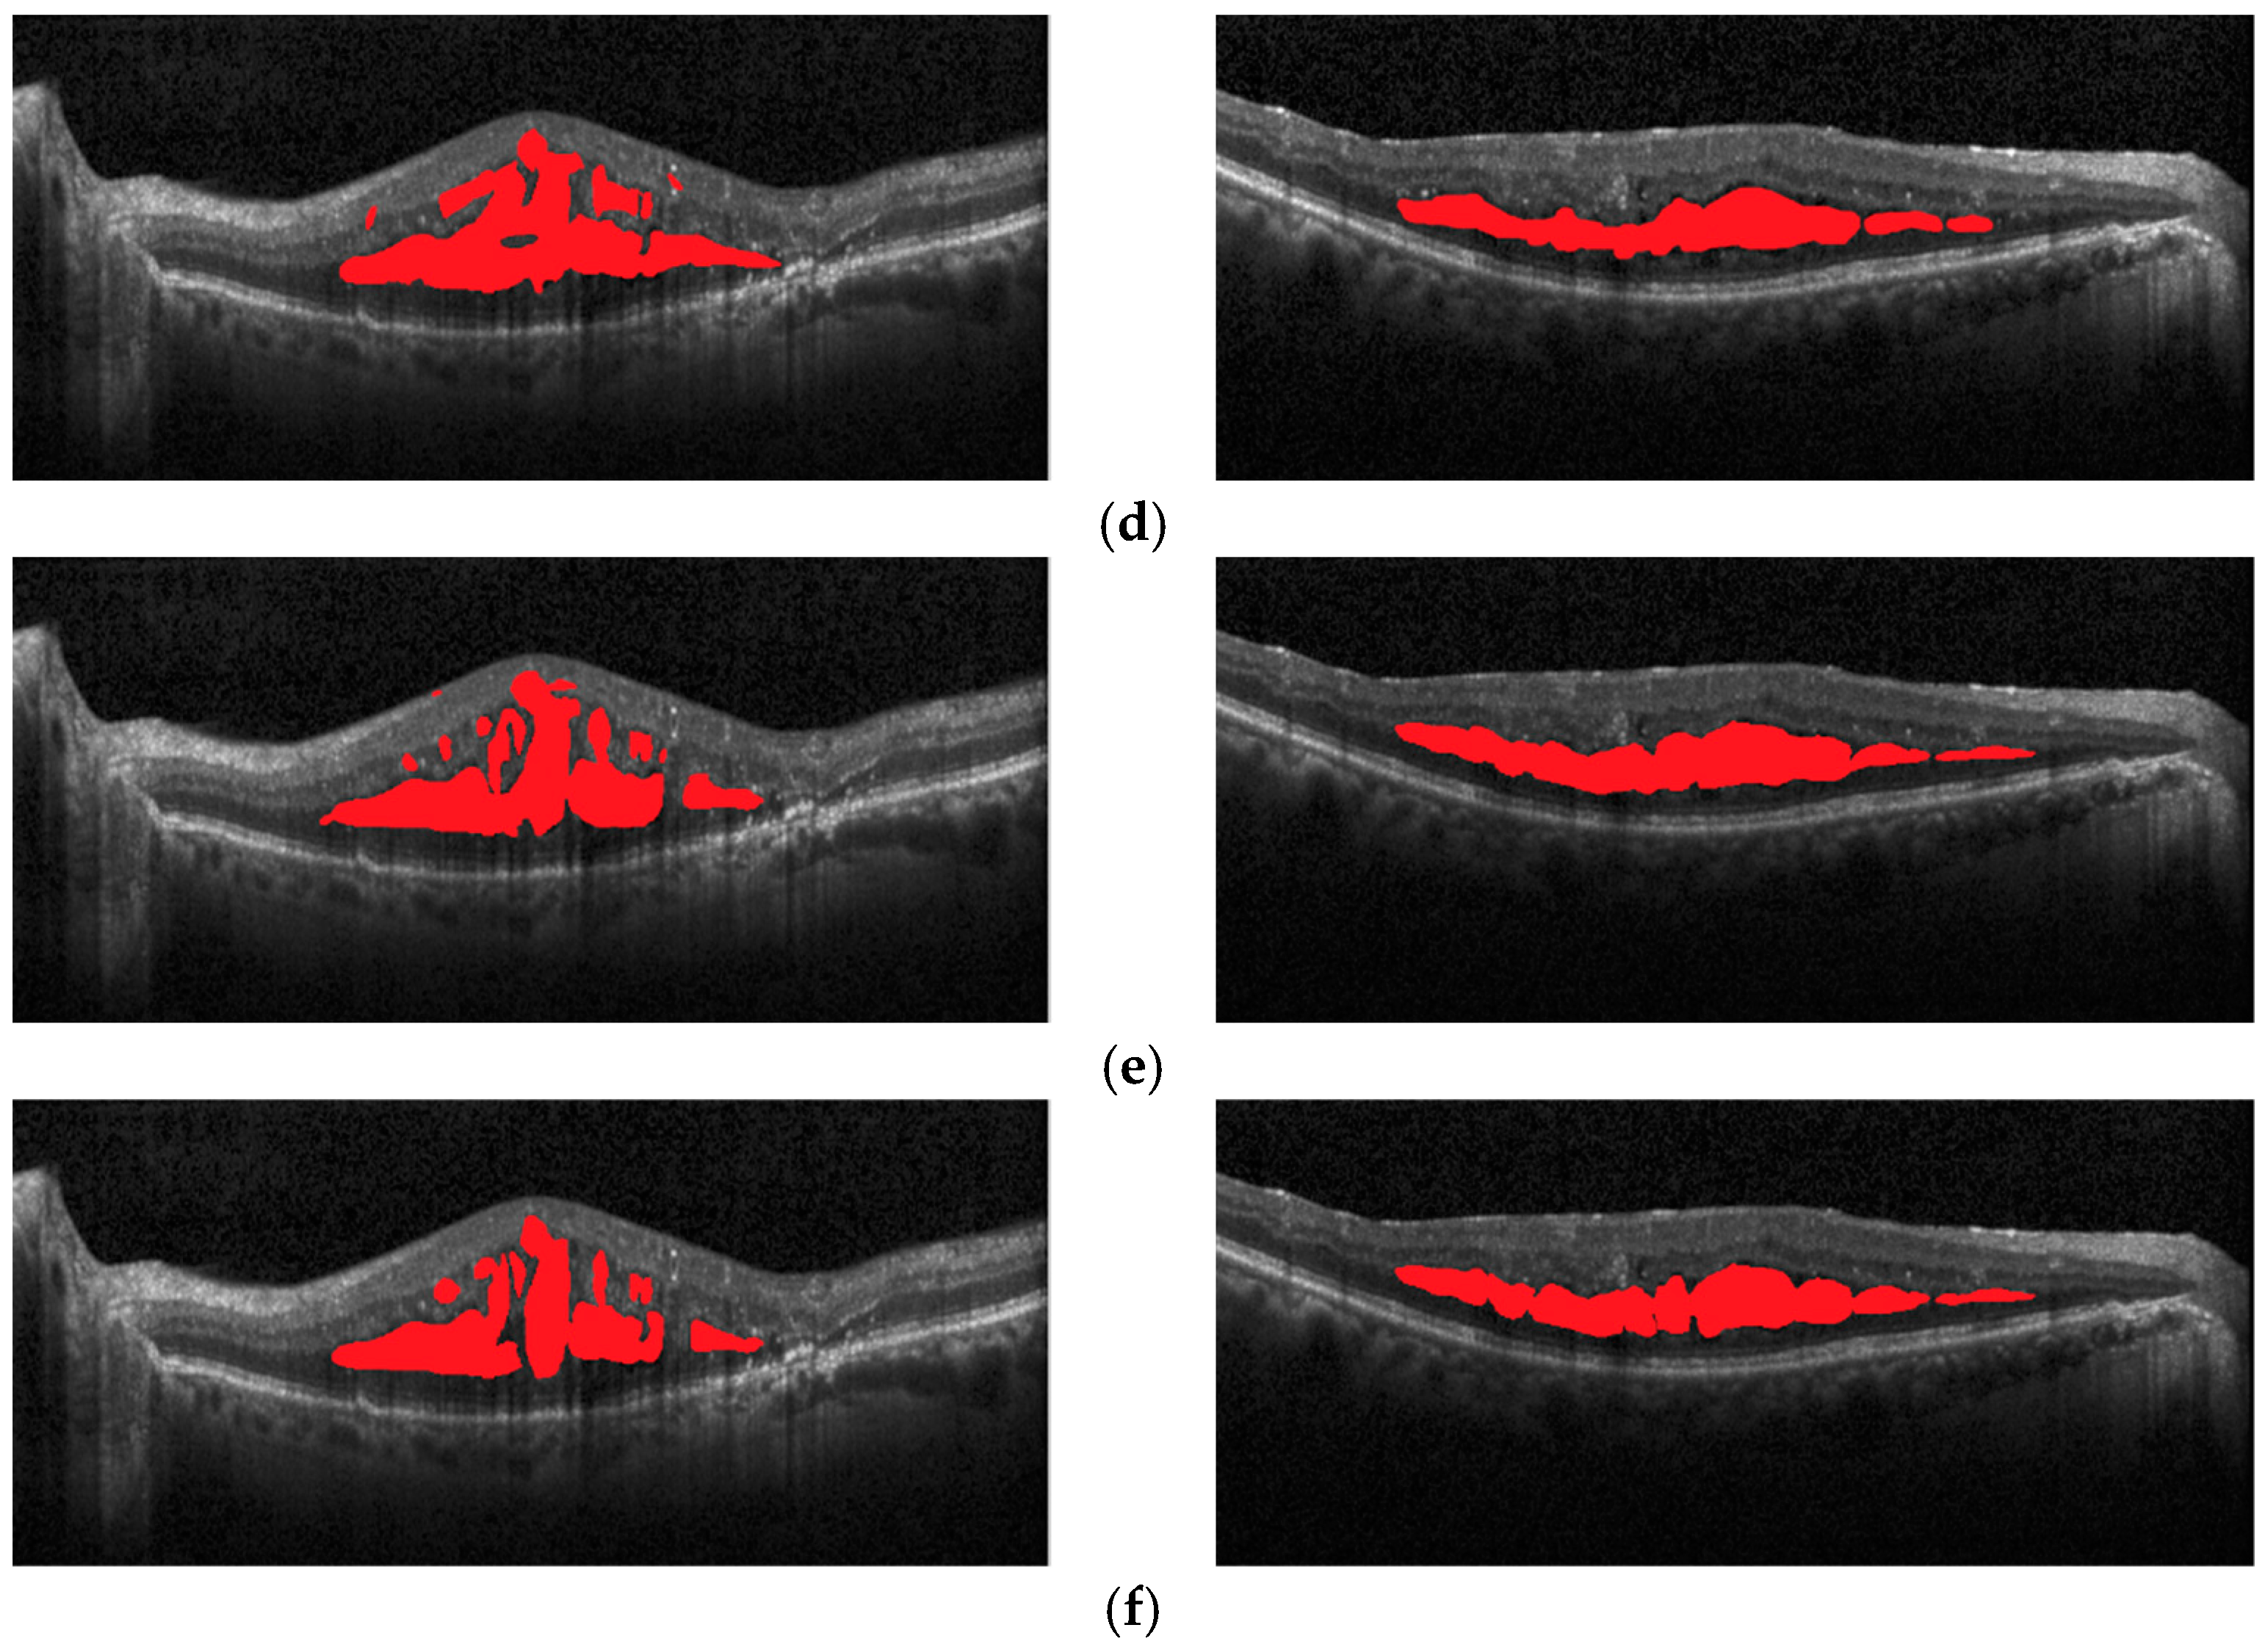
As shown in Figure 13, the original image, the image marked by expert 1, the image marked by expert 2, the ResNet101 network model, and the segmentation effect of the proposed method on a macular edema OCT image are shown respectively. In comparison, the semantic segmentation results of the proposed method are better close to the golden annotation standard of expert 1 in terms of the shape, number, and area of macular edema, which further improves the overall semantic segmentation performance of macular edema.
In summary, the two improvements in the proposed method replace the bottleneck and morphological processing, which have a significant effect on improving the segmentation accuracy of macular edema in retinal OCT images.

5. Conclusions

This paper constructs an improved Swin-Unet network learning model for semantic segmentation of macular edema in retinal OCT images. In order to improve the generalization ability of the model, the data set is augmented, and the network layer in ResNet34 is used as the bottleneck of the Swin-Unet network for training, which increases the computational convergence in the deep network, and uses morphological operations to predict the results. After smoothing, training and testing are performed on the OCT dataset of patients with macular edema published by Duke University. The experimental results illustrate that the method of this paper not only improves the overall segmentation accuracy of the model, but also significantly improves the segmentation accuracy of multi-scale and multi-region macular edema. Since this model still has the problem of high time complexity, we shall try our best to reduce the time complexity of the model in future work. In addition, we shall also discuss 3D semantic segmentation [35] on macular edema OCT images to strive for better segmentation results.

Author Contributions

Conceptualization, Z.G. and L.C.; investigation, Z.G.; resources, Z.G.; formal analysis, L.C.; methodology, Z.G. and L.C.; data curation, Z.G.; software, L.C.; validation, Z.G. and L.C.; visualization, L.C. and Z.G.; writing—original draft preparation, L.C.; writing—review and editing, Z.G. and L.C.; supervision, Z.G.; project administration, Z.G. All authors have read and agreed to the published version of the manuscript.

Funding

This work was supported by research projects of basic scientific research business expenses of provincial colleges and universities in Heilongjiang Province (no. Hkdqg201911).

Data Availability Statement

Publicly available datasets were analyzed in this study. This data can be found here: https://people.duke.edu/~sf59/Chiu_BOE_2014_dataset.htm (accessed on 27 June 2022).

Conflicts of Interest

The authors show no conflict of interest.

References

  1. Bressler, N. Age-related macular degeneration is the leading cause of blindness. AMA 2004, 291, 1900–1901. [Google Scholar] [CrossRef] [PubMed]
  2. Ahn, S.; Pham, Q.T.M.; Shin, J.; Song, S.J. Future Image Synthesis for Diabetic Retinopathy Based on the Lesion Occurrence Probability. Electronics 2021, 10, 726. [Google Scholar] [CrossRef]
  3. Huang, D.; Swanson, E.A.; Lin, C.P.; Schuman, J.S.; Stinson, W.G.; Chang, W.; Fujimoto, J.G. Optical coherence tomography. Science 1991, 254, 1178–1181. [Google Scholar] [CrossRef] [PubMed] [Green Version]
  4. Forte, R.; Cennamo, G.L.; Finelli, M.L.; De Crecchio, G. Comparison of time domain Stratus OCT and spectral domain SLO/OCT for assessment of macular thickness and volume. Eye 2009, 23, 2071–2078. [Google Scholar] [CrossRef] [PubMed] [Green Version]
  5. van Velthoven, M.E.; Faber, D.J.; Verbraak, F.D.; van Leeuwen, T.G.; de Smet, M.D. Recent developments in optical coherence tomography for imaging the retina. Prog. Retin. Eye Res. 2007, 26, 57–77. [Google Scholar] [CrossRef]
  6. Carlo, T.; Romano, A.; Waheed, N.; Duker, J. A review of optical coherence tomography angiography (OCTA). Int. J. Retin. Vitr. 2015, 1, 5. [Google Scholar] [CrossRef] [Green Version]
  7. Chiu, S.J.; Li, X.T.; Nicholas, P.; Toth, C.A.; Izatt, J.A.; Farsiu, S. Automatic segmentation of seven retinal layers in SDOCT images congruent with expert manual segmentation. Opt. Express 2010, 18, 19413–19428. [Google Scholar] [CrossRef] [Green Version]
  8. Quan, Q.; Qing-Zhan, Z.; Man-Qing, L. Application of Threshold Segmentation in Early Diagnosis of Diabetic Retinopathy. J. Qingdao Univ. 2011, 24, 43–47. [Google Scholar]
  9. Zheng, Y.; Sahni, J.; Campa, C.; Stangos, A.N.; Raj, A.; Harding, S.P. Computerized assessment of intraretinal and subretinal fluid regions in spectral-domain optical coherence tomography images of the retina. Am. J. Ophthalmol. 2013, 155, 277–286.e1. [Google Scholar] [CrossRef]
  10. Srinivasan, P.P.; Heflin, S.J.; Izatt, J.A.; Arshavsky, V.Y.; Farsiu, S. Automatic segmentation of up to ten layer boundaries in SD-OCT images of the mouse retina with and without missing layers due to pathology. Biomed. Opt. Express 2014, 5, 348–365. [Google Scholar] [CrossRef] [Green Version]
  11. Chiu, S.J.; Allingham, M.J.; Mettu, P.S.; Cousins, S.W.; Izatt, J.A.; Farsiu, S. Kernel regression based segmentation of optical coherence tomography images with diabetic macular edema. Biomed. Opt. Express 2015, 6, 1172–1194. [Google Scholar] [CrossRef] [PubMed] [Green Version]
  12. Zheng, S. Active Contour Model and Its Application in Fundus Image Segmentation. Master’s Thesis, Shenyang University of Science and Technology, Shenyang, China, 2015; pp. 17–33. [Google Scholar]
  13. Ruppert, G.C.; Chiachia, G.; Bergo, F.P.; Favretto, F.O.; Yasuda, C.L.; Rocha, A.; Falcão, A.X. Medical image registration based on watershed transform from greyscale marker and multi-scale parameter search. Comput. Methods Biomech. Biomed. Eng. Imaging Vis. 2017, 5, 138–156. [Google Scholar] [CrossRef]
  14. Shah, A.; Abramoff, M.D.; Wu, X. Simultaneous Multiple Surface Segmentation Using Deep Learning; Springer: Cham, Switzerland, 2017; Volume 10553, pp. 3–11. [Google Scholar]
  15. Ronneberger, O.; Fischer, P.; Brox, T. U-Net: Convolutional Networks for Biomedical Image Segmentation. In Proceedings of the International Conference on Medical Image Computing and Computer-Assisted Intervention, Munich, Germany, 5–9 October 2015; Springer International Publishing: Berlin/Heidelberg, Germany, 2015; Volume 9351, pp. 234–241. [Google Scholar]
  16. Roy, A.G.; Conjeti, S.; Karri, S.; Sheet, D.; Katouzian, A.; Wachinger, C.; Navab, N. ReLayNet: Retinal layer and fluid segmentation of macular optical coherence tomography using fully convolutional networks. Biomed. Opt. Express 2017, 8, 3627–3642. [Google Scholar] [CrossRef]
  17. Venhuizen, F.G.; van Ginneken, B.; Liefers, B.; van Asten, F.; Schreur, V.; Fauser, S.; Hoyng, C.; Theelen, T.; Sánchez, C.I. Deep learning approach for the detection and quantification of intraretinal cystoid fluid in multivendor optical coherence tomography. Biomed. Opt. Express 2018, 9, 1545–1569. [Google Scholar] [CrossRef] [PubMed] [Green Version]
  18. Li, M.X.; Yu, S.Q.; Zhang, W.; Zhou, H.; Xu, X.; Qian, T.W.; Wan, Y.J. Segmentation of retinal fluid based on deep learning: Application of three-dimensional fully convolutional neural networks in optical coherence tomography images. Int. J. Ophthalmol. 2019, 12, 1012–1020. [Google Scholar] [PubMed]
  19. Liu, W.; Sun, Y.; Ji, Q. MDAN-UNet: Multi-Scale and Dual Attention Enhanced Nested U-Net Architecture for Segmentation of Optical Coherence Tomography Images. Algorithms 2020, 13, 60. [Google Scholar] [CrossRef] [Green Version]
  20. Zhou, Z.; Siddiquee, M.; Tajbakhsh, N.; Liang, J. Unet Plus Plus: A Nested U-Net Architecture for Medical Image Segmentation. In Deep Learning in Medical Image Analysis and Multimodal Learning for Clinical Decision Support; Springer: Cham, Switzerland, 2018; Volume 11045, pp. 3–11. [Google Scholar]
  21. Zhang, H.; Wu, C.; Zhang, Z.; Zhu, Y.; Zhang, Z.; Lin, H.; Sun, Y.; He, T.; Mueller, J.; Manmatha, R.; et al. ResNeSt: Split-Attention Networks. arXiv 2020, arXiv:2004.08955. [Google Scholar]
  22. Gao, Z.; Wang, X.; Li, Y. Automatic segmentation of macular edema in retinal oct images using improved u-net++. Appl. Sci. 2020, 10, 5701. [Google Scholar] [CrossRef]
  23. Xie, S.; Okuwobi, I.P.; Li, M.; Zhang, Y.; Yuan, S.; Chen, Q. Fast and Automated Hyperreflective Foci Segmentation Based on Image Enhancement and Improved 3D U-Net in SD-OCT Volumes with Diabetic Retinopathy. Transl. Vis. Sci. Technol. 2020, 9, 21. [Google Scholar] [CrossRef] [Green Version]
  24. Acevedo-Jake, A.; Shi, S.; Siddiqui, Z.; Sanyal, S.; Schur, R.; Kaja, S.; Yuan, A.; Kumar, V.A. Preclinical Efficacy of Pro- and Anti-Angiogenic Peptide Hydrogels to Treat Age-Related Macular Degeneration. Bioengineering 2021, 8, 190. [Google Scholar] [CrossRef]
  25. Vaswani, A.; Shazeer, N.; Parmar, N.; Uszkoreit, J.; Jones, L.; Gomez, A.; Kaiser, L.; Polosukhin, I. Attention Is All You Need. arXiv 2017, arXiv:1706.03762. [Google Scholar]
  26. Dosovitskiy, A.; Beyer, L.; Kolesnikov, A.; Weissenborn, D.; Houlsby, N. An image is worth 16x16 words: Transformers for image recognition at scale. arXiv 2020, arXiv:2010.11929. [Google Scholar]
  27. Liu, Z.; Lin, Y.; Cao, Y.; Hu, H.; Wei, Y.; Zhang, Z.; Guo, B. Swin transformer: Hierarchical vision transformer using shifted windows. In Proceedings of the IEEE/CVF International Conference on Computer Vision, Montreal, QC, Canada, 10–17 October 2021; pp. 3–10. [Google Scholar]
  28. Chen, J.; Lu, Y.; Yu, Q.; Luo, X.; Zhou, Y. Transunet: Transformers make strong encoders for medical image segmentation. arXiv 2021, arXiv:2102.04306. [Google Scholar]
  29. Cao, H.; Wang, Y.; Chen, J.; Jiang, D.; Zhang, X.; Tian, Q.; Wang, M. Swin-unet: Unet-like pure transformer for medical image segmentation. arXiv 2021, arXiv:2105.05537. [Google Scholar]
  30. He, K.; Zhang, X.; Ren, S.; Sun, J. Deep residual learning for image recognition. In Proceedings of the IEEE Conference on Computer Vision and Pattern Recognition, Las Vegas, NV, USA, 26 June–1 July 2016; pp. 770–778. [Google Scholar]
  31. Touvron, H.; Cord, M.; Sablayrolles, A.; Synnaeve, G.; Jégou, H. Going deeper with Image Transformers. arXiv 2021, arXiv:2103.17239. [Google Scholar]
  32. Ruberto, C.; Dempster, A.; Khan, S.; Jarra, B. Analysis of infected blood cell images using morphological operators. Image Vis. Comput. 2002, 20, 133–146. [Google Scholar] [CrossRef]
  33. Vision and Image Processing (VIP) Laboratory. Available online: https://people.duke.edu/~sf59/Chiu_BOE_2014_dataset.htm (accessed on 15 August 2014).
  34. Bai, F.; Marques, M.; Gibson, S. Cystoid macular edema segmentation of optical coherence tomography images using fully convolutional neural networks and fully connected crfs. arXiv 2017, arXiv:1709.05324. [Google Scholar]
  35. Gende, M.; Moura, J.; Novo, J.; Charlon, P.; Ortega, M. Automatic Segmentation and Intuitive Visualisation of The Epiretinal Membrane in 3D OCT Images Using Deep Convolutional Approaches. IEEE Access 2021, 9, 75993–76004. [Google Scholar] [CrossRef]
Figure 1. OCT image with macular edema and annotated image of edema area in OCT image: (a) OCT image with macular edema; (b) the annotations of the edema regions.
Electronics 11 02294 g001
Figure 2. Flow chart of the proposed method.
Electronics 11 02294 g002
Figure 3. The network structure of the import method: (a) Network Structure of Swin-Unet; (b) Structure diagram of the Swin Transformer block.
Electronics 11 02294 g003
Figure 4. The structure of ResNet: (a) The fifth layer network structure of ResNet34; (b) Residual block structure corresponding to (a).
Electronics 11 02294 g004
Figure 5. Confusion matrix comparison diagram (a) FCN; (b) TransUNet; (c) Res-UNet++; (d) The proposed method.
Electronics 11 02294 g005
Figure 6. Comparison of ROC curves of different models on the test dataset of macular edema OCT images.
Electronics 11 02294 g006
Figure 7. Segmentation effect of different models on the macular edema area: (a) original image; (b) expert 1 annotations; (c) expert 2 annotations; (d) TransUNet predictions; (e) Res-UNet++ predictions; (f) the proposed method predictions.
Electronics 11 02294 g007aElectronics 11 02294 g007b
Figure 8. Confusion matrix comparison diagram: (a) FCN; (b) TransUNet; (c) Res-UNet++; (d) The proposed method.
Electronics 11 02294 g008
Figure 9. Comparison of ROC curves of different models on the macular edema OCT images test set with multi-scale and multi-region.
Electronics 11 02294 g009
Figure 10. Segmentation effect of different models on the multi-scale and multi-region macular edema OCT image test set: (a) original image; (b) expert 1 annotations; (c) expert 2 annotations; (d) TransUNet predictions; (e) Res-UNet++ predictions; (f) the proposed method predictions.
Electronics 11 02294 g010
Figure 11. Confusion matrix comparison diagram: (a) the method of introducing the ResNet101 network layer, (b) the proposed method.
Electronics 11 02294 g011
Figure 12. Comparison of ROC curves on the OCT image test set of the different two improved models.
Electronics 11 02294 g012
Figure 13. Segmentation effect diagram: (a) original image; (b) expert 1 annotations; (c) expert 2 annotations; (d) the method of introducing ResNet101 predictions; (e) the proposed method predictions.
Electronics 11 02294 g013
Table 1. Comparison of test results of different methods in images of macular edema area.
Golden AnnotationMethodDiceIouRecallPrecision
Expert 1Expert 20.590.620.630.59
FCN0.630.680.690.66
TransUNet0.780.770.800.77
Res-UNet++0.800.780.840.80
The proposed method0.820.800.850.82
Expert 2Expert 10.580.610.620.57
FCN0.600.630.650.62
TransUNet0.760.750.790.78
Res-UNet++0.780.760.820.78
The proposed method0.800.810.820.79
Table 2. Comparison of test results of different methods in macular edema OCT images with multi-scale and multi-region.
Golden AnnotationMethodDiceIouRecallPrecision
Expert 1Expert 20.580.610.620.59
FCN0.610.650.640.67
TransUNet0.780.770.800.77
Res-UNet++0.810.810.850.82
The proposed method0.830.820.860.84
Expert 2Expert 10.560.570.580.61
FCN0.620.630.650.63
TransUNet0.790.760.820.79
Res-UNet++0.800.770.830.81
The proposed method0.810.790.850.82
Table 3. Absolute mean error of the number of macular edema regions.
MethodAbsolute Error
Expert 24.93
TransUNet3.46
Res-UNet++2.98
The proposed method2.37
Table 4. The impact of methods based on different degrees of improvement on the model segmentation ability on the overall dataset.
MethodDiceIouRecallPrecision
Swin-Unet0.770.750.770.78
Swin-Unet+ morphological0.780.760.790.78
Swin-Unet+ replacement bottleneck0.810.780.820.79
The proposed method0.820.800.850.82
Table 5. The impact of different degrees of improvement on model segmentation ability on datasets with multi-scale and multi-region edema.
MethodDiceIouRecallPrecision
Swin-Unet0.780.770.800.78
Swin-Unet+ morphological0.790.780.800.78
Swin-Unet+ replacement bottleneck0.810.800.830.82
The proposed method0.830.820.860.84
Table 6. The effect of the number of jumps on the segmentation ability of the model.
Skip ConnectionDiceIouRecallPrecision
00.710.720.730.71
10.730.750.740.77
20.800.810.820.81
30.820.800.850.82
Table 7. Influence of layer 5 network with ResNet34 and ResNet101 on model segmentation capability.
MethodDiceIouRecallPrecision
The method of introducing ResNet1010.810.820.840.80
The proposed method0.820.810.850.82
Publisher’s Note: MDPI stays neutral with regard to jurisdictional claims in published maps and institutional affiliations.

