Article

Trends and Perspectives of Romanian E-Commerce Sector Based on Mathematical Simulation

by
Nicoleta Valentina Florea
1,
Constantin Aurelian Ionescu
2,3,
Mircea Constantin Duică
1,
Sorinel Căpușneanu
4,5,
Liliana Paschia
3,
Sorina Geanina Stanescu
2,* and
Mihaela Denisa Coman
2
1
Faculty of Economics, Valahia University of Targoviste, 130004 Targoviste, Romania
2
Institute of Multidisciplinary Research for Science and Technology, Valahia University of Targoviste, 130004 Targoviste, Romania
3
Faculty of Economics, Hyperion University of Bucharest, 030615 Bucharest, Romania
4
Faculty of Economic Sciences, 1 Decembrie 1918 University, 510009 Alba Iulia, Romania
5
Faculty of Finance-Banking, Accounting and Business Administration, Titu Maiorescu University, 040056 Bucharest, Romania
*
Author to whom correspondence should be addressed.
Electronics 2022, 11(15), 2295; https://doi.org/10.3390/electronics11152295
Submission received: 28 June 2022 / Revised: 19 July 2022 / Accepted: 20 July 2022 / Published: 22 July 2022

Abstract

:
The current economic environment characterized by the implementation of new ICT technologies, globalization, and the pandemic period has determined the growth of online communication, the development of the e-commerce sector, and the change in online consumer behavior. The research aims to analyze online Romanian consumer behavior trends and perspectives. In order to observe the current position of Romanian online commerce, a comparison was made between the Romanian e-commerce market and three other e-commerce groups: the average for EU-27 countries, the group of four countries with the highest e-commerce values (called 4gc—Denmark, the Netherlands, Germany, and Norway) and the country with the lowest values in e-commerce. A comparison was made using mathematical simulation to predict the potential of e-commerce in the future and identify possible risks. Based on the simulation, the results show that the Romanian e-commerce market can continue to grow, becoming mature, and will provide opportunities for sustainable growth. In order to observe and analyze a possible future for 2021–2026, the regression function, correlation matrix, time series analysis, variable maximization, and QM for the Windows program have been implemented. The graphical representation indicates a positive and growing forecasted future trend for Romanian e-commerce.

1. Introduction

The pandemic generated by the COVID-19 virus led to a change in how most people’s daily activities were carried out, with severe effects on all aspects of how people communicate, work, produce, market, consume and live [1].
The closure of economic activities and the imposition of measures necessary to minimize the transmission of the virus have led to the relocation of activities online and the use of telework and teleconferences, and have increased the use of social networks and sales through e-commerce sites. This migration to online has been significant in relatively high-income developed and developing economies with a robust ICT infrastructure, an e-commerce ecosystem, and an efficient distribution network [2]. The digital economy involves renovating business processes through technology innovation, government policies for growth, and digital entrepreneurship [3].
In this global context, e-commerce has become a significant pillar in the fight against COVID-19. It can reduce cases of new infections (by offering delivery of products online, helping customers avoid store visits, and online payments eliminate the need for physical cash transactions). It preserved jobs during the crisis or, in some cases, created new jobs during the crisis as consumers move towards online business. Additionally, it increased the acceptance of prolonged physical distancing measures among the population through the continued variability of online shopping and services [4].
At the same time, there have been changes in customers’ consumption habits caused by the closure of physical stores and the need to supply essential items during the lockdown period [5,6]. In this context, sales increased for B2C and B2B through e-commerce. The B2C segment has seen an increase in online sales, mainly for food, medical supplies, and household items. Although there has been a significant migration to online commerce, the B2B and B2C e-commerce segments have been disrupted by measures put in place by governments to limit the spread of the virus. That has led to a decrease in the production of goods and has caused bottlenecks in supply chains, transport, and logistics services [7]. Virtual businesses became in the last period a profitable process [8]. Business processes based on using the Internet have evolved and continue to develop, from e-communication, e-recruitment, e-booking, e-banking, and e-learning to e-commerce. Business to Consumer (B2C) e-commerce involves the direct selling of a product from a business to many potential online consumers [9] and is gaining increasing importance in many countries—in both mature and emerging markets—and online initiatives [10]. Consumers increasingly rely on social commerce to make purchase decisions [11]. Electronic commerce (e-commerce) has been defined as the ensemble of activities to buy or sell a product or to exchange valuable data over an online platform [12].
E-commerce specialized websites, smartphone applications, and online auctions are probably the most used online platforms. Using e-commerce, the customers may order books, digital music files, and high-tech products [13], including food and spirits [14,15]. In its simplest form, E-commerce is about transactions between two or more individuals, using data and data control [16]. Specialists in the field characterize e-commerce as a procedure that: (i) is using electronic tools and technologies necessary to deploy the selling and buying processes, transferring or exchange of products and information [17]; (ii) is more than retail on Internet, is about production, promotion, selling and distribution using communication networks [18]; (iii) is connecting customers and communities on electronic platforms, which became an integral part of their lives [19]; (iv) is led by two forces which are sustaining each other [20]: a pull force—of the market, a push force—of the technologies; (v) made the organizations virtual and the production customized, and the tastes of customers became dynamic and segmented [21]; (vi) helped organizations to obtain profit using a platform [22]; (vii) made consumers more focused than ever on finding the best prices while shopping in the most convenient or satisfying manner, and e-commerce also offered the customer the comfort of doing their online shopping at home, making it easier, meaning they can spend their time with their families rather than wandering store aisles [23]; (viii) knew a significant growth by offering a broad product offer, best-in-class cost structure, and customer-driven logistics fine-tuning [24]; (ix) helps integrate regions across the world and can be a powerful force for economic development [25]; (x) is a transaction of buying or selling online, changing the current human life [26]; (xi) has become, according to digital transformation, increasingly dynamic [27]; (xii) help the business to enhance the customer satisfaction levels for their product offerings and services rendered [28]; (xiii) has faster speed and lower expenses for companies and customers [29].
E-commerce is increasing exponentially across the globe and is expected to grow more in the future. The digital business helped to obtain organization competitiveness through links between companies and customers using new technologies and websites. The website is a vital source of information for the prospective consumer, helping companies to promote their products or services and an avenue to generate profits by attracting many customers [30]. All electronically mediated information exchanges between an organization and its external stakeholders build e-commerce, implying buy-side and sell-side. New positions in the companies have appeared, such as digital managers who develop and implement digital business and e-commerce strategies [31].
E-commerce facilitates cheap and easy international trade, and using the Internet is becoming part of globalization [32]. E-commerce offers many facilities and opportunities such as: development opportunities for payment services (using mobile payment) [33], e-promotion events in the world for e-customers (such as November 11 in China and Cyber Monday in US based on using optimal prices and the quantity) [34], and the appearance of new e-jobs and new opportunities in distribution strategy, by using indirect distribution to e-consumer: reselling (through e-tailer) and agency selling (through online agent’s website) [35]. Time savings and lower competitive research shopping [36] bring great convenience and many challenges [37], hedonic value (happiness, relaxation and pleasure) [38], utilitarian and satisfying social needs [39]. The consumer may help to co-create the brand, market share or economic profitability [40], may help increase opportunities in marketing, customer service, and revenue [41], and create the opportunity to develop a two-sided platform where sellers and buyers are making online transactions and the price policy is adequate for both parts [42]. An important channel for markets and promotion of brands and products [43] redefined the way companies manage relations with their customers (before, the customers were passive receivers of messages, and now, due to new technologies, different channels and devices are active, receiving multidirectional information) [44]. It also helps develop customer engagement [45] using online brand/community [46], online platform [47], or social media [48,49], revolutionize the method of communication and interaction [50], improve shopping intention [51], and improve meetings and social life [52].
E-commerce also offers many risks or threats such as latency impact on website performance [53], issues about trust label of the website, security, and privacy [54], and higher risks and uncertainties [38]. It may influence trust, confidence, and credibility in online transactions [55], depending on the decision-making, information-seeking behavior of each e-customer, and personality [56], with electronic fraud appearing [57]. The e-customers are subjected to digital piracy [58], and the risk is high, especially in developing countries [59]. It can be observed that there are more benefits and importance for individuals, companies, and the entire society.
The research aims to analyze online Romanian consumer behavior trends and perspectives. In order to observe the current position of Romanian online commerce, a comparison was made between the Romanian e-commerce market and three other e-commerce groups: the average for EU-27 countries, the group of four countries with the highest e-commerce values (called 4gc—Denmark, the Netherlands, Germany, and Norway) and the country with the lowest values in e-commerce. The comparison made using simulation and modeling contributes to the identification of the position of e-commerce in Romania, the forecast of the potential of e-commerce in the future, and the identification of possible risks. The research originality results from the simulations performed and from the fact that, during the COVID-19 pandemic, the e-commerce trade became an instrument that contributed to the continuation of the activity of numerous economic entities. This article’s novelty consists of the analysis made at the Romanian level, making a regional comparison. However, the results could be used at the interregional level, global level, or on fields, branches, or products and using simulation methods and models such as regression function, time series analysis, constraint function, forecasting method—linear programming, and a set of improvement measures. Additionally, the forecasting method—linear programming was implemented to analyze a possible future for 2021–2026. The graphical representation offers a positive and increasing forecasted future trend for e-commerce. The article is structured as follows: introduction, an analysis of the e-commerce field at the international and national level, development of a SWOT analysis of this field, materials, methods, research hypothesis, results, discussions, and conclusions.

2. Analysis of the E-Commerce System at the International and National Level in Pandemic Time

2.1. E-Commerce—A Source of Competitive Advantage for International Markets in Pandemic Time

The pandemic period accelerated the change and challenges. Internet use allowed people to be updated with real-time information, and digital innovations, e-products, and e-services helped customers and organizations. Changes in personal and organizational behavior took place due to restrictions and lockdowns. Thus, books and literature e-commerce platforms have undergone a 16 percent global traffic increase between January and March 2020 [60]. Before the COVID-19 pandemic, online commerce grew at a relatively steady pace of 4.5%. Year-on-year restrictions contributed to a boom in e-commerce and, thus, the growth of digital financial services [61].
Since March 2020, online commerce has not been an option but a necessity for both economic entities and consumers. With the COVID-19 pandemic, many online commerce economic entities began to experience short-term changes. Many online retailers have started to develop new product and service offerings and have adopted new sales strategies due to the COVID-19 pandemic. However, the evolution of e-commerce has manifested itself differently from country to country [62]. In the first quarter of 2020, online orders increased by 70% in Asia-Pacific compared to the same period of the previous year, while in North America, online orders at the end of May 2020 increased by 120% compared to 2019, and in Europe, increased on average by 50% [63].
According to information provided by the United States Census Bureau, online sales have increased steadily in the US over the past two decades, but after the COVID-19 restrictions, the growth rate has increased substantially; thus, online sales increased by 31.80% in the second quarter of 2020 compared to the first quarter, and by 44.50% compared to 2019 [64]. As expected, some sectors grew much faster and more than others. For example, in the first few days after the pandemic declaration, food sales tripled, according to an IMF report—Food Retailing Industry Speaks [65]. Restaurant delivery, due to COVID-19, on 31 March 2019, was at 16% in Germany and at 31% in the USA. For clothing, it was almost the same (25 vs. 26%), for household cleaning products it was 9% for Germany and 26% for the USA [66]. COVID-19 has led to a drastic change in consumer demand outside restaurants. Restaurant bookings dropped dramatically in early March 2020, reaching zero at some point with the final closure of restaurants and hotels [67]. The global pandemic period is affecting consumer behavior worldwide. In October 2020 vs. January 2020, online traffic in the supermarket segment increased by 34.8%, sports equipment increased by 23.6%, and cosmetics by 3.7%. Online visits in the tourism sector decreased by 43.7%, and for media by 13.2% [68]. As can be observed, e-commerce is not trying to exclude traditional commerce but is trying to help organizations to adapt to change and to environmental conditions, being an extension of it, a solution for customers and organizations with actual results. Even small businesses had the opportunity to reach international markets due to the use of the Internet, IT capabilities (outside-in, inside-out, or spanning) [69], and e-commerce. E-commerce worldwide has expanded, its sales growing from 1336 bill US $ in 2014 to 4206 bill US $ in 2020 [70]. The COVID-19 pandemic has made it clear that e-commerce can be an instrument, an essential solution for consumers in times of crisis, and is also an economic engine for small economic entities.
Compared to the offline market, B2C e-commerce opens new challenges for companies, which must manage additional issues [10]. Millions of online customers change their behavior simultaneously to save time and the comfort of online shopping at home. In 2018, global e-retail sales grew 22.9% compared to 2017, accounting for 12.2% of global retail sales [71]. Thus, as may be observed, e-commerce may find opportunities to grow. Internet users can choose from different online platforms to browse, compare, and buy the items or services they need. While some websites specifically target Business-to-Business (B2B) customers, individual consumers are also offered many digital possibilities.
In 2019, the first two ranked companies in e-commerce were Alibaba, with 15% and a 538 bill US $ gross value [72], and Amazon, with 13% of global e-commerce [73]. Online retail sites have recorded substantial traffic gains due to the global coronavirus pandemic because a large part of the population stayed at home and ordered online items they would usually buy in the store. Amazon.com had a monthly traffic average of nearly 3.68 billion visitors in 2020, followed by eBay.com with an average of 1.01 billion visits each month [74]. In 2020, global retail e-commerce sales reached 3.9 trillion US $ (with Asia Pacific generating 2.45 trillion US $- due to China’s impact, second-ranked North America with 749 billion US $ in retail e-commerce revenues [75]. Before the crisis generated by the SARS-CoV-2 virus, the research recalled a positive behavior of online commerce, online sales being predominant for products that can be classified as “hobby or entertainment” [76,77]. During the pandemic, consumer behavior changed dramatically. Thus, the fears of infection and the restrictions imposed by isolation have increased online commerce [78]. International studies have shown that the pandemic has significantly impacted consumer behaviors that have led to the growth of online shopping [79,80]. Among the factors that influence the behavior of online consumers, it can be noted that several researchers mention the influences of the media [81,82] but also the advantages brought by e-commerce [83]. Studies show that consumer behavior will also be focused on online commerce in 2021. Even if the growth of e-commerce will not be as significant as in 2020, online sales are still expected to increase by 14.30% this year [84].

2.2. B2C E-Commerce in Romania—A Market in Continuous Increasing

E-commerce sales in Romania have registered a significant increase in 2019 of 4.68 billion euros (meaning an increase of 3.54 billion euros compared to the turnover recorded in 2013) [85]. In 2020, due to the pandemic, social distancing measures, lack of mobility, and teleworking, e-commerce sales achieved 5.5 billion euros [86].
In Romania, 2020 brought an increase of 38.4% for online commerce [87]. The first position in Romanian e-commerce buyers’ wishes is fashion products, followed by electronics and media. Bucharest, the Romanian capital, was the city with the highest share of online payments: this happened due to a few delivery apps, such as Glovo, Food Panda, or UberEats [88]. The fashion segment generated the largest revenue between 2017 and 2020. In 2020, it generated approximately 943 million US dollars and was set to exceed one billion US dollars for the first time in 2021. Electronics and media generated 607 million US dollars in revenue in 2020 [89]. In Romania, the e-commerce market generated an average revenue per user of 283 US dollars in 2020. By 2025, this will increase to an estimated 380 US dollars, according to the Digital Market Outlook [90]. In Romania, the number of e-commerce users increased every year. In 2017 there were 5.2 million users, and in 2018 this increased up to 8.3 million. By 2025, e-commerce use will increase to an estimated 10.7 million people [91,92].
In the context of the pandemic, the number of Romanians buying online has increased by 13% this year compared to 2019, and the average amount spent on online shopping has increased by 41% compared to 2019. The fastest development in online sales was recorded by catering services (delivery of cooked food), an increase of 124% compared to 2019 [93]. Moreover, the number of people who pay online by card has increased by 14% this year compared to 2019, according to market research conducted by iSense Solutions for GpeC [94]. The most significant sales through e-commerce during the COVID-19 pandemic in Romania were recorded in the beauty sector (an increase of 309.5% in April 2020 compared to 2019). At the same time, books, movies, and music saw an increase in online sales of 22.4% [95]. Even though Romania is in the top 10 areas of high-speed internet, more than 10 million Romanians use the Internet every day, and about 300,000 buy one or more products daily, it is still at the bottom of the ranking in average online shopping (45%) only downgraded by Bulgaria by 42% of internet users who have bought online at least once in the last 12 months [96,97]. Even the penetration rate of e-commerce grew in Romania, from 26.5% in 2017 to 43.4% in 2020. By 2025, user penetration will increase to nearly 57 percent, according to the Digital Market Outlook [98].
The share of Romanian e-commerce in the total turnover of enterprises increased in the last few years. In 2009, the share was 2%, in 2013 it was 6% and in 2018 it was 9% [99]. At the conference organized by the Romanian Association of Online Stores on the first edition of the National E-Commerce Day, Luca Cassetti, Secretary General of Ecommerce Europe, stated that in the most challenging year for modern trade, Romania will manage to maintain its top position among the countries with the most significant increases in e-commerce throughout the EU [100]. E-commerce has become the most tempting business for entrepreneurs. This sector grew by 31% in 2020, and advanced development is expected for 2021 [101]. E-commerce in Romania is affected by the lack of trust in paying online (the highest share of online payments in 2019 was registered in Bucharest—43%, Cluj—11%, and Timis—7.5%) [102]. Lack of interest in buying online also affects e-commerce (the customers are still interested in buying from the shop). The reduced interaction with e-sellers and the lack of individuals’ digital skills (for a clear image, in 2019 Romania’s level of this was 31%, EU-27 56%, Denmark and Germany 78%, Netherlands 79%, and Norway 83%; only Bulgaria had the level of 29%) are causal factors [103]. The reduced number of PCs means reduced penetration of internet users—Romania has a rate of 73.8%, compared to Europe’s 87.8%, Denmark has 97.8%, Germany has 96%, the Netherlands has 95.6%, and Norway has 98.4%. Only Bulgaria has a lower rate of 66.7% on the 31 December 2020) also affects e-commerce [104].

2.3. SWOT Analysis of Using E-Commerce

E-commerce, also known as the online shopping industry, has dramatically evolved recently. As a result of technological developments, the rapid development of IT devices, and internet access, more and more buyers are choosing to use online commerce. The success of e-commerce is due to various social, technological, cultural, and psychological factors that have contributed to the development of online shopping mechanisms over classic commerce. A SWOT analysis of e-commerce allows us to know the strengths and weaknesses of this phenomenon but also to identify opportunities and possible threats that could affect businesses in this field in the future (Table 1).

3. Materials, Methods, and Research Hypothesis

The research analyzes the influence of some essential factors on e-commerce at Romanian levels, such as Internet purchases by individuals (X1), digital single market—promoting e-commerce for individuals (X2), the share of e-commerce in total turnover of enterprises (X3), the share of enterprises that sell online (X4), websites and functionalities (X5).
To realize these the following objectives and the following research hypothesis were proposed:
-to analyze each influencing factor on Romanian e-commerce and their correlation; so, the following hypothesis was proposed:
Hypothesis 1 (H1).
The analyzed factors have a significant influence on the Romanian e-commerce market.
-to analyze the evolution of the Romanian e-commerce market. Given the statistics for e-commerce, Romania is the 49th largest market, having a revenue of 3 billion US dollars in 2021 (being ahead of Singapore and behind Greece) [133] and is projected to reach 6.932 billion US dollars in 2022 [134], thus, the following hypothesis was proposed.
Hypothesis 2 (H2).
The E-commerce market for Romania is continuing to grow, becoming a mature market.
-to forecast the value increase for analyzed variables to achieve at least the average for UE-27 or the average for 4gc. So, the following hypothesis was proposed:
Hypothesis 3 (H3).
Romanian e-commerce market will provide opportunities for sustainable growth.
Data about the analyzed variables being not all registered in 2021 were used until 2020. The research relied on public information presented at the national and international level about the evolution of e-commerce and the comparison between the analyzed groups based on the graphical representation of each factor influencing e-commerce efficiency. Statistical analyses and graphical representations were made using Excel-Data Analysis, and the forecasts are based on QM for Windows. For the correlation between the chosen variables (data about e-commerce and its influence at the Romanian level), we used several techniques, including correlation coefficient modeling based on the correlation matrix, simulation based on OLS, and Pearson coefficient. The research also uses modeling (Time series analysis, constraint function, and forecasting method—linear programming) to observe a possible trend of Romanian level for e-commerce values and make decisions over time, minimizing future problems and risks.
The analysis is made by comparing data referring to e-commerce and its influencing factors on Romania level, average EU-27 level, 4gc (Denmark (DK), Netherlands (NL), Germany (DE), Norway (NO)) as having the highest values on analyzed variables from the European Union, and the weakest value from European Union-Bulgaria (BG). The e-commerce market for developed countries is in the maturity phase, and the competition among e-players is intense and cost-intensive [135]. Romania has a market found in the growing phase (Table 2). Even if the revenue in the Romanian e-commerce market is growing (projected to reach 2837 m US $ in 2021) [92], it was still reduced in 2020 (18%), coming from behind the average for EU-27 (17%), but compared to 4gc (values between 18 and 38) it is still low. Only Bulgaria was overtaken, which has registered 8% of e-commerce sales.
A survey was taken in 2019 on ICT usage in households and by individuals in EU-27 [134], showing that customers still prefer shopping in person and loyalty to shop (73%). A total of 71% of e-buyers said that they encountered no problem when making an online purchase; the rest of them encountered problems such as slower delivery (17%), technical problems (8%) and damaged goods (8%). The most significant proportion of people buying online is those aged 55–74 (42%). Four in ten e-shoppers said they spent between 100 and 499 euros on online purchases. Data about registered values for individual e-purchases are below (Table 2). It can be observed that Romania and Bulgaria have registered low values between 2011 and 2020 for internet purchases by individuals. Compared to the group formed by the four European countries with the most significant values registered for e-commerce (noted as g4c), Romania (17%) is lower than these countries, which registered values between 68–76% in 2020, lower by 347% compared to the most significant value obtained by Denmark.
The European Digital Single Market (DSM) has become a priority for the European Commission; DSM is still immature for some goods and services. Big countries have a higher share of e-commerce, but small countries do not, a feature of the DSM that is still in its infancy. DSM concentrates on specific product categories (clothing, footwear, media products, and consumer electronics), representing 45% of sales [140]. Data about this characteristic are presented in countries analyzed between 2011 and 2020 (Table 2).
The 4gc is registering large values again for promoting e-commerce for individuals (between 83 and 89%). For Bulgaria (31%) and Romania (38%), participation in e-commerce is far below their population shares, even from the EU-27 average (64%). The turnover made through e-commerce was relatively low in Romania in 2009 (2%). In 2018, it amounted to 9%. In 2020, e-commerce accounted for 19% of total turnover in enterprises in EU-27. It has a minor increase from the prior year when e-commerce share was 18% of total turnover.
Romania (11%) and Bulgaria (8%) are in the last rank, compared to the average for EU-27 (19%) and the g4c with values between 17 and 28%. In 2020, the share of enterprises selling online was measured as 20% in all EU-27 countries (Table 2), and the highest point between 2011 and 2020. In 2011, only 13% of enterprises were selling online in EU-27 [141]. The most significant values were obtained by Denmark (34%) and Norway (31%); Romania obtained only 12% (being above Bulgaria with 8%).
From 1991, when the first website was developed, in 2014, the number reached 1 billion, and in 2021 there are 1.828 billion websites worldwide. Even if almost 2 billion websites exist worldwide, only 200 million are active [142]. The websites’ percentages and functionalities are presented below (Table 2). As can be observed (Table 2), this is the only variable where the percentage is lower than the average for EU-27 and the analyzed group. It is lower even compared to the value registered for Bulgaria. In May 2020, YouTube was the first ranked, generating over 5.3 billion global visits via organic search traffic, Wikipedia accumulated 2.2 billion organic search visits, and Facebook registered with more than 1 billion organic search visits [143]. By collecting data about the influencing factors described above, a database was built (Table 3) and may be used in developing the necessary research to analyze the correlation between the analyzed variables.
Data were collected from www.eurostat.com (accessed on 19 February 2022) between 2011 and 2020, and it was used as a correlation matrix and Excel-Data Analysis.

4. Results

4.1. Analyse the Correlation between the Chosen Variables

Using correlation matrix, objectives are: 1. To summarize the data and observe the patterns. In the example above, the observable pattern is that all the variables are highly correlated with each other: (a) the correlation between independent variables and e-commerce: Very high correlation (between 0.9–1.00): X2 has the highest impact on e-commerce (0.94) and X4 (0.93); High correlation (between 0.7–0.9): X1 has a high impact on e-commerce (0.85), X3 (0.86), and X5 has a high impact on e-commerce (0.70); (b) the correlation between each independent variable: Very high correlation (0.9–1.00): between X1 and X2 (0.94), X1 and X3 (0.95), X3 and X4 (0.92), X3 and X5 (0.90); High correlation: between (0.7–0.9): between X2 and X5 (0.66), X1 and X5 (0.77), X2 and X4, X1 and X4, X4 and X5 (0.85), X2 and X3 (0.88) (Table 4).
The correlation matrix revealed only positive, high, and very high correlations between independent variables and dependent variables. So, Hypothesis 1 (H1)—“The analyzed factors have an important influence on Romanian e-commerce markets” is wholly fulfilled. The most significant and positive influence is 0.94 (X2–Digital single market—promoting e-commerce for individuals) and 0.93 (Share of enterprises that sell online–X4). The most reduced influence, but also strong and positive, is 0.70, from Websites and functionalities–X5.

4.2. Analyze the Relationship between the Chosen Variables and the Impact on E-Commerce

The Pearson coefficient (R squared and multiple R) and the regression function were calculated to observe the impact of the independent variables on the dependent variable (e-commerce) at the Romanian level (Table 5).
As may be observed, R-squared is 0.98. Thus, R becomes 0.99 showing that between the analyzed variables, there is a positive and very high relation and that the evolution of chosen X factors explains 99.3% of the evolution of variable Y. Thus, the impact is very high, very close to 1, so the chosen influence factors are chosen well. However, even if the R squared is very close to 1, it does not mean that the situation at the Romanian level for e-commerce is good; the analysis made at the first point, based on the comparison, shows significantly lower values for e-commerce and also for the analyzed influencing factors.
Excel-Data Analysis obtained the following results for the OLS regression function (Table 6).
Estimation equation and substituted coefficients:
Y = 0.209 − 0.42X1 + 0.37X2 − 0.03X3 + 1.05X4 − 0.02X5
To increase with a monetary unit, y will obtain a decrease of 0.42 monetary units of X1, 0.03 m.u. of X3, 0.02 m.u. of X5, and an increase of 0.37 m.u. of X2, and 1.05 m.u. of X4. It is observed that the value of the free term (0.209) is not high, so the chosen factors have a significant impact on the evolution of Y (being positive). The positive value of the free term shows that the variables chosen for the econometric model positively affect the evolution of Y.

4.3. Forecasting E-Commerce in 2021 Using Time Series Analysis (Brown Method)

To estimate the value for e-commerce in 2021, the Time Series Analysis can be implemented, based on past data, in the hypothesis that a specific trend (cyclic or seasonal) in the evolution of the analyzed variable cannot be identified. The method uses the following formula of calculation:
F t 1   = a   ×   Y t + ( 1 a )   ×   F t
In which Ft and Ft−1 are the forecasted values for t and t − 1 moments, Yt is the value for e-commerce registered in Romania for the analyzed period at t moment, and t is from 1, 2, …, 10. A constant α, α є [0,1] will be used. Values are now generated in this interval from [0,1]. Then, for each value, the squared errors will be determined and chosen for which this sum (MSE) is at a minimum. The error results with the calculation formula: et = Ft − Yt, where t = 1, …, 10, and e2 is the analyzed sum (MSE) (Table 7).
Making the difference between actual and forecasted values obtains the errors; the squared errors and summing up will be obtained the sum of squared errors called MSE (Table 8). Looking to minimize MSE, we observe that alpha-0.9 is achieved at the minimum.
Using QM for Windows program, we could determine the forecasted value of e-commerce for 2021 (17.36) (Table 9). For a value of alpha of 0.9 are obtained: Bias—1.65, MAD—2.2, MSE—8.15, MAPE—0.21, and a SE—3.23.
Being under the value from 2020, it is recommended to use another method to minimize the impact of some variables on e-commerce and to determine which variables may be increased to obtain a better value for e-commerce, at least the average of EU-27.

4.4. Forecast the Value for Analyzed Variables to Achieve at Least the Average for UE-27 or 4gc

To maximize the analyzed variables, two conditions were chosen: to increase the values existent at the Romanian level compared to the average for EU-27 at least and the average existing at the 4gc group (Table 10). Linear programming is imposed, and the chosen tool is QM for Windows.
Two constraints were chosen, and five variables were analyzed in the OLS analysis. The goal is to maximize the values using the equation (as an average for the two constraints):
max 3X1 + 2X2 + 2X3 + 2X4 + 2X5 + 2X5
The two constraints are:
1. max 3X1 + 1.7X2 + 1.7X3 + 1.7X4 + 1.7X5 ≤ 18
2. max 4X1 + 2.3X2 + 2.1X3 + 2.3X4 + 1.9X5 ≤ 24
They were built starting from the proportion between RO values and EU-27 and average 4gc group values. Making the proportions, the two constraints developed above were obtained. The Solve menu was chosen to determine the solutions to the problem (the results are presented in Table 11).
As can be observed, the value for y at the RO level was 18%. For EU-27 it was 18%, and the average for 4gc was 24. To maximize the value for Romania and obtain high-performance e-commerce, X2 must increase by 9.70% and X5 by 0.88% to obtain a value for Y of 21, 17.
According to this calculation (Table 12): X1 may range between Infinity and 3.52, X2 between 2 and 2.42, X3 and X4 between Infinity and 2, and X5 may remain constant. The values for y—in the first case—that of achieving the average value for EU-27—the new Y for RO may range between 17.73 and 21.47 and on average for 4gc may range between 20.11 and 24.35. According to the calculation and constraints, a few measures are imposed to increase X2 and X5. Measures to increase X2- Digital single market—promoting e-commerce for individuals: Romania must access the EU space of e-commerce, sustained by The European Commission, as part of its strategy. It plans to have a single online market without borders, eliminate geo-discrimination and geo-blocking, increase price transparency, transparent access to multi-lateral cross-border agreements, and align national rules to EU regulations, and to obtain better cooperation, better shared resources, faster financial flows, and more accessible websites. Measures to increase X5-Websites and functionalities: Starting from the idea of from local to general, the local websites must have a few characteristics to improve the use of a website and increase the value of e-commerce at the national level. Measures to increase X5-Websites and functionalities: the local websites must have a few characteristics to improve the use of a website and increase the value of e-commerce at the national level. The characteristics are simple but may help e-customers to use websites and improve the mutual relationship, according to a win-win relationship. Trust in using a website, security, dynamic content, interactivity, consistency, the time to open a website, an attractive design, according to the audience needs, a clear description, the easy navigation, offered help, testimonials, and information from other customers (built according to the principle of storytelling), using images.
From the results above, we can conclude Hypothesis 2 (H2). The E-commerce market for Romania is continuing to grow, and becoming a mature market is wholly fulfilled.

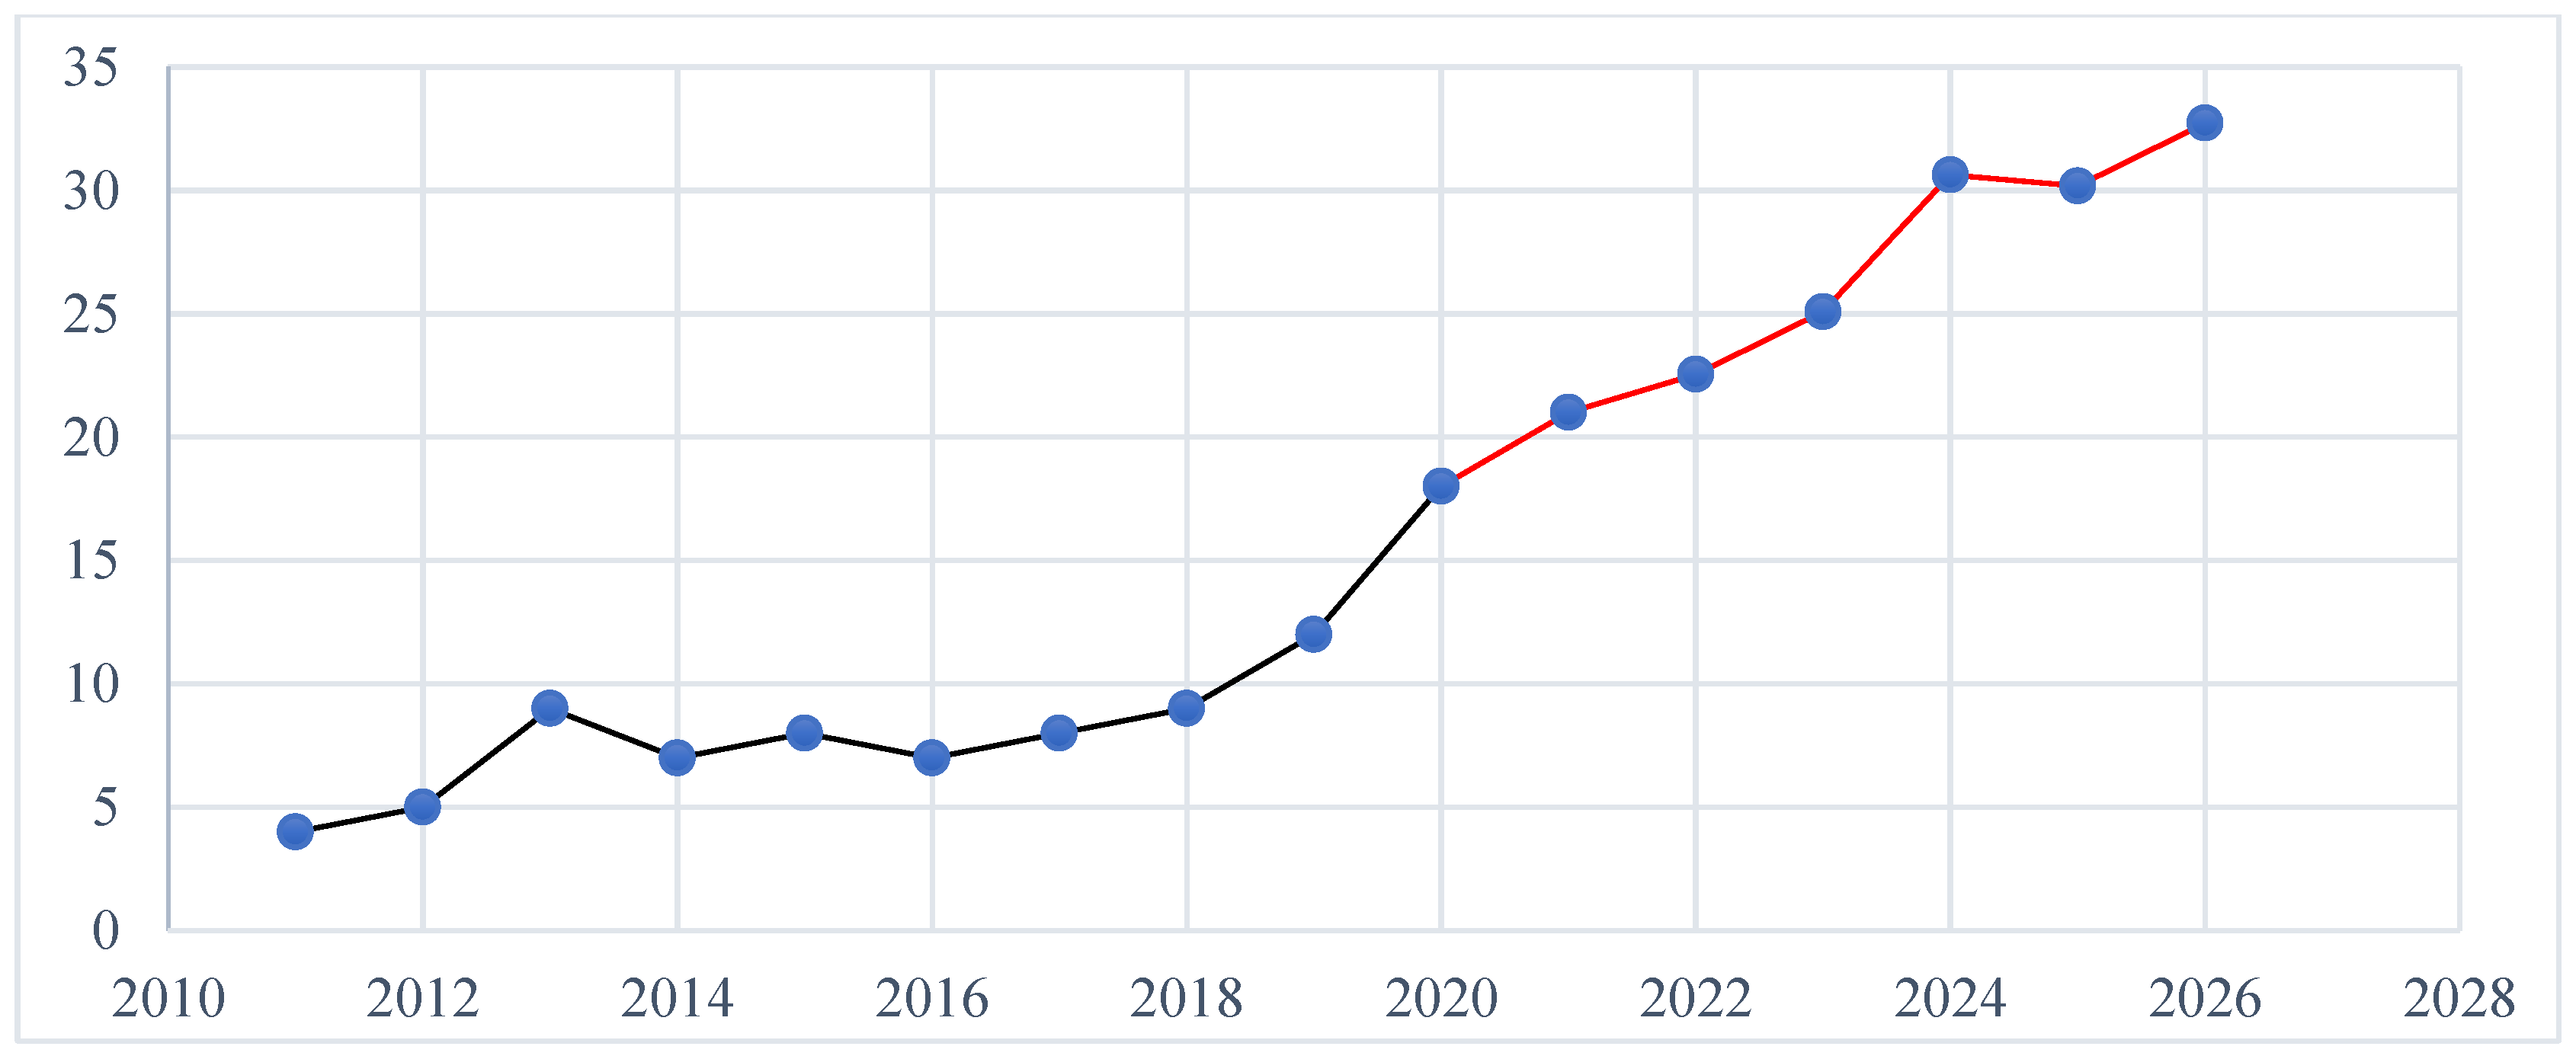
4.5. Forecasting E-Commerce Values for Romania between 2022–2026

As was noticed, between 2011 and 2020 official data for e-commerce at the Romania level were registered. For 2021–2026, the possible future value was obtained using the forecasting method—linear programming.
PC t = ( Y n Y 0 ) ( n 1 )
Y t + 1 = Y 0   + ( t + 1 )   ×   MMP t
where: PCt—the average of percentual change for the first t periods, Y0—observed value from the first period of the forecasted variable, Yt—observed values in the last period of the forecasted variable.
PC = ( 21 4 ) ( 12 1 ) = 17 11 = 1.54
Y 12 = 4 + 12   ×   1.54 = 22.54
Y 13 = 5 + 13   ×   1.54 = 25.08
Y 14 = 9 + 14   ×   1.54 = 30.63
Y 15 = 7 + 15   ×   1.54 = 30.17
Y 16 = 8 + 16   ×   1.54 = 32.72
An increased trend is observed in e-commerce values at the Romanian level, using simulation for the following 6 years (Table 13).
Starting from these values was implemented the Percentual method, which showed us new possible future values necessary to make the decisions above from time: increase the values for X2 and X5 to have at least the average between the EU-27 value and the average of 4gc. Starting from the simulated value for 2021 were obtained new simulated values for 2022–2026 (Figure 1).
This analysis shows an increase in e-commerce values, so Hypothesis 3 (H3)—The Romanian e-commerce market will provide opportunities for sustainable growth—is fulfilled. The pandemic time will be only the trigger for increased values for the 2022–2026 period. By using e-commerce, the companies will have better results, better interactions with customers based on personalization and customization, and for customers and the entire society.

5. Discussion

E-commerce, as may be observed, has evolved so much in the world, being a real solution during COVID-19. E-commerce is not trying to exclude traditional commerce but is trying to help customers and organizations survive, offer new solutions to obtain performance due to lockdowns, and keep distance. The trends indicated increased trends for countries worldwide and categories of products. Romania is following this trend, this period offering the opportunity for people to buy or to pay online.
The essential findings of this study indicate future possibilities for organizations. Therefore, the comparison analysis between Romania and some groups formed from European countries and the application of a model that considers some factors influencing e-commerce efficiency can be used to predict the direct relation between the analyzed variables and the correlation matrix from the perspective of knowing from the time the possible risks and issues that could appear.
Future possibilities for societies and at the international level—a future extension for this research could be focused on the relationship between these new variables: trust, attitude, behavior, and payment type. The analysis could be implemented on local, regional, or global levels to make objective comparisons, improve processes, and obtain performance. Using simulation and modeling and simple forecasting programs, the situation for e-commerce could improve for individuals, companies, and society. Knowing possible problems and risks could be developed objectives, measures, and regulations that may help improve performance. E-commerce knew an increased evolution globally, is very active (also due to the COVID-19 period), and being without borders brought multiple advantages for individuals, society, organizations, and their processes (delivery and logistics, communication, relationship with customers, programming language), for the environment, bringing sustainable competitive advantage for personal and business development [148,149,150,151,152,153]. Obtained results using simulation and modeling indicate that the Romanian e-commerce market still can grow; obtaining increased possible trends and becoming mature will offer opportunities, and the resources will be a real investment, not a cost in the long term.

6. Conclusions

Using a comparison method between Romania, average EU-27, 4gc, and the weakest value, gaps over time were observed and measures were taken, such as better policies for e-activities, improved e-work, e-skills, and increasing the number of PCs. Additionally, using the analysis of relation and correlation between the analyzed variables and Excel-Data Analysis, the specialists could use the results and apply this model to other countries and regions to observe the differences and make a comparison. Even if this limitation exists, the results will help at the local, regional, or global level and to use this data for future prediction and better decisions. Thus, the research could form a better solution for different researchers, experts in the field, or managers, or even better for the macroeconomic level to make better forecasts and predictions. This knowledge should allow some processes to improve performance, trust, attitudes, and behaviors facing e-commerce and its real results. Analyzing the variables, as factors with great influence on e-commerce, it was observed that comparing Romania with the EU-27 average and the two groups (the greater and the weakest values), for e-commerce, from 2017, Romania grew achieving the value of EU-27; at the same time, Germany and the Netherlands reduced their values, approaching from the same value. As for internet purchases of individuals, from Romania’s low level (17), all the other countries from the strong group (values from 68 to 76) and the EU-27 average (51), a significant difference was observed. More reasons presented in the paper indicate why Romanian people buy so little online: lack of trust, reduced number of PCs, or reduced access to the Internet. The difference for the single digital market is not significant (38 compared to 64 for EU-27 average) and 83–89 for the 4gc. The share of e-commerce in total turnover does not indicate increased values (11 for Romania, 19 for EU-27 average, and 4gc values between 17 and 28). All these are happening due to the reduced share of enterprises that sell online (12 for Romanian, 20 for EU-27, and between 20 and 34 for 4gb). As for websites and their functionalities, the analysis shows no difference from other variables. Romania (46), EU-27 (77), and for 4gc, the values are between 79 and 93. Calculating the correlation between the analyzed variables, positive and strong correlations between 0.64 and 0.94 are observed. As we may observe, they are all positive and above the average, tending to the maximum. R is 0.993 showing that between the analyzed variables, there is a positive and very high relation and that the evolution of chosen independent variables explains 99.3% of the evolution of e-commerce. Even though there is a strong and positive relationship between variables because the values are below the EU-27 average, a model was proposed (for better measures) to increase the Romanian values to at least equal the EU-27 average or the average for 4gc. Using regression function to analyze the influence that each analyzed independent variable could have on the dependent variable (e-commerce), results that the influence of all factors is positive and strong (between 0.7 and 0.94), so the first research hypothesis-H1 was fulfilled. After using the regression function, a simulation model was implemented to observe whether using Time series analysis could obtain a better simulated future value for e-commerce in 2021. Calculated for alpha between 0.1 and 0.9, it can be observed that the new forecasted value is under the value for 2020. Thus, QM was implemented for Windows program, which helped to indicate that, growing the second variable with 9.7% and the fifth variable with 0.88%, the proposed value could be obtained. Thereby, the second research hypothesis-H2 is fulfilled. A set of measures for the two variables proposed for increasing was developed. To observe and analyze a possible future for 2021–2026, forecasting method- linear programming was implemented. The graphical representation offers a positive and increasing forecasted future trend for e-commerce, so the third research hypothesis was completely fulfilled—H3. To conclude, it may be added that at the Romanian level, e-commerce is not at the beginning, but it can improve its values very much, bringing performance for individual e-customers, e-companies, and the entire society. The forecasted future trend shows interest from many involved parties, and the pandemic period was only the trigger for better results.

Author Contributions

Conceptualization, N.V.F. and C.A.I.; methodology, N.V.F.; software, N.V.F. and M.C.D.; validation, C.A.I., S.C., M.D.C. and S.G.S.; formal analysis, N.V.F. and S.C.; investigation, M.D.C., S.G.S. and C.A.I.; resources, L.P.; data curation, S.C.; writing—original draft preparation, N.V.F., S.G.S. and L.P.; writing—review and editing, N.V.F. and C.A.I.; visualization, M.D.C. and L.P.; supervision, N.V.F. and C.A.I.; project administration, N.V.F.; funding acquisition, L.P. All authors have read and agreed to the published version of the manuscript.

Funding

This research received no external funding.

Conflicts of Interest

The authors declare no conflict of interest.

References

  1. International Trade Centre. Executive Summary: COVID-19: The Great Lockdown and Its Impact on Small Business. 2020. Available online: https://www.intracen.org/uploadedFiles/intracenorg/Content/Publications/ITC_SMECO-2020ExSummary_EN_web.pdf (accessed on 1 March 2022).
  2. United Nations. Impact of the COVID-19 Pandemic on Trade and Development. Transitioning to a New Normal. 2020. Available online: https://unctad.org/system/files/official-document/osg2020d1_en.pdf (accessed on 1 March 2022).
  3. Li, K.; Kim, D.; Lang, K.; Kauffman, R.; Naldi, R. How should we understand the digital economy in Asia? Critical assessment and research agenda. Electron. Commer. Res. Appl. 2020, 44, 1–16. [Google Scholar] [CrossRef]
  4. World Bank Group. Trade and COVID-19 Guidance Note. Recommendations to Leverage E-Commerce during the COVID-19 Crisis. 2020. Available online: http://documents1.worldbank.org/curated/en/280651589394091402/pdf/Recommendations-to-Leverage-E-Commerce-During-the-COVID-19-Crisis.pdf (accessed on 1 March 2022).
  5. UNCTAD. COVID-19 and E-Commerce: Impact on Businesses and Policy Responses. 2020. Available online: https://unctad.org/system/files/official-document/dtlstict2020d12_en.pdf (accessed on 1 March 2022).
  6. CBRE Global Investors. E-Commerce 2020: Will the Pandemic in Italy Prove Transformational? 2020. Available online: https://www.cbreglobalinvestors.com/wp-content/uploads/2020/07/future-role-of-ecommerce-in-italy.pdf (accessed on 1 March 2022).
  7. World Trade Organization. E-Commerce, Trade and the COVID-19 Pandemic. 2020. Available online: https://www.wto.org/english/tratop_e/covid19_e/ecommerce_report_e.pdf (accessed on 1 March 2022).
  8. Florea, N.V. E-business-a virtual bridge with real results between organizations and customers-a mathematical view. JOSA 2018, 4, 989–1000. [Google Scholar]
  9. Turban, E.; Outland, J.; King, D.; Lee, J.K.; Liang, T.P.; Turban, D.C. Electronic Commerce 2018: A Managerial and Social Networks Perspective; Springer: Cham, Switzerland, 2018. [Google Scholar]
  10. Mangiaracina, R.; Perego, A.; Seghezzi, A.; Tumino, A. Innovative solutions to increase last-mile delivery efficiency in B2C e-commerce: A literature review. Int. J. Phys. Distrib. Logist. 2019, 49, 901–920. [Google Scholar] [CrossRef]
  11. Lin, X.; Wang, X.; Hajli, N. Building e-commerce satisfaction and boosting sales: The role of social commerce trust and its antecedents. Int. J. Electron. Commer. 2019, 23, 328–363. [Google Scholar] [CrossRef]
  12. Kim, H.; Niehm, L.S. The impact of website quality on information quality, value, and loyalty intentions in apparel retailing. J. Interact. Mark. 2009, 23, 221–233. [Google Scholar] [CrossRef]
  13. Rafiq, M.; Fulford, H.; Lu, X. Building customer loyalty in online retailing: The role of relationship quality. J. Mark. Manag. 2013, 29, 494–517. [Google Scholar] [CrossRef]
  14. Bresciani, S.; Ferraris, A.; Santoro, G.; Nilsen, H.R. Wine sector: Companies’ performance and green economy as a means of societal marketing. J. Promot. Manag. 2016, 22, 251–267. [Google Scholar] [CrossRef]
  15. Bresciani, S.; Giacosa, E.; Broccardo, L.; Culasso, F. The family variable in the French and Italian wine sector. EuroMed J. Bus. 2016, 11, 101–118. [Google Scholar] [CrossRef]
  16. Gupta, P. E-Commerce in India: Economic and Legal Perspectives; SAGE Publication: New Delhi, India, 2020. [Google Scholar]
  17. Manzoor, A. E-Commerce-an Introduction; Lap Lambert Academic Publishing: Saarbrucken, Germany, 2010. [Google Scholar]
  18. Audretsch, D.B.; Welfens, P.J.J. The New Economy and Economic Growth in Europe and the US; Springer: New York, NY, USA, 2002. [Google Scholar]
  19. Da Costa, E. Global E-Commerce Strategies for Small Businesses; MIT Press: London, UK, 2001. [Google Scholar]
  20. Grefen, P. Mastering E-Business; Routledge: New York, NY, USA, 2010. [Google Scholar]
  21. Combe, C. Introduction to E-Business. Management and Strategy; Routledge: London, UK, 2006. [Google Scholar]
  22. Mehandjiev, N.; Grefen, P. Dynamic Business Process Formation for Instant Virtual Enterprises; Springer: London, UK, 2010. [Google Scholar]
  23. LaCamera, B. E-Commerce; Cherry Lake: Ann Arbor, MI, USA, 2019. [Google Scholar]
  24. Sander, P.; Bobo, S. The 100 Best Stocks to Buy in 2020; Adams Media Corporation: Holbrook, AZ, USA, 2020. [Google Scholar]
  25. Kathuria, S.; Grover, A.; Perego, V.M.E.; Mattoo, A.; Banerjee, P. Unleashing E-Commerce for South Asian Integration. International Development in Focus; World Bank: Washington, DC, USA, 2020. [Google Scholar]
  26. Bass, K. E-Commerce and Mobile Commerce Technologies; Ed–Tech Press: Essex, UK, 2019. [Google Scholar]
  27. The Organisation for Economic Co-operation and Development OECD. Unpacking E-Commerce: Business Models, Trends and Policies; OECD Publishing: Paris, France, 2019. [Google Scholar] [CrossRef]
  28. Sastry, V.V.L.N. Current Technologies Employed in E-Commerce Customer Service by Leading Players; Blue Diamond Publishing: Chhattisgarh, India, 2020. [Google Scholar]
  29. Sreedhar, G. Improving E-Commerce Web Applications through Business Intelligence Techniques; IGI. Global: Hershey, PA, USA, 2018. [Google Scholar]
  30. Qian, J.; Law, R. Examination of website language strategies adopted by five-star hotels in China: A corpus approach. J. Theor. Appl. Electron. Commer. Res. 2021, 16, 1066–1078. [Google Scholar] [CrossRef]
  31. Chaffey, D.; Edmundson-Bird, D.; Hemphill, T. Digital Business and E-Commerce Management, 7th ed.; Pearson: Harlow, UK, 2019. [Google Scholar]
  32. Raychauduri, A.; De, P.; Gupta, S. (Eds.) World Trade and India: Multilateralism, Progress and Policy Response; Sage Publications India Pvt. Limited: New Delhi, India, 2020. [Google Scholar]
  33. Jocevski, M.; Ghezzi, A.; Arvidsson, N. Exploring the growth challenge of mobile payment platforms: A businessmodel perspective. Electron. Commer. Res. Appl. 2020, 40, 1–13. [Google Scholar] [CrossRef]
  34. Khouja, M.; Liu, X. A retailer’s decision to join a promotional event of an e-commerce platform. Int. J. Electron. Commer. 2020, 24, 184–210. [Google Scholar] [CrossRef]
  35. Pu, X.; Sun, S.; Shao, J. Direct selling, reselling, or agency selling? Manufacturer’s online distribution strategies and their impact. Int. J. Electron. Commer. 2020, 24, 232–254. [Google Scholar] [CrossRef]
  36. Weber, A.; Maier, E. Reducing competitive research shopping with cross-channel delivery. Int. J. Electron. Commer. 2020, 24, 78–106. [Google Scholar] [CrossRef]
  37. Pan, H.; Zhou, H. Study on convolutional neural network and its application in data mining and sales forecasting for e-commerce. Electron. Commer. Res. 2020, 20, 297–320. [Google Scholar] [CrossRef]
  38. Li, X.; Liao, Q.; Luo, X.; Wang, Y. Juxtaposing impacts of social media interaction experiences one-commerce reputation. J. Electron. Commer. Res. 2020, 21, 75–95. [Google Scholar]
  39. Izadi, B.; Dong, L.; Esfidani, M.R. Stay home and shopp together. J. Electron. Commer. Res. 2021, 22, 59–75. [Google Scholar]
  40. Rezaei, S.; Hajli, N.; Gbadamosi, A.; Aghaali, N.; Featerman, M. Brand value co-creation in the social commerce era: Empiricsal evidence from Iran. J. Electron. Commer. Res. 2021, 22, 46–58. [Google Scholar]
  41. Xu, X.; Wu, J.F.; Li, Q. What drives consumershopping behavior in live streaming commerce? J. Electron. Commer. Res. 2020, 21, 144–167. [Google Scholar]
  42. Dou, G.; Lin, X.; Chi, R.; Zheng, Z. Pricing strategy of a two-sided platform under consumer categorization. J. Electron. Commer. Res. 2020, 21, 130–143. [Google Scholar]
  43. Bay, L.; Yan, X. Impact of firm-generated content on firm performance and consumer engagement: Evidence from social media in China. J. Electron. Commer. Res. 2020, 21, 56–74. [Google Scholar]
  44. Marolt, M.; Zimmermann, H.T.; Znidarsik, A.; Pucihar, A. Exploring social customer relationship management adoption in micro, small and medium-sized enterprises. J. Theor. Appl. Electron. Commer. Res. 2020, 15, 38–58. [Google Scholar] [CrossRef] [Green Version]
  45. Lai, I.K.W.; Liu, Y. The effects of content likeability, content credibility, and social media engagement on users’ acceptance of product placement in mobile social networks. J. Theor. Appl. Electron. Commer. Res. 2020, 15, 1–19. [Google Scholar] [CrossRef]
  46. Brodie, R.J.; Ilic, A.; Juric, B.; Hollebeek, L.D. Consumer engagement in a virtual brand community: An exploratory analysis. J. Bus. Res. 2013, 66, 105–114. [Google Scholar] [CrossRef]
  47. Cheung, C.M.K.; Lee, M.K.O.; Jin, X.L. Customer engagement in an online platform: A conceptual model and scale development. In Proceedings of the Thirty-Second International Conference on Information Systems (ICIS), Shanghai, China, 4–7 December 2011; pp. 3105–3112. [Google Scholar]
  48. Coker, K.K.; Altobello, S.A. Product placements in social settings: The impact of coviewing on the recall of placed brands. J. Bus. Res. 2018, 87, 128–136. [Google Scholar] [CrossRef]
  49. Hollebeek, L.D.; Glynn, M.S.; Brodie, R.J. Consumer brand engagement in social media: Conceptualization, scale development and validation. J. Interact. Mark. 2014, 28, 149–165. [Google Scholar] [CrossRef]
  50. Mikalef, P.; Giannakos, M.; Pateli, A. Shopping and word-of-mouth intentions on social media. J. Theor. Appl. Electron. Commer. Res. 2013, 8, 17–34. [Google Scholar] [CrossRef] [Green Version]
  51. Ma, L.; Zhang, X.; Ding, X.; Wang, G. How social ties influence customers’ involvement and online purchase intentions. J. Theor. Appl. Electron. Commer. Res. 2021, 16, 395–408. [Google Scholar] [CrossRef]
  52. Hussain, S.; Li, Y.; Li, W. Influence of platform characteristics on purchase intention in social commerce: Mechanism of psychological contracts. J. Theor. Appl. Electron. Commer. Res. 2021, 16, 1–17. [Google Scholar] [CrossRef]
  53. Barsalla, M.; Schneider, J.; Luksik, M.; Jaakonmaki, R.; Brocke, J.V. On latency of e-commerce platforms. J. Organ. Comput. Electron. Commer. 2021, 31, 1–17. [Google Scholar] [CrossRef]
  54. Maaya, L.; Meulders, M.; Vanderbroek, M. Online consumers’ attribute non-attendance behavior: Effects of information provision. Int. J. Electron. Commer. 2020, 24, 338–365. [Google Scholar] [CrossRef]
  55. De Matos, C.A.; Curth, M.; dos Santos Garcia, A. Customer loyalty in the online context: Understanding trust in different parties. J. Electron. Commer. Res. 2020, 21, 237–251. [Google Scholar]
  56. Kazeminia, A.; Kaedi, M.; Ganji, B. Personality-based personalization of online store features using genetic programming: Analysis and experiment. J. Theor. Appl. Electron. Commer. Res. 2019, 14, 16–29. [Google Scholar] [CrossRef] [Green Version]
  57. Anowar, F.; Sadaoui., S. Detection of auction fraud in commercial sites. J. Theor. Appl. Electron. Commer. Res. 2020, 15, 81–98. [Google Scholar] [CrossRef] [Green Version]
  58. Pham, Q.T.; Dang, N.M.; Nguyen, D.T. Factors affecting on the digital piracy behavior: An empirical study in Vietnam. J. Theor. Appl. Electron. Commer. Res. 2020, 15, 122–135. [Google Scholar] [CrossRef] [Green Version]
  59. Amirtha, R.; Sivakumar, V.J.; Hwang, Y. Influence of perceived risk dimensions on e-shopping behavioural intention among women—a family life cycle stage perspective. J. Theor. Appl. Electron. Commer. Res. 2021, 16, 320–355. [Google Scholar] [CrossRef]
  60. Statista. Available online: https://www.statista.com/statistics/1112583/covid-19-impact-books-e-commerce-site-traffic-global/ (accessed on 19 February 2022).
  61. World Bank Blogs. Available online: https://blogs.worldbank.org/psd/how-pandemic-induced-boom-e-commerce-can-reshape-financial-services (accessed on 19 February 2022).
  62. OECD. Available online: http://www.oecd.org/coronavirus/policy-responses/e-commerce-in-the-time-of-covid-19-3a2b78e8/ (accessed on 19 February 2022).
  63. OECD. Available online: http://www.oecd.org/coronavirus/policy-responses/connecting-businesses-and-consumers-during-covid-19-trade-in-parcels-d18de131/#fnotea0z3 (accessed on 19 February 2022).
  64. Census Bureau. Available online: https://www.census.gov/retail/index.html#ecommerce (accessed on 19 February 2022).
  65. Supermarket News. Available online: https://www.supermarketnews.com/issues-trends/fmi-online-grocery-sales-jumped-300-early-pandemic (accessed on 10 February 2022).
  66. Statista. Available online: https://www.statista.com/statistics/1107859/shifting-to-online-purchases-because-of-the-covid-19-pandemic-by-category/ (accessed on 19 February 2022).
  67. OpenTable. Available online: https://www.opentable.com/state-of-industry (accessed on 12 February 2022).
  68. Statista. Available online: https://www.statista.com/statistics/1105486/coronavirus-traffic-impact-industry/ (accessed on 19 February 2022).
  69. Gregory, G.D.; Ngo, L.V.; Karavdic, M. Developing e-commerce marketing capabilities and efficiencies for enhanced performance in business-to-business export ventures. Ind. Mark. Manag. 2019, 78, 146–157. [Google Scholar] [CrossRef]
  70. Statista. Available online: https://www.statista.com/statistics/379046/worldwide-retail-e-commerce-sales/ (accessed on 19 February 2022).
  71. Statista. Available online: https://www.statista.com/statistics/288487/forecast-of-global-b2c-e-commerce-growth/ (accessed on 19 February 2022).
  72. Statista. Available online: https://www.statista.com/statistics/885354/top-global-online-marketplaces-by-gmv/ (accessed on 19 February 2022).
  73. Statista. Available online: https://www.statista.com/statistics/664814/global-e-commerce-market-share/ (accessed on 19 February 2022).
  74. Statista. Available online: https://www.statista.com/statistics/274708/online-retail-and-auction-ranked-by-worldwide-audiences/ (accessed on 19 February 2022).
  75. Statista. Available online: https://www.statista.com/statistics/311357/sales-of-e-commerce-worldwide-by-region/ (accessed on 19 February 2022).
  76. Bettman, J.R.; Luce, M.F.; Payne, J.W. Constructive consumer choice processes. J. Consum. Res. 1998, 25, 187–217. [Google Scholar] [CrossRef]
  77. Shang, R.A.; Chen, Y.C.; Shen, L. Extrinsic versus intrinsic motivations for consumers to shop online. Inform. Manag. 2005, 42, 401–413. [Google Scholar] [CrossRef]
  78. Akhtar, N.; Akhtar, M.N.; Usman, M.; Ali, M.; Siddiqi, U.I. COVID-19 restrictions and consumers’ psychological reactance toward offline shopping freedom restoration. Serv. Ind. J. 2020, 40, 891–913. [Google Scholar] [CrossRef]
  79. Mason, A.; Narcum, J.; Mason, K. Changes in consumer decision-making resulting from the COVID-19 pandemic. J. Cust. Behav. 2020, 19, 299–321. [Google Scholar] [CrossRef]
  80. Pantano, E.; Pizzi, G.; Scarpi, D.; Dennis, C. Competing during a pandemic? Retailers’ ups and downs during the COVID-19 outbreak. J. Bus. Res. 2020, 116, 209–213. [Google Scholar] [CrossRef]
  81. Koch, J.; Frommeyer, B.; Schewe, G. Online shopping motives during the COVID-19 pandemic—lessons from the crisis. Sustainability 2020, 12, 10247. [Google Scholar] [CrossRef]
  82. Constantinides, E. Influencing the online consumer’s behavior: The Web experience. Internet Res. 2004, 14, 111–126. [Google Scholar] [CrossRef] [Green Version]
  83. Tran, L.T.T. Managing the effectiveness of e-commerce platforms in a pandemic. J. Retail. Consum. Serv. 2021, 58, 102287. [Google Scholar] [CrossRef]
  84. Nagurney, A. Optimization of supply chain networks with inclusion of labor: Applications to COVID-19 pandemic disruptions. Int. J. Prod. Econ. 2021, 235, 108080. [Google Scholar] [CrossRef]
  85. RoiRevolution. Available online: https://www.roirevolution.com/blog/2021/03/coronavirus-and-ecommerce/ (accessed on 9 March 2022).
  86. Statista. Available online: https://www.statista.com/statistics/1168779/romania-b2c-e-commerce-turnover/ (accessed on 19 February 2022).
  87. MerchantPro. Available online: https://www.merchantpro.ro/blog/marketing/viitorul-ecommerce-6-trenduri-pentru-2021-pentru-care-sa-te-pregatesti (accessed on 18 February 2022).
  88. Business Review. Available online: https://business-review.eu/br-exclusive/romanian-market-ready-for-new-delivery-startups-212872 (accessed on 18 February 2022).
  89. Statista. Available online: https://www.statista.com/topics/7418/e-commerce-in-romania/ (accessed on 19 February 2022).
  90. Statista. Available online: https://www.statista.com/forecasts/1197581/e-commerce-revenue-romania-product-category (accessed on 19 February 2022).
  91. Statista. Available online: https://www.statista.com/forecasts/1197667/e-commerce-average-revenue-per-user-romania (accessed on 19 February 2022).
  92. Statista. Available online: https://www.statista.com/forecasts/1197597/e-commerce-users-romania (accessed on 19 February 2022).
  93. Statista. Available online: https://www.statista.com/outlook/dmo/ecommerce/romania#market-users (accessed on 19 February 2022).
  94. Romania-insider.com. Available online: https://www.romania-insider.com/ro-ecommerce-isense-nov-2020 (accessed on 19 February 2022).
  95. Tuya Seo & Digital Marketing. Available online: https://tuyadigital.com/10-digital-marketing-trends-for-2021/ (accessed on 19 February 2022).
  96. Statista. Available online: https://www.statista.com/statistics/1129982/romania-e-commerce-sales-growth-during-covid-19/ (accessed on 19 February 2022).
  97. Intermodal & Logistics. Available online: https://www.intermodal-logistics.ro/ecommerce-in-romania-o-piata-de-56-miliarde-euro-in-2020 (accessed on 18 February 2022).
  98. Eurostat. Available online: https://ec.europa.eu/eurostat/web/main/search?p_p_id=estatsearchportlet_WAR_estatsearchportlet&p_p_lifecycle=1&p_p_state=maximized&p_p_mode=view&_estatsearchportlet_WAR_estatsearchportlet_action=search&_estatsearchportlet_WAR_estatsearchportlet_theme=empty&_estatsearchportlet_WAR_estatsearchportlet_collection=empty&p_auth=A5SemEhK&text=e-commerce (accessed on 19 February 2022).
  99. Statista. Available online: https://www.statista.com/forecasts/1197658/e-commerce-user-penetration-romania (accessed on 19 February 2022).
  100. Statista. Available online: https://www.statista.com/statistics/1018360/enterprises-e-commerce-share-total-turnover-romania/ (accessed on 19 February 2022).
  101. Progresiv. Available online: https://revistaprogresiv.ro/stiri/comertul-online-romania-crestere-de-30-estimata-pentru-2020 (accessed on 17 February 2022).
  102. Go4IT. Available online: https://www.go4it.ro/content/internet/anul-2020-ar-putea-consemna-vanzari-de-6-miliarde-de-euro-in-comertul-electronic-din-romania-19164838/ (accessed on 17 February 2022).
  103. Statista. Available online: https://www.statista.com/statistics/1130355/romania-share-of-online-payments-by-county/ (accessed on 19 February 2022).
  104. Eurostat. Available online: https://ec.europa.eu/eurostat/databrowser/view/isoc_sk_dskl_i/default/table?lang=en (accessed on 18 February 2022).
  105. Internet World Stats. Available online: https://www.internetworldstats.com/stats4.htm#europe (accessed on 18 February 2022).
  106. Faraoni, M.; Rialti, R.; Zollo, L.; Pellicelli, A.C. Exploring e-loyalty antecedents in B2C e-commerce: Empirical results from Italian grocery retailers. Br. Food J. 2019, 121, 574–589. [Google Scholar] [CrossRef]
  107. Florea, N.V.; Duica, A. Managementul Relatiei cu Clientii; Mustang: Bucuresti, Romania, 2019. [Google Scholar]
  108. Mann, M.K.; Liu-Thompkins, Y.; Watson, G.S.; Papelis, Y.E. A Multidisciplinary examination of 3D virtual shopping environments: Effects on consumer perceptual and physiological responses. In Ideas in Marketing: Finding the New and Polishing the Old. Developments in Marketing Science: Proceedings of the Academy of Marketing Science; Kubacki, K., Ed.; Springer: Cham, Switzerland, 2015. [Google Scholar] [CrossRef]
  109. Schneider, G.P. Electronic Commerce, 9th ed.; Cenagage Learning: Boston, MA, USA, 2011. [Google Scholar]
  110. Canzer, B. E-Business: Strategic Thinking and Practice; Houghton Mifflin: Boston, MA, USA, 2006. [Google Scholar]
  111. Stoehr, T. Managing E-Business Projects; Springer: Berlin/Heidelberg, Germany, 2002. [Google Scholar]
  112. Salam, A.F.; Iyer, L.; Palvia, P.; Singh, R. Trust in e-commerce. Commun. ACM 2005, 48, 72–77. [Google Scholar] [CrossRef]
  113. Fang, H.; Zhang, J.; Şensoy, M.; Magnenat-Thalmann, N. Reputation mechanism for e-commerce in virtual reality environments. Electron. Commer. Res. Appl. 2014, 13, 409–422. [Google Scholar] [CrossRef]
  114. Bhatti, H.J.; Alymenko, A. Marketing Intelligence: Strength and Weaknesses of E-Business Marketing (Dissertation). Master’s thesis, School of Business, Engineering and Science, Halmstad University, Halmstad, Sweden, 2017. [Google Scholar]
  115. Papagiannidis, S.; See-To, E.; Bourlakis, M. Virtual test-driving: The impact of simulated products on purchase intention. J. Retail. Consum. Serv. 2014, 21, 877–887. [Google Scholar] [CrossRef]
  116. Stefan, M.C.; Andreiana, V.A.; Panagoret, I. The role of social networks in the evolution of online sales-study case. JOSA 2017, 4, 731–744. [Google Scholar]
  117. Awais, M.; Samin, T. Advanced SWOT analysis of E-commerce. Int. J. Comput. Sci. Issues 2012, 9, 569. [Google Scholar]
  118. Roy, B. Beginners’ Guide to Journalism & Mass Communication; V&S Publisher: New Delhi, India, 2013. [Google Scholar]
  119. Yadav, K.; Sharma, D. SWOT analysis of E-Commerce. Adv. Electron. Electr. Eng. 2014, 4, 638–663. [Google Scholar]
  120. Singh, M.; Waddell, D. E-Business Innovation and Change Management; Idea Group Publishing: London, UK, 2004. [Google Scholar]
  121. Limaye, R.J.; Sauer, M.; Ali, J.; Bernstein, J.; Wahl, B.; Barnhill, A.; Labrique, A. Building trust while influencing online COVID-19 content in the social media world. Lancet Digit. Health 2020, 2, e277–e278. [Google Scholar] [CrossRef]
  122. Fisher, D.M.; Chrispin, B.; Fisher, S.A. An e-commerce SWOT analysis. In Proceedings of the American Society of Business and Behavioral Sciences, Las Vegas, NV, USA, 17–21 February 2000; pp. 1–8. [Google Scholar]
  123. Hoffman, D.L.; Novak, T.P.; Peralta, M. Building consumer trust online. Commun. ACM 1999, 42, 80–85. [Google Scholar] [CrossRef]
  124. Hossin, M.A.; Sarker, M.N.I.; Xiaohua, Y.; Frimpong, A.N.K. Development dimensions of e-commerce in Bangladesh: Scope, challenges and threats. In Proceedings of the 2018 International Conference on Information Management & Management Science, Chengdu, China, 25–27 August 2018; pp. 42–47. [Google Scholar]
  125. Napier, H.A.; Rivers, O.N.; Wagner, S.W.; Napier, J.B. Creating a Winning E-Business, 2nd ed.; Course Technology Inc.: Boston, MA, USA, 2006. [Google Scholar]
  126. Doosty, H.G.G.; Fathian, M. Combination SWOT-AHP analysis for using blockchain in e-commerce. J. Econ. Adm. Sci. 2020, 3, 237–253. [Google Scholar]
  127. Boysen, N.; de Koster, R.; Weidinger, F. Warehousing in the e-commerce era: A survey. Eur. J. Oper. Res. 2019, 277, 396–411. [Google Scholar] [CrossRef]
  128. Martínez-Navarro, J.; Bigné, E.; Guixeres, J.; Alcañiz, M.; Torrecilla, C. The influence of virtual reality in e-commerce. J. Bus. Res. 2019, 100, 475–482. [Google Scholar] [CrossRef]
  129. Morganti, E.; Seidel, S.; Blanquart, C.; Dablanc, L.; Lenz, B. The impact of e-commerce on final deliveries: Alternative parcel delivery services in France and Germany. Transp. Res. Procedia 2014, 4, 178–190. [Google Scholar] [CrossRef] [Green Version]
  130. Synthesio an Ipsos Company. The Growth & Expansion of Online Retail: COVID-19 & Beyond Online Shopping. Insights from Synthesio Social Data & Ipsos Online Communities. 2020. Available online: https://www.ipsos.com/sites/default/files/ct/publication/documents/2020-10/covid_ecommerce_report.pdf (accessed on 8 March 2022).
  131. Watt, D. E-Business Implementation-A Guide to Web Services, EAI, BPI, E-Commerce, Content Management, Portals, and Supporting Technologies; Butterworth-Heinemann: Oxford, UK, 2002. [Google Scholar]
  132. Romagnoli, V.; Aigner, J.F.; Berlinghof, T.; Bey, N.; Rödger, J.; Pätz, C. Identification and Assessment of Opportunities and Threats for the Circular Economy Arising from E-commerce; Orveillon, G., Garbarino, E., Saveyn, H., Eds.; Publications Office of the European Union: Luxembourg, 2020. [Google Scholar] [CrossRef]
  133. EcommerceDB. The eCommerce Market in Romania. Available online: https://ecommercedb.com/en/markets/ro/all (accessed on 20 June 2022).
  134. Statista. Available online: https://www.statista.com/outlook/dmo/ecommerce/romania (accessed on 20 June 2022).
  135. Deloitte. Future of E-Commerce: Uncovering Innovation. Available online: https://www2.deloitte.com/content/dam/Deloitte/in/Documents/technology-media-telecommunications/in-tmt-future-of-e-commerce-noexp.pdf. (accessed on 5 March 2022).
  136. Statista. Available online: https://www.statista.com/statistics/435928/online-shopping-e-commerce-spending-per-capita-by-country-europe/ (accessed on 19 February 2022).
  137. Eurostat. Available online: https://ec.europa.eu/eurostat/statistics-explained/index.php?title=E-commerce_statistics_for_individuals#Most_popular_online_purchases (accessed on 19 February 2022).
  138. Duch-Brown, N.; Martens, B. The European Digital Single Market: Its Role in Economic Activity in the EU Institute for Prospective Technological Studies. Digital Economy Working Paper 2015/17. JRC98723. Available online: https://ec.europa.eu/jrc/sites/jrcsh/files/JRC98723.pdf (accessed on 19 February 2022).
  139. Statista. Available online: https://www.statista.com/statistics/1018554/share-of-companies-selling-online-eu28-countries/ (accessed on 19 February 2022).
  140. Eurostat. Available online: https://ec.europa.eu/eurostat/databrowser/view/isoc_bdek_smi/default/table?lang=en (accessed on 19 February 2022).
  141. Statista. Available online: https://www.statista.com/statistics/1020930/share-of-companies-selling-online-romania/ (accessed on 19 February 2022).
  142. Eurostat. Available online: https://ec.europa.eu/eurostat/databrowser/view/isoc_ec_eseln2/default/table?lang=en (accessed on 19 February 2022).
  143. Internet live stats. Available online: https://www.internetlivestats.com/total-number-of-websites/ (accessed on 15 February 2022).
  144. Statista. Available online: https://www.statista.com/statistics/270830/most-popular-websites-worldwide/ (accessed on 19 February 2022).
  145. Eurostat. Available online: https://ec.europa.eu/eurostat/databrowser/view/isoc_ec_ibuy/default/table?lang=en (accessed on 19 February 2022).
  146. Eurostat. Available online: https://ec.europa.eu/eurostat/databrowser/view/isoc_ec_evaln2/default/table?lang=en (accessed on 19 February 2022).
  147. Eurostat. Available online: https://ec.europa.eu/eurostat/databrowser/view/isoc_ciweb/default/table?lang=en (accessed on 19 February 2022).
  148. Parameswar, N.; Dhir, S. Delhivery: Fulfilling e-commerce delivery. Asian J. Manag. Cases 2022. [Google Scholar] [CrossRef]
  149. Alkhalifah, A.; Alorini, F.; Alturki, R. Enhancement of e-commerce service by designing last mile delivery platform. Comput. Syst. Sci. Eng. 2022, 42, 49–67. [Google Scholar] [CrossRef]
  150. Scutariu, A.-L.; Șuşu, Ș.; Huidumac-Petrescu, C.-E.; Gogonea, R.-M. A cluster analysis concerning the behavior of enterprises with e-commerce activity in the context of the COVID-19 pandemic. J. Theor. Appl. Electron. Commer. Res. 2022, 17, 47–68. [Google Scholar] [CrossRef]
  151. Li, J.; Xu, C. Evolutionary game analysis of e-commerce intellectual property social cogovernance with collective organizations. Complexity 2022, 2022, 2380321. [Google Scholar] [CrossRef]
  152. Chen, M.; Bashir, R. Role of e-commerce and resource utilization for sustainable business development: Goal of economic recovery after COVID-19. Econ. Chang. Restruct. 2022, 1–23. [Google Scholar] [CrossRef]
  153. Zhao, B.; Lyu, X.; Qi, N. Construction and optimization of transboundary business financial credit network in the era of 5G communication. Wirel. Commun. Mob. Comput. 2022, 2022, 6481340. [Google Scholar] [CrossRef]
Figure 1. Simulated values for e-commerce at RO level (2022–2026).
Electronics 11 02295 g001
Table 1. SWOT analysis.
StrengthsWeaknesses
-provide more appealing shopping experiences than traditional environments [105];-evolves a transactional (asking information, buying just occasionally), or relational (buying many times, writing some opinion about its satisfaction or dissatisfaction, asking questions, benefit some bonuses, obtaining value due to its loyalty) link [106,107];
-easy to apply, increase profits for organizations, sales and decrease costs [108];-tangibility is missing for customers [106];
-offers to consumers to participate in social-media-enabled commercial activities such as customer review, sharing, recommendations, may see product information posted by their friends on Facebook and decide to purchase the product later; social commerce consists of various facets including people, management, technology, and information [11]; -using technologies, some products cannot be traded or delivered in certain zones [106];
-save time and money for customers and employees [109];-using this new form of buying, supposes having e-skills, Internet access, and an electronic device to order [109];
-assumes some consumer dependence on the Web vendor [110];-security of using the online payment to buy products [111];
-more products than physical stores in settings similar to e-commerce; (ii) the potential integration of other communication tools, such as traditional advertising, online media, and eWOM; and (iii) real-time interaction with products, the ability to view them realistically and to request personalized information likely to influence purchasing decisions [112,113];-Fake websites and mobile apps [114];
-satisfy the consumer’s needs faster and cheaper, using information, images, and advertising [115,116];-abusive use of customers’ financial and personal data [117];
-helped organizations to get to customers at large distances, having a relationship of 24 h a day and improving companies’ image [118];-high costs for products delivery, longer terms for products delivery [119];
-it involves some risks, that is why e-commerce is suffering due to the lack of consumer trust and fear of paying online [120,121];-lack of customized services for customers assistance [122];
-the organizations can offer customized goods [123];-lack of systems standardization in e-commerce [124];
-improve relationships along the supply chain due to the warehousing. Even if the orders are small from e-commerce, the relationship exists [125];-difficulty in managing the return products process [126].
-realistic images can display content or video in 360° or three-dimensional (3D) digital representation [127];
-offer home delivery and offer a wide variety of products [128];
-using new technologies, the companies may offer products and services across local, national, and international boundaries in real-time and at low cost [129];
-using the website for buying/selling online helps achieve loyalty in a virtual, digital, and electronic context, such as the world of e-commerce [92].
OpportunitiesThreats
-automation of data analysis generates an increased availability of data on purchases made [130];-competition (the fact that the launch of an online business is within reach of anyone is an adhering, especially to the business sector and not to the e-commerce industry as a whole) [105,125];
-e-commerce is fast and efficient, overcoming geographical spatiality barriers;-frauds that may occur at the level of online payments [131];
-excellent availability (24/7/365);-security and protection of personal data at the level of purchasers [114];
-low level of e-skills and working with new technologies [119];
-low degree of endowment with PCs [117];
-pandemic and economic crises which influence the income level [124].
-digital advertising contributes to promoting products and businesses to a much wider audience [132].
Table 2. Data referring to e-commerce and its influencing factors on Romania level, average EU-27 level, 4gc.
YearE-Commerce SalesInternet Purchases by IndividualsDigital Single Market—Promoting E-Commerce for Individuals
ROEU-27DKNLDENOBGROEU-27DKNLDENOBGROEU-27DKNLDENOBG
2011413231920313429575354575639706964737
2012514261822344331605255626541736565769
20139142713222555336555605688437769697312
2014715261323256636665961601010467871707717
2015816261725266838675964611211497971737618
2016718281626275841716364611112518274747817
20178172916242971144696866621116548079757718
20189173217202861346737068641320568480777921
201912173422182771549747071671423608481798222
202018183819182281751767173681538648987838531
Share of e-commerce in total turnover of enterprisesShare of enterprises that sell onlineWebsites and functionalities
201131417111518341323192031334688982817845
201241517131619451426182234436708984827949
201361417131719591427132225542729284847947
201461517121720671526132325644739190867948
201581720131824681726172526645749290878048
201671623141821671828162627542769389898051
201781823151925881829162429745769586878051
201891723151826791732172028644769694877851
20191018241619277101833182129747779492887851
20201119251720288122034202231846779384887952
Source: [135,136,137,138,139].
Table 3. Data about e-commerce and its influence variable at the Romanian level.
YearE-Commerce Sales
(Y)
Internet
Purchases by
Individuals
(X1)
Digital Single Market—Promoting E-Commerce
for Individuals
(X2)
Share of
E-Commerce in
Total Turnover of Enterprises
(X3)
Share of
Enterprises That Sell online
(X4)
Websites and Functionalities
(X5)
20114463434
20125354536
20139586942
201476106744
201588118845
201678127742
2017811168845
2018913209944
2019121523101047
2020181738111246
Source: [99,137,139,141,144,145,146,147].
Table 4. Correlation matrix.
VariableYX1X2X3X4X5
Y1
X10.8551
X20.940.941
X30.860.950.881
X40.930.850.850.921
X50.700.770.660.900.851
Table 5. Pearson coefficient.
Multiple R0.99
R Square0.98
Adjusted R Square0.96
Standard Error0.69
Observations10
Table 6. Summary output for OLS regression function- RO level.
CoefficientsStandard Errort Statp-ValueLower 95%
Intercept0.205.200.040.96−14.22
X1−0.420.28−1.520.20−1.21
X20.370.093.770.010.09
X3−0.030.66−0.050.96−1.89
X41.050.343.040.030.09
X5−0.020.18−0.160.87−0.54
Table 7. Forecasted values using Time Series Analysis.
YearActual ValuesForecasted Values
0.10.20.30.40.50.60.70.80.9
201144.004.004.004.004.004.004.004.004.00
201254.004.004.004.004.004.004.004.004.00
201394.104.204.304.404.504.604.704.804.90
201474.595.165.716.246.757.247.718.168.59
201584.835.526.096.546.877.097.217.237.15
201675.146.026.667.127.437.637.767.847.90
201785.336.216.767.077.217.257.227.167.09
201895.596.577.137.447.607.707.767.837.90
2019125.937.057.698.068.308.488.638.768.89
2020186.548.048.989.6410.1521.8210.9811.3511.68
MSE (total) 230.88167.01133.22113.49100.5591.1383.8177.9773.39
Table 8. Determining Bias, MAD, MSE, MAPE, and SE using Time Series Analysis.
Forecasted Values (Alpha)
0.10.20.30.40.50.60.70.80.9
Next period7.6910.0311.6912.9814.0715.0315.8916.6717.36
Bias (average)4.103.352.842.492.232.041.881.751.65
MAD (average)4.103.352.842.522.332.232.212.202.20
MSE (average)25.6518.5514.8012.6111.1710.129.318.668.15
MAPE
(average)
0.400.320.260.230.210.200.210.210.21
SE5.744.884.364.023.793.603.463.333.23
Note: Bias—the mean forecast error, MAPE—Mean absolute percentage error, MAD—Mean absolute deviation, MSE—Mean squared error, SE—Standard error.
Table 9. Determining Bias, MAD, MSE, MAPE, and SE for alpha 0.9.
Alpha0.899
DataError Analysis
PeriodActual
Values
ForecastErrorAbsoluteSquared% Error
20114.004.00
20125.004.001.001.001.000.20
20139.004.904.104.1016.810.45
20147.008.59−1.591.592.520.22
20158.007.150.840.840.700.10
20167.007.91−0.910.910.830.13
20178.007.090.900.900.820.11
20189.007.901.091.091.180.12
201912.008.893.103.109.660.25
202018.0011.686.316.3139.820.35
Total14.8519.8673.391.96
Average1.652.208.150.21
BiasMADMSEMAPE
SE3.23
202117.36
Table 10. Data necessary for establishing the QM for the Windows model.
2020YX1X2X3X4X5
RO181738111246
average for EU-27185164192077
average for 4gc247286232786
Table 11. Linear programming results.
VariableStatusValue
X1NonBasic0
X2Basic9.70
X3NonBasic0
X4NonBasic0
X5Basic0.88
Optimal value (Z) 21.17
Table 12. Ranging constraints.
VariableValueReduced CostOriginal Val.Lower BoundUpper Bound
X10.000.523.00-Infinity3.52
X29.700.002.002.002.42
X30.000.002.00-Infinity2.00
X40.000.002.00-Infinity2.00
X50.880.002.002.002.00
ConstraintDual ValueSlack/SurplusOriginal Val.Lower BoundUpper Bound
Constraint 11.170.0018.0017.7321.47
Constraint 20.000.0024.0020.1124.35
Table 13. Forecasting e-commerce in Romania (2011–2026).
YearE-Commerce Values at the RO Level
20114
20125
20139
20147
20158
20167
20178
20189
201912
202018
202121
202222.54
202325.08
202430.63
202530.175
202632.72
Publisher’s Note: MDPI stays neutral with regard to jurisdictional claims in published maps and institutional affiliations.

