Article

Optimal Distribution Coefficients of Energy Resources in Frequency Stability of Hybrid Microgrids Connected to the Power System

1
Department of Electrical and Computer Engineering, Tarbiat Modares University, Tehran 1193653471, Iran
2
Department of Information and Systems Engineering, Concordia University, Montreal, QC H3G 1M8, Canada
3
Department of Energy Technology, Aalborg University, 9100 Aalborg, Denmark
4
School of Electrical Engineering Computing and Mathematical Sciences, Curtin University, Perth, WA 1987, Australia
*
Author to whom correspondence should be addressed.
Electronics 2021, 10(13), 1591; https://doi.org/10.3390/electronics10131591
Submission received: 24 May 2021 / Revised: 26 June 2021 / Accepted: 28 June 2021 / Published: 1 July 2021
(This article belongs to the Section Industrial Electronics)

Abstract

:
The continuous stability of hybrid microgrids (MGs) has been recently proposed as a critical topic, due to the ever-increasing growth of renewable energy sources (RESs) in low-inertia power systems. However, the stochastic and intermittent nature of RESs poses serious challenges for the stability and frequency regulation of MGs. In this regard, frequency control ancillary services (FCAS) can be introduced to alleviate the transient effects during substantial variations in the operating point and the separation from main power grids. In this paper, an efficient scheme is introduced to create a coordination among distributed energy resources (DERs), including combined heat and power, diesel engine generator, wind turbine generators, and photovoltaic panels. In this scheme, the frequency regulation signal is assigned to DERs based on several distribution coefficients, which are calculated through conducting a multi-objective optimization problem in the MATLAB environment. A meta-heuristic approach, known as the artificial bee colony algorithm, is deployed to determine optimal solutions. To prove the efficiency of the proposed scheme, the design is implemented on a hybrid MG. Various operational conditions which render the system prone to experience frequency fluctuation, including switching operation, load disturbance, and reduction in the total inertia of hybrid microgrids, are studied in PSCAD software. Simulation results demonstrate that this optimal control scheme can yield a more satisfactory performance in the presence of grid-following and grid-forming resources during different operational conditions.

1. Introduction

Carbon emissions and energy sustainability are significant challenges that can be addressed by proper penetration plans of renewable energy sources (RESs) in modern power systems. The deployment of power electronic interfaces generation (PEIG) has proposed a new concept related to low-inertia systems, that can affect the system stability in both islanded and grid-connected modes [1,2,3,4,5]. The integration of various technologies, current/voltage control loops, and energy management methods represent several solutions which have been recently introduced [6,7,8]. However, the main concern of operating MGs is frequency stability and introducing frequency ancillary service programs [9]. Both frequency and voltage oscillations can be alleviated by traditional generation units in grid-connected mode [10,11]; however, the aforementioned terms should be mitigated in islanded mode, based on intelligent control frameworks. An unusual frequency nadir, excessive rate of change of frequency (RoCoF), and catastrophic instability are examples of recent challenges in islanded MGs that stemmed from load/generation imbalance [12,13,14,15]. As the penetration of RESs into the modern power system is steadily increasing, the creation of a coordination between RESs appears to be a vital issue.
Many studies have focused on the effects of high penetrated RESs on power systems [16,17,18,19]. For example, ultra-capacitors and batteries are able to improve the transient stability of hybrid MGs; however, in a conventional power system with a high penetration level of distributed generation (DG), monitoring the location of the disturbance causes this storage-based solution to be costly [20]. Furthermore, several studies have introduced innovative control strategies to provide efficient MG stability, in the case of islanded mode. Numerous controllers including, but not limited to, intelligent control [21], adaptive control [22], robust control [23], and model predictive control (MPC) [24], have been proposed in order to create a smooth frequency excursion. For effective collaboration of electric vehicles in the frequency support, authors in [25] have proposed a general type-II fuzzy system. It is important to note that the specific mentioned paper has only focused on the controller design, without detailing the different renewable energy sources (RESs). One of the prominent investigations among MG frequency support provision is the employment of generalized droop controllers (GDC) in order to mitigate frequency oscillations effectively. In [26], as the GDC is highly sensitive to MG configuration, authors have considered the adaptive neuro-fuzzy inference system (ANFIS) in order to remove any dependency.
Among DGs, combined heat and power (CHP) and wind turbine generators (WTGs) have recently drawn much attention in the operation of MGs. The output of CHP can be planned as a fast generation unit during a wide range of operations in the islanded MGs. These types of power generation units are generally equipped with a ramping capability, which renders them more advantageous for low-inertia MGs [27]. As a practical example, authors in [28] have proposed a practical model for CHP in order to reduce frequency deviation and improve the situation of the systems’ stability. It is notable that using other RESs along with CHP can also improve the frequency deviation and voltage variations considerably. Furthermore, WTGs have received a great amount of consideration in recent years, due to the modern control mechanism and capacity to improve frequency deviation by shifting to de-loaded areas [29]. There are a number of techniques for deploying the primary frequency regulation of wind energy conversion systems (WECSs). In [30] and [31], several control methods are provided to address the involvement of WECSs in providing frequency regulation services. The frequency control scheme is a practical integration of inertial control and kinetic energy in rotational elements [32]. Furthermore, photovoltaic (PV) panels have been widely used in the frequency improvement scheme of hybrid MGs, with the help of their inverter-based structures [33,34,35]. However, the optimal contribution of PV array, along with other DERs, has not been studied in order to improve the frequency excursion of islanded MGs during emergency conditions. Recent studies show that the intelligent coordination between RESs has been neglected in a great number of research papers. Nonetheless, considering the distribution coefficients of DERs may provide this capability to alleviate the frequency excursion effectively.
In this paper, an optimal design is proposed for involving different DERs, including CHP, WTG, diesel engine generator (DEG), and photovoltaic panels, in the frequency control of a hybrid MG. Firstly, the regulation signal is distributed among DERs by related distribution coefficients. Following this, the frequency response characteristics of the MG are defined, according to a multi-objective function. In fact, this objective function is influenced by the provided coordination scheme for allocating the regulation signal to DERs. Finally, distribution coefficients that are associated with the DERs are optimized by a meta-heuristic algorithm, known as the artificial bee colony (ABC) algorithm, in the case of load disturbance, switching operation, and changes in MG inertia. Numerical simulations demonstrate that the proposed coordinated control can ensure a stable performance of our islanded MG, and achieve a favorable regulation performance.

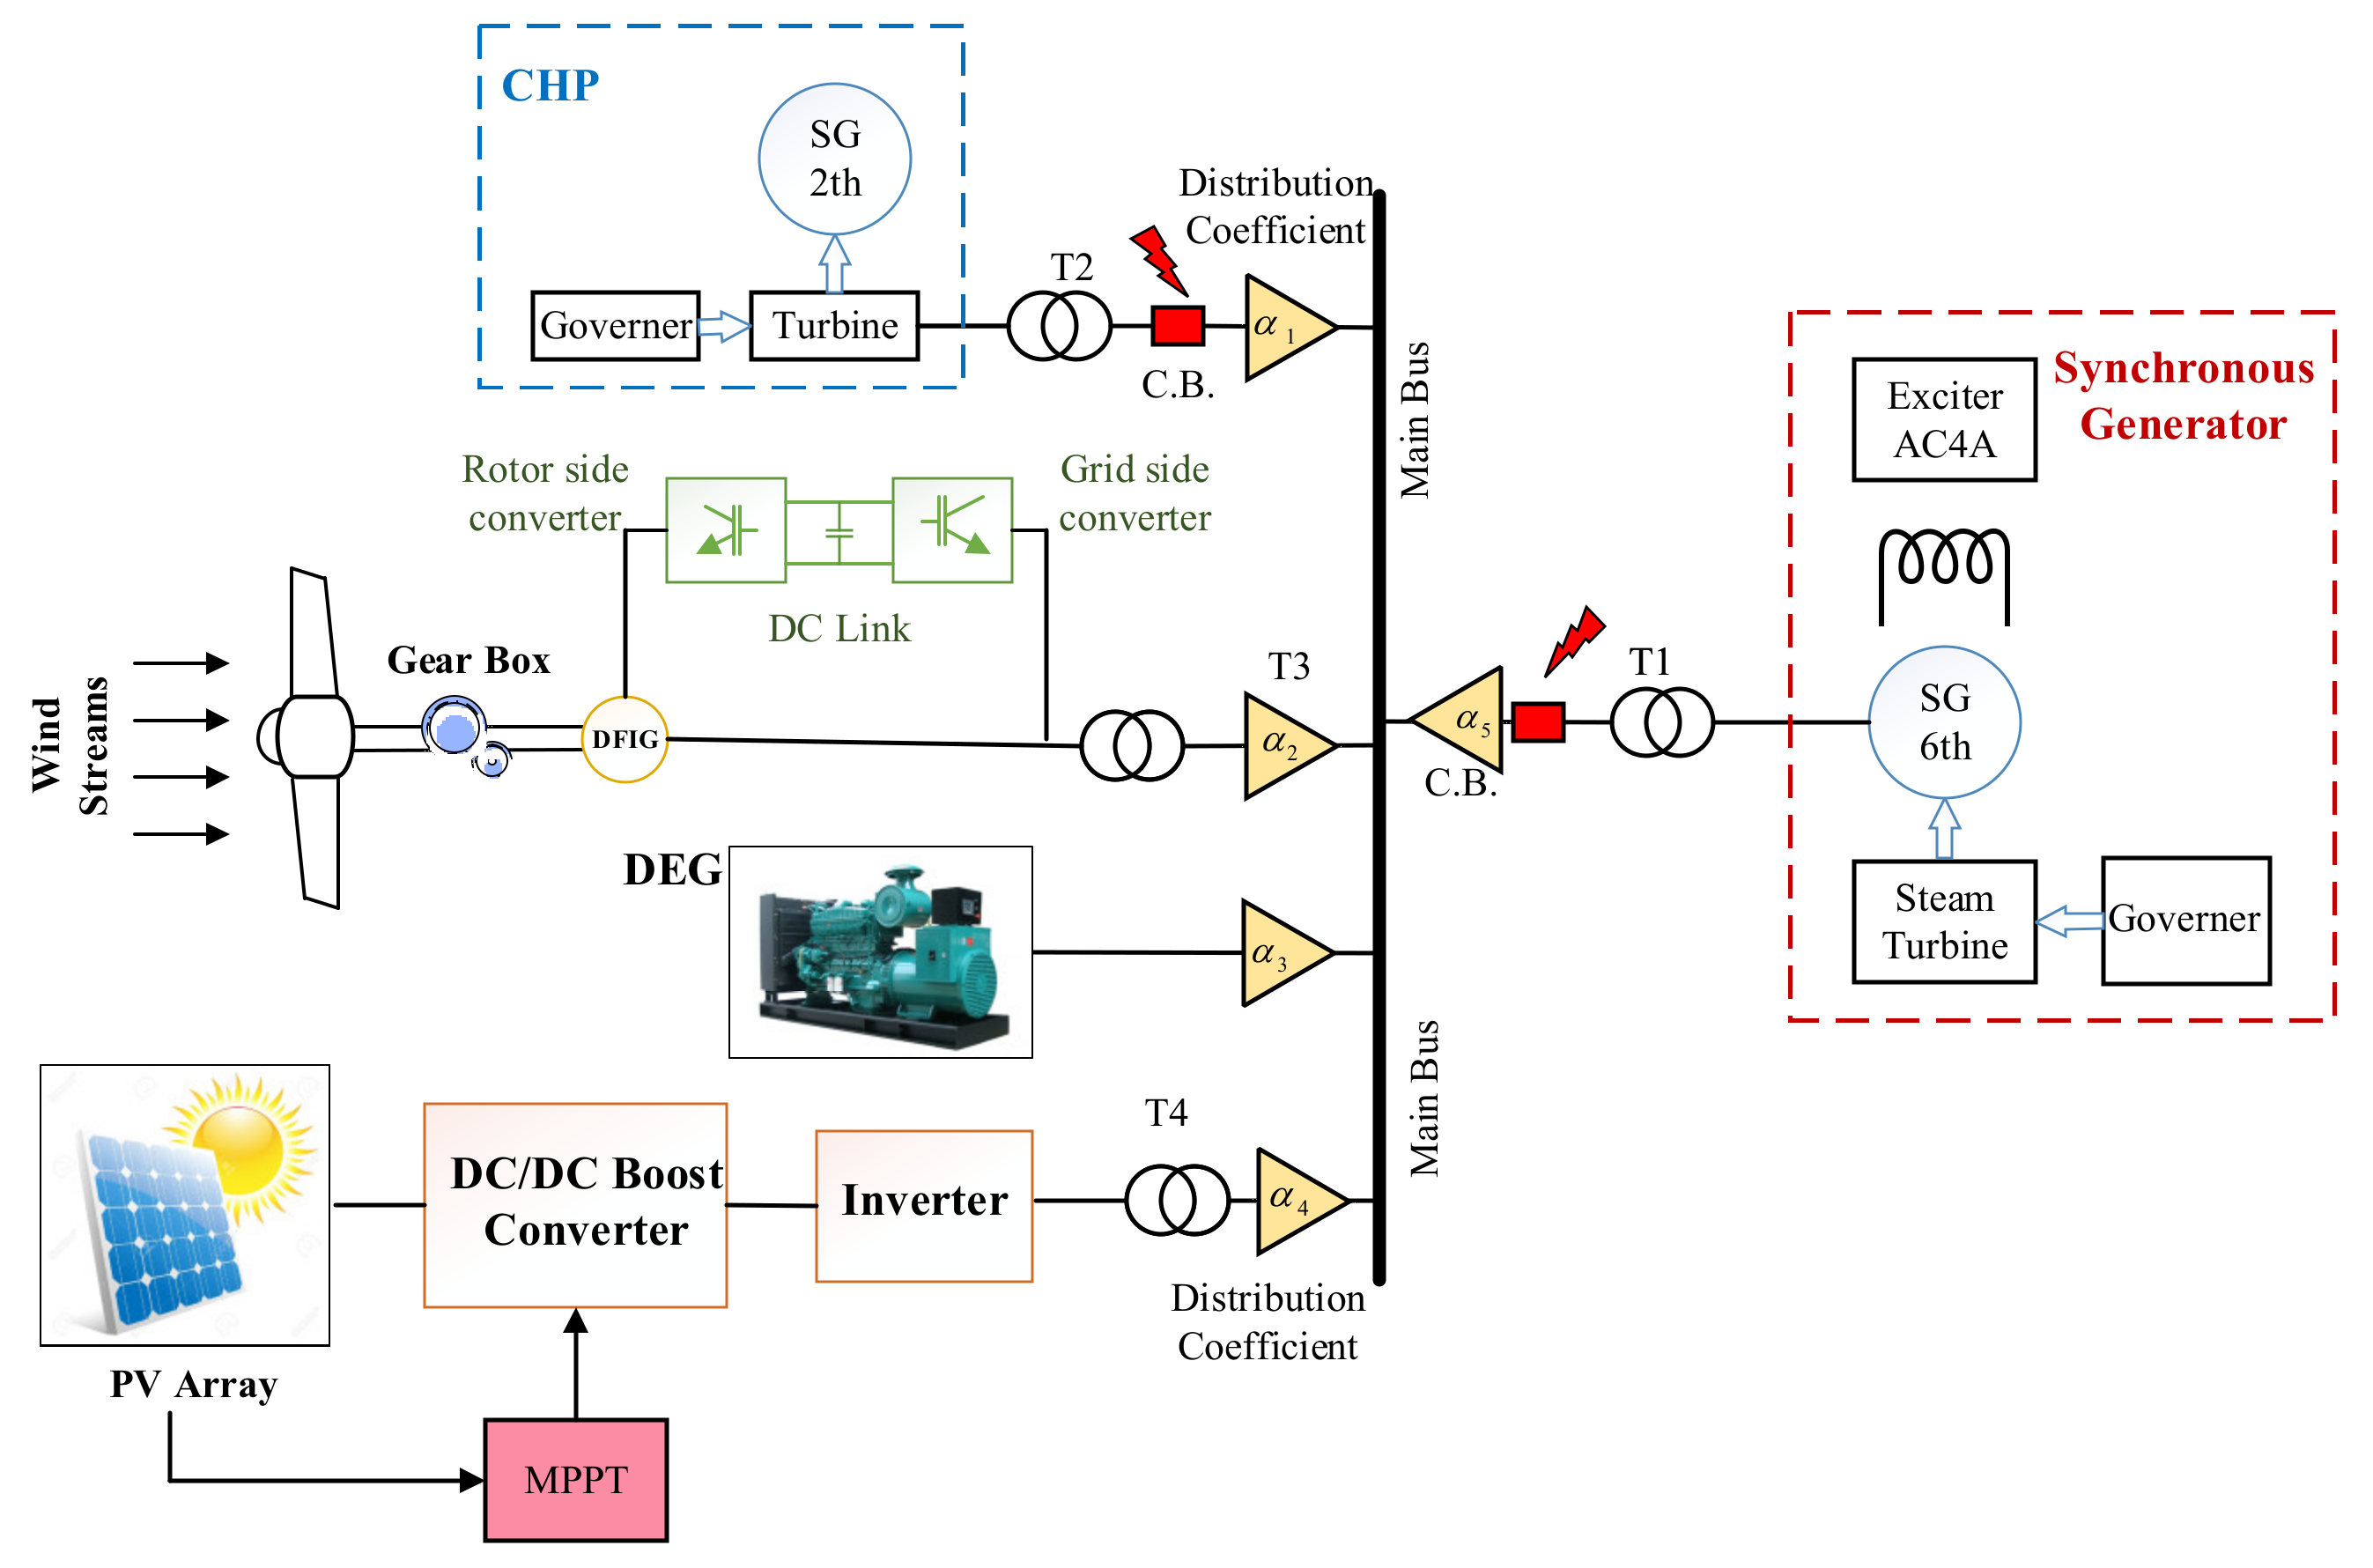
2. System Modeling and Configuration

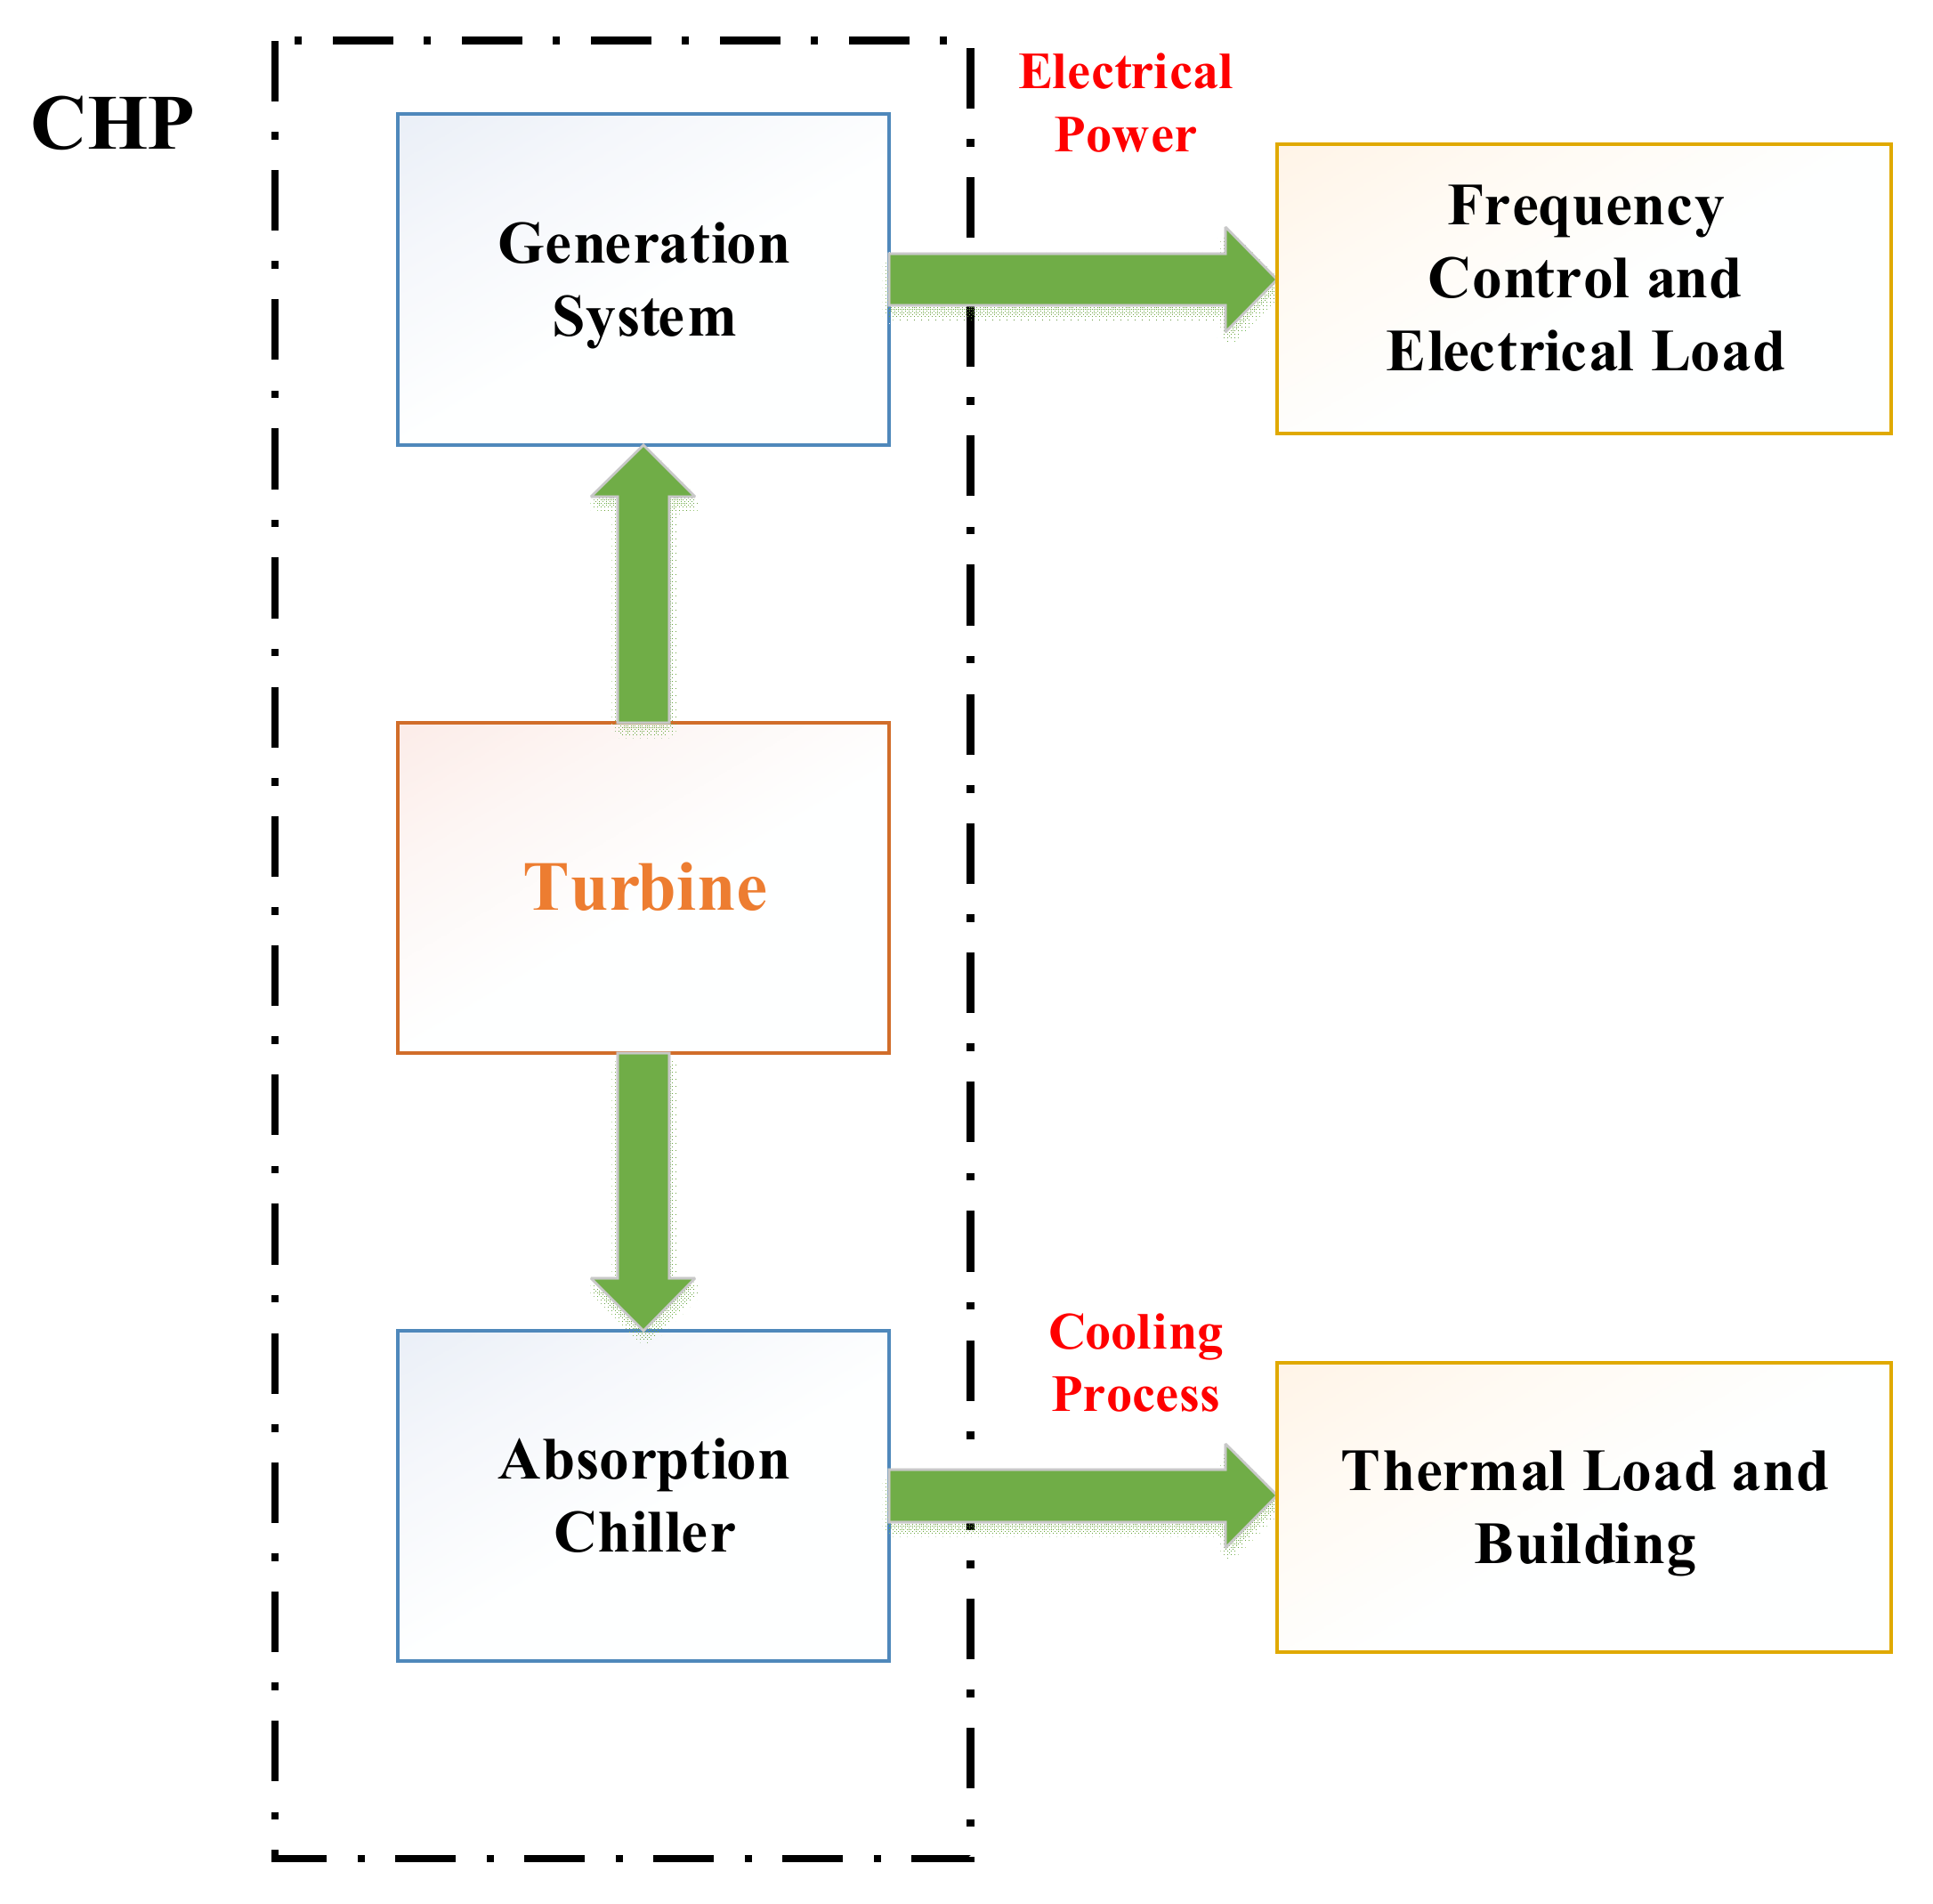
2.1. Combined Heat and Power (CHP)

Recently, the deployment of CHP units has received a high level of attention in microgrid applications. The primary reason is that the overall efficiency of hybrid MGs can be improved by taking advantage of CHP units in a generation plan.
In the case of MG operation, the fast performance of CHP can convert this unit into a highly reliable sources that can be dispatched during multistep disturbances and following disruptive events. Moreover, CHP units can effectively participate in low-inertia power systems and recycle generated heat to meet the requirements of heating loads in different industries, shown in Figure 1. In our paper, this power generation unit is defined as a frequency control ancillary service (FCAS), which compensates for residential or industrial loads during a generation imbalance. One practical application of CHP in modern MG structures is the fast frequency regulation in the presence of other DGs. It is often argued that there are two operating modes in microgrid operation, i.e., grid-connected mode and islanded mode. The CHP can generate a predefined value of active power in the grid-connected mode, while in the islanded mode, it could provide a regulation scheme to maintain the frequency excursion in permissible ranges during operation. As above mentioned, many works have studied its prime mover structures, i.e., turbine and governor models, to consider all aspects of dynamic behaviors of low-inertia power systems.
In general, CHP output regulation and power system frequency adjustment are conducted by turbine and governor control mechanisms, illustrated in Figure 2. According to this figure, the PI controller operates as a speed control loop, in which its parameters, including the proportional and integral time constants, represent the governor gain ( 1 / R ) and the damping time ( D t ), respectively. All parameters related to this CHP unit are listed in Table 1 [36].

2.2. Synchronous Generator Model

Power system stability studies require an appropriate and detailed model of the synchronous machines. Therefore, the dynamics of the field circuit, excitation system, and rotor damper circuits can be presented accurately (subject to data availability). With considerate progress in different computational tools, there is no need to simplify models for specific types of frequency studies. For example, rather than simplifying models, which generally ignore fast dynamics, singular perturbation techniques can be introduced to distinguish between fast and slow dynamics, and accurately estimate the fast dynamics to increase computational efficiency of long-term dynamic behaviors. In this paper, the sixth order model is considered. This model includes four windings on the q-axis and the d-axis. In small signal dynamic models, the synchronous machine is described using six equations, and this model has the capability to present a desired stability study. Finally, all parameters used in the sixth model of SG are illustrated in Table 2 [37].
T do dE q dt = E q ( X d X d ) I d X d X d X d X ls 2 ( ψ 1 d + X d X ls I d + E q + E fd
T do d ψ 1 d dt = ψ 1 d + E q X d X ls I d
T qo dE d dt = E d + ( X q X q ) I q X q X q X q X ls 2 ( ψ 2 q + X q X ls I q + E d
T qo d ψ 2 q dt = ψ 2 q + E d X q X ls I q
d δ dt = ω ω s
2 H ω s d ω dt = T M X d X ls X d X ls E q I q X d X d X d X ls ψ 1 d I q X q X ls X q X ls E d I d X q X q X q X ls ψ 2 q I d X q X d I d   I q T FW

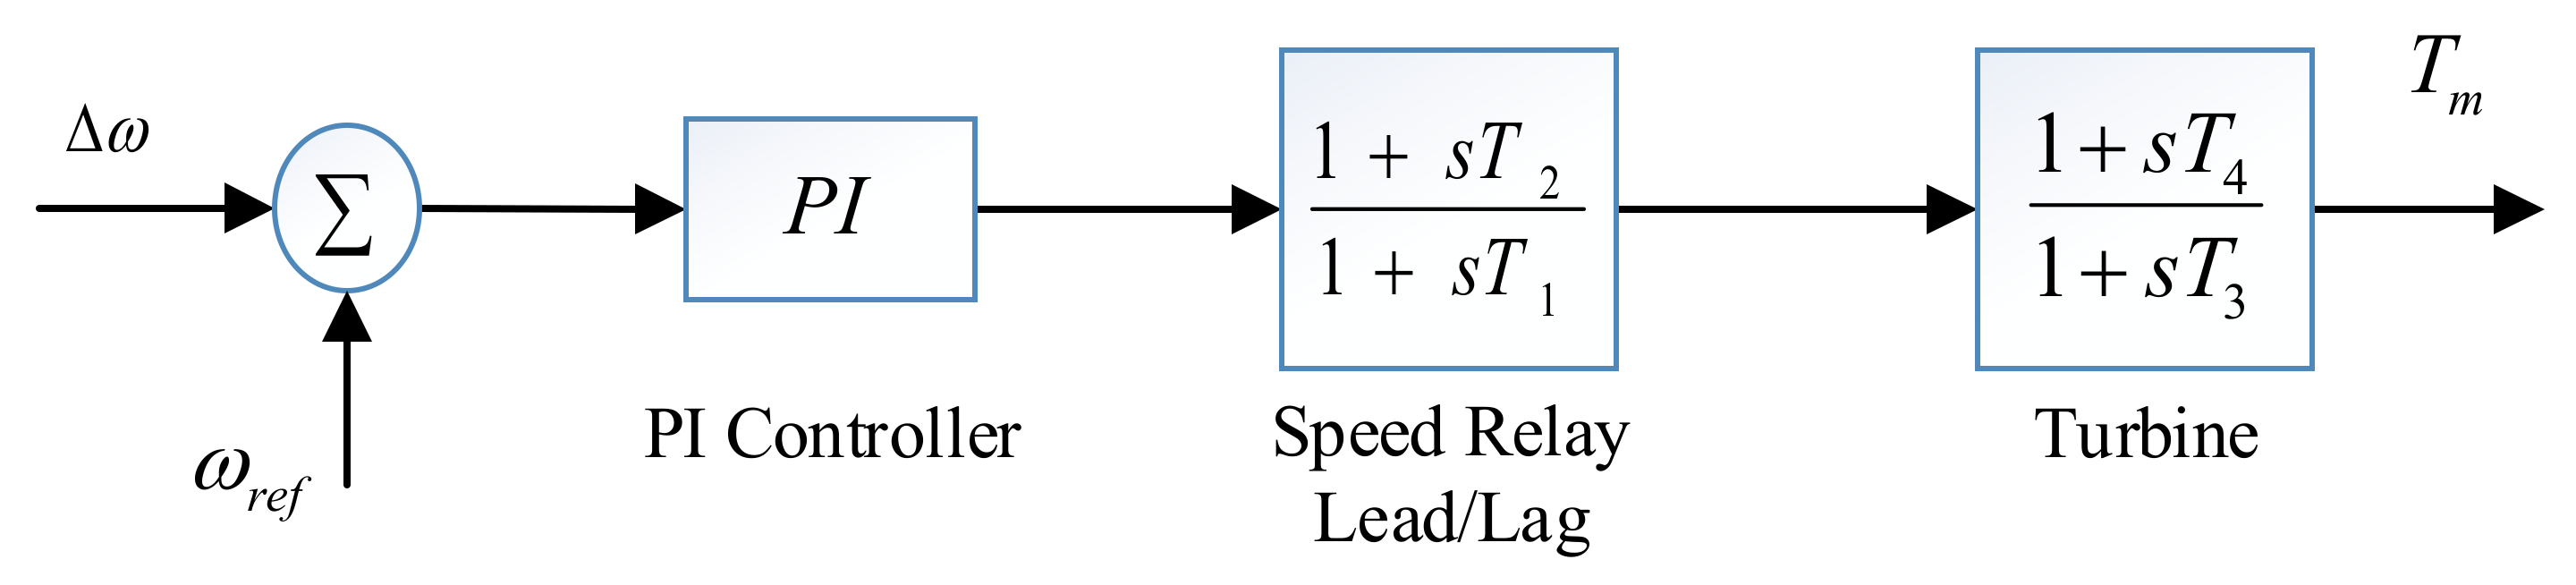
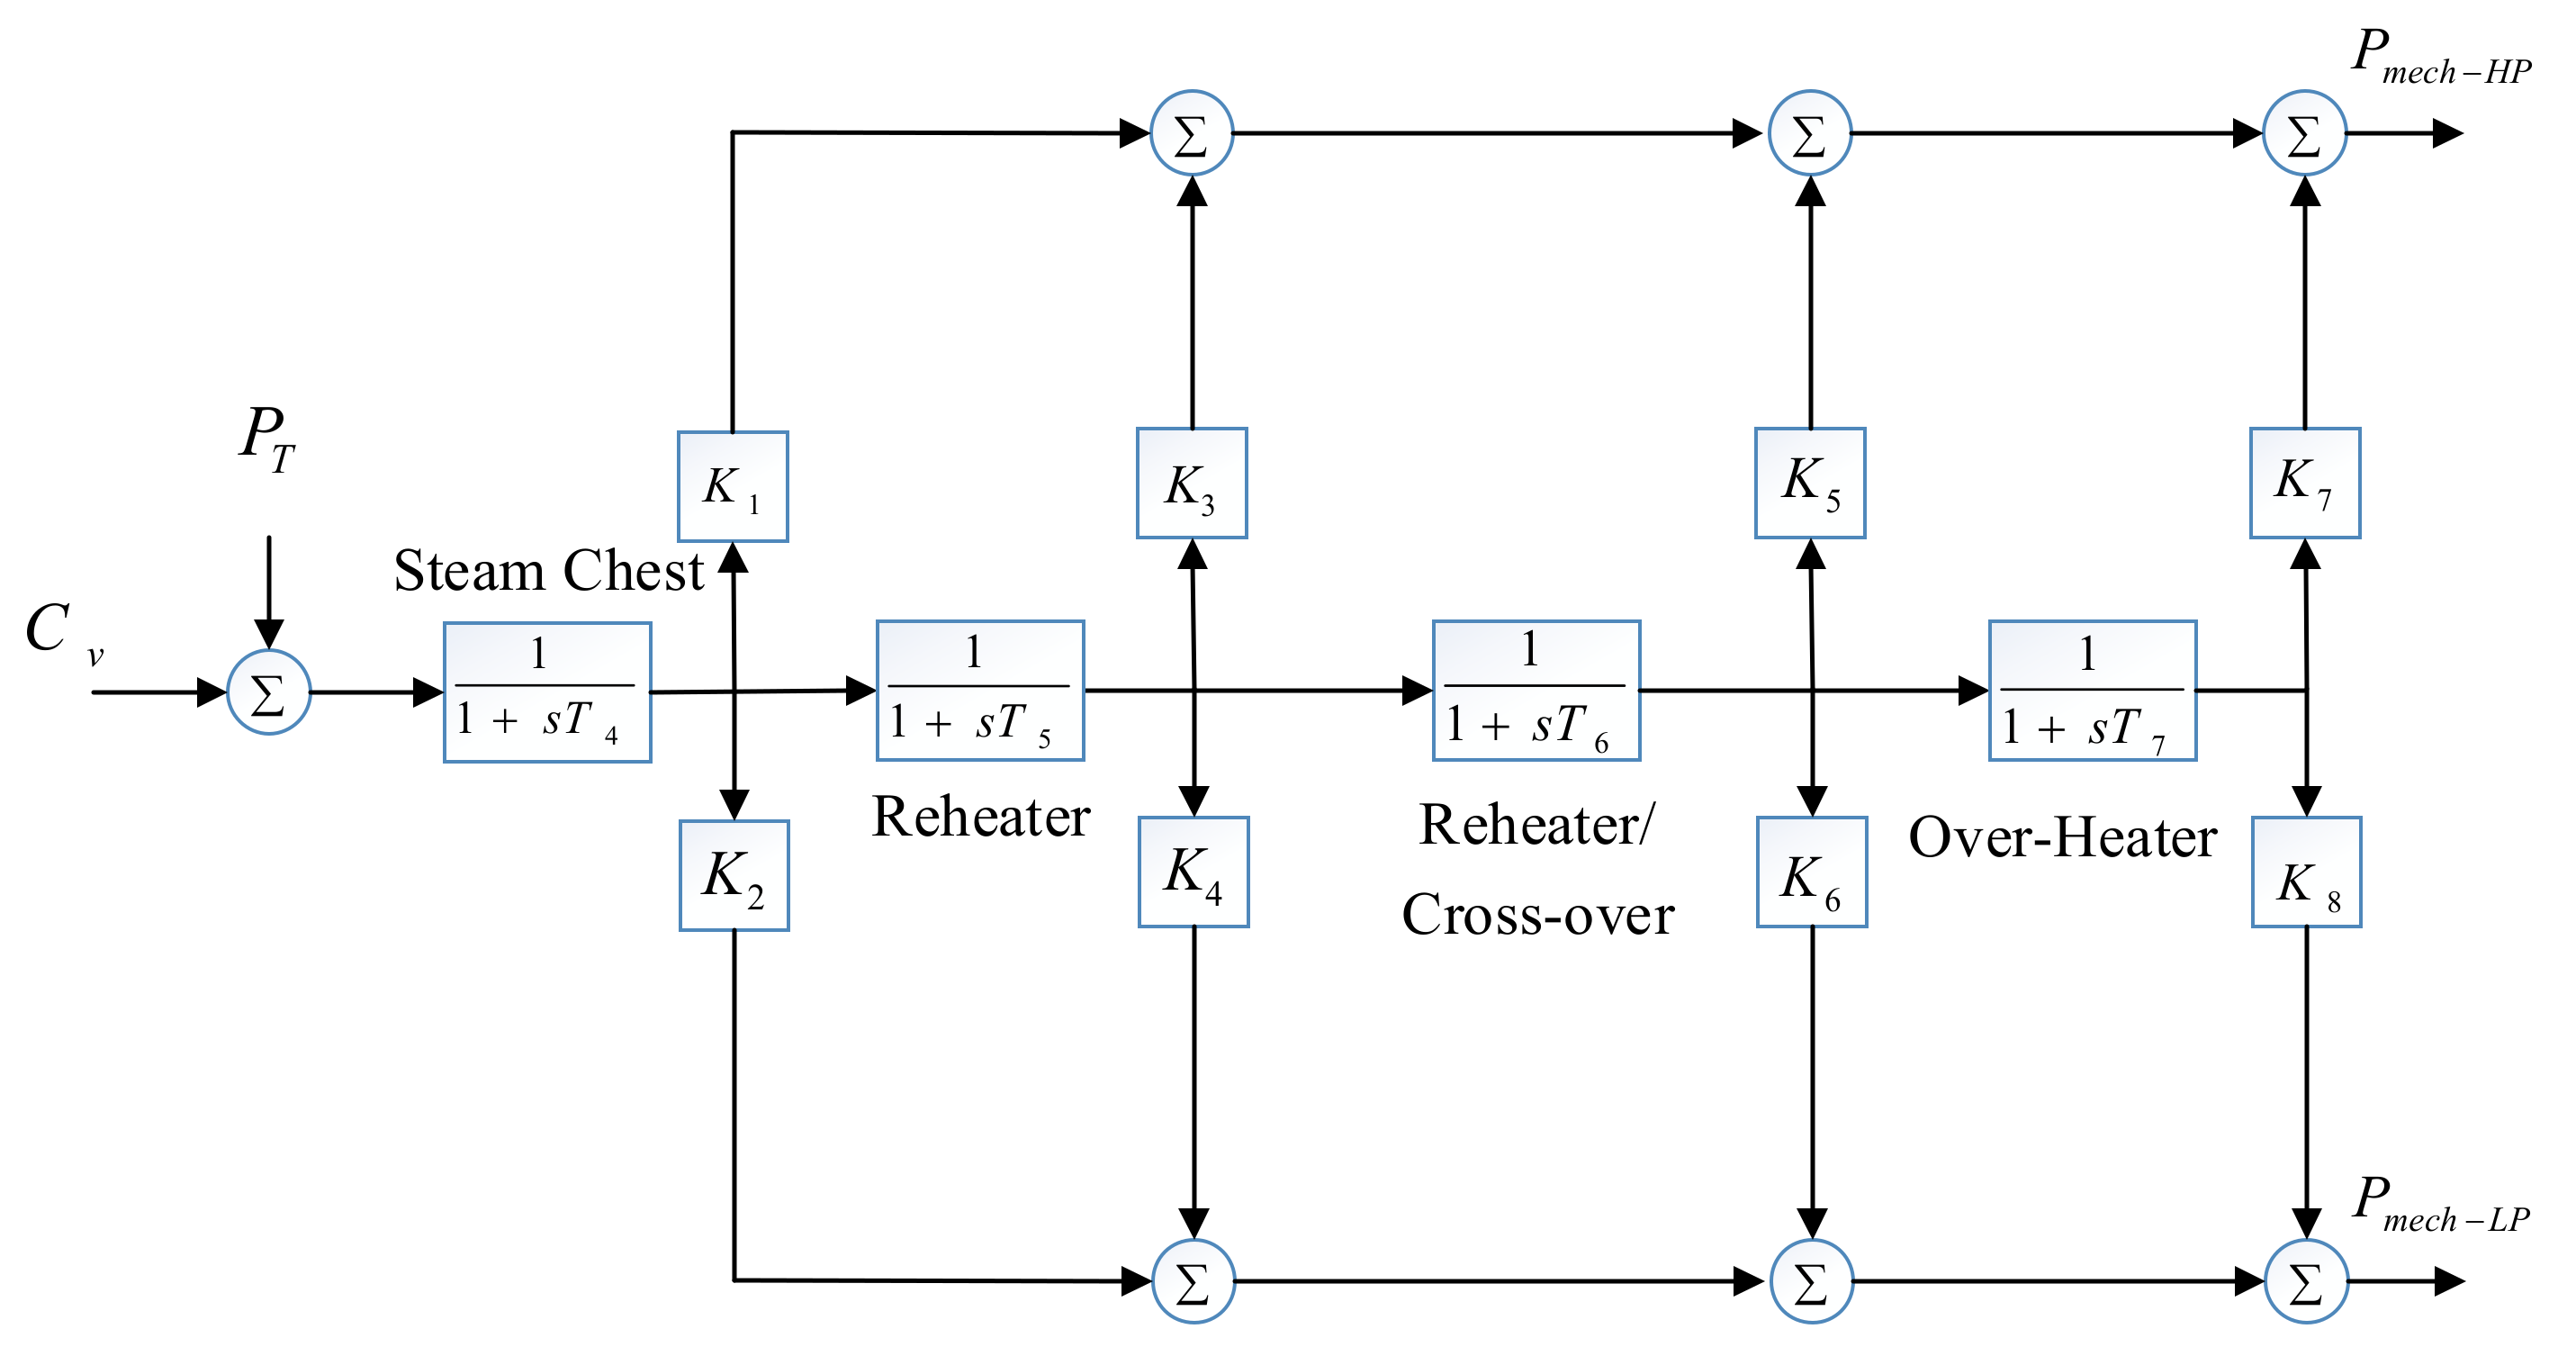
2.2.1. Steam Turbine Model

One of the main challenges is designing a satisfactory turbine system for electric machines, which plays an active role in the effective regulation of frequency responses. The shaft of the SG is driven by a mechanism of prime movers which determines the steady-state speed of the SG. Hydraulic turbines, gas turbines, steam turbines, and diesel engines are typical types of prime movers. For a steam turbine power plant, the boiling water as the main component is transferred into high-pressure steam to drive SG. Following this, steam starts to pass through the control valve and enters different stages in the turbine, including high pressure (HP), intermediate pressure (IP), low pressure (LP), and reheater. In the final stage, the steam is expanded and transferred into the condenser section. In this study, the presented model is a double reheater cross-compound turbine mode which is illustrated in Figure 3. In the dynamic model, K 1 , K 3 , K 5 , and K 7 are the fractions of the HP unit’s mechanical power, resulting from the different turbine stages. In the following, K 2 , K 4 , K 6 , and K 8 are similar fractions of the LP unit’s mechanical power. Presented time constants including T 4 , T 5 , T 6 , and T 7 are steam chest, first and second reheater, and the crossover time constants, respectively. All parameters related to the steam turbine are listed in Table 3 [38].

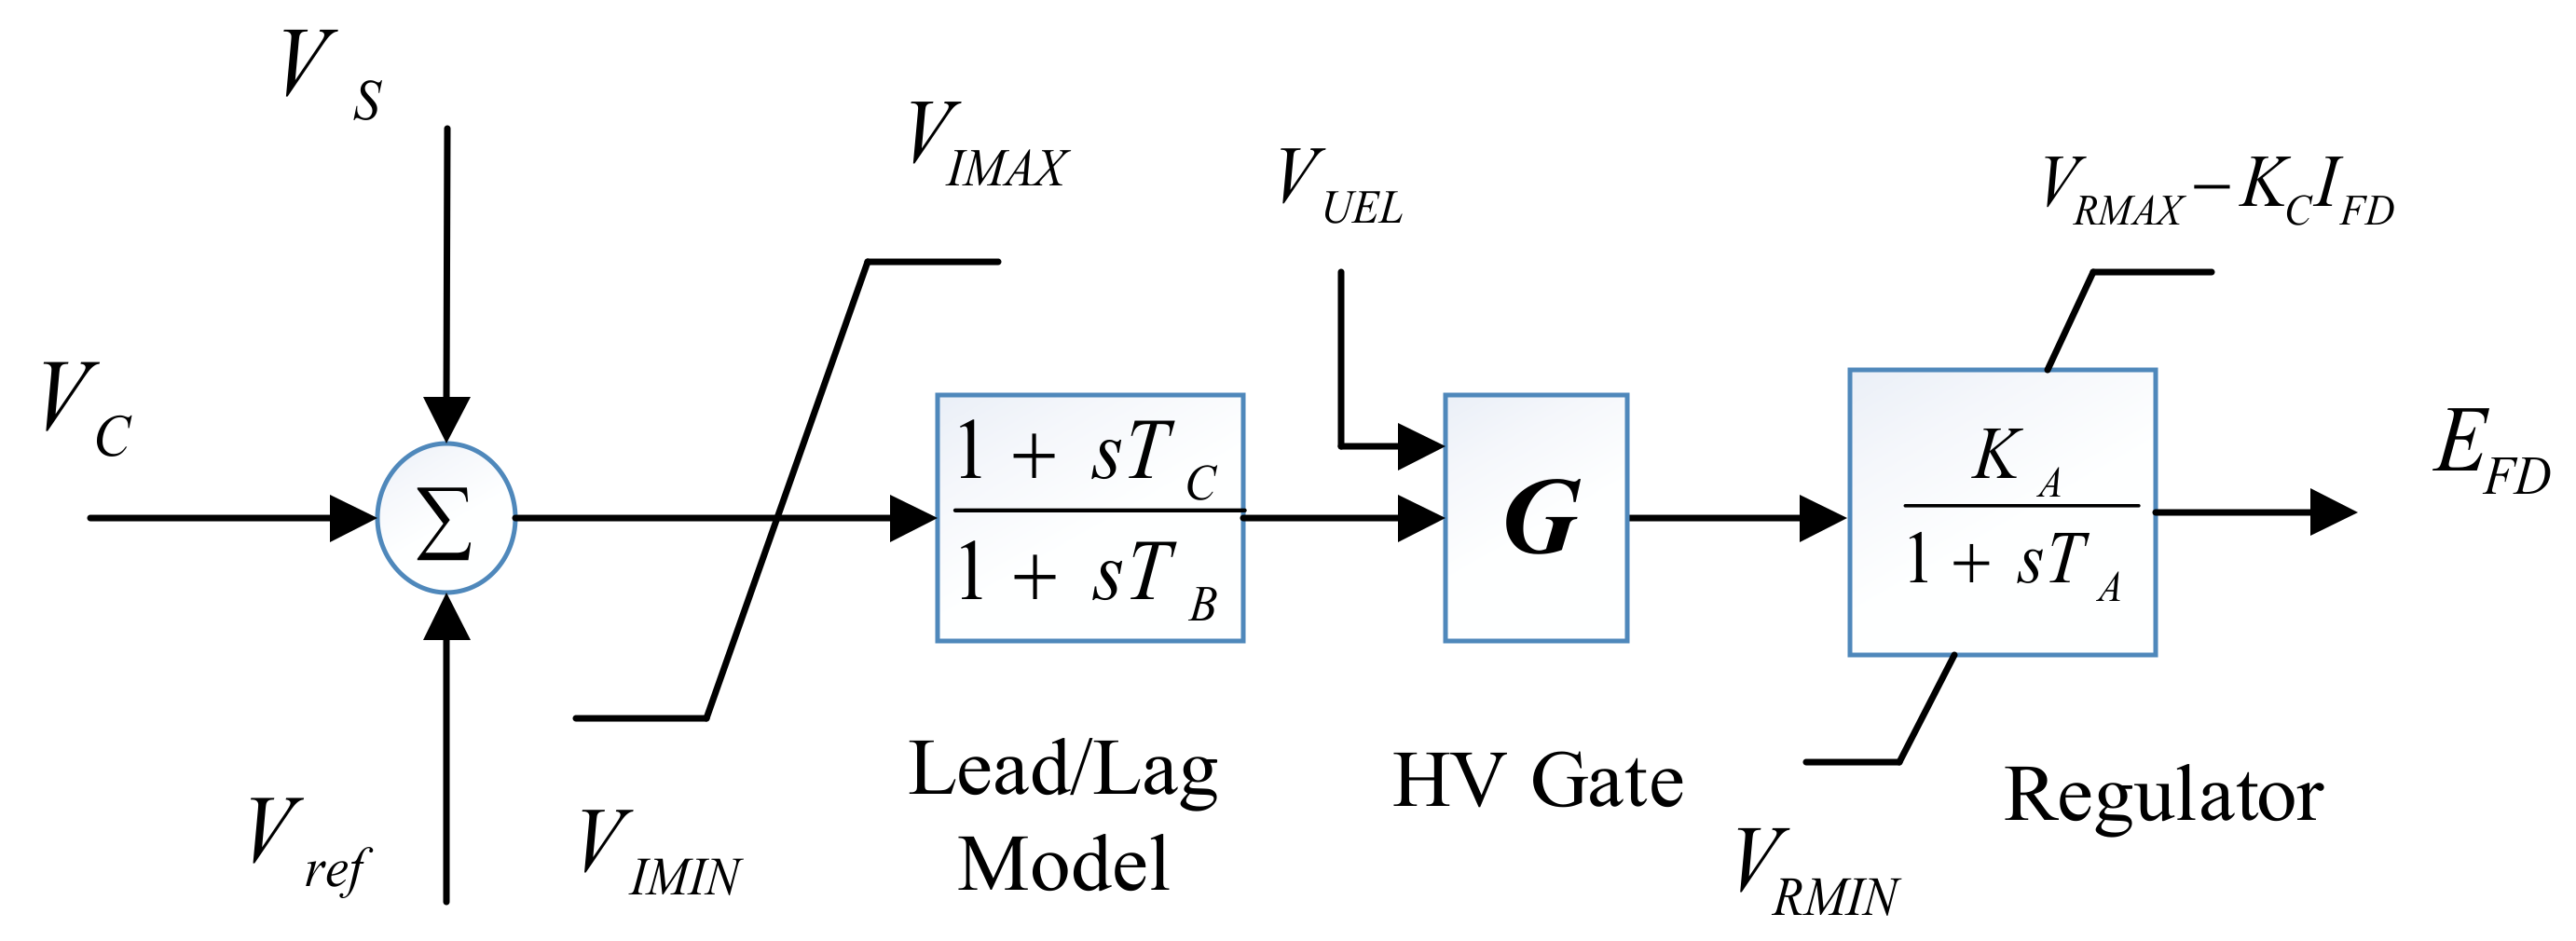
2.2.2. Excitation System

In order to achieve a high level of reliability in modern low-inertia power systems, each generator is equipped with an exaction system. Excitation systems include a DC excitation system, using a DC generator with a commutator. The AC excitation system, in which requires a direct current, is produced by the related alternators.
It is important to mention that both excitation systems are considered as rotating exciter systems mounting to the shaft of the generator, and are compelled to the prime mover. In this study, the AC 4 A   model is deployed, which differs from frequent excitation systems, and a full thyristors bridge in the exciter output circuit is implemented. The firing of this bridge is performed using the voltage regulator. The model of the excitation system is shown in Figure 4. The thyristors bridge in the excitation system can satisfy the exciter stabilization goal, using a lag-lead series rather than the rate feedback. The voltage regulator is identified by two time constants, i.e., K A , and T A . For a detailed study, parameters of the excitation system are shown in Table 4 [39].

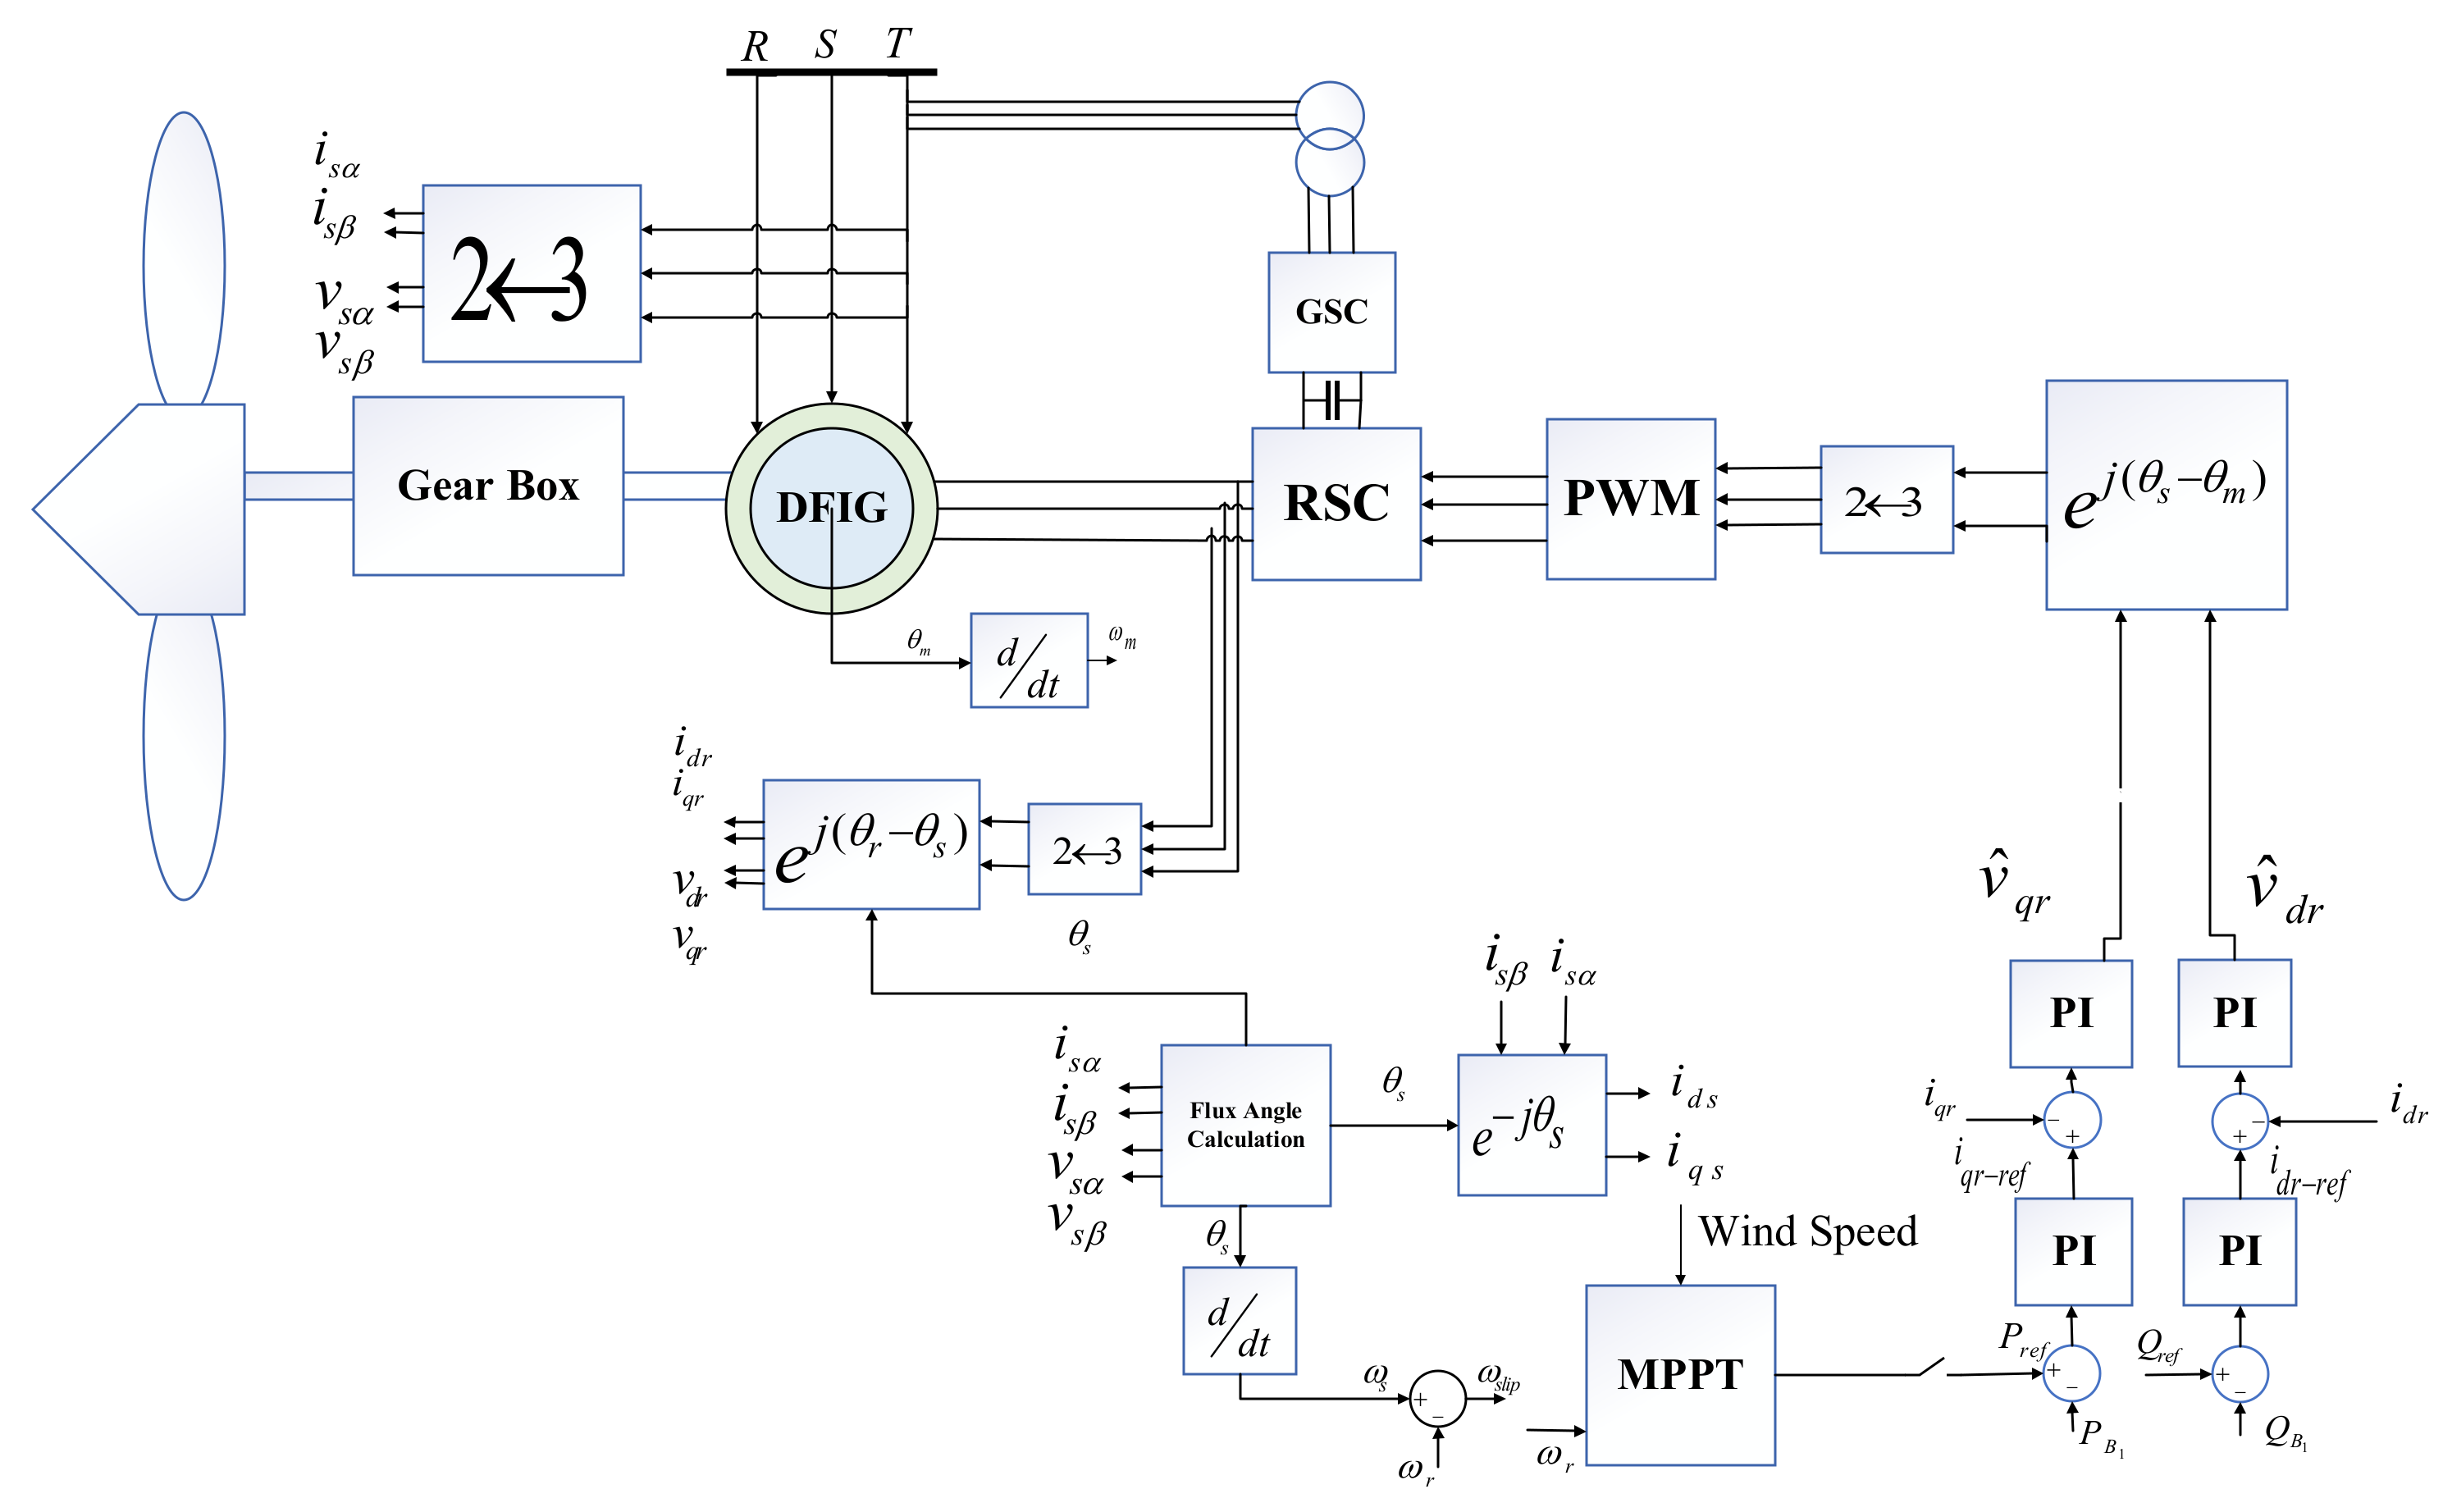
2.3. Wind Turbine Generator

Over the last decades, the development of a control mechanism has considerably increased the share of WTG in power grids. It is expected that the total installation of wind power will increase from 440 GW to 760 GW by the year 2020. To provide a reliable power system operation, the coordination of the wind power with other distributed generation presents as a necessary issue. The intermittent nature of wind turbines and the variability of wind turbines’ speed to extract maximum power obliges the use of power electronic devices, in which the control injection of active and reactive power is made available. Recently, the capability of WTG has increased considerably by implementation of AC–AC frequency converters. One of the classic methods for the control of the DFIG’s active and reactive power is a vector control approach which is described as follows:

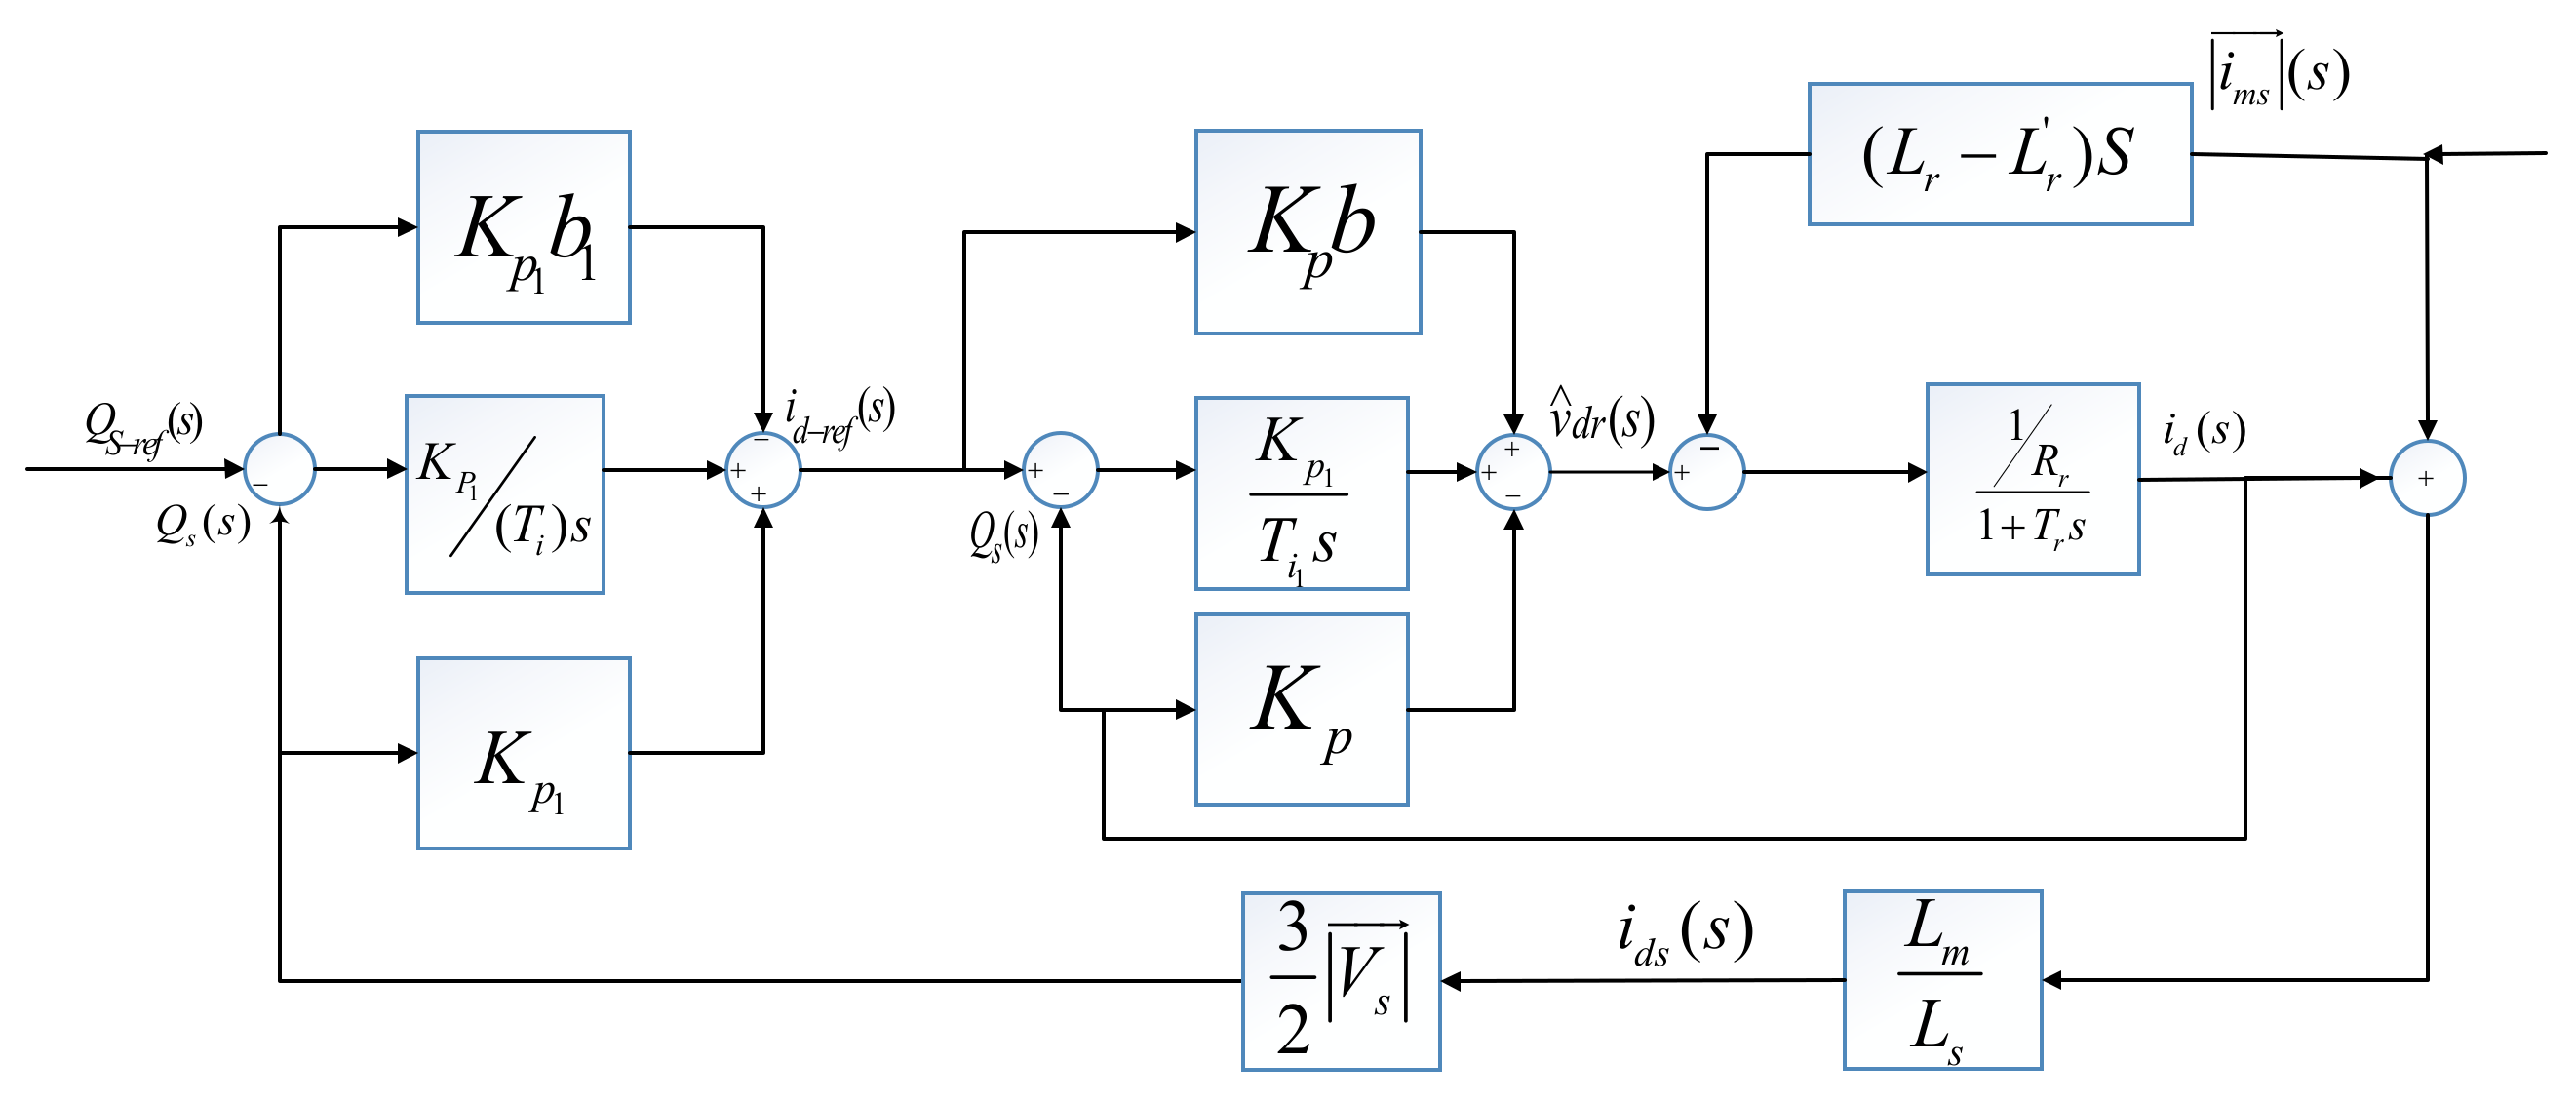
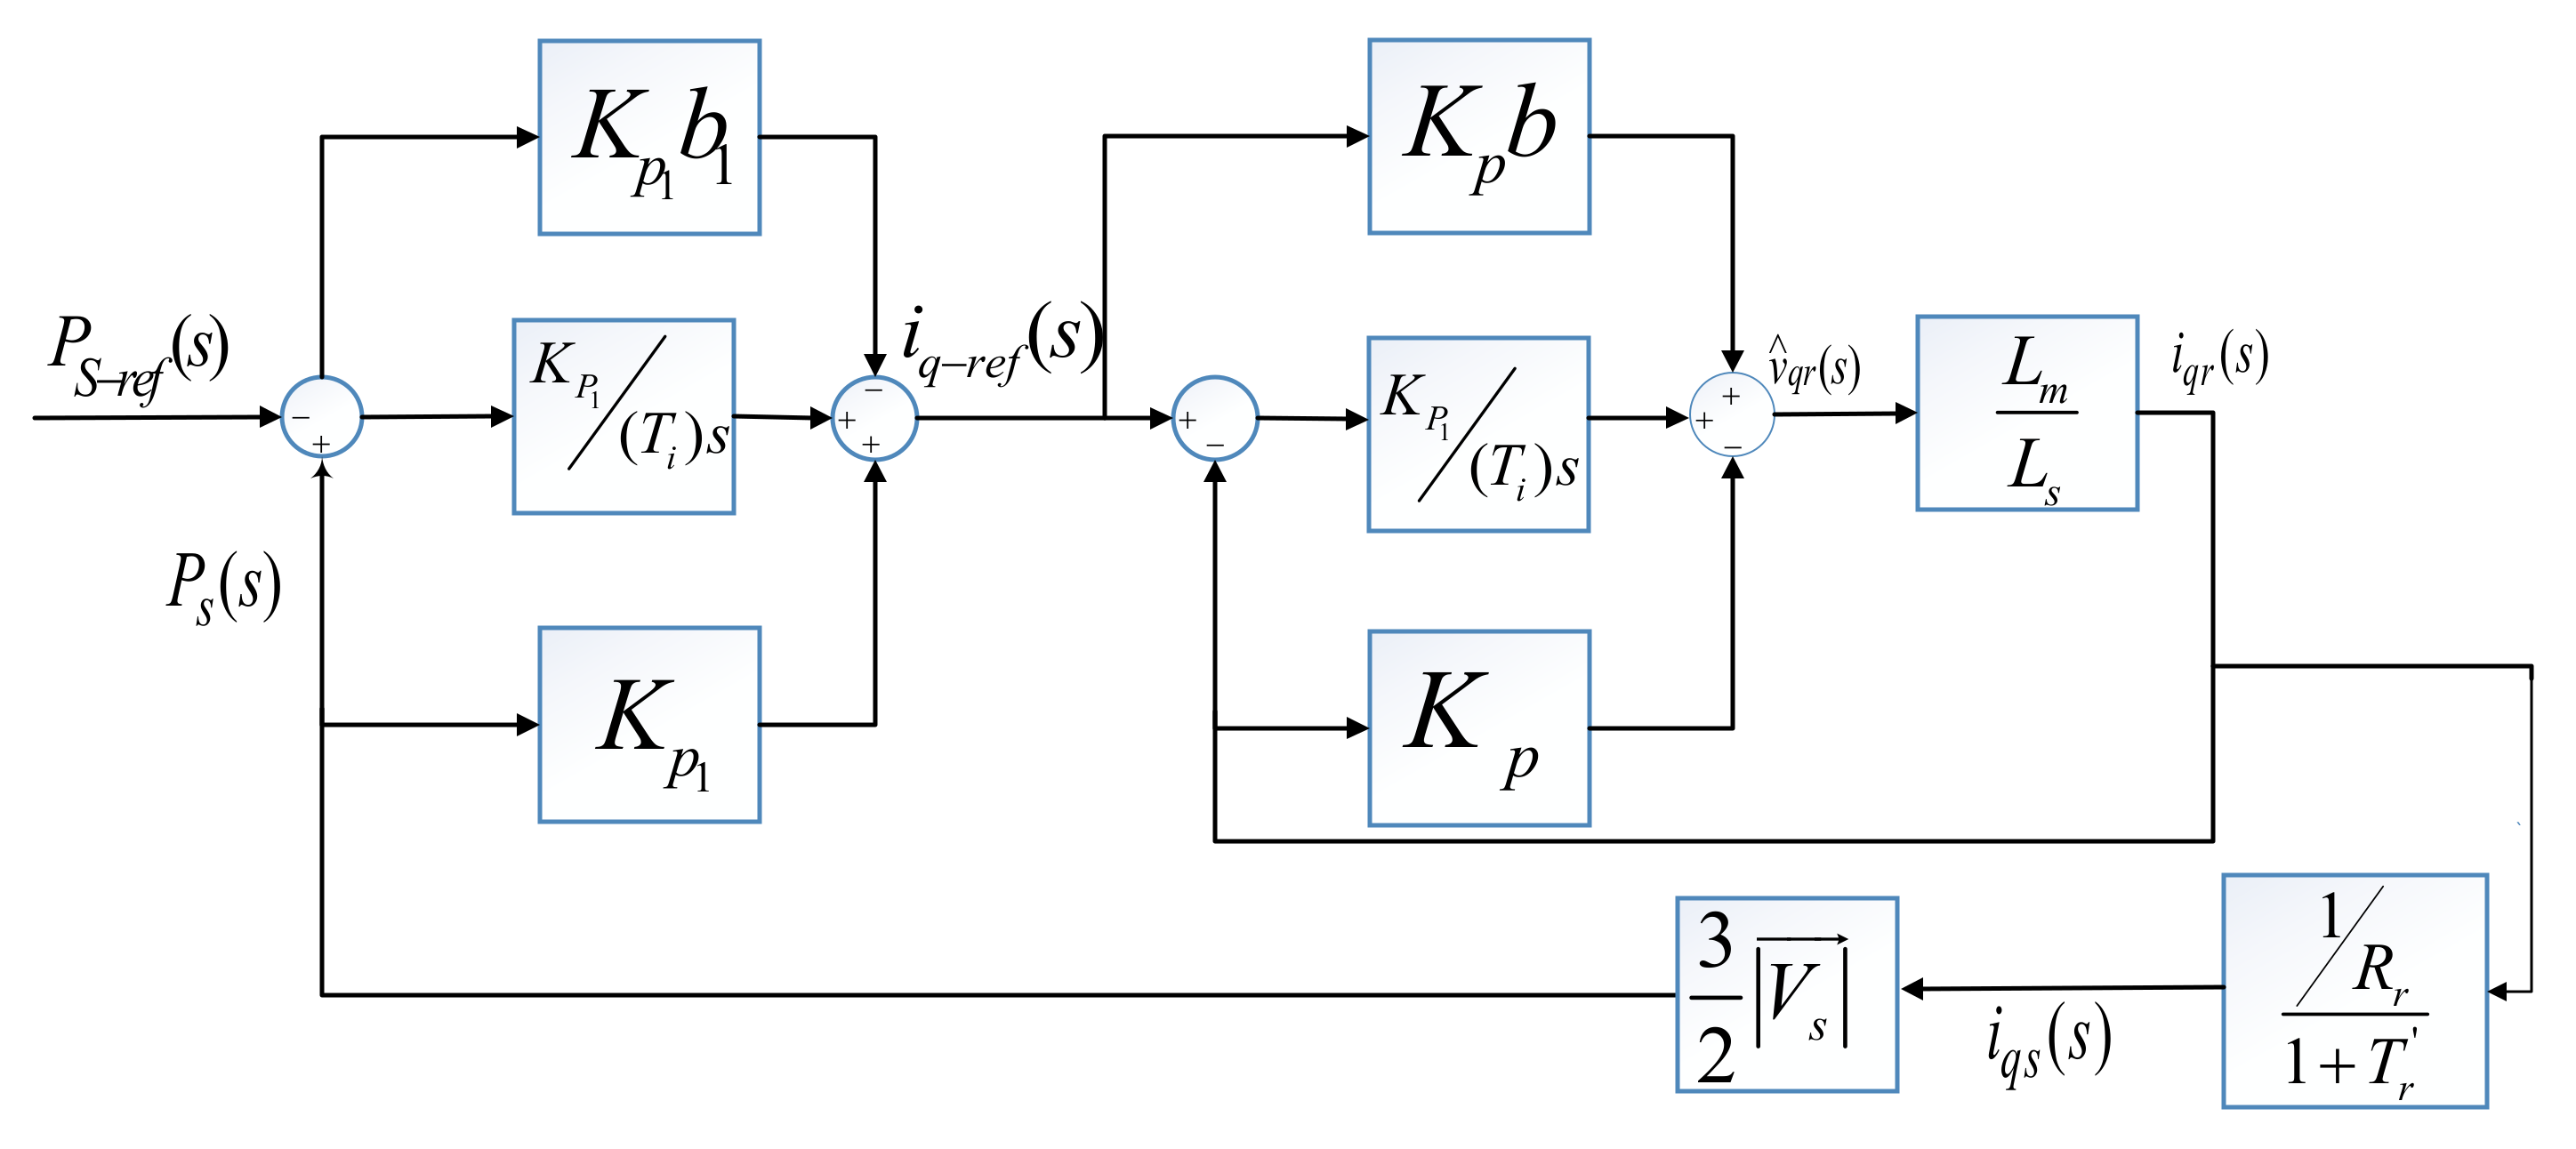
2.3.1. Rotor Side Converter Vector Control

If the reference frame is aligned with stator flux λ S , stator flux equation can be revised as follows:
λ s = λ d , λ q = 0 , d λ q dt
If the frame of stator is called dq frame, the voltage and flux equations of stator by considering constant stator flux and zero stator resistance in this frame can be written accordingly [40,41]:
V ds = 0
V qs ω r λ d   v   s
λ S = L sl   i   s + L ms   i   s + L m   i   r = L s   i   s + L m   i   r
λ ds + j λ qs = L s i ds + ji qs + L m i dr + ji qr
λ qs = L s i qs +   L m i qr = 0
λ ds = L m   i   ms = L s i ds + L m i dr
Therefore, the stator active and reactive powers is given as [42]:
P s = 3 2 ( v ds i ds + v qs i qs )
Q s = 3 2 ( v qs i ds v ds i qs )
P r = 3 2 ( v dr i dr + v qr i qr )
Q r = 3 2 ( v qr i dr v dr i qr )
P s 3 2 v qs i qs 3 2   v   s i qs
Q s 3 2 v qs i ds 3 2   v   s i ds
Based on (12) and (13) for stator currents in the dq framework, the following equations can be obtained as:
i ds = L m L s i ms i dr
i qs = L m L s ( i qr )
Finally, based on dq currents, the stator active and reactive power can be derived similarly as:
P s = 3 2 L m L s v s i qr
Q s = 3 2 L m L s v s   i   ms i dr
According to (22) and (23), the stator active and reactive powers can be controlled independently through the d and q current components. It is important to mention that this obtained result is the main concept of the vector control application in the layout of WTG. As the control of active and reactive powers is perfumed using a rotor voltage injection, rotor current components must be revised based on rotor voltage components. In this regard, the rotor flux equations can be summarized as follows:
    λ dr + j λ qr = L r i dr + ji qr + L m i ds + ji qs λ dr = L r i dr + L m i ds
= L r i dr + L m 2 L s ( i ms i dr ) = L m 2 L s i ms + L r i dr
λ qr = L r i qr + L m i qs = ( L r L m L s ) i qr = L r i qr
where L r is defined as:
L r = L r L m 2 L s
Based on (27), the d-axis rotor voltage equation can be acquired as:
v dr = R r i dr + σ di dr dt L m 2 L s di ms dt v dr ^ ω sl L r i qr V Fdr
Based on obtained (28), the d-axis rotor voltage consists of two components. The first component is composed of feedback from the d-axis rotor current. The second is a combination of feedforward from the q-axis rotor current. Figure 5 shows the control loop related to stator reactive power control [42]. Similar to the previous section, q-axis rotor voltage can be concluded as follows:
v qr = R r i qr + σ L r di qr dt v qr ^ + ω sl L m 2 L s i ms + L r i dr V Fqr
Similarly, the q-axis rotor voltage includes two components according to (29). The control loop for stator active power is shown in Figure 6. At the final stage, the block diagram of the vector control of doubly fed induction generator (DFIG) is illustrated in Figure 7.

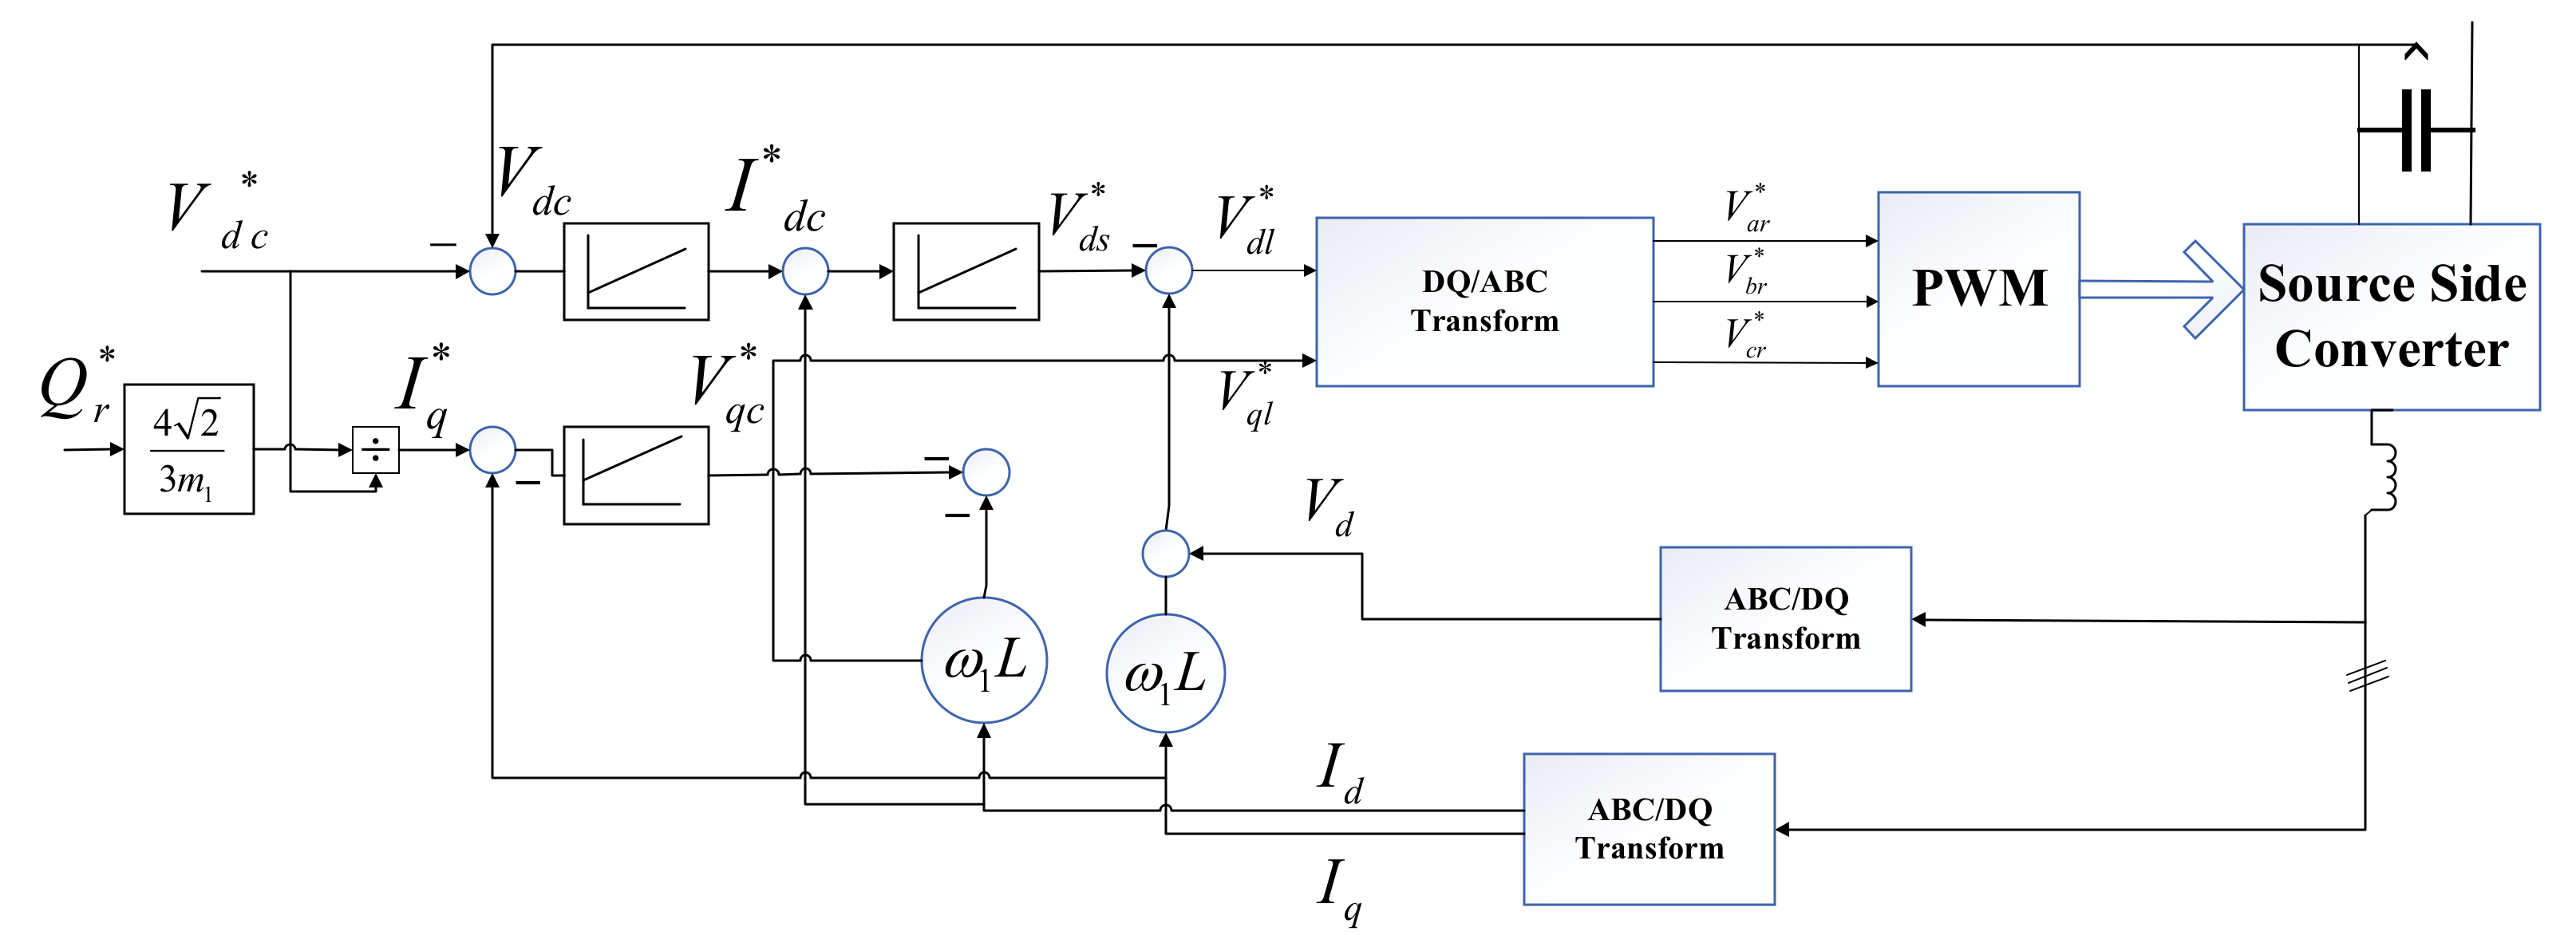
2.3.2. Grid Side Converter Vector Control

The main role of the grid side converter (GSC) is to maintain voltage of the DC-link at a stable level. As it may be expected, this side of the converter is able to control a portion of reactive power. It can be concluded that DC-link voltage is controllable through the d-axis current component of the GSC, while reactive power can be controlled using the q-axis current component of the GSC. It is often argued that the GSC is connected to the grid with an adjustable transformer. In this regard, the rotor voltage can be equal to the stator voltage during maximum slip [43]. Voltage equations in the main grid considering the inductance line can be written as follows:
V a V b V c = R I as I bs I cs + L d dt I as I bs I cs + V as V bs V cs
Similar to the previous rotation flux framework, the d-axis stator voltage is assumed to be constant and the q-axis stator voltage can be equal to zero:
V s = V d ,   V q = 0
Therefore, the active and reactive powers are associated with i d , i q respectively in dq frame. The regulation of the DC-link can be performed by the d-axis current, while regulation of reactive power uses the q-axis:
V d = Ri ds + L di ds dt 2 π f Li qs + V ds
V q = Ri qs + L di qs dt 2 π f Li ds + V qs
If m 1 is defined as a modulation index of the AC/DC inverter, the voltage of the DC-link can be expressed as follows:
C dV dc dt = I dc I dc = 3 m 1 4 2 I d I dc
This equation confirms that the DC-link voltage can be controlled by I d . Furthermore, the reactive power from main network can be obtained accordingly [44]:
Q r = 3 2 ( V d I q V q I d ) = 3 2 V d I q ; V q = 0
Figure 8 shows that the gird side vector control scheme, which is related to the DFIG vector control, benefits from a decoupled device to find the rotor voltages. All parameters related to the WTG are also given in Table 5. The specifications of our system, which is used to simulate this islanded microgrids, is as follows: Intel(R) Core(TM) i5 Pentium N4200 CPU @ 1.10 GHz, 5-core processor, with 4 GB RAM, 128 GB SSD. Moreover, all distributed energy resources (DERs), including CHP, DEG, WTG, and PV are modeled through PSCAD 4.5 and simulations are performed at a 100 µs time step.

3. Optimum Contribution of DERs in Frequency Improvement Scheme

3.1. Multi-Objective Function

The layout of our proposed islanded MG, which includes CHP, diesel engine generator, WTG, and photovoltaic panels, is illustrated in Figure 9. In this layout, power electronic interface generation (PEIG) is broadly used in order to monitor and control the frequency excursion, compared to the use of large synchronous generator-based power systems. In the islanded mode, all power generation units can effectively participate in the MG frequency stability scheme. To improve the contribution of distributed energy resources (DERs) and reach a desirable frequency deviation in various conditions, distribution coefficients, i.e., α 1 , α 2 α n are defined based on Figure 9. The physical meaning of these coefficients is the amount of participation of DERs in the frequency improvement of islanded MG during the switching function from main grid and islanded mode, multi-step load changes, and different inertia of the hybrid system. All mentioned distribution coefficients can be optimally tuned in the MATLAB environment by a multi-objective function (MOF) as follows:
MOF α 1 ,   α 2     α n = α × ISE + β × S t + γ × MSFC + σ × U s
In this MOF, ISE = 0 Δ f 2 t dt   is referred to as the integral squared error of the frequency response, S t is the settling time, U s   is the maximum overshoot of frequency response, and MSFC is considered as the maximum slope of the frequency response after any disturbance. Moreover, in this multi-objective function, α = 0.002 ,   β = 0.001 ,   γ = 0.002 , and σ = 0.006 are determined and defined as weight coefficients of frequency deviation, which plays an important role in convergence speed of the optimization process. The nominal frequency of our microgrid is f 0 = 60   Hz . To achieve the best result of this MOF, which can considerably decrease all characteristics of the frequency response, the artificial bee colony (ABC) algorithm is employed to determine optimum distribution coefficients, i.e., α 1 , α 2 α n .

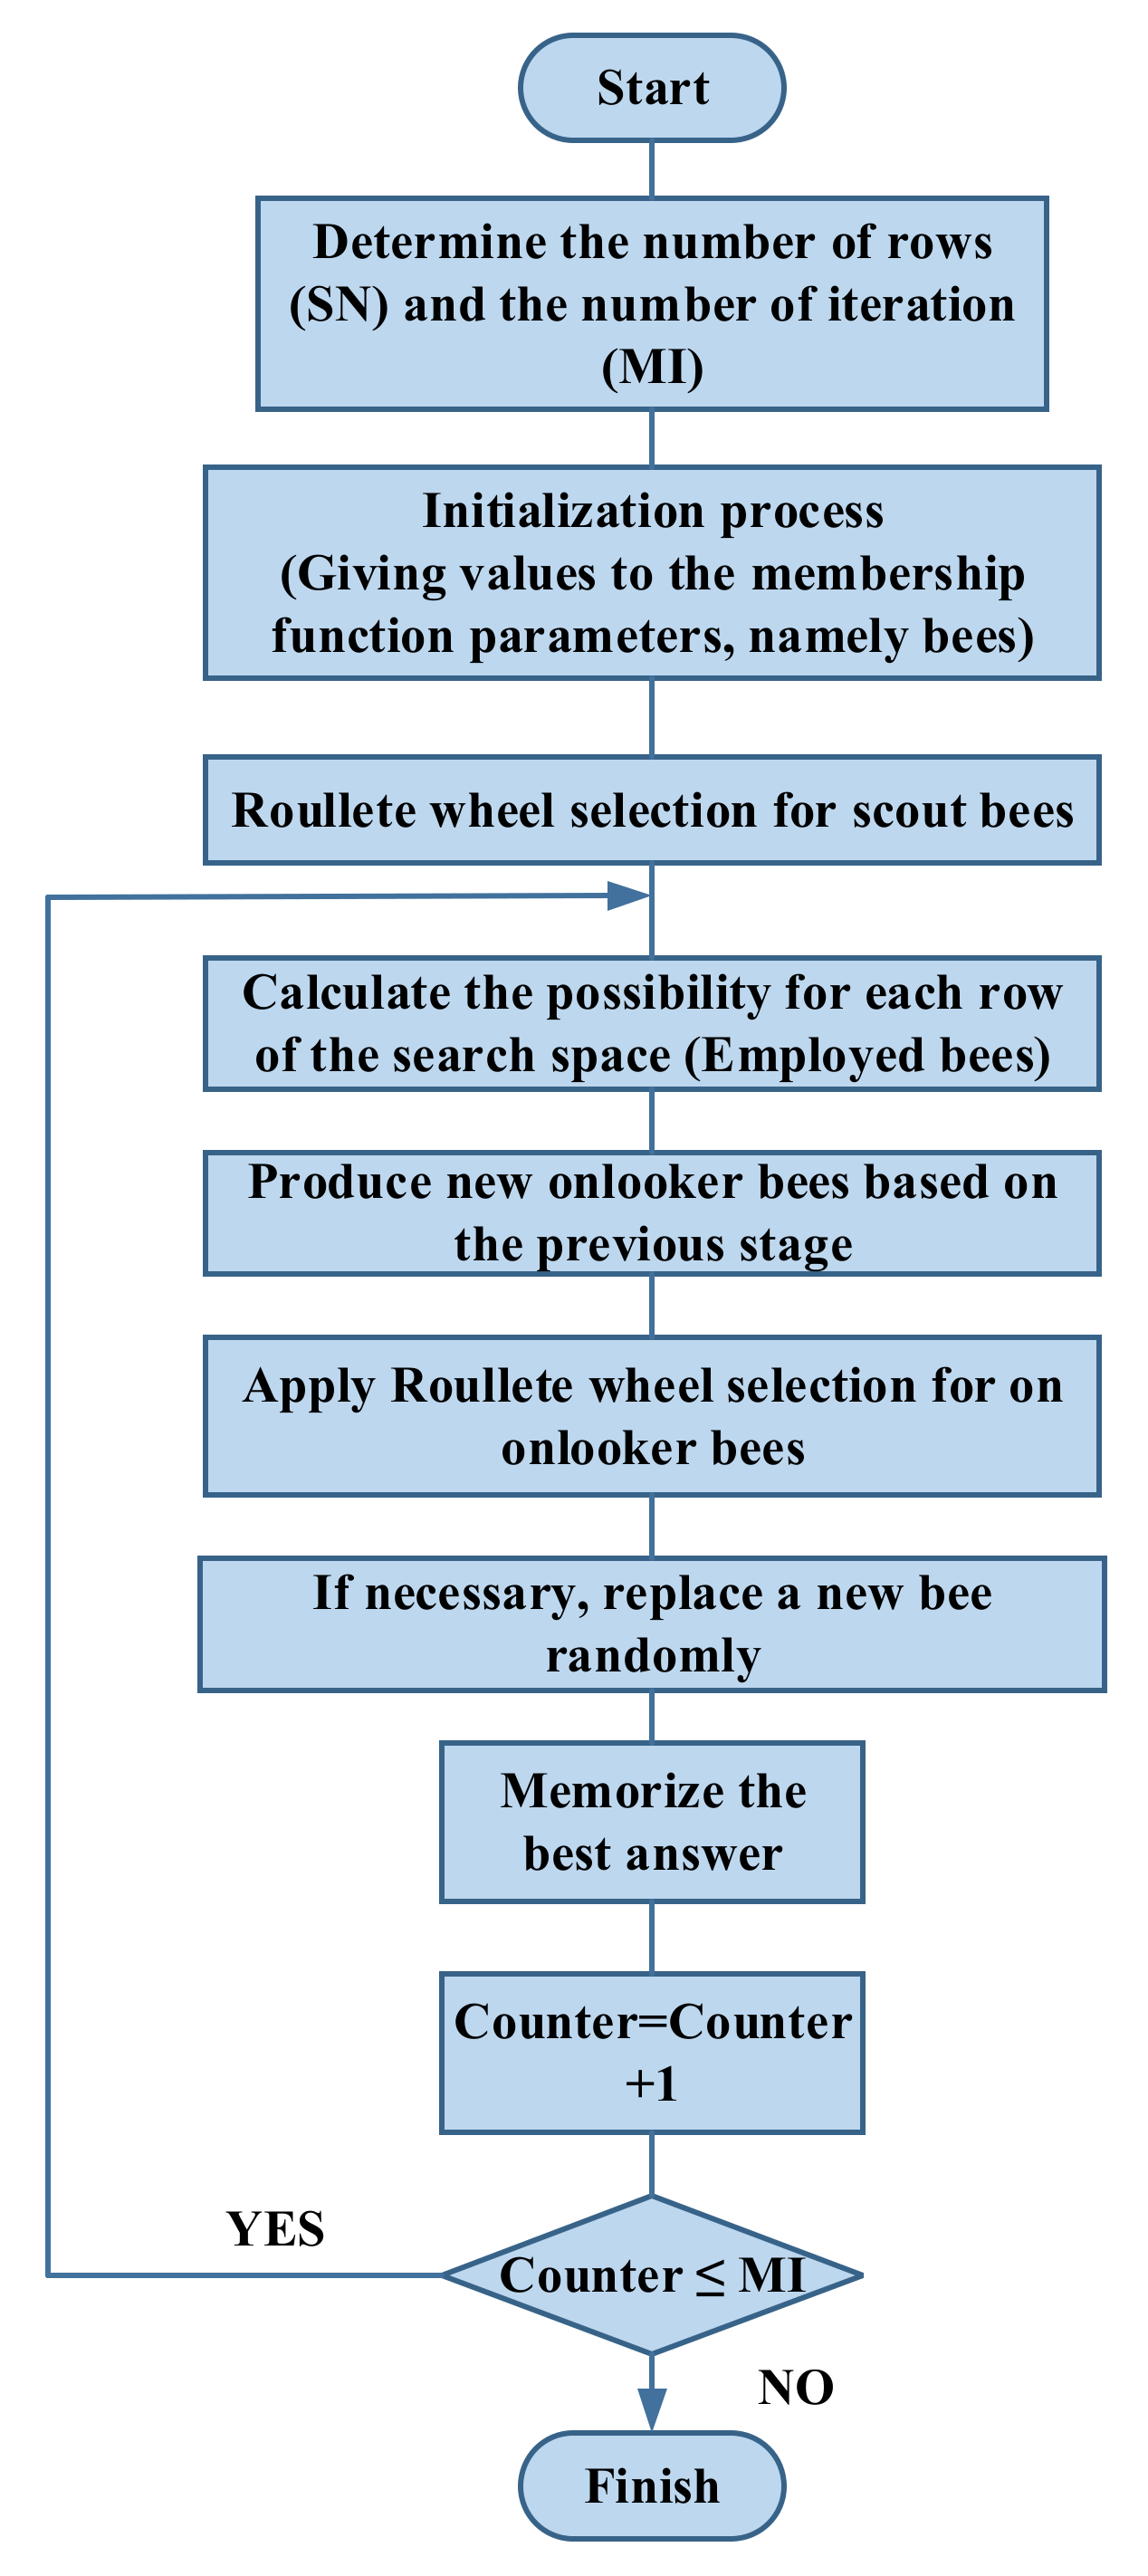
3.2. Artificial Bee Colony (ABC) Algorithm

In the ABC algorithm, two parameters are defined in the search space. The first parameter consists of two different parts, i.e., the number of food resources and the number of onlooker bees. To present a satisfactory performance of the initialization process during the process of optimization, a matrix X Search space should be defined, that consists of n rows and m columns as follows:
X Search space = X ij n × m
In this search space matrix by the dimensions of n × m   , each row ( n ) represents a set of distribution coefficients, i.e., α 1 , α 2 α n . In contrast, each column represents the number of frequency response characteristics proposed in the multi-objective function, including integral square error (ISE), settling time ( S t ), maximum slope of frequency response (MSFC), and maximum overshoot of frequency response ( U s ).
In the first step, the proposed ABC initializes the search space, which includes distribution coefficients of different distributed energy resources (DERs). Then, for each row of the search space, the frequency response is obtained, and the optimal cost function is calculated. The search process in the ABC algorithm is associated with two different bee allocation methods for food sources. At first, employed bees move toward various food sources and for each employed bee, a cost function value is calculated through the frequency response calculation (i.e., for each distribution coefficient, the simulation is performed, and the MOF is evaluated in order to calculate the cost function, so called nectar information hereafter). When all employed bees completed the search process, they share the nectar information of food sources and their position information with onlooker bees. An onlooker bee evaluates the nectar information taken from all employed bees and chooses a food source with a probability related to its nectar amount. This meta-heuristic algorithm selects a food source through a probability value ( P i ) related to that food source that can be obtained as follows:
P i = fit n n = 1 SN fit n
where fit n is fitness function value for ith bee, and SN is referred to as the total number of food sources (i.e., n is the number of optimization parameters). In the final step, the optimum values of distribution coefficients move towards the best answer, so that the multi-objective function proposed in (38) will reach a minimum level [45]:
V ij = x ij + ij x ij x kj
where V ij is a new food source position in the search space, and its performance is compared to early (primary) food source position ( x ij ). If the new food has equal or better nectar than the old source, it is replaced with the old one in the memory. In fact, a gluttonous selection mechanism must be used to choose operation between the old and the current food sources. Furthermore, ij is a random number between [−1, 1], deployed during the update process. In this research, based on different operational conditions, several participations of distributed energy resources (DERs) may be ignored, and the ABC algorithm will be updated for any cases based on the flowchart presented in Figure 10.

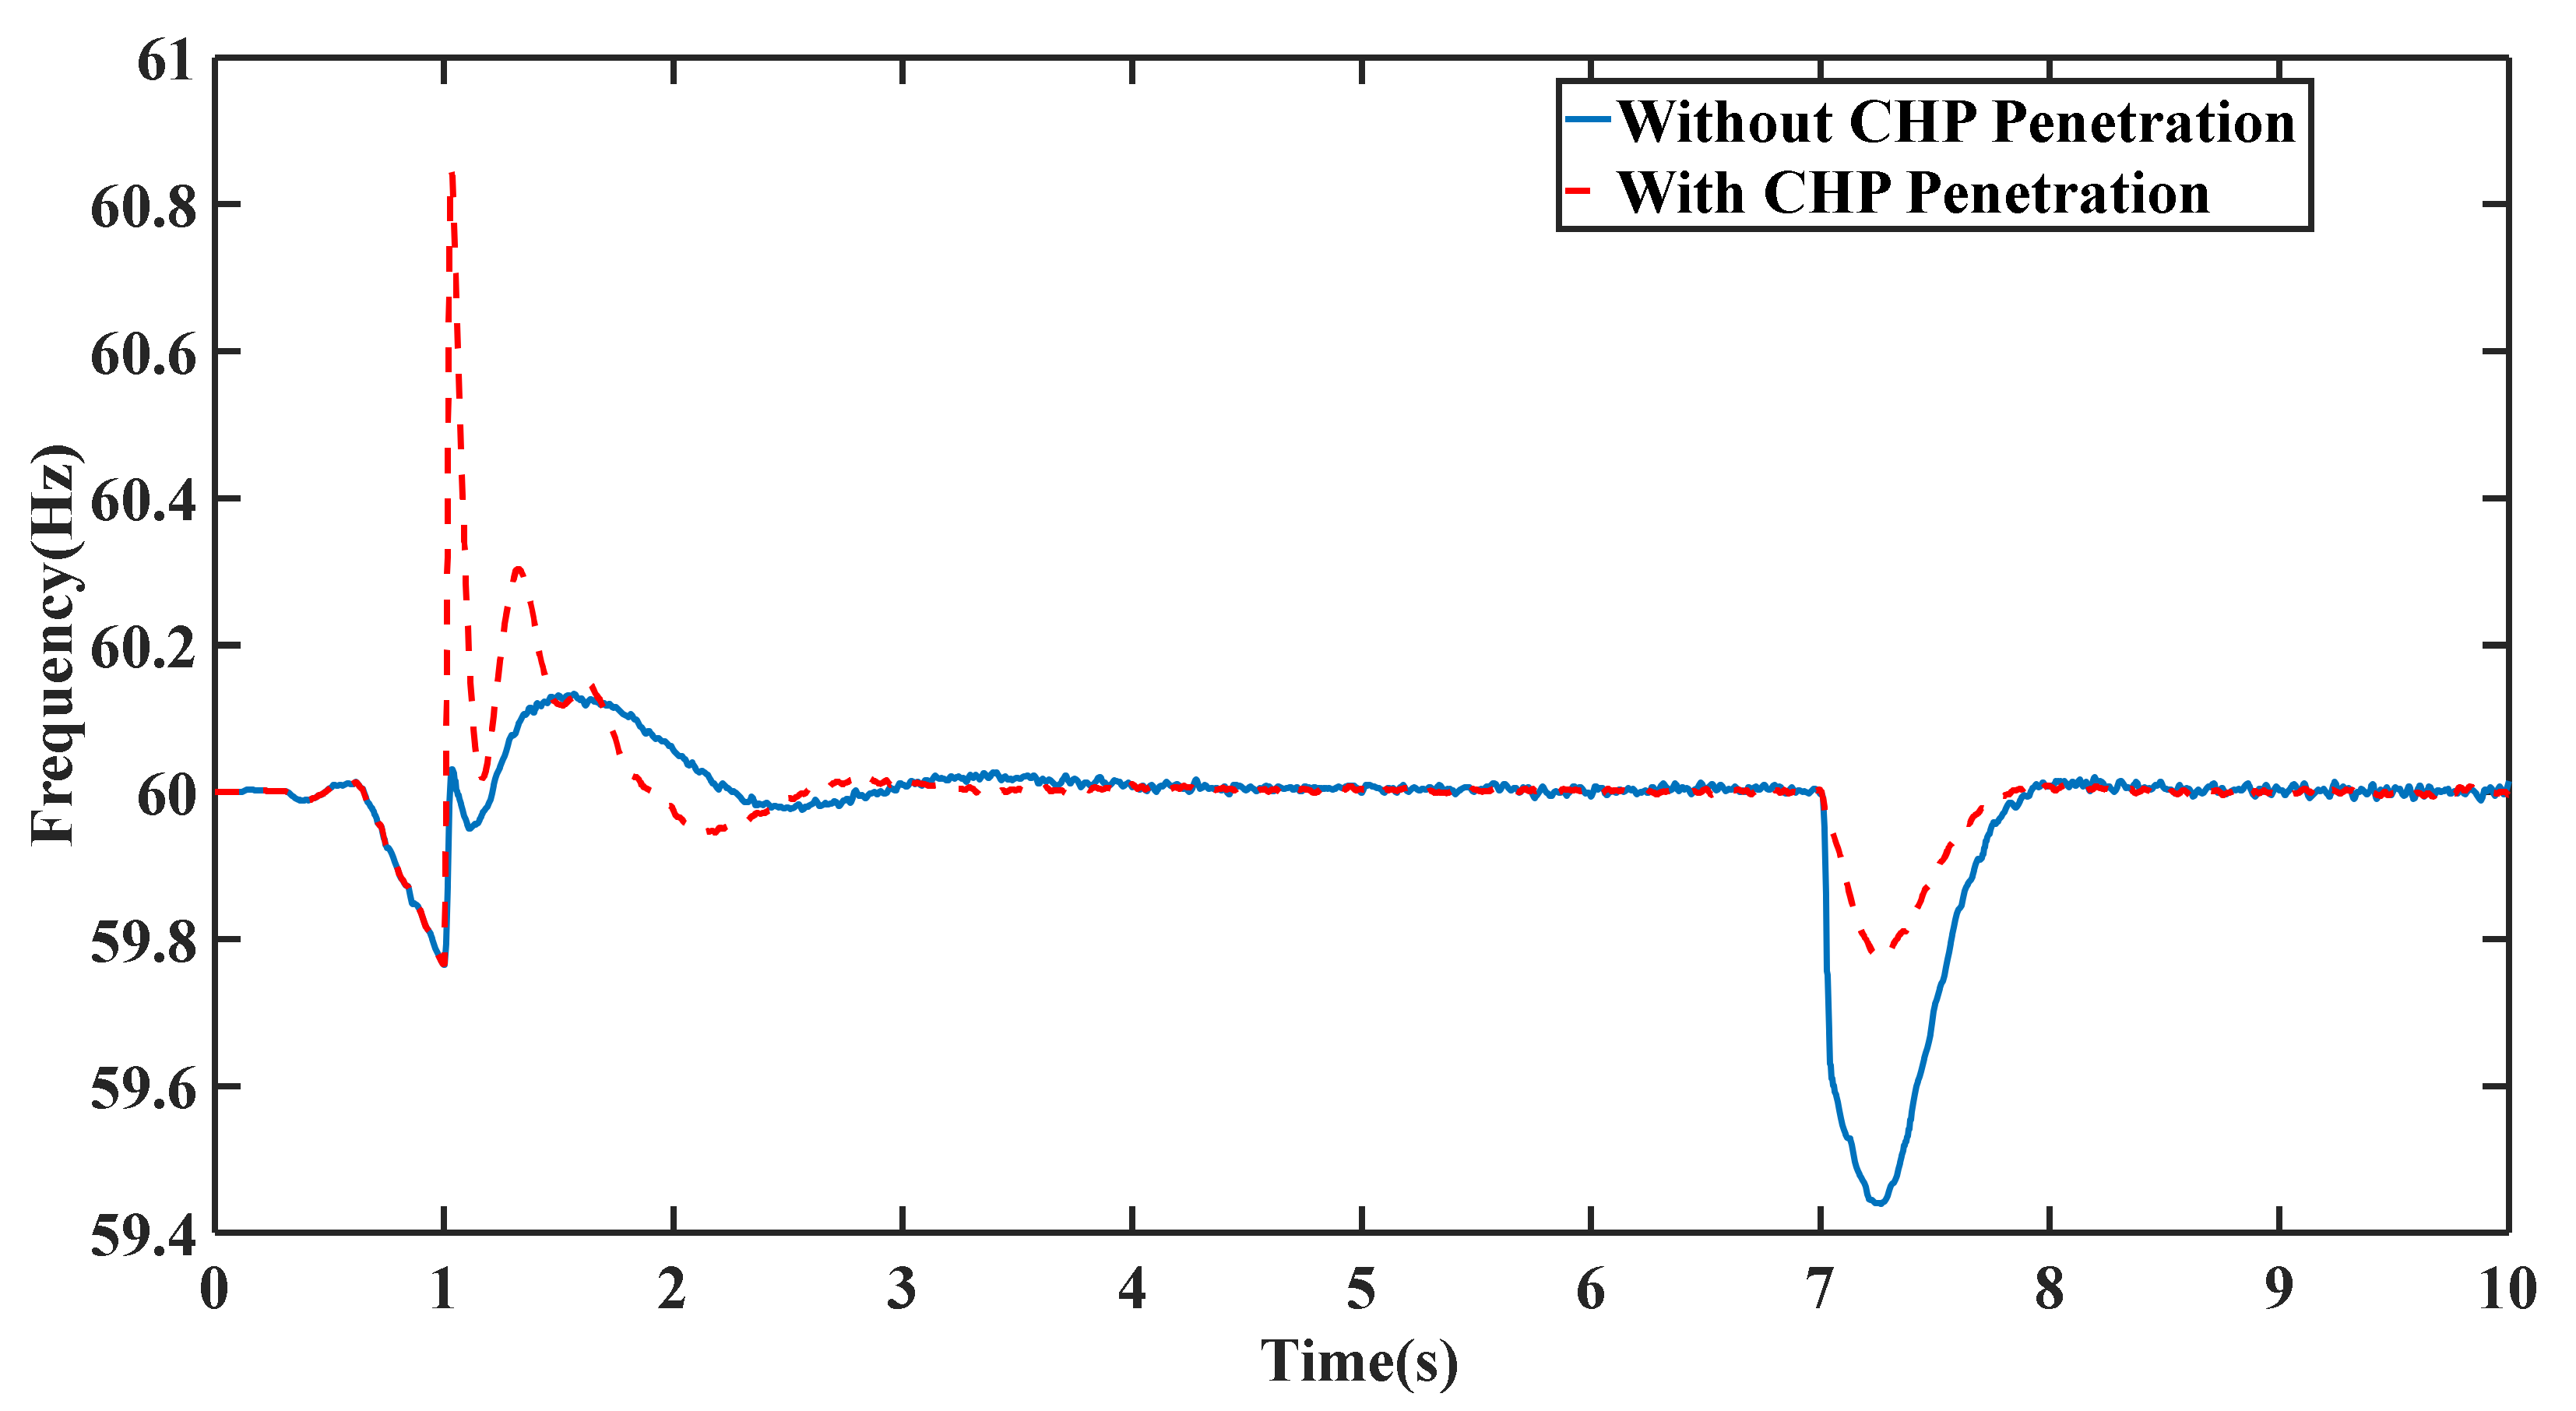
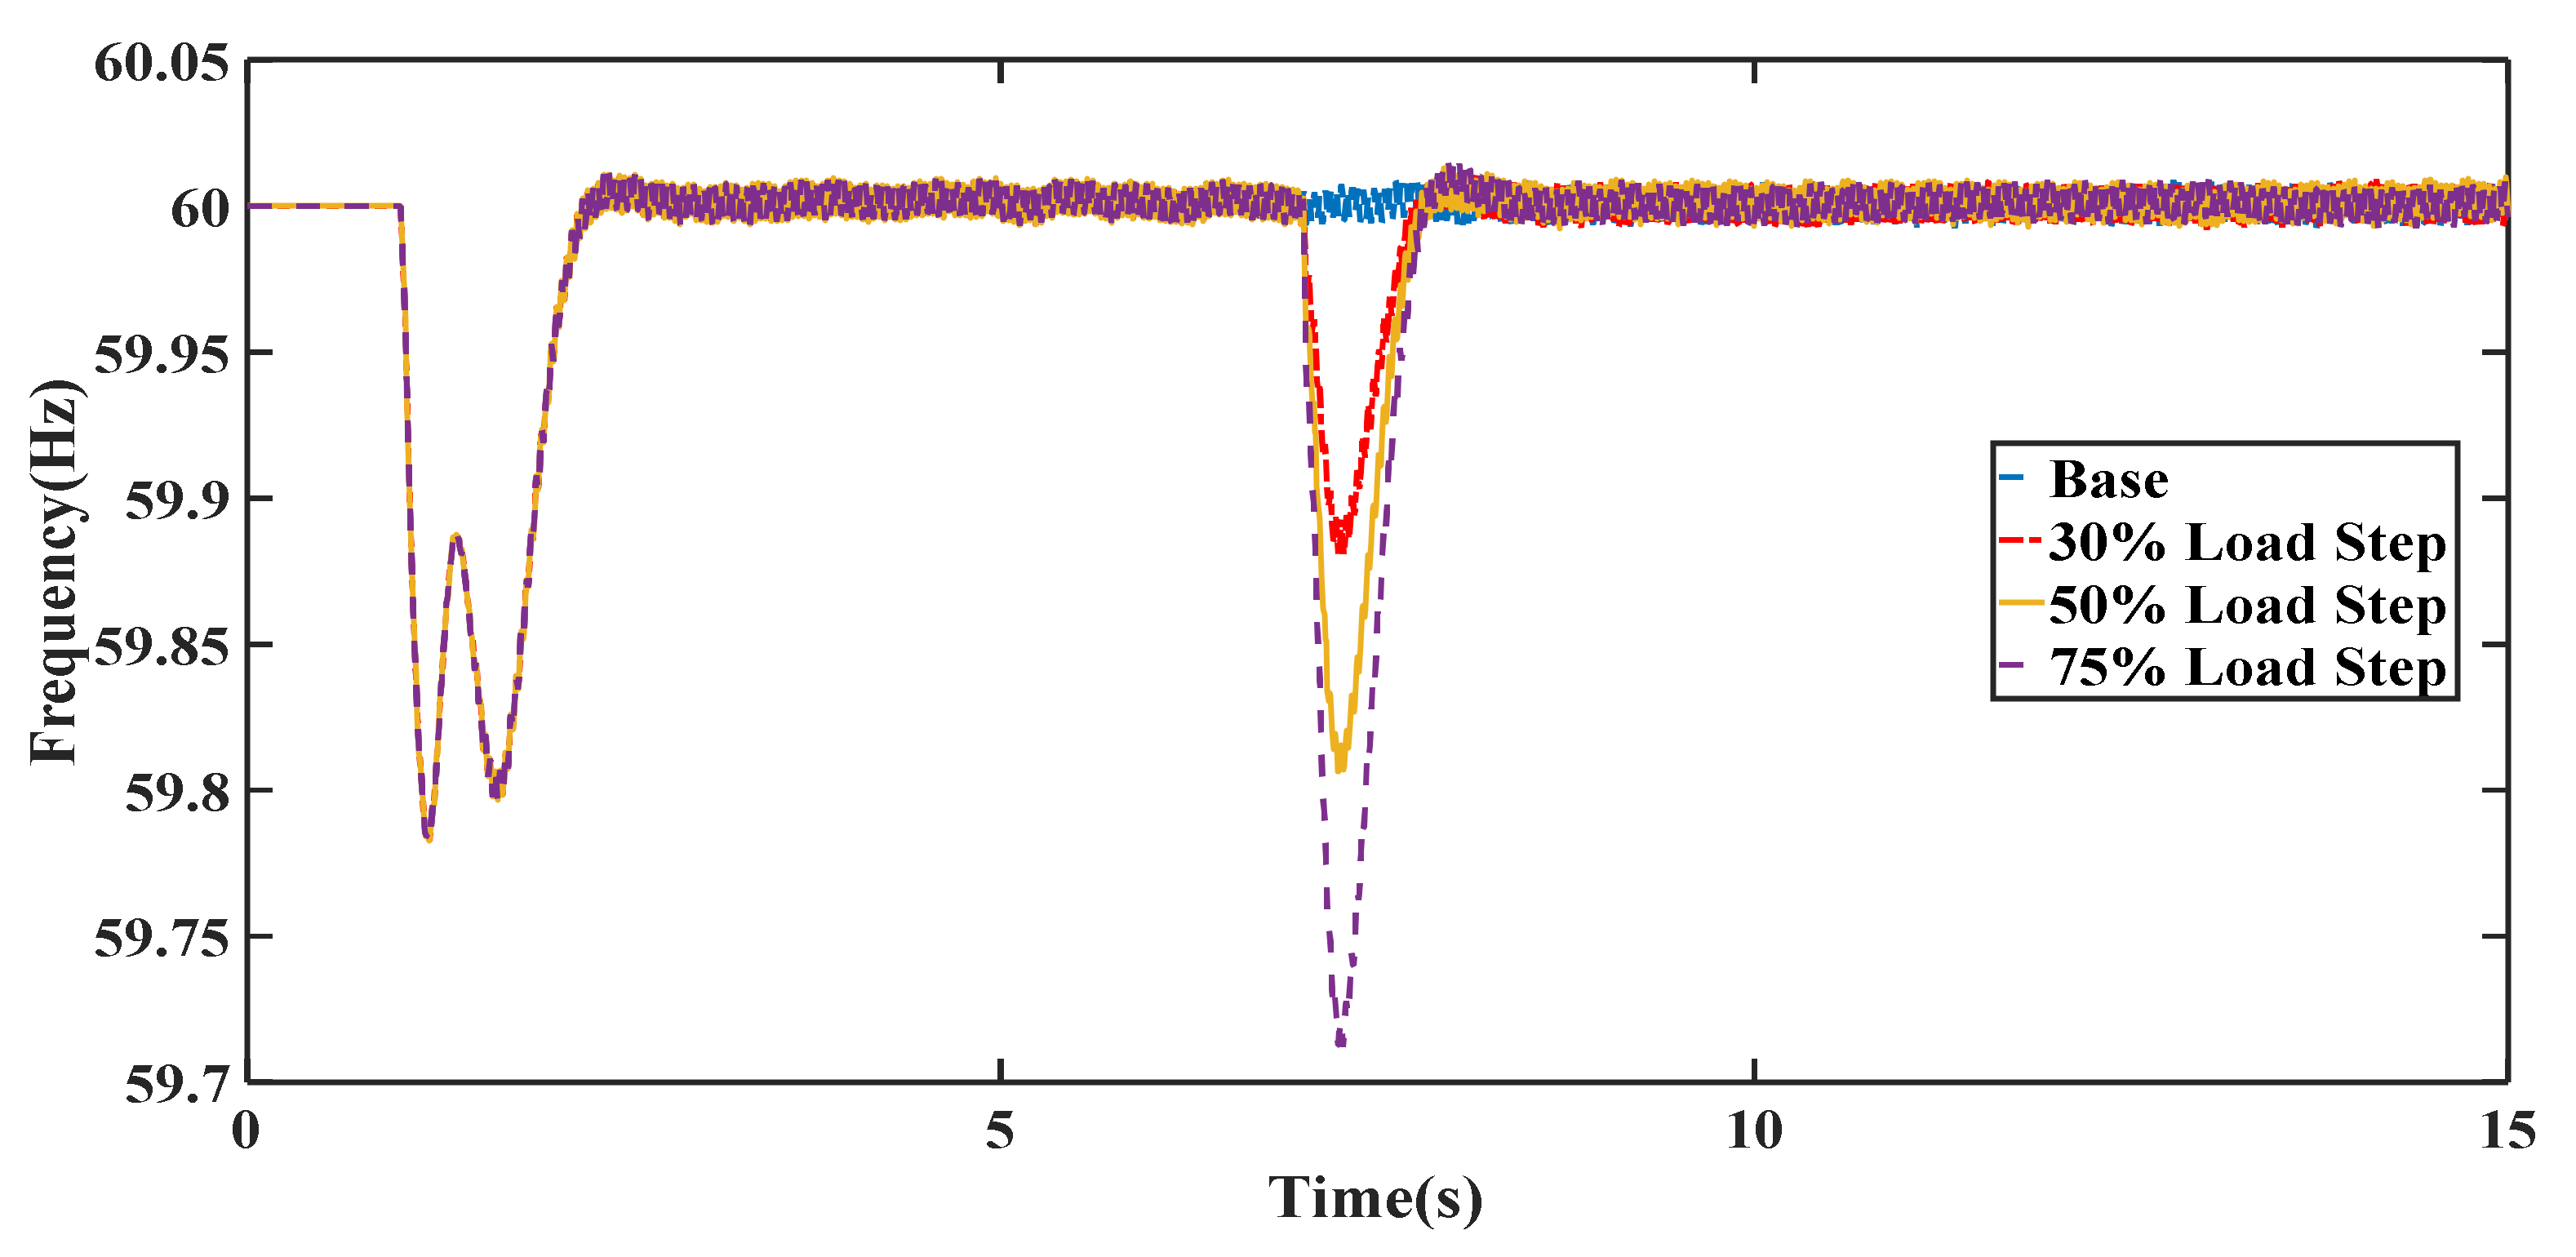
4. Simulation Results and Discussion

Several case studies are introduced to monitor the impact of RESs integration on the frequency stabilization of a hybrid MG. In the first case, MG is separated from the main grid and the effect of this disconnection on the MG’s frequency response is studied. In the following, CHP operates as a rapid energy source to effectively support the frequency response of islanded MG. In addition, the role of grid-forming resources is highlighted. In scenario II, the frequency response for different load steps is discussed, when the microgrid is operated in the islanded mode. In scenario III, the total inertia decreases to 70% of its nominal value, in order to assess the operation of DERs in frequency stability. Furthermore, the load disturbance occurs to assess the event’s sensitivity based on several key performance indicators (KPI), including nadir time ( t nadir ), value of frequency nadir point ( f nadir ), frequency deviation ( Δ f ), and RoCoF ( df / dt ). Scenario III considers the frequency deviation improvement using different penetration levels of DERs, as well as CHPs contribution obtained from the ABC meta-heuristic algorithm. In the final scenario, a different inertia is proposed in order to calculate the power delivery requirement for each DER. Moreover, a relationship between the amount of total inertia and the power delivery requirement for a frequency response is concluded. Power quality, reliability, and the utility grid’s resilience are also considered to show the capability of DERs in the frequency improvement scheme. In this paper, PSCAD software is used to simulate the aforementioned DERs of the hybrid MG, using different libraries according to IEEE standards. Moreover, the MATLAB software is deployed and linked with PSCAD to solve the optimization problem, which will improve the frequency response during various operational conditions.

4.1. Scenario I

In the grid-connected mode, SGs cooperate with active DERs to meet the power demands and support local/residential loads efficiently. Controlled distributed sources are responsible for the production of active and reactive powers in order to keep a reasonable balance between frequency and voltage levels. Grid following (GFL) and grid forming (GFM) are two terms which determine the frequency stability, using a converter interface generator (CIG) concept. Grid-forming resources are deployed in the penetration of one energy source, which can influence the frequency response. On the contrary, inactive resources are introduced as grid followers in the layout of a hybrid MG. During a fault in the main grid, a protection scheme is triggered leading to the switch of point of common coupling (PCC) which creates the islanded mode in the MG. In conventional power systems, power plants can provide enough power to mitigate a frequency collapse. However, inverter-based resources can participate in frequency control effectively, due to their power electronic interface devices. In this scenario, the grid-following resources are penetrated into the MG to supply all loads. In the islanded mode, inverter-based generation resources (IGB) cannot operate alone; therefore, a diesel generator is implemented. One of main purposes of a low-inertia power system is system stability through an appropriate active power injection during unwanted frequency excursion. Set points of DERs can be optimally tuned in order to alleviate the transient frequency response with a proper injected active power from grid-connected to islanded mode.
To show the effect of different DERs in frequency improvement, non-synchronous based generation (NSGs) resources, such as wind farms and PV panels, are utilized. However, they could not efficiently mitigate frequency instability during switching operation from grid-connected to islanded mode. Based on the frequency response in Figure 11, 40% wind penetration and 0.3% PV generation lead to a high RoCoF and low frequency nadir point. From this perspective, the frequency drop can be improved considerably through the deployment of a droop-based DERs, i.e., small scale CHP unit.

4.2. Scenario II

In this scenario, a hybrid MG is separated from the main grid and a load disturbance is applied into the system, in order to investigate the effect of collaboration between various DERs. In this case, CHP is firstly employed to improve the RoCoF and mitigate excessive frequency deviations. The behavior of CHP shows that it can compensate for the frequency nadir by providing the required injected active power. The frequency behavior for different load steps, including 75%, 50%, and 30% is illustrated in Figure 12. It is evident that RoCoF experiences a high value in the presence of a 75% load step, and in the worst situation, it will reach −1.2 Hz/s. It is important to mention that a sufficient threshold is defined as 2 Hz/s, so that each value exceeding this can activate the network protection relays. In addition, the frequency deviation in the presence of CHP, operating as a fast-paced injecting active power resource, in the case of a 30% step load is shown in Figure 13. As the figure implies, inverter-based units cannot effectively participate in frequency stability, compared to that of the droop-based resources, particularly when the distribution coefficients are not performed in this scenario. In the presence of step load changes, SG-based resources could inject the active power with the assist of their governor systems. It is important to mention that additional control strategies can be implemented along with the contribution of the wind farm and solar panels, to improve the frequency response using optimum distribution coefficients, i.e., α 1 , α 2 α n . Finally, Figure 14 illustrates the amount of active power injected by different DERs, including solar panels, DEG, and CHP.

4.3. Scenario III

The objective of this scenario is to study the impact of DERs penetration into the MG, in the case that there is an inertia reduction. In this regard, inverter-based resources, such as wind farm and PV panels, are implemented at a high level of penetration based on its MPPT curve. Figure 15 shows that a 10% load reduction applied into the hybrid MG at t = 7 s can lead to a noticeable frequency excursion. The fully inverter-based generation is not suggested, as it does not bring the frequency back to its nominal value, i.e., 60 Hz, due to the GFL operation of inverter-based structures. Furthermore, this strategy, which consists of solar and wind farm, represents the worst case of overshooting, i.e., 60.69 Hz, due to working on MPPT and lack of kinetic energy. In the following, to mitigate the system frequency excursion, a CHP unit is deployed. This small scale unit compensates for the required active power by the droop control mechanism, so that the frequency deviation could reach 0.02 Hz, which is the most optimal value of frequency changes.
To investigate the contribution of inverter- and droop-based resources, the inertia of the system reduced by 30%, and different combinations of the CHP and wind farm are presented during permissible ranges, based on optimum distribution coefficients tuned by the ABC algorithm. Figure 16 presents the results of the ABC algorithm in finding optimum values of distribution coefficients. Based on this figure, it can be concluded that the most highly penetrated droop-based or inverter-based resources cannot contribute to the desired frequency response. In this regard, 53% of CHP and 5% wind farm penetration are the optimal penetration rate of combined inverter and droop-based resources, which are able to minimize the frequency changes in the presence of a 30% reduction in the inertia of our system. From this perspective, distribution coefficients can be summarized as follows:   α CHP = 0.53 , α DEG = 0.38 ,   α WTG = 0.05 ,   α PV = 0.04 .
In the following, a 52% wind farm and 16% CHP penetration rate is suggested based on the distribution coefficients ( α CHP = 0.16 , α DEG = 0.30 ,   α WTG = 0.52 ,   α PV = 0.02 ), optimized by the ABC in the presence of a 10% load disconnection, as illustrated in Figure 17. This study is carried out to show the contribution of grid-forming and grid-following resources in the mitigation of frequency deviation during various operational conditions, i.e., reduction inertia and step load change. For further description, the RoCoF is plotted in Figure 18 to show the behavior of inverter and droop-based implementation. It can be concluded that the difference between the highest RoCoF (wind farm = 65%, CHP = 0%) and the lowest RoCoF (wind farm = 6%, CHP = 59%) is about 80%.

4.4. Scenario IV

In the last scenario, the collaboration of DERs in the presence of different inertia of the islanded MG is evaluated. It can be argued that the power injected by DERs during different inertia constants depends on the identity of the MG and the network. In this regard, the amount of required power injection for a frequency response has a generally nonlinear behavior, which is determined by distribution coefficients ( α CHP , α DEG ,   α WTG ,   α PV ). This scenario is carried out through changes in the inertia of the utility grid, as well as droop-based DERs. Table 6 is an illustration of the effect of inertia reduction on the frequency response. According to this table, several levels of the loss of SG production, including 50 MW,100 MW, and 300 MW are proposed. In addition, a noticeable lack of load is considered for various inertia constants. It can be concluded from this table that a 2 s inertia case, which is related to both inertia of the main gird and the droop-based DERs, requires a high level of active power injection among other cases due to the most considerable decrease of inertia. It can be argued that the system strength becomes weaker and the MG experiences excessive frequency excursion compared to a higher inertia constant.
The amount of contribution of each droop-based source, which constitutes the total inertia of the hybrid system, is shown in Table 7. Figure 19 shows the frequency response for different inertia constants. It can be concluded that the reduction in the inertia constant of the MG can contribute to a higher frequency excursion and excessive RoCoF. Furthermore, the active power provided by various components of the hybrid MG, including DEG, CHP, solar panels, and wind farm during 100 MW loss, is presented in Figure 20. This is the result of the ABC algorithm in fining optimum distribution coefficients, i.e., α CHP = 0.532 , α DEG = 0.431 ,   α WTG = 0.035 ,   α PV = 0.002 . It is important to state that the active power injection, which is generally regarded as a main characteristic of CIGs, decreases the frequency nadir point, overshoot, and settling time of the frequency response, compared to the synchronous based electric grid. The main purpose of CHP implementation is to reduce operational expenses that can be caused by long settling times and high-frequency nadir points.

5. Conclusions

In this paper, a coordination scheme between various distributed energy resources (DERs) in a hybrid MG was proposed in order to improve the frequency deviation after several events, including switching operation and disconnection form the main grid, load disturbances, and the reduction in the inertia constant of our islanded microgrid. This contribution between different droop-based and inverter-based resources was introduced based on a multi-objective function that was optimized using an ABC meta-heuristic algorithm. Simulation results illustrated that collaboration between droop-based units, i.e., CHP and diesel engine generator (DEG), and inverter-based resources, such as WTG and PV, could mitigate the frequency excursion considerably. In the presence of a 10% load disturbance, it was concluded that optimum distribution coefficients (   α CHP = 0.53 , α DEG = 0.38 ,   α WTG = 0.05 ,   α PV = 0.04 ) could decrease the frequency nadir point, overshoot, and settling time of the frequency response compared to the non-optimum selection of DER coefficients in the frequency response. Moreover, in the case of a 30% reduction in total inertia of the MG system, optimum contribution of the aforementioned DERs ( α CHP = 0.16 , α DEG = 0.30 ,   α WTG = 0.52 ,   α PV = 0.02 ) assists the MG in preventing any excessive frequency deviation and system instability.

Author Contributions

Conceptualization, M.A. and A.A.; methodology, M.A.; software, M.A. and A.A.; validation, A.O. and M.G.; formal analysis, A.A. and A.O.; investigation, M.G. and S.M.M.; resources, M.A. and A.A.; data curation, M.A. and A.O.; writing—original draft preparation, A.A. and M.G.; writing—review and editing, M.G. and S.M.M.; supervision, S.M.M.; project administration, S.M.M. All authors have read and agreed to the published version of the manuscript.

Funding

This research received no external funding.

Conflicts of Interest

The authors declare no conflict of interest.

Abbreviations

MGMicrogrid
RESRenewable Energy Sources
FCASFrequency Control Ancillary Services
DERDistributed Energy Resources
PEIGPower Electronic Interferences Generation
RoCoFRate of Change of Frequency
ABCArtificial Bee Colony
DGDistributed Generation
CHPCombined Heat and Power
WTGWind turbine Generator
WECSWind Energy Conversion System
MPPTMaximum Power Point Tracking
PVPhotovoltaic Panles
LFCLoad Frequency Control
MOFMulti-Objective Function
SGSynchronous Generator
DEGDiesel Engine Generator
DFIGDoubly Fed Induction Generator
GSCGrid Side Converter
RSCRotor Side Converter
ISEIntegral Square Error
KPIKey Performance Indicator
GFLGrid Following
GFMGrid Forming
CIGConverter Interface Generator
PCCPoint of Common Coupling
IGBInverter-based Generation Resources
NSGNon-synchronous Based Generation

References

  1. Nejabatkhah, F. Overview of control, integration and energy management of microgrids. J. Mod. Power Syst. Clean Energy 2014, 2, 212–222. [Google Scholar]
  2. Tayyebi, A.; Groß, D.; Anta, A.; Kupzog, F.; Dörfler, F. Frequency Stability of Synchronous Machines and Grid-Forming Power Converters. IEEE J. Emerg. Sel. Top. Power Electron. 2020, 8, 1004–1018. [Google Scholar] [CrossRef] [Green Version]
  3. Ortiz-Villalba, D.; Rahmann, C.; Alvarez, R.; Canizares, C.A.; Strunck, C. Practical Framework for Frequency Stability Studies in Power Systems with Renewable Energy Sources. IEEE Access 2020, 8, 202286–202297. [Google Scholar] [CrossRef]
  4. Milano, F.; Dörfler, F.; Hug, G.; Hill, D.J.; Verbič, G. Foundations and Challenges of Low-Inertia Systems (Invited Paper). In Proceedings of the 2018 Power Systems Computation Conference (PSCC), Dublin, Ireland, 11–15 June 2018. [Google Scholar]
  5. Kenyon, R.W.; Hoke, A.; Tan, J.; Hodge, B. Grid-Following Inverters and Synchronous Condensers: A Grid-Forming Pair. In Proceedings of the 2020 Clemson University Power Systems Conference (PSC), Clemson, SC, USA, 10–13 March 2020; pp. 1–7. [Google Scholar]
  6. Fernández-Guillamón, A.; Gómez-Lázaro, E.; Muljadi, E.; Molina-García, Á. Power systems with high renewable energy sources: A review of inertia and frequency control strategies over time. Renew. Sustain. Energy Rev. 2019, 115, 109369. [Google Scholar] [CrossRef] [Green Version]
  7. Nguyen, H.T.; Yang, G.; Nielsen, A.H.; Jensen, P.H.; Pal, B. Applying Synchronous Condenser for Damping Provision in Converter-Dominated Power System. J. Mod. Power Syst. Clean Energy 2020, 9, 639–647. [Google Scholar] [CrossRef]
  8. Ademola-Idowu, A.; Zhang, B. Frequency Stability Using MPC-Based Inverter Power Control in Low-Inertia Power Systems. IEEE Trans. Power Syst. 2021, 36, 1628–1637. [Google Scholar] [CrossRef]
  9. Unruh, P.; Nuschke, M.; Strauß, P.; Welck, F. Overview on Grid-Forming Inverter Control Methods. Energies 2020, 13, 2589. [Google Scholar] [CrossRef]
  10. Schneider, K.P.; Radhakrishnan, N.; Tang, Y.; Tuffner, F.K.; Liu, C.-C.; Xie, J.; Ton, D. Improving Primary Frequency Response to Support Networked Microgrid Operations. IEEE Trans. Power Syst. 2019, 34, 659–667. [Google Scholar] [CrossRef]
  11. Abazari, A.; Dozein, M.G.; Monsef, H. A New Load Frequency Control Strategy for an AC Micro-grid: PSO-based Fuzzy Logic Controlling Approach. In Proceedings of the 2018 Smart Grid Conference (SGC), Sanandaj, Iran, 28–29 November 2018; pp. 1–7. [Google Scholar]
  12. Abazari, A.; Dozein, M.G.; Monsef, H.; Wu, B. Wind turbine participation in micro-grid frequency control through self-tuning, adaptive fuzzy droop in de-loaded area. IET Smart Grid 2019, 2, 301–308. [Google Scholar] [CrossRef]
  13. Abazari, A.; Soleymani, M.M.; Babaei, M.; Ghafouri, M.; Monsef, H. High penetrated renewable energy sources-based AOMPC for microgrid’s frequency regulation during weather changes, time-varying parameters and generation unit collapse. IET Gener. Transm. Distrib. 2020, 14, 5164–5182. [Google Scholar] [CrossRef]
  14. Rakhshani, E.; Rodriguez, P. Active power and frequency control considering large scale RES. In Large Scale Renewable Power Generation: Advances in Technologies for Generation Transmission and Storage; Springer: Singapore, 2013. [Google Scholar]
  15. Gu, H.; Yan, R.; Saha, T.K. Minimum Synchronous Inertia Requirement of Renewable Power Systems. IEEE Trans. Power Syst. 2018, 33, 1533–1543. [Google Scholar] [CrossRef] [Green Version]
  16. Alaboudy, A.H.K.; Zeineldin, H.H.; Kirtley, J.L. Microgrid stability characterization subsequent to fault-triggered islanding incidents. IEEE Trans. Power Del. 2012, 27, 658–669. [Google Scholar] [CrossRef]
  17. Oshnoei, A.; Kheradmandi, M.; Muyeen, S.M. Robust control scheme for distributed battery energy storage systems in load frequency control. IEEE Trans. Power Syst. 2020, 35, 4781–4791. [Google Scholar] [CrossRef]
  18. Meegahapola, L.; Flynn, D. Impact on transient and frequency stability for a power system at very high wind penetration. In Proceedings of the IEEE PES General Meeting, Minneapolis, MN, USA, 24–28 June 2010; pp. 1–8. [Google Scholar]
  19. Oshnoei, A.; Kheradmandi, M.; Muyeen, S.M.; Hatziargyriou, N. Disturbance Observer and Tube-based Model Predictive Controlled Electric Vehicles for Frequency Regulation of an Isolated Power Grid. IEEE Trans. Smart Grid. 2021, 10, 1. [Google Scholar] [CrossRef]
  20. Lal, D.K.; Barisal, A.K. Load frequency control of AC microgrid interconnected thermal power system. IOP Conf. Ser. Mater. Sci. Eng. 2017, 225, 012090. [Google Scholar] [CrossRef]
  21. Cam, E.; Kocaarslan, I. Load frequency control in two area power systems using fuzzy logic controller. Energy Convers. Manag. 2005, 46, 233–243. [Google Scholar] [CrossRef]
  22. Schonbergerschonberger, J.; Duke, R.; Round, S.D. DC-bus signaling: A distributed control strategy for ahybrid. IEEE Trans. Ind. Electron. 2006, 53, 1453–1460. [Google Scholar] [CrossRef]
  23. Khooban, M.H.; Niknam, T.; Blaabjerg, F.; Davari, P. A robust adaptive load frequency control for micro-grids. ISA Trans. 2016, 65, 220–229. [Google Scholar] [CrossRef] [PubMed]
  24. Yang, J.; Zhili, Z.; Yufei, T.; Jun, Y.; Haibo, H.; Yunliang, W. Load frequency control in isolated micro-grids with electrical vehicles based on multivariable generalized predictive theory. Energies 2015, 8, 2145–2164. [Google Scholar] [CrossRef]
  25. Zhang, S.; Tang, T.; Song, B.; Lu, S.; Ye, B. Stable adaptive PI control for permanent magnet synchronous motor drive based on improved JITL technique. ISA Trans. 2013, 54, 539–549. [Google Scholar] [CrossRef] [PubMed]
  26. Yaseli:, E. Interval type-2 fuzzy PID load frequency controller using big bang-big crunch optimization. App. Soft. Comp. 2014, 15, 100–112. [Google Scholar]
  27. Massucco, S.; Pitto, A.; Silvestro, F. A gas turbine model for studies on distributed generation penetration into distribution networks. IEEE Trans. Power Syst. 2011, 26, 992–999. [Google Scholar] [CrossRef]
  28. Sun, T.; Lu, J.; Li, Z.; Lubkeman, D.L.; Lu, N. Modeling Combined Heat and Power Systems for Microgrid Applications. IEEE Trans. Smart Grid 2018, 9, 4172–4180. [Google Scholar] [CrossRef]
  29. Hossein, J.M.; Pota, H.R.; Mahmud, M.A.; Aldeen, M. Robust control for power sharing in microgrids with low-inertia wind and PV generators. IEEE Trans. Sustain. Energy 2015, 6, 1067–1077. [Google Scholar] [CrossRef]
  30. Abazari, A.; Dozein, M.G.; Monsef, H. An optimal fuzzy-logic based frequency control strategy in a high wind penetrated power system. J. Frankl. Inst. 2018, 355, 6262–6285. [Google Scholar] [CrossRef]
  31. Abazari, A.; Monsef, H.; Wu, B. Load frequency control by de-loaded wind farm using the fuzzy-based PID droop controller. IET Renew. Power Generat. 2018, 13, 180–190. [Google Scholar] [CrossRef]
  32. Vidyanandan, K.V.; Senroy, N. Primary frequency regulation by deloaded wind turbines using variable droop. IEEE Trans. Power Syst. 2013, 28, 837–846. [Google Scholar] [CrossRef]
  33. Datta, M.; Senju, T. Fuzzy control of distributed PV inverters/energy storage systems/ electric vehicles for frequency regulation in a large power system. IEEE Trans. Smart Grid 2013, 1, 479–488. [Google Scholar] [CrossRef]
  34. Taghizadeh, M.; Mardaneh, M.; Sadeghi, M.S. Frequency control of a new topology in proton exchange membrane fuel cell/wind turbine/photovoltaic/ultra capacitor/ battery energy storage system based isolated networks by a novel intelligent controller. J. Renew. Sustain. Energy 2014, 6, 53121. [Google Scholar] [CrossRef]
  35. Oshnoei, A.; Kheradmandi, M.; Oshnoei, S. Optimal model predictive control of photovoltaic plants for frequency regulation in an interconnected power system. In Proceedings of the 34th International Power System Conference (PSC), Tehran, Iran, 9–11 December 2019; pp. 428–433. [Google Scholar]
  36. Machowski, J.; Lubosny, Z.; Bialek, J.; Bumby, J.R. Power System Dynamics: Stability and Control; Wiley: Hoboken, NJ, USA, 2020. [Google Scholar]
  37. Kundur, P.; Balu, N.J.; Lauby, M.G. Power System Stability and Control; McGraw-Hill: New York, NY, USA, 1994. [Google Scholar]
  38. Task Force on Turbine Governor Modeling; Power System Dynamic Performance Committee; Power System Stability Subgroup. Dynamic Models for Turbine-Governors in Power System Studies. Available online: https://resourcecenter.ieee-pes.org/publications/technical-reports/PESTR1.html (accessed on 2 June 2021).
  39. IEEE Recommended Practice for Excitation System Models for Power System Stability Studies. Available online: https://www.semanticscholar.org/paper/IEEE-recommended-practice-for-excitation-system-for-Board/05bc9ef274285d8be39c5aa0ff9fe0611a6c7874 (accessed on 5 June 2021).
  40. Tapia, G.; Tapia, A.; Ostolaza, J.X. Two alternative modeling approaches for the evaluation of wind farm active and reactive power performance. IEEE Trans. Energy Convers. 2006, 21, 909–920. [Google Scholar] [CrossRef]
  41. Boldea, I. Variable Speed Generator; Taylor & Francis Group: New York, NY, USA, 2006. [Google Scholar]
  42. Xing, P.; Fu, L.; Wang, G.; Wang, Y.; Zhang, Y. A compositive control method of low-voltage ride through for PMSG-based wind turbine generator system. Gener. Transm. Distrib. IET 2018, 12, 117–125. [Google Scholar] [CrossRef]
  43. Pena, R.; Clare, J.C.; Asher, G.M. Doubly fed induction generator using back-to-back PWM converters and its application to variable-speed wind-energy generation. Proc. Inst. Elect. Eng. 1996, 143, 231–241. [Google Scholar] [CrossRef] [Green Version]
  44. Qiao, W.; Zhou, W.; Aller, J.M.; Harley, R.G. Wind speed estimation based sensorless output maximization control for a wind turbine driving a DFIG. IEEE Trans. Power Electron. 2008, 23, 1156–1169. [Google Scholar] [CrossRef]
  45. Karaboga, D.; Basturk, B. A powerful and efficient algorithm for numerical optimization: Artificial bee colony (ABC). J. Glob. Optim. 2007, 39, 459–471. [Google Scholar] [CrossRef]
Figure 1. Overall layout of a combined heat and power (CHP) unit.
Electronics 10 01591 g001
Figure 2. Dynamic model of governor and turbine in a CHP unit.
Electronics 10 01591 g002
Figure 3. Dynamic model of a steam turbine model.
Electronics 10 01591 g003
Figure 4. AC4A Exciter type model.
Electronics 10 01591 g004
Figure 5. Control loop related to stator reactive power.
Electronics 10 01591 g005
Figure 6. Control loop related to stator active power.
Electronics 10 01591 g006
Figure 7. Overall control framework of doubly fed induction generator (DFIG).
Electronics 10 01591 g007
Figure 8. Overall control framework of the DFIG.
Electronics 10 01591 g008
Figure 9. The layout of hybrid MG connected to a power system using distribution coefficients in frequency excursion improvement.
Electronics 10 01591 g009
Figure 10. The flowchart of ABC algorithm.
Electronics 10 01591 g010
Figure 11. Frequency deviation with and without CHP contribution.
Electronics 10 01591 g011
Figure 12. MG frequency excursion for various load steps in the islanded mode.
Electronics 10 01591 g012
Figure 13. Excessive frequency excursion due to lack of CHP collaboration in islanded mode.
Electronics 10 01591 g013
Figure 14. (a) CHP unit power delivered for different load steps. (b) Active power injection by diesel engine generator during various load steps. (c) Wind farm power injection during various load steps. (d) Solar panel power injection during various load steps.
Electronics 10 01591 g014
Figure 15. Frequency deviation due to 10% load disconnection in the presence of different DER contributions.
Electronics 10 01591 g015
Figure 16. Frequency devotion due to the 30% reduction in system inertia for different combinations of inverter-based and droop-based strategies.
Electronics 10 01591 g016
Figure 17. Frequency deviation due to the 10% load changes in the presence of different combinations of inverter-based and droop-based strategies.
Electronics 10 01591 g017
Figure 18. Rate of Change of Frequency (RoCoF) intended for various combinations of droop- and inverter-based structures during the –10% load step change.
Electronics 10 01591 g018
Figure 19. Frequency deviation during 100 MW SG outage in the presence of different values of inertia constants.
Electronics 10 01591 g019
Figure 20. (a) Active power injected by CHP in the islanded MG unit during various inertia constants. (b) Diesel Unit Power Delivery for different Inertia-100 MW SG Loss. (c) Wind farm Unit Power Delivery for different Inertia-100 MW SG Loss. (d) Solar Unit Power Delivery for different Inertia-100 MW SG Loss.
Electronics 10 01591 g020
Table 1. Governor-turbine parameters of the MG’s CHP.
DescriptionSymbolValue
Proportional gain K p 40
Integral time constant K i 0.2
Lead–Lag time constant T 1 T 2 0.2
Turbine time constant T 3 T 4 0.1
Table 2. Parameters of 6th model of synchronous generator.
DescriptionSymbolValue
Rated RMS line-neutral voltage V base 66.47 [kV]
Rated RMS line current I base 0.7 [kA]
Inertia constant H 3.85 [s]
Mechanical friction D 0.01 [pu]
Armature resistance R a 0.003 [pu]
Poitier reactance X p 0.11 [pu]
Unsaturated reactance X d 1.79 [pu]
Unsaturated transient reactance X d 0.24 [pu]
Unsaturated transient time (Open) T do 5.9 [s]
Unsaturated sub-transient reactance X d 0.185 [pu]
Unsaturated sub-transient time (Open) T do 0.033 [s]
Unsaturated reactance X q 1.64 [pu]
Unsaturated transient reactance X q 0.38 [pu]
Unsaturated transient time (Open) T qo 0.54 [s]
Unsaturated sub-transient reactance X q 0.185 [pu]
Unsaturated sub-transient time (Open) T qo 0.076 [s]
Table 3. Steam turbine parameters used in the microgrid.
DescriptionSymbolValue
Steam chest time constant T 4 0.2
Reheater time constant T 5 0.2
Reheater/cross-over time constant T 6 1.0
Over-heater time constant T 7 1.0
Turbine (HP + LP) initial output power P mo 1.0
Different fraction for LP and HP stages(p.u.) K 1 K 8 0.125
Table 4. Excitation system parameters.
Description.SymbolValue
Lead time constant T C 1.0 s
Lag time constant T B 10 s
Regulator integral gain K A 200 p.u.
Regulator time constant T A 0.015
Rectifier loading factor K C 0.2 p.u.
Transducer time constant T R 0.1 s
Upper limit on error signal V IMAX 10
Lower limit on error signal V IMIN −10
Maximum regulator output V RMAX 5.64
Minimum regulator output V RMIN −4.53
Table 5. The parameters of the DFIG.
WTG Parameters.SymbolValues
Rated power P base 15 MW
LL Voltage V base 0.69 kV
Base Angular Frequency f main 60 Hz
Stator/Rotor turns ratio TRN 0.85
Angular moment of inertia(j = 2 h) J WTG 0.6
Mechanical Damping D WTG 0.0001 p.u
Stator ResistanceR10.0054 p.u
Wound rotor resistanceR20.00607 p.u
First Squirrel cage resistanceR30.298 p.u
Magnetizing Inductance X md 4.5
Stator leakage inductance X a 0.10
Wound rotor Leakage inductance X kd 1 0.11
First Cage Leakage Inductance X kd 2 0.05
Converter ParametersSymbolValues
Convertor reactor L conv 0.00134 H
Capacitance C dc 50,000 μF
Machine terminal Voltage V LL 0.69 KV
Stator resistance R st 0.0054 p.u
Table 6. Frequency Response Requirement for different values of inertia and generation loss.
Total System InertiaReduced InertiaΔP(MW)
Response Requirement
Based on the SecondUtility GridDroop-Based DERs50 MW SG Loss
(42% of Total Capacity)
100 MW SG Loss
(55% of Total Capacity)
300 MW SG Loss
(59% of Total Capacity)
100 MW Load Step
(83% of Total Load)
1559 MW100 MW215 MW98 MW
8-Normal 54 MW99 MW214 MW103 MW
6 55 MW99 MW216 MW103.5 MW
5 54 MW100 MW203 MW104 MW
254 MW102 MW206 MW104 MW
Table 7. Different Values Implemented for Inertia H(s).
H(s)SGDiesel GeneratorCHP
154.964.964.96
83.961.962.31
61.731.962.31
53.960.50.5
21.00.50.5
Publisher’s Note: MDPI stays neutral with regard to jurisdictional claims in published maps and institutional affiliations.

