Article

Dynamics of Medical Screening: A Simulation Model of PSA Screening for Early Detection of Prostate Cancer

by
Özge Karanfil
1,2,3
1
College of Administrative Sciences and Economics, Koç University, Istanbul 34450, Turkey
2
Research Center for Translational Medicine (KUTTAM), Koç University, Istanbul 34450, Turkey
3
School of Medicine, Koç University, Istanbul 34450, Turkey
Systems 2023, 11(5), 252; https://doi.org/10.3390/systems11050252
Submission received: 3 March 2023 / Revised: 2 May 2023 / Accepted: 10 May 2023 / Published: 16 May 2023
(This article belongs to the Special Issue System Dynamics Models for Public Health and Health Care Policy)

Abstract

:
In this study, we present a novel simulation model and case study to explore the long-term dynamics of early detection of disease, also known as routine population screening. We introduce a realistic and portable modeling framework that can be used for most cases of cancer, including a natural disease history and a realistic yet generic structure that allows keeping track of critical stocks that have been generally overlooked in previous modeling studies. Our model is specific to prostate-specific antigen (PSA) screening for prostate cancer (PCa), including the natural progression of the disease, respective changes in population size and composition, clinical detection, adoption of the PSA screening test by medical professionals, and the dissemination of the screening test. The key outcome measures for the model are selected to show the fundamental tradeoff between the main harms and benefits of screening, with the main harms including (i) overdiagnosis, (ii) unnecessary biopsies, and (iii) false positives. The focus of this study is on building the most reliable and flexible model structure for medical screening and keeping track of its main harms and benefits. We show the importance of some metrics which are not readily measured or considered by existing medical literature and modeling studies. While the model is not primarily designed for making inferences about optimal screening policies or scenarios, we aim to inform modelers and policymakers about potential levers in the system and provide a reliable model structure for medical screening that may complement other modeling studies designed for cancer interventions. Our simulation model can offer a formal means to improve the development and implementation of evidence-based screening, and its future iterations can be employed to design policy recommendations to address important policy areas, such as the increasing pool of cancer survivors or healthcare spending in the U.S.

1. Introduction and Motivation

Decades after routine medical screening became common, our understanding of screening and its consequences remains limited. Over the last few decades, the criteria for screening for several disorders have changed significantly, including thresholds dividing positive from negative test results and the recommended ages for routine screening. Major health organizations have recommended changes in several common disease definitions, often resulting in the expansion of the criteria for screening, diagnosis, and treatment, generally leading to increases in reported incidence and prevalence [1,2].
PCa is the second most frequently diagnosed cancer in men, and about two-thirds of these are diagnosed in high-income countries where 18% of the world’s male population resides, with much of the variation reflecting differences in the use of PSA testing [3]. In the U.S., approximately 90% of PCa is detected by means of screening. The lifetime risk of receiving a diagnosis of PCa nearly doubled after the introduction of prostate-specific antigen (PSA) testing and increased from approximately 9% in 1985 [4] to 16% in 2007 [5]. The value of PSA screening to reduce deaths from PCa while balancing potential harms remains controversial, and routine screening is not recommended in many European countries [6,7]. In the U.S., the U.S. Preventive Services Task Force (USPSTF) recommends that average-risk men aged 55–69 have a conversation with their healthcare provider about the benefits and limitations of PSA testing to make an informed decision about whether to be tested based on their personal values and preferences [8]. Based on 2017–2019 data, approximately 12.6 percent of U.S. men will be diagnosed with PCa at some point during their lifetime, with an estimated 3.3 million men living with PCa [9].
In this study, we present an extended case study specific to the PSA screening for PCa, with the end goal of building a sound dynamic theory firmly grounded in empirical evidence and data to explain both the core harm-and-benefit issues and the natural disease progression and dissemination of the PSA screening practice among clinicians and the general population. The PSA case study includes a natural history disease progression model for PCa and a behavioral theory explaining how guidelines change over time in response to changes in the evidence. These in turn depend on the fundamental tradeoff between test sensitivity and specificity, the natural progression of the disease, and changes in population size and composition. While PSA screening is not specific to the U.S., we mainly treat the problem within the U.S. context where early detection of disease is most controversial. Our model has a natural history disease model at its core as well as a classical evidence-based dynamic theory for evolving screening indications, and interventions such as screening are superimposed on the natural history model based on available evidence. The natural history model has two stages, locoregional (M0) and distant (M1), and three grades (high, low, and indolent) of disease can both be screen- or clinically detected. The fundamental approach and assumptions for screening and its adoption/dissemination are explained, while the various assumptions and propositions are supported by reference to the modeling and medical literature. Model behavior shows reasonable correspondence to historical screening trends in the U.S.

2. Methodology and Background of Systems Models for Cancer

We use the system dynamics (SD) modeling approach to complex systems to explain the dissemination of medical screening for cancer within the U.S. context, supported by qualitative data [10,11]. Modeling of PCa in this study draws on an extensive body of SD work on healthcare issues across various domains and SD has been increasingly used to model many public health and healthcare issues [12,13,14,15,16,17,18,19,20,21]. A full recent account on SD applications in health and medicine can be found in Darabi and Hosseinichimeh [22]. Problems around early detection of disease are particularly suited to SD modeling because of the presence of many time-related phenomena, delayed feedback, and nonlinearities, such as varying trends in screening dissemination and population structure, and the delays associated with disease progression, translation of evidence, and policy-making efforts. SD methodology employs a series of guidelines for the model-building process, and a variety of tests and types of evidence organized around the purpose of the model that serve to increase confidence in model structure and dynamic theory [11,23,24].
The first attempt at a systems model of cancer was undertaken by Richmond, demonstrating a structural model for cancer development [25]. Fett built two SD models to examine breast cancer screening for public health policy analysis [26,27]. Fett et al. [27] represented a model with multiple stages of breast cancer that could be used to examine the Australian breast cancer screening program. There have been a few other SD studies involving population health screening: chlamydia, cervical cancer, or diabetes screening, and decision/referral thresholds in developmental and behavioral screening such as autism [28,29,30]. Royston et al. [28] used SD models to test alternative policies for cervical cancer and chlamydia screening. The U.K. Department of Health found the results to be useful for the development of screening guidelines. Policy questions included the optimal screening interval and coverage. The results suggested that it is more effective to increase the screening coverage than to decrease the screening interval. More recently, Palma and Lounsbury et al. [31] built an SD model for PCa that replicates the Prostate, Lung, Colorectal, and Ovarian (PLCO) cancer screening trial to assess the benefits of PSA screening for PCa-specific mortality.
Karanfil and Sterman [32] provide the foundations for the development of evidence-based screening guidelines for the early detection of disease. They develop and test an endogenous theory for population screening and present a stylized model to explore and formalize the guideline formation process. In this study we are expanding the boundaries of this classical evidence-based model for screening to create a more realistic life setting and present a case study for cancer, particularly focusing on the adoption and diffusion dynamics of PSA screening for PCa in the U.S. context. We tie the generic model presented by [32,33] to a natural history model for PCa that simulates the population-level changes in screening and dissemination. The range of screening indications in the model includes the biopsy referral threshold and the recommended starting age.

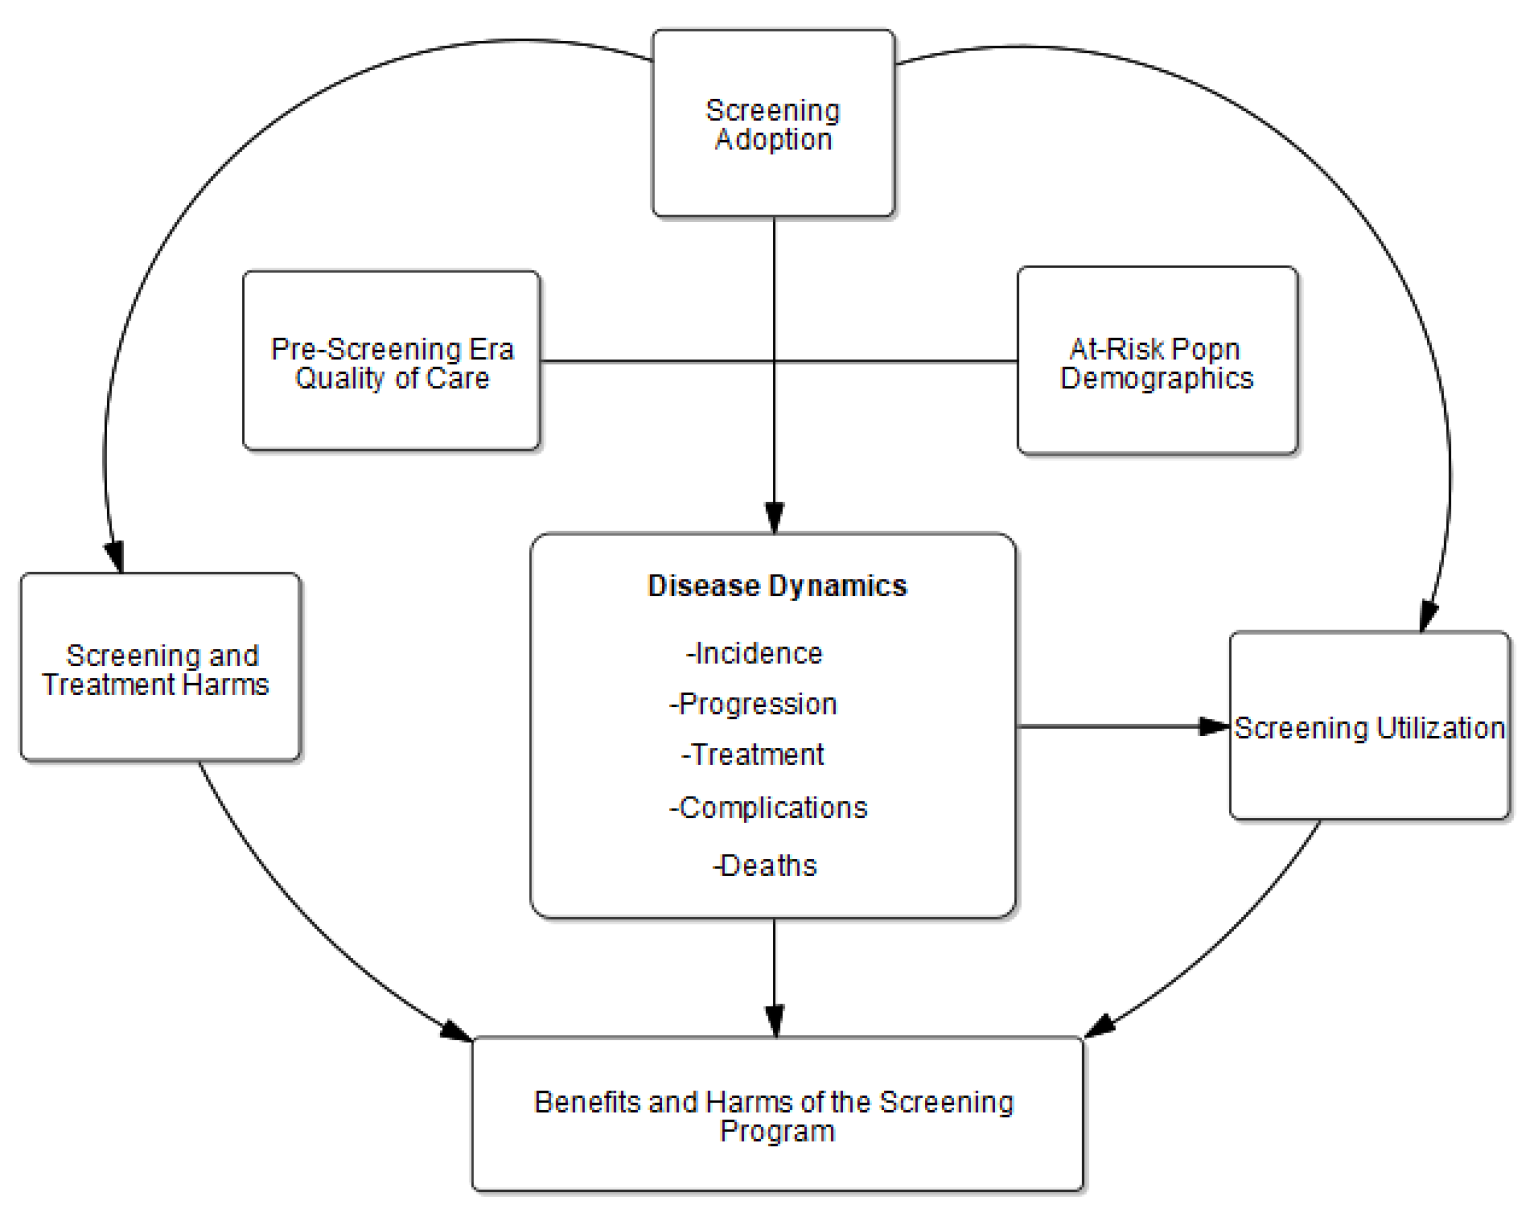
3. Overview of the PSA Screening Model

We demonstrate correspondence to historical data on various metrics including population counts, death rates, and some metrics on disease progression. Then, policy-relevant factors and analysis in the base run will be shown, which replicates history and shows the future trajectory. The case study model for PSA screening consists of six fundamental sectors, including the dynamics of the U.S. male population and natural history of disease; screening and clinical detection; treatment; screening dissemination; harm reduction technology; and the PSA screening harms and benefits. The fundamental approach, sector diagrams, and assumptions for each sector with critical formulations are explained in the Supplementary Materials. The various assumptions and propositions are supported by references to the modeling and medical literature.

3.1. Data Types and Inputs

Data used in this study are from multiple sources. Some are secondary data based on the literature, such as medical articles and reports we accessed directly. Others are composite data, which we obtained by combining several data points to support the model design. Most of the historical population and PCa trends are widely available on organization websites such as the NCI, CDC, NHANES, U.S. mortality files by the NCHS, NCI-SEER database, and NHIS. Complementary data were gathered from a literature review of the history of PSA screening in the U.S. To bring the model assumptions and findings closer to the real trends and to support the emerging model structure, we collected additional data through interviews with domain experts from medical and healthcare professions [33]. Figure 1 presents the conceptual framework used for modeling PCa’s natural history, screening, adoption, utilization, harms, and benefits. Table 1 lists important model inputs and references used throughout the paper with the range used for sensitivity analysis, as well as associated data sources.

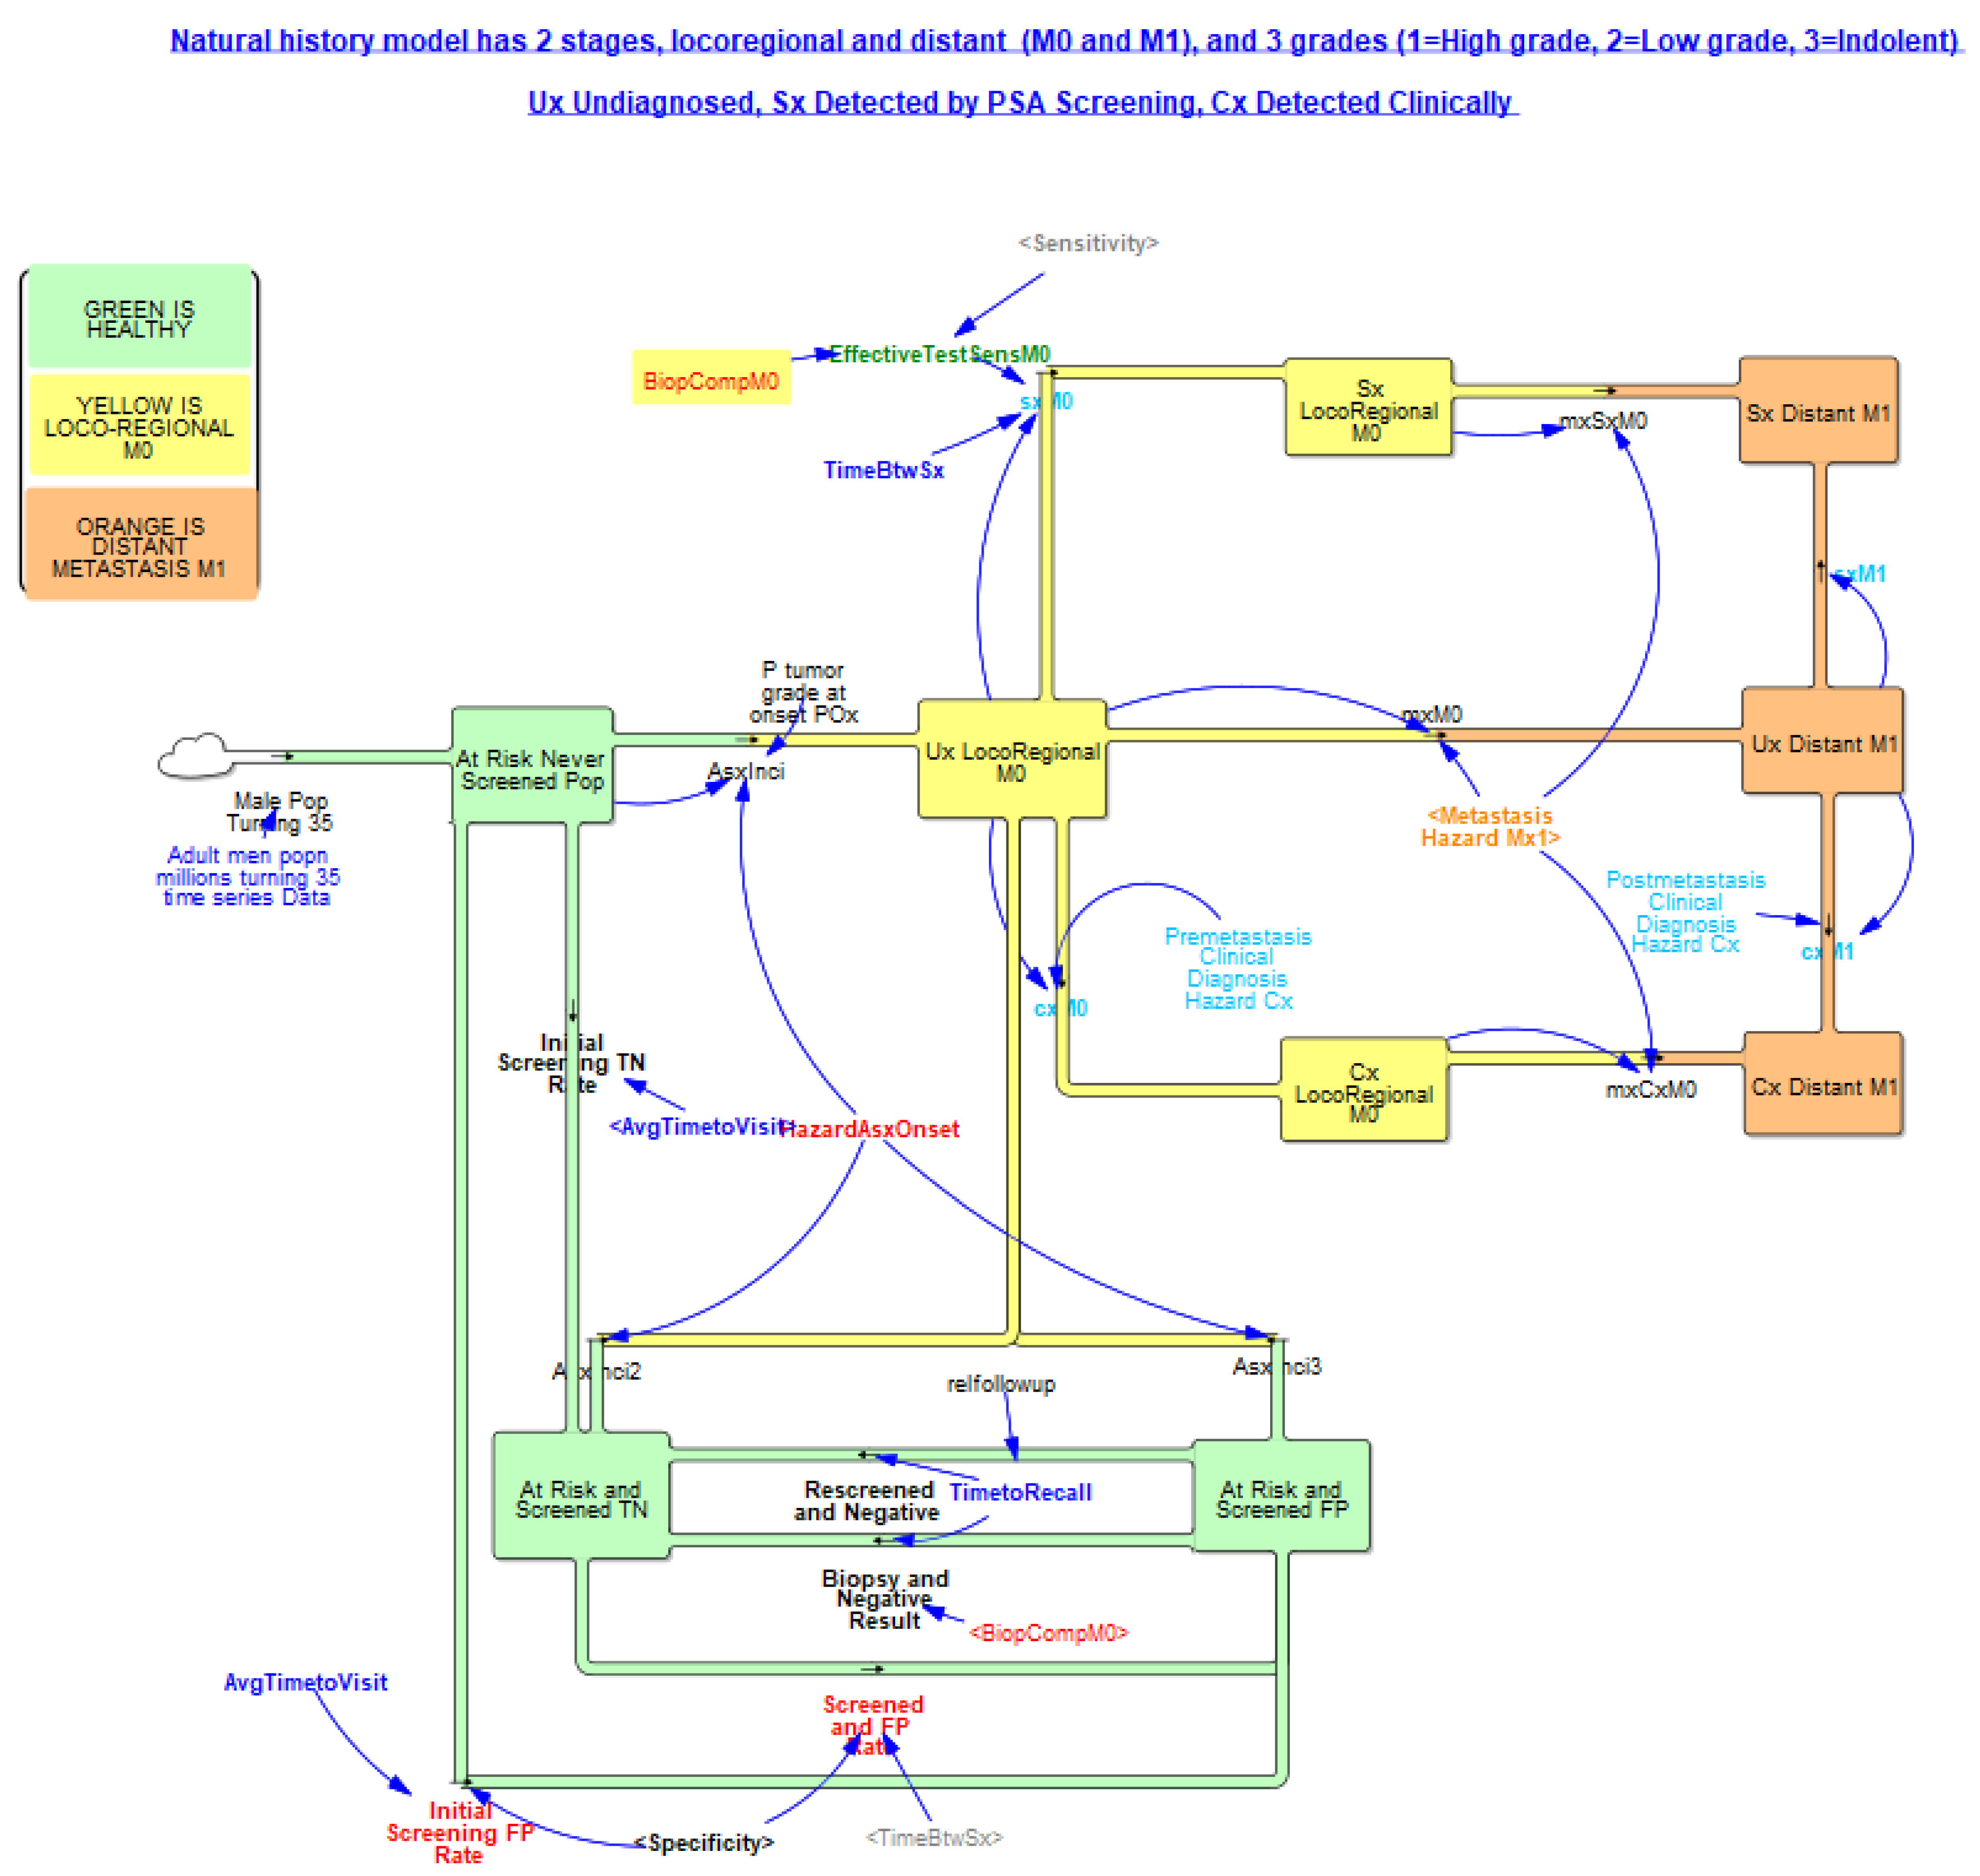
3.2. Population and Natural History of Disease

3.2.1. Population Increase and Aging

The target population of interest is U.S. males (all races) 50–80-year-olds; however, we also model younger ages (35–50-year-olds) to improve the quality of model calibration to target population trends. We define nine age groups by five-year intervals starting from 35, and another age group that represents the 80+ male population. Different age groupings are used to represent simulation results, including the most used 50+ or 65+ populations. Other subpopulations include the 35 to 44, 45 to 54, 55 to 64, 65 to 75, and 75+-year-old age groups, for which mortality data and population counts were made available by the National Center for Health Statistics (NCHS) at the CDC [34]. The aging structure comprises one inflow that indicates the rate of entering the indicated age category, for nine age groups, and one outflow that indicates the rate of leaving the age category. The inflow-of-male-population-turning-35 time series is provided exogenously for the years 1980–2040, based on U.S. census data history and future projections. The age cohort-specific all-cause death rates and projections for the decrease in all-cause mortality were derived from sex- and age-specific data. The all-cause death rates for all age groups are then compared to the death counts specified by the CDC WONDER- [34,35]. Net immigration (migration to and from a country) is another component that influences the historical and future population counts in the U.S. that we considered.

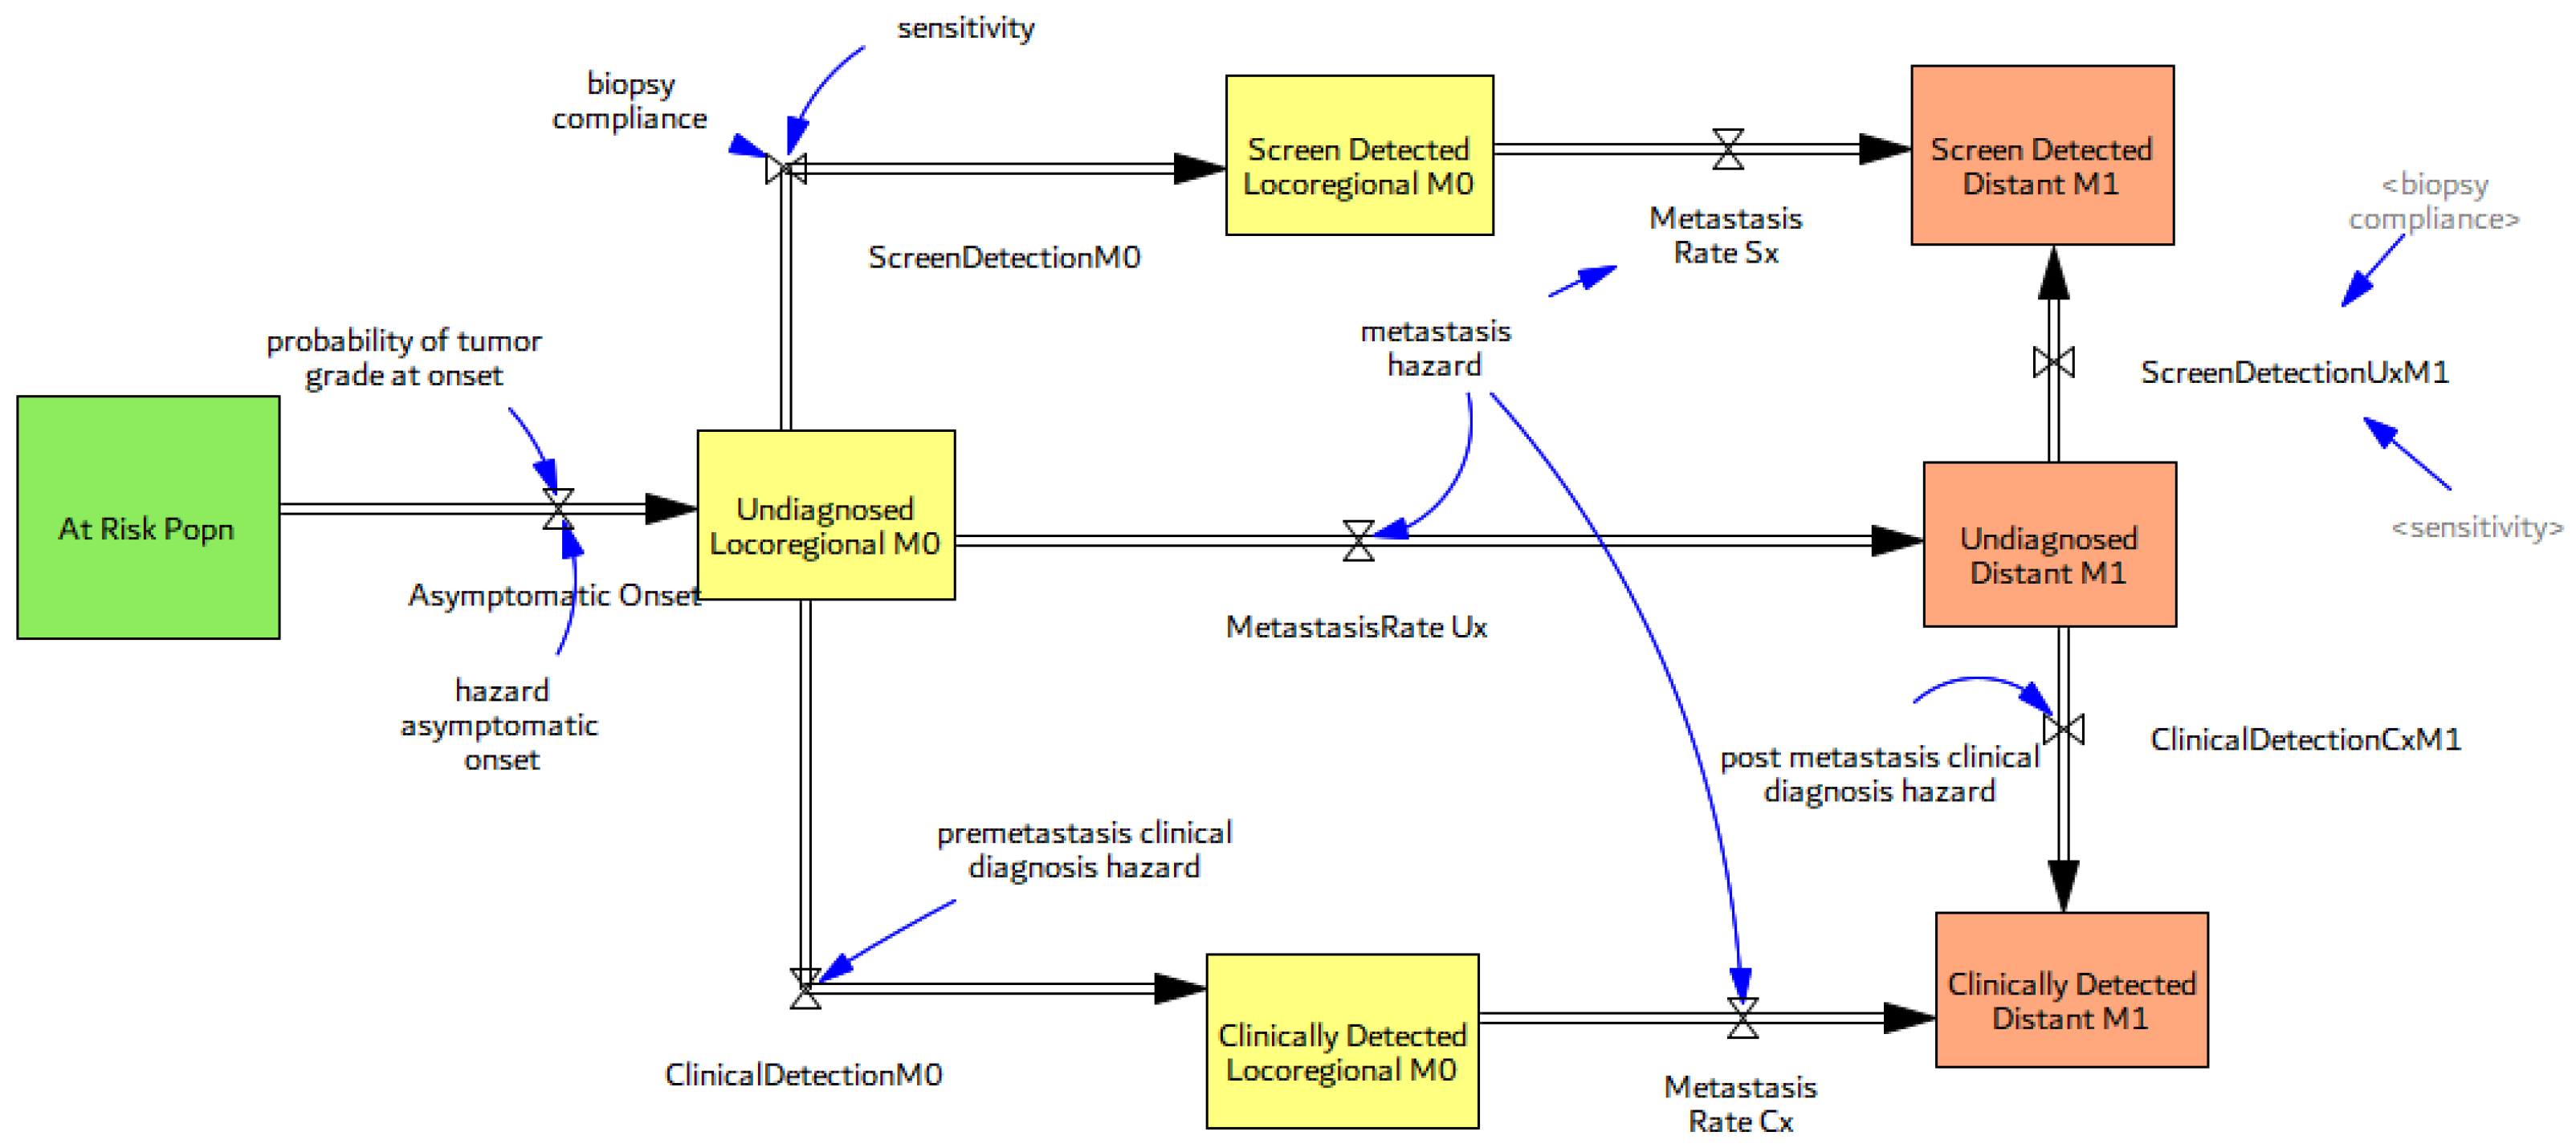
3.2.2. Natural History of Disease

Figure 2, Figure 3 and Figure 4 gradually illustrate the sectors or the main stock-flow structure for the natural history of PCa and its diagnosis, including the health states and transitions, the asymptomatic onset of screen-detectable cancer, and disease progression through stages. The model design (onset and progression through disease stages) and assumptions were inspired by the PCa natural history diagnosis and history models developed by the NCI-sponsored Cancer Intervention and Surveillance Modeling Network (CISNET) group and other modeling studies published previously [36,37,38,39,40].
Figure 2 shows the model sector for natural disease progression, where screen-detectable cancers progress from the loco-regional (M0) to the distant-metastatic stage (M1). “At Risk” populations with different screening results are lumped into one group here for simplicity. People with undiagnosed disease may get both screening and clinical detection, or progress to metastatic disease before being diagnosed. Cancers are localized at onset and may be either low-grade (Gleason score 2–7), high-grade (Gleason score 8–10), or indolent (any Gleason). High- and low-grade cancers represent those that are of a progressive type and may get metastasized, while the indolent class tumors represent the non-progressive or latent tumors, including regressive tumors which are, by definition, destined to stay confined to the prostate and not metastasize or kill the patient. The model assumes stage durations to be distributed independently according to exponential distributions and not correlated with each other. Disease progression rates are independent of patient age or disease onset, as with other studies.
Asymptomatic onset used in the model is estimated from autopsy studies and previously published models [36,41,42,43]. The model assumes that these adequately reflect the real prevalence of disease in the U.S., although that may be an underestimation of the true amount of latent disease in the population. Biopsy studies using better techniques find a higher age-specific prevalence. The present model assumes a constant secular trend in incidence, in line with other modeling studies. The probabilities of tumor grade at onset determine the fraction of disease in each grade category (high, low, indolent) at the onset. The metastasis hazard for men with cancer depends on the grade, and the hazard of transition to metastatic disease from the loco-regional to distant stage is selected based on the medical literature [44]. Mortality of PCa from loco-regional and distant disease stages is represented with death fractions defined by grade. The death fraction and metastasis hazard of indolent tumors are zero, by its definition.

3.3. Screening, Clinical Detection, Dissemination of Screening

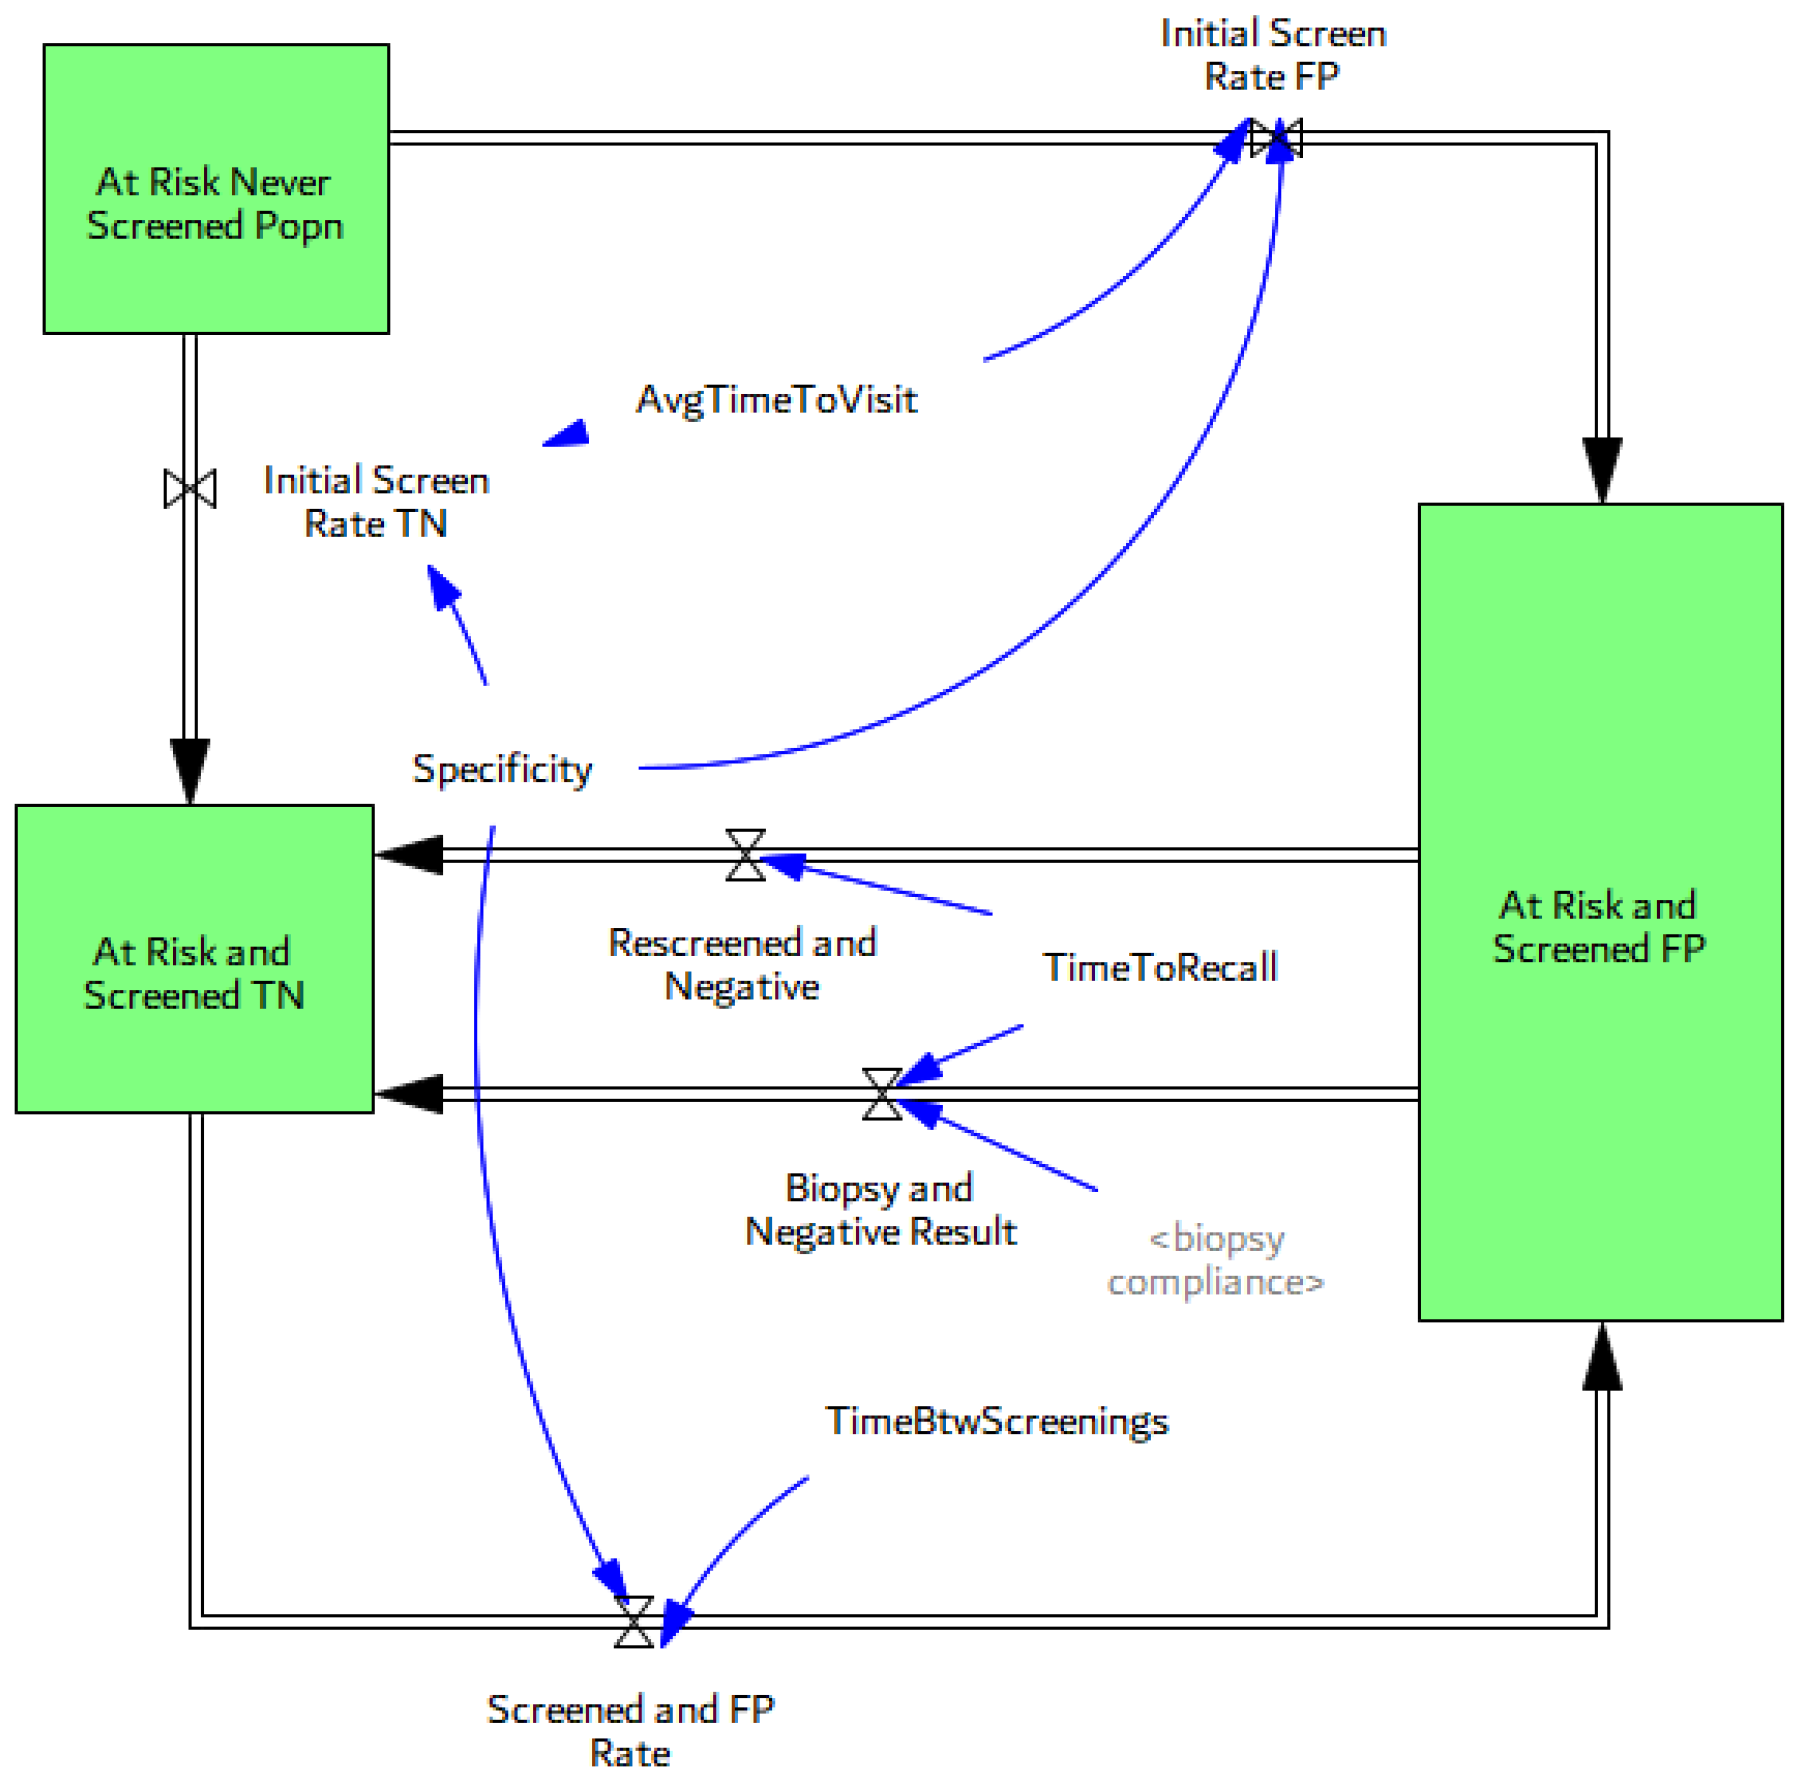
3.3.1. Screening Structure and Test Specifics

We introduce a more realistic screening stock-flow structure for the at-risk population compared to the available literature, which includes an explicit demonstration of all potential pathways a subject can go through during the screening process (Figure 3). Subjects in all the three at-risk stocks (at-risk and never screened, at risk and screened true negative-TN, or at risk and screened false positive-FP) may eventually develop a disease based on their age-specific onset. Note that subjects who are at risk and never screened may get an initial screening test with an TN test result or an FP test result. Subjects with an FP test result may then have a follow-up test or get a biopsy to confirm that they do not have the disease.
The model estimates an effective test sensitivity that combines test sensitivity, biopsy compliance, and biopsy detection rate. The endogenous PSA test sensitivity of loco-regional, stage M0 disease is determined by the evidence-based model structure [32,33]. The sensitivity of stage M1 disease is assumed to be 100% accurate, as the test sensitivity increases substantially when the disease has progressed beyond M0. The standard for biopsy referral in the U.S. from 1990 to 2005 was a PSA level greater than 4 ng/mL, yet lower thresholds were suggested and used in the 1990s, including 3, or even 2.5 ng/mL. In this model, men are eligible for biopsy after screening if their PSA exceeds this endogenously changing threshold. The screen detection rate of disease is given by age and grade. For the average time between two consecutive screening tests; a testing interval of 2 years is found to be reasonably consistent [39].
Not all men with positive test results submit to a follow-up biopsy. The model base biopsy compliance rate following a positive PSA test is taken as 0.5, which is lower than in Europe, where estimates range around 0.8–0.9. In the PLCO trial of the U.S., 40% of men with a PSA between 4 and 7, 53% of men with a PSA between 7 and 10, and 69% of men with a PSA greater than 10 had a follow-up biopsy [45]. Biopsy detection rate (or biopsy accuracy) represents the ability of biopsy to detect men with the disease. Its value has increased with the dissemination of extended biopsy schemes over time. Before 1990, 4-core biopsies were standard, 6-core biopsies were by 1995, and 8- to 12-core biopsies were standard by the early 2000s. A 6-core biopsy is 80% accurate, 4-core biopsy accuracy is 2/3 of this amount, and extended-core biopsies, which are presently used, are 100% accurate. The biopsy detection rate varied from 0.6 to 1, based on estimates provided in previous studies [46]. Cancer can also be clinically detected at any stage and the clinical detection hazard by grade is assumed to be much higher after metastasis of the disease [39]. We do not model digital rectal exam (DRE) testing explicitly and assume that the clinical detection hazard stays constant after the PSA era. This is an important assumption that may lead to an overestimation of the value of the PSA test since we do not capture possible increases in the frequency of the DRE test rate. In fact, DRE detections are also likely to increase because of disease awareness, which has increased over the years. Figure 4 illustrates the final and simplified sector stock-flow structure for the natural history of disease including disease progression and its detection by screening or clinical detection.

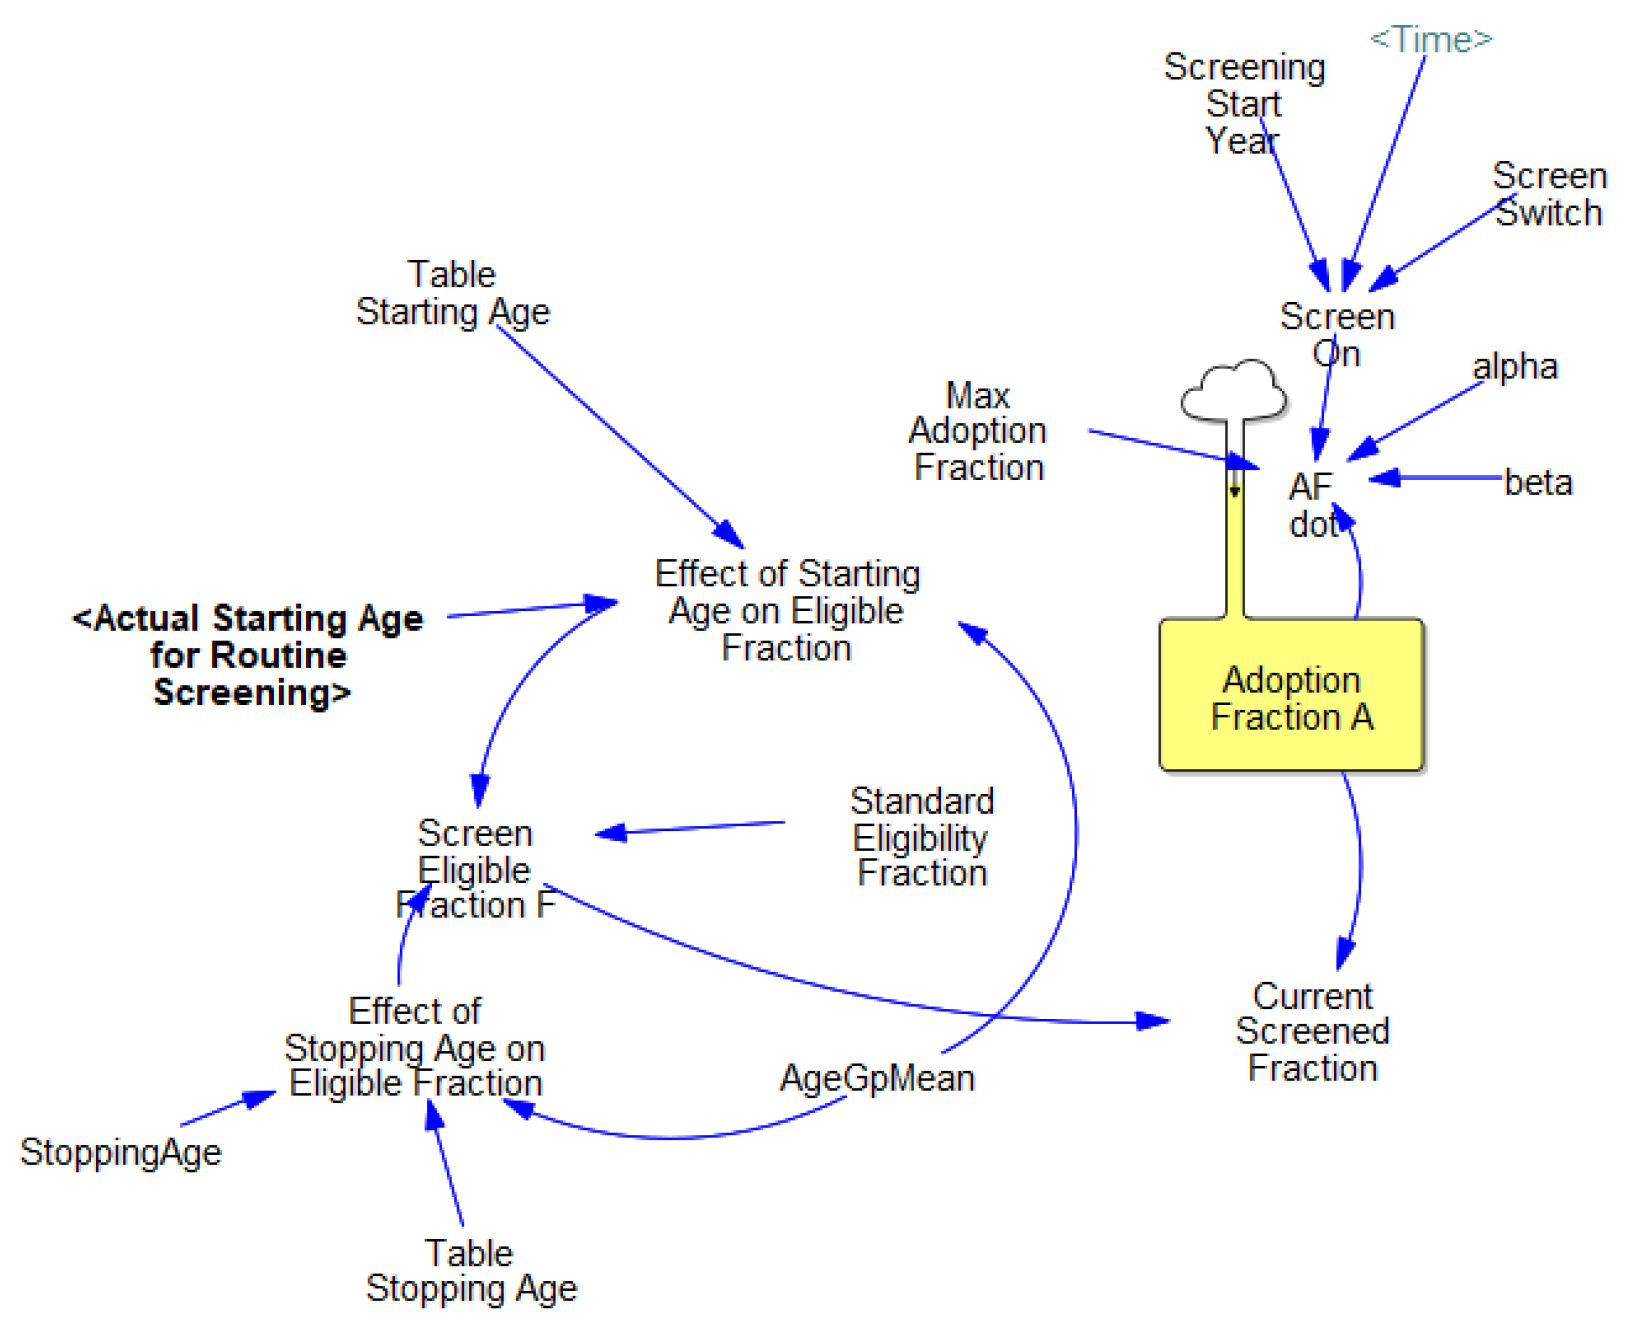
3.3.2. Screening Dissemination

The screening dissemination sector stock/flow structure is given in Figure 5. In our model, the doctor’s adoption of PSA screening is modeled as adoption fraction A that ranges between 0 and the maximum adoption fraction. Screening dissemination takes place after 1985, the year PSA screening is introduced and rapidly diffuses in the medical community after that. Adoption and dissemination parameters are estimated by the first and repeat PSA screening data [46]. Screen eligibility is determined by the formally recommended starting and stopping ages in guidelines and the standard eligibility fraction, which indicates the maximum eligibility or the reference market for the PSA practice. The effects of starting/stopping ages on screening-eligible fractions are modeled by using graphical functions for an S-shaped curve. Accordingly, the screen-eligible fraction F is closer to the maximum between the recommended starting and stopping ages, yet it fails to reach its maximum within this range and extends beyond the formal ranges. Both the screen-eligible fraction and the currently screened fraction are given for 5-year age groups between the defined age ranges of 35–80+. Critical equations, graphical functions, and other supporting assumptions are provided in Supplementary Materials.
Table 1 lists important model inputs and symbols used with the range used for sensitivity analysis, and associated data sources. The key selected outcome measures for the model are selected to show the fundamental tradeoff between the harms and benefits of screening. These include proxy variables for the most common harms and benefits of screening and detection, mainly screen vs. clinical detection fractions, the fraction of overdiagnosed cases, the number of unnecessary biopsies, the metastasized fraction of cancer at initial detection, and men with FP test results. The main harms of screening include (i) false positives, (ii) unnecessary biopsies, and (iii) overdiagnosis (and, hence, overtreatment). The main benefit is saving lives, or early detection of cancer (before it gets metastasized).
Table 1. List of Important Model Inputs.
NameParameter [Unit]Sensitivity RangeSource(s) for Base Case
Probability of indolent tumor at onsetpOx [dmnl]0.2–0.6Expert judgement
Hazard Asymptomatic Onset (by age group)
PCa specific mortality fraction (by grade)
Oxi [1/year]
dfM0, dfM1 [1/year]
0.0–0.05
0.07–0.37
[36,41,42]
SEER survival curves by stage, [37,47,48]
Pre-metastasis clinical diagnosis hazard (by age, grade)Cx1, Cx2 [1/year]0–0.03[37,39]
Multiplier for Hazard of Clinical Diagnosis (by age group)MCx [dmnl]15–25[39]
Time between screeningsTimeBtwSx [year]1.5–2.5[39]
Biopsy compliance (by stage)BiopCompM0/M1 [dmnl]0.3–0.7; 0.9[39,45]
Time to actτ [year]0.25–0.5[49]
alpha⍺ [1/year]0.015–0.03Based on PSA curve [46]
betaβ [1/year]0.45–0.65Based on PSA curve [46]
Max adoption fractionAmax [dmnl]0.25–0.9Expert judgement
Stopping age to screenAgestop [years]70–85Expert judgement
HBR Translation Delayλt [year]2–10Expert judgement

4. Simulation Results

4.1. Basic Dynamics and Model Validation

The model is implemented using VensimTM software (Ventana Systems Inc., Harvard, MA, USA), initialized in 1980, in the pre-PSA era, and simulates forward by increments of a 1/8th of a year through 2040; all output variables are calculated at every increment. The time horizon is selected as 1980–2040, about 60 years, to capture the dynamic trends in the diffusion of screening and compliance with recommendations and the potential trajectories for selected policy variables. Detailed documentation of the model is available upon request from the authors. We demonstrated correspondence to historical data on various metrics including population counts, crude and death rates by age group, disease prevalence, and some metrics on disease progression.
We conducted structurally oriented behavior validation experiments throughout the model-building process to test the validity of the model with respect to its intended purpose. First, we tested the model’s response to a series of extreme conditions to check its robustness. For example, the latent disease cannot get detected in the absence of PSA screening. After screening gets introduced, the loco-regional fraction of indolent disease at detection becomes 100%, as an indolent disease cannot get metastasized by definition. Table 2 provides a summary of the qualitative behavior of the PSA model under selected extreme conditions and various logic tests, e.g., the indolent disease cannot get detected in the absence of PSA screening and cannot get metastasized. Experiments prove that model behavior matches the behavior expected from the model for the listed conditions and passes all logic and extreme condition tests. Throughout the model-building process, we also tested the model’s mass balance for the population counts by calculating the sum of all the stocks in the model and comparing it against the integration of the net inflow over the simulation horizon. The only inflow to the population stocks is the male-population-turning-35 exogenous time series, and the net immigration flows.
We provide a summary of simulation results to show the correspondence of the model to historical data and future projections for the population stocks, including the total population, percent above 65 years old, and for various age groups in Supplementary Materials. The death rate is in terms of millions of deaths per year, and as a crude death rate, expressed as the number of deaths reported each calendar year per factor selected. The default factor at the CDC compressed mortality file is per 100,000 of the population, reporting the death rate per 100,000 persons. Rates are for three age groups, 35–55, 55–75, and 75+. Model behavior shows reasonable correspondence to historical behavior of the total population counts and deaths.

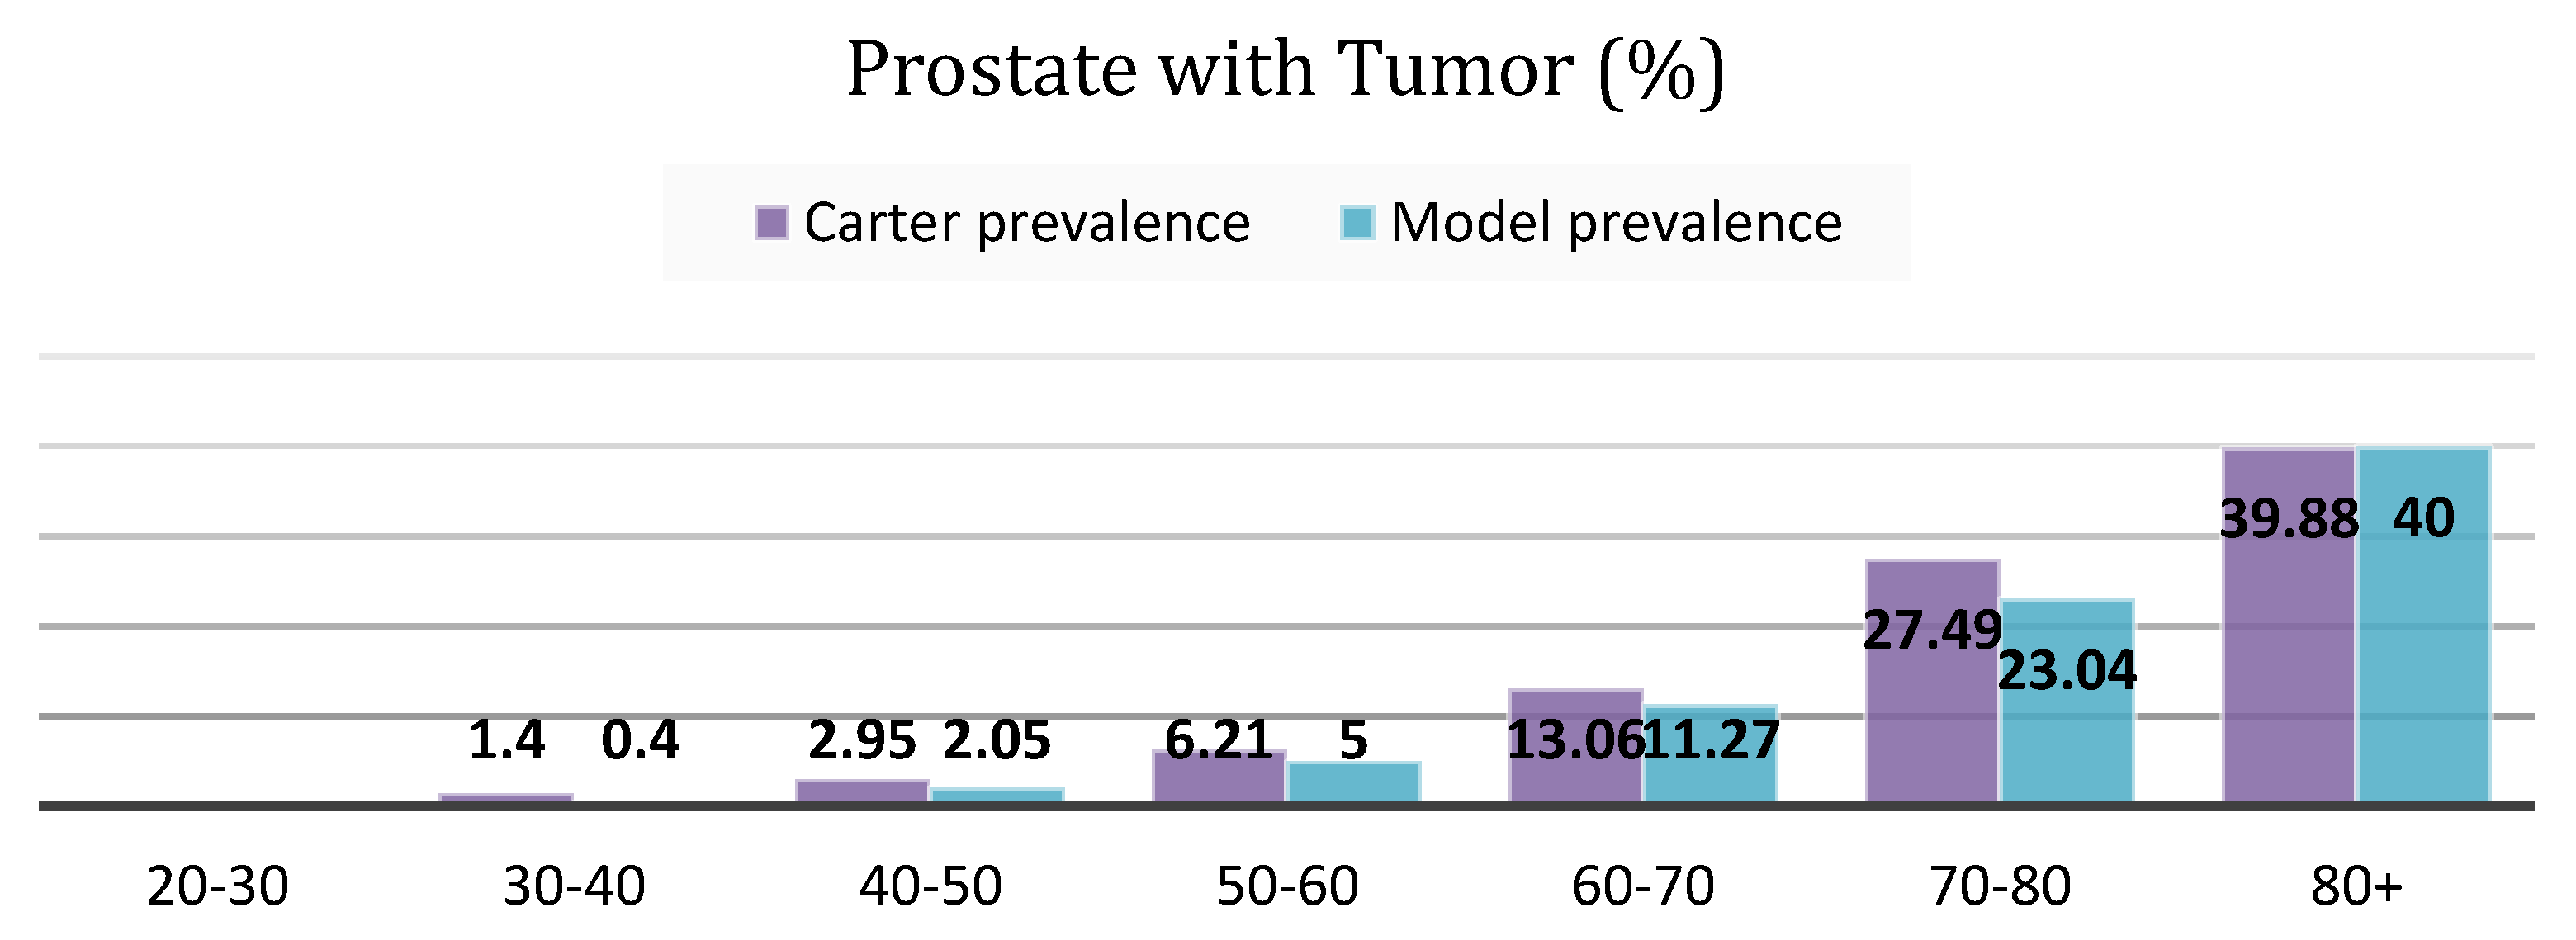
4.1.1. Cancer Prevalence

The main and most important risk factor affecting all types of cancer, except cervical cancer, is getting older. Autopsy studies indicate that prevalence of PCa is an increasing function of age [41,42,43]. Since the real underlying prevalence of PCa is unknown, we use estimates from autopsy studies. Figure 6 shows the fraction of men with a PCa tumor at autopsy, a proxy for real underlying cancer prevalence. Prevalence estimates are from Carter et al. [50], who studied 5250 autopsies from the U.S. literature. Estimates apply to the symptom-free male population; men with a PCa diagnosis are excluded. Please note that more recently conducted autopsy studies are finding a higher age-specific prevalence [41,42], so our estimates are conservative with respect to the underlying (unknown) asymptomatic disease in the U.S. male population.

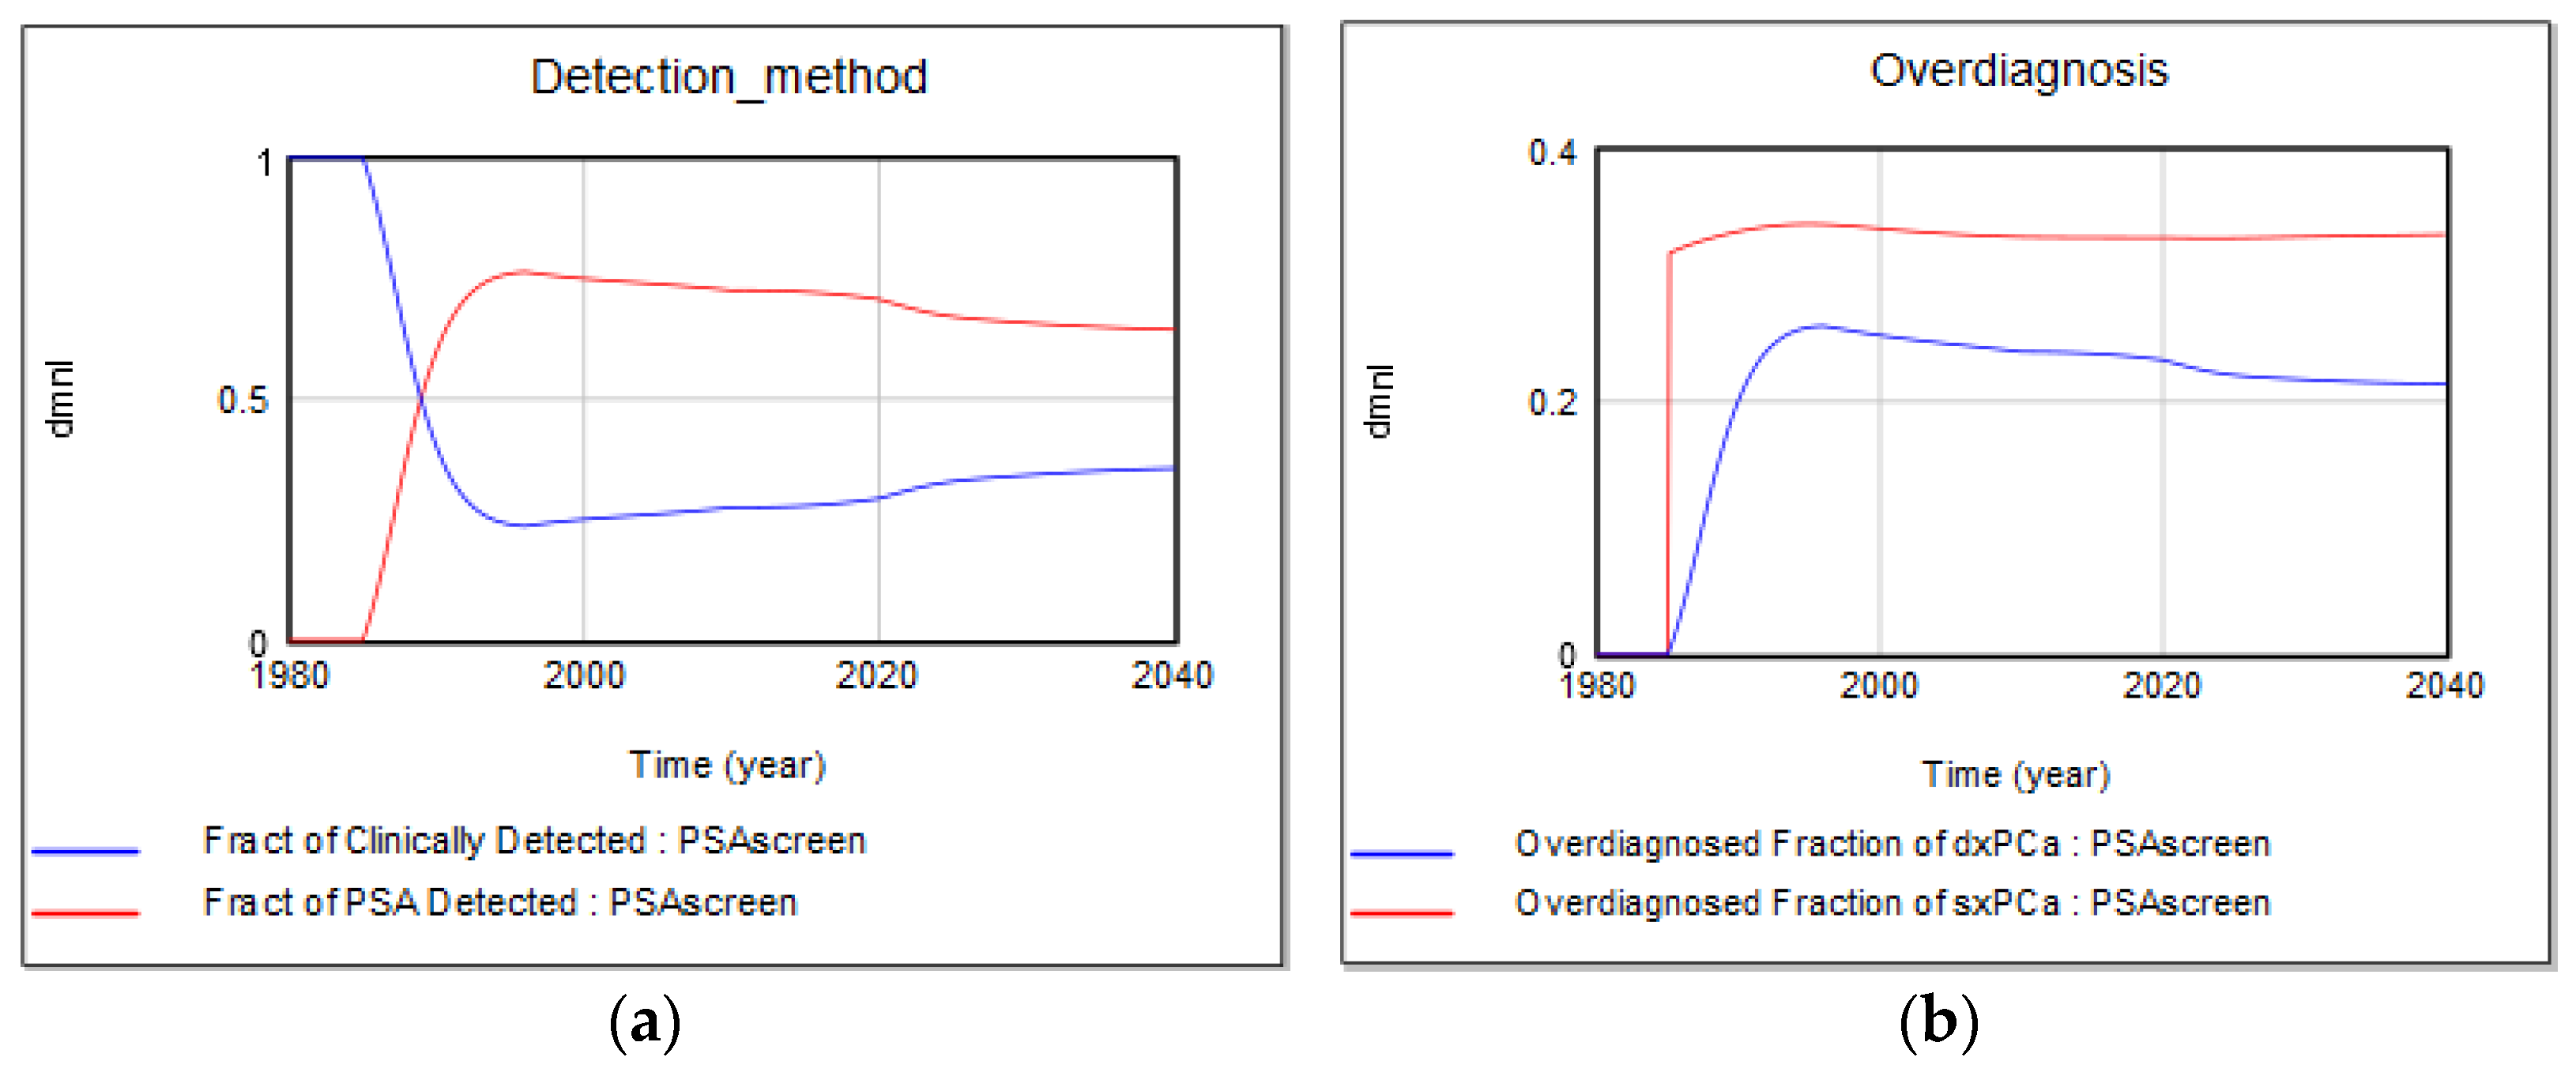
4.1.2. Screen vs. Clinical Detection and Overdiagnosis Rates

Cancer overdiagnosis is a contentious issue with various definitions and implications for policy making. Models of cancer registry data and trial results estimate that 23% to 42% of PSA-detected cancers would not be found without screening, and 42–66% of all diagnosed prostate cancers would have caused no clinical harm had they remained undetected [51]. Cancer overdiagnosis has several definitions. It refers to people diagnosed with indolent disease, and to others who die of other causes. This study uses the most conservative definition of overdiagnosis, where a screen-detected case is considered overdiagnosed if it is an indolent tumor. While existing estimates vary widely between 23–66% [1,51] our base case estimate is somewhere in this range on the conservative side, indicating 24% of all diagnosed cases, and 33% of all screen-detected cases, are overdiagnosed, once the adoption trends get stabilized. PSA screening started in 1985, before which cancer could only be detected clinically, as confirmed by the base case simulation (Figure 7).

4.2. Sensitivity Testing

We conducted several types of sensitivity tests on the model by exploring the parameter space for selected key indicators, mainly overdiagnosis rates by detection method, other harms such as unnecessary biopsies due to an FP test result, and metastatic disease fraction at initial diagnosis. We chose these key outcome measures to provide insights into different system features, inform policymakers regarding each indicator’s tradeoffs, and apply the notion of multiplism suggesting that essential problems should be measured in different ways.

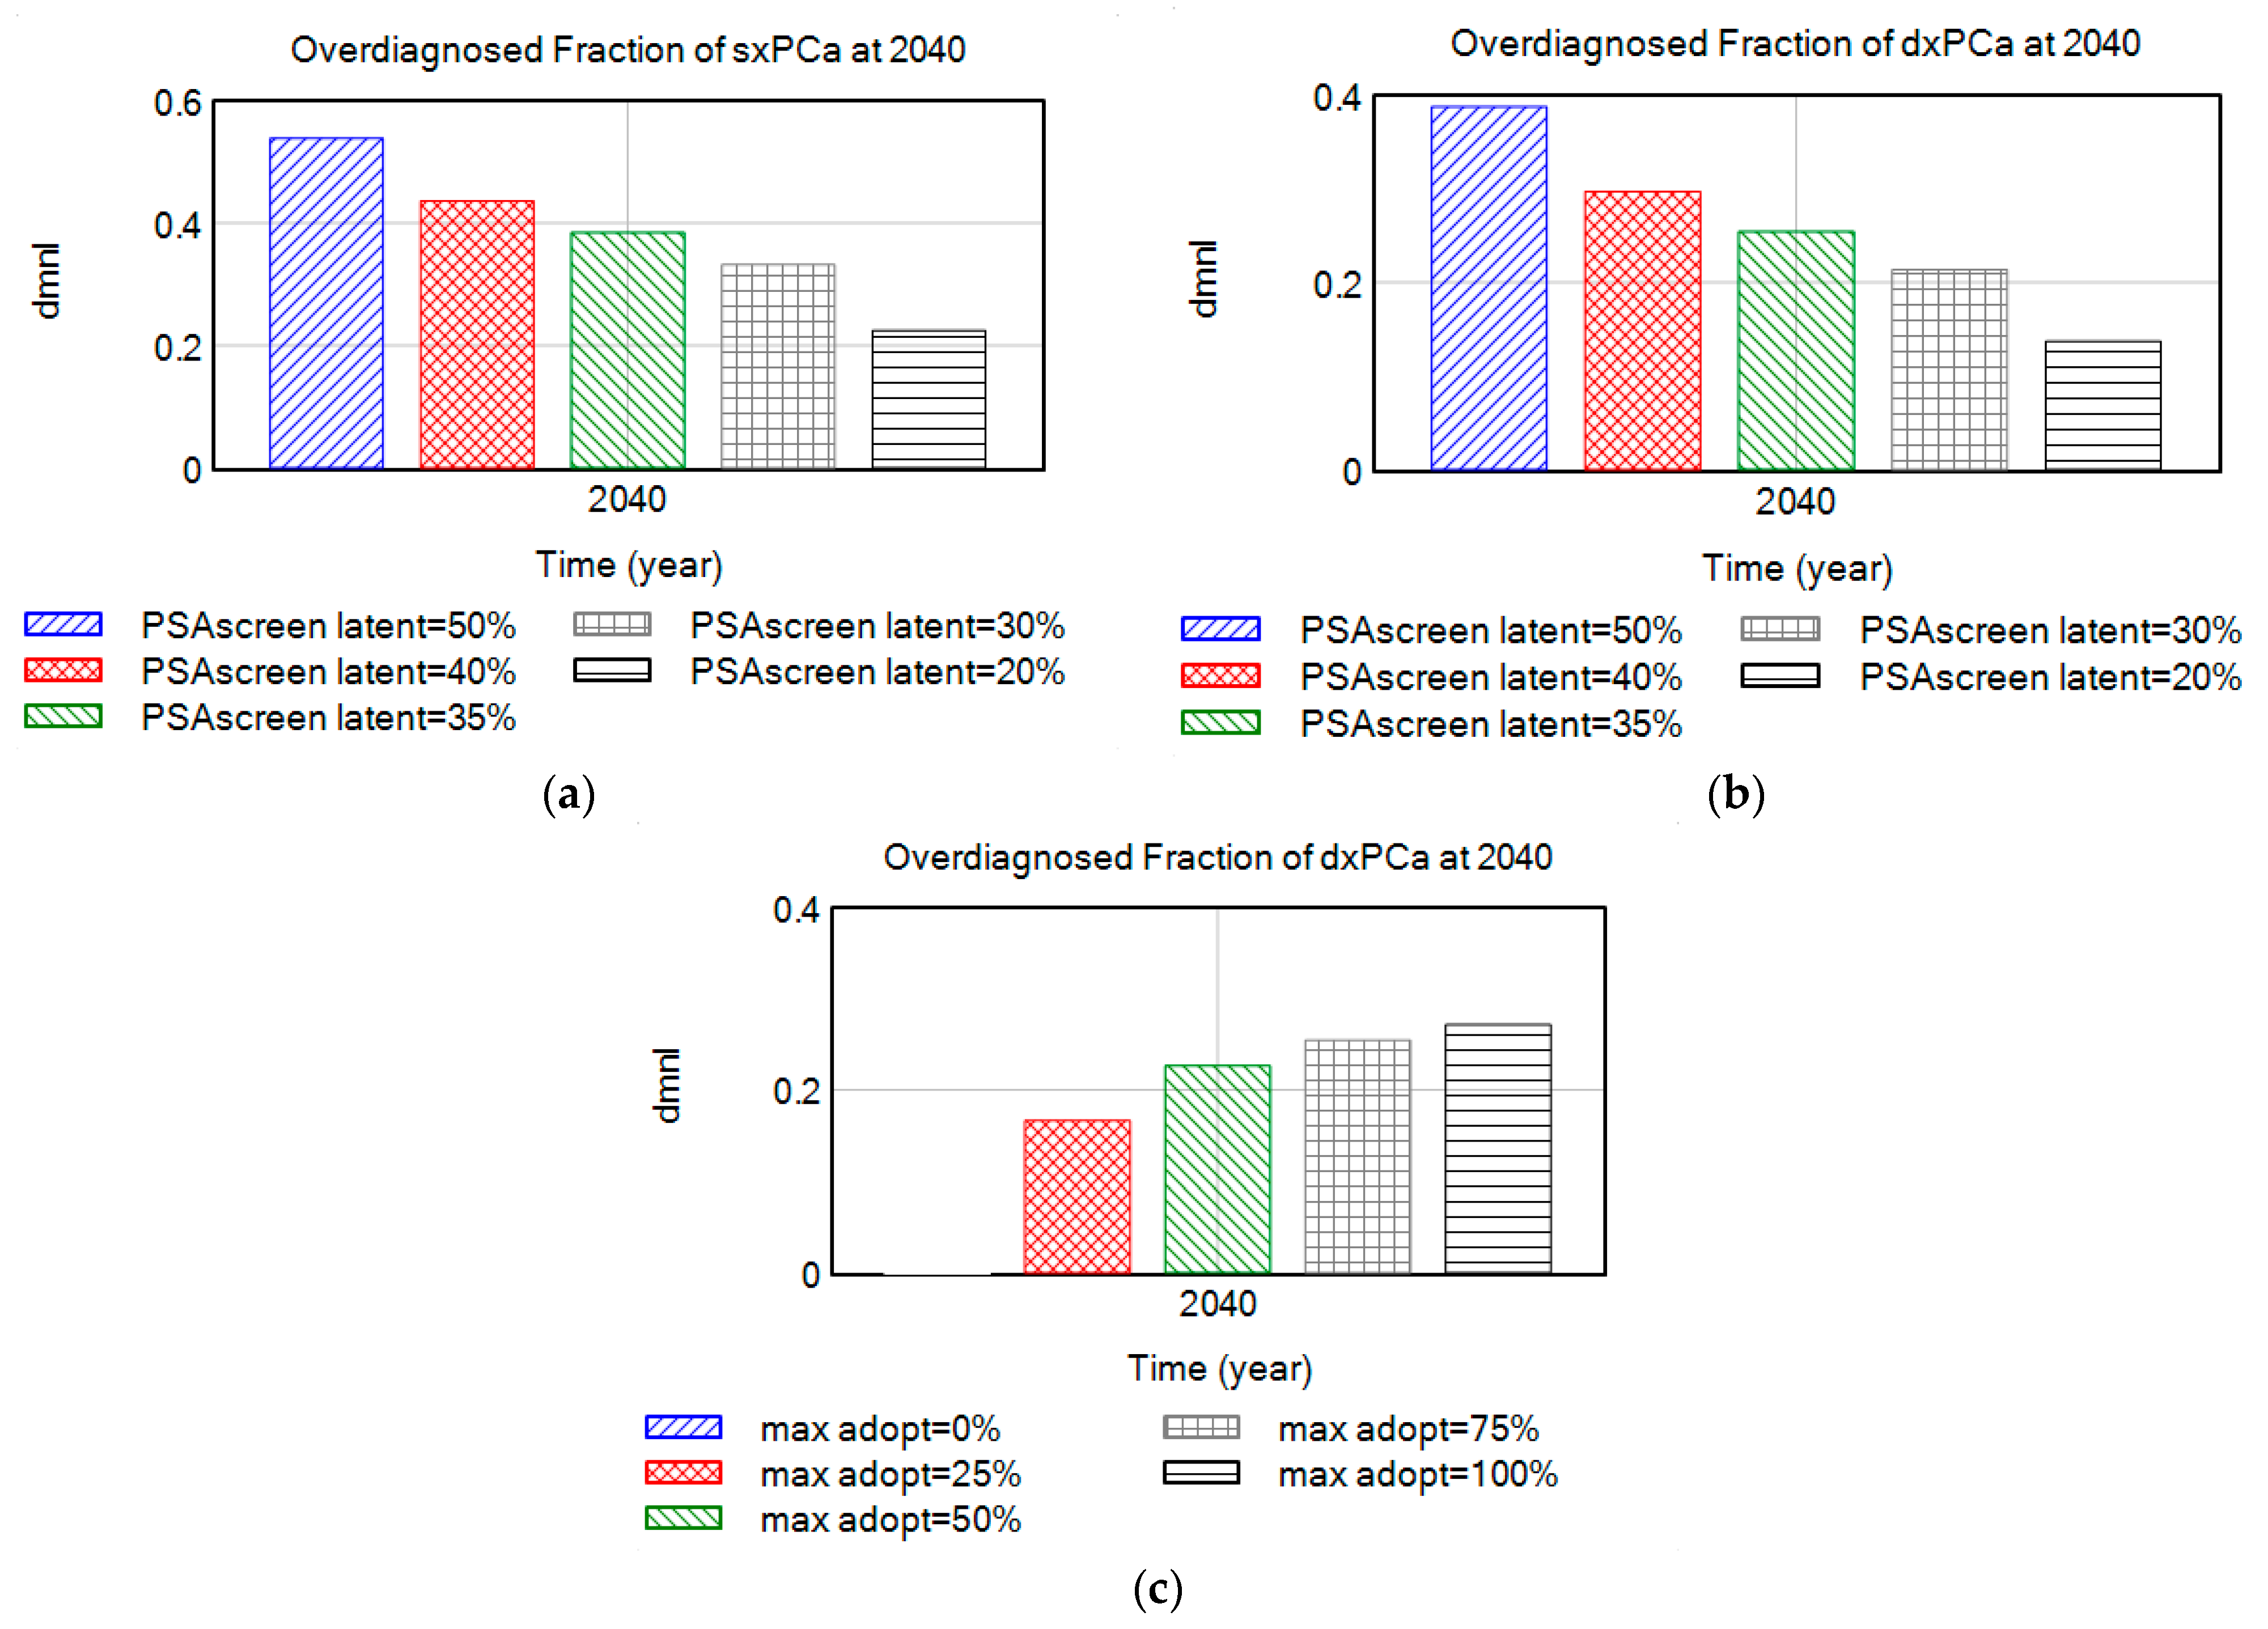
4.2.1. Over-Diagnosis Due to Large Pool of Indolent (Latent) Disease

Experimental results summarized in Figure 8a,b demonstrate the “indolent” or “latent” fraction of disease as one of the most important underlying parameters affecting cancer overdiagnosis rates. Indolent class tumors represent the non-progressive, or latent tumors, including regressive tumors which are destined to stay confined to the prostate and not metastasize or kill the patient by definition. We varied the value of the latent fraction of disease between 20–50% (base case = 35%) to show its effect on the overdiagnosis fraction of screen-detected, or all (screen- and clinically) detected cancers. Adoption of the screening practice is another important parameter determining overdiagnosis rates. Figure 8c shows that overdiagnosis rates are also affected by the PSA screening adoption practice by medical professionals (base case value for maximum adoption fraction = 0.75). As expected, detection and overdiagnosis of indolent disease drops to zero without PSA screening, since they cannot be detected without screening.

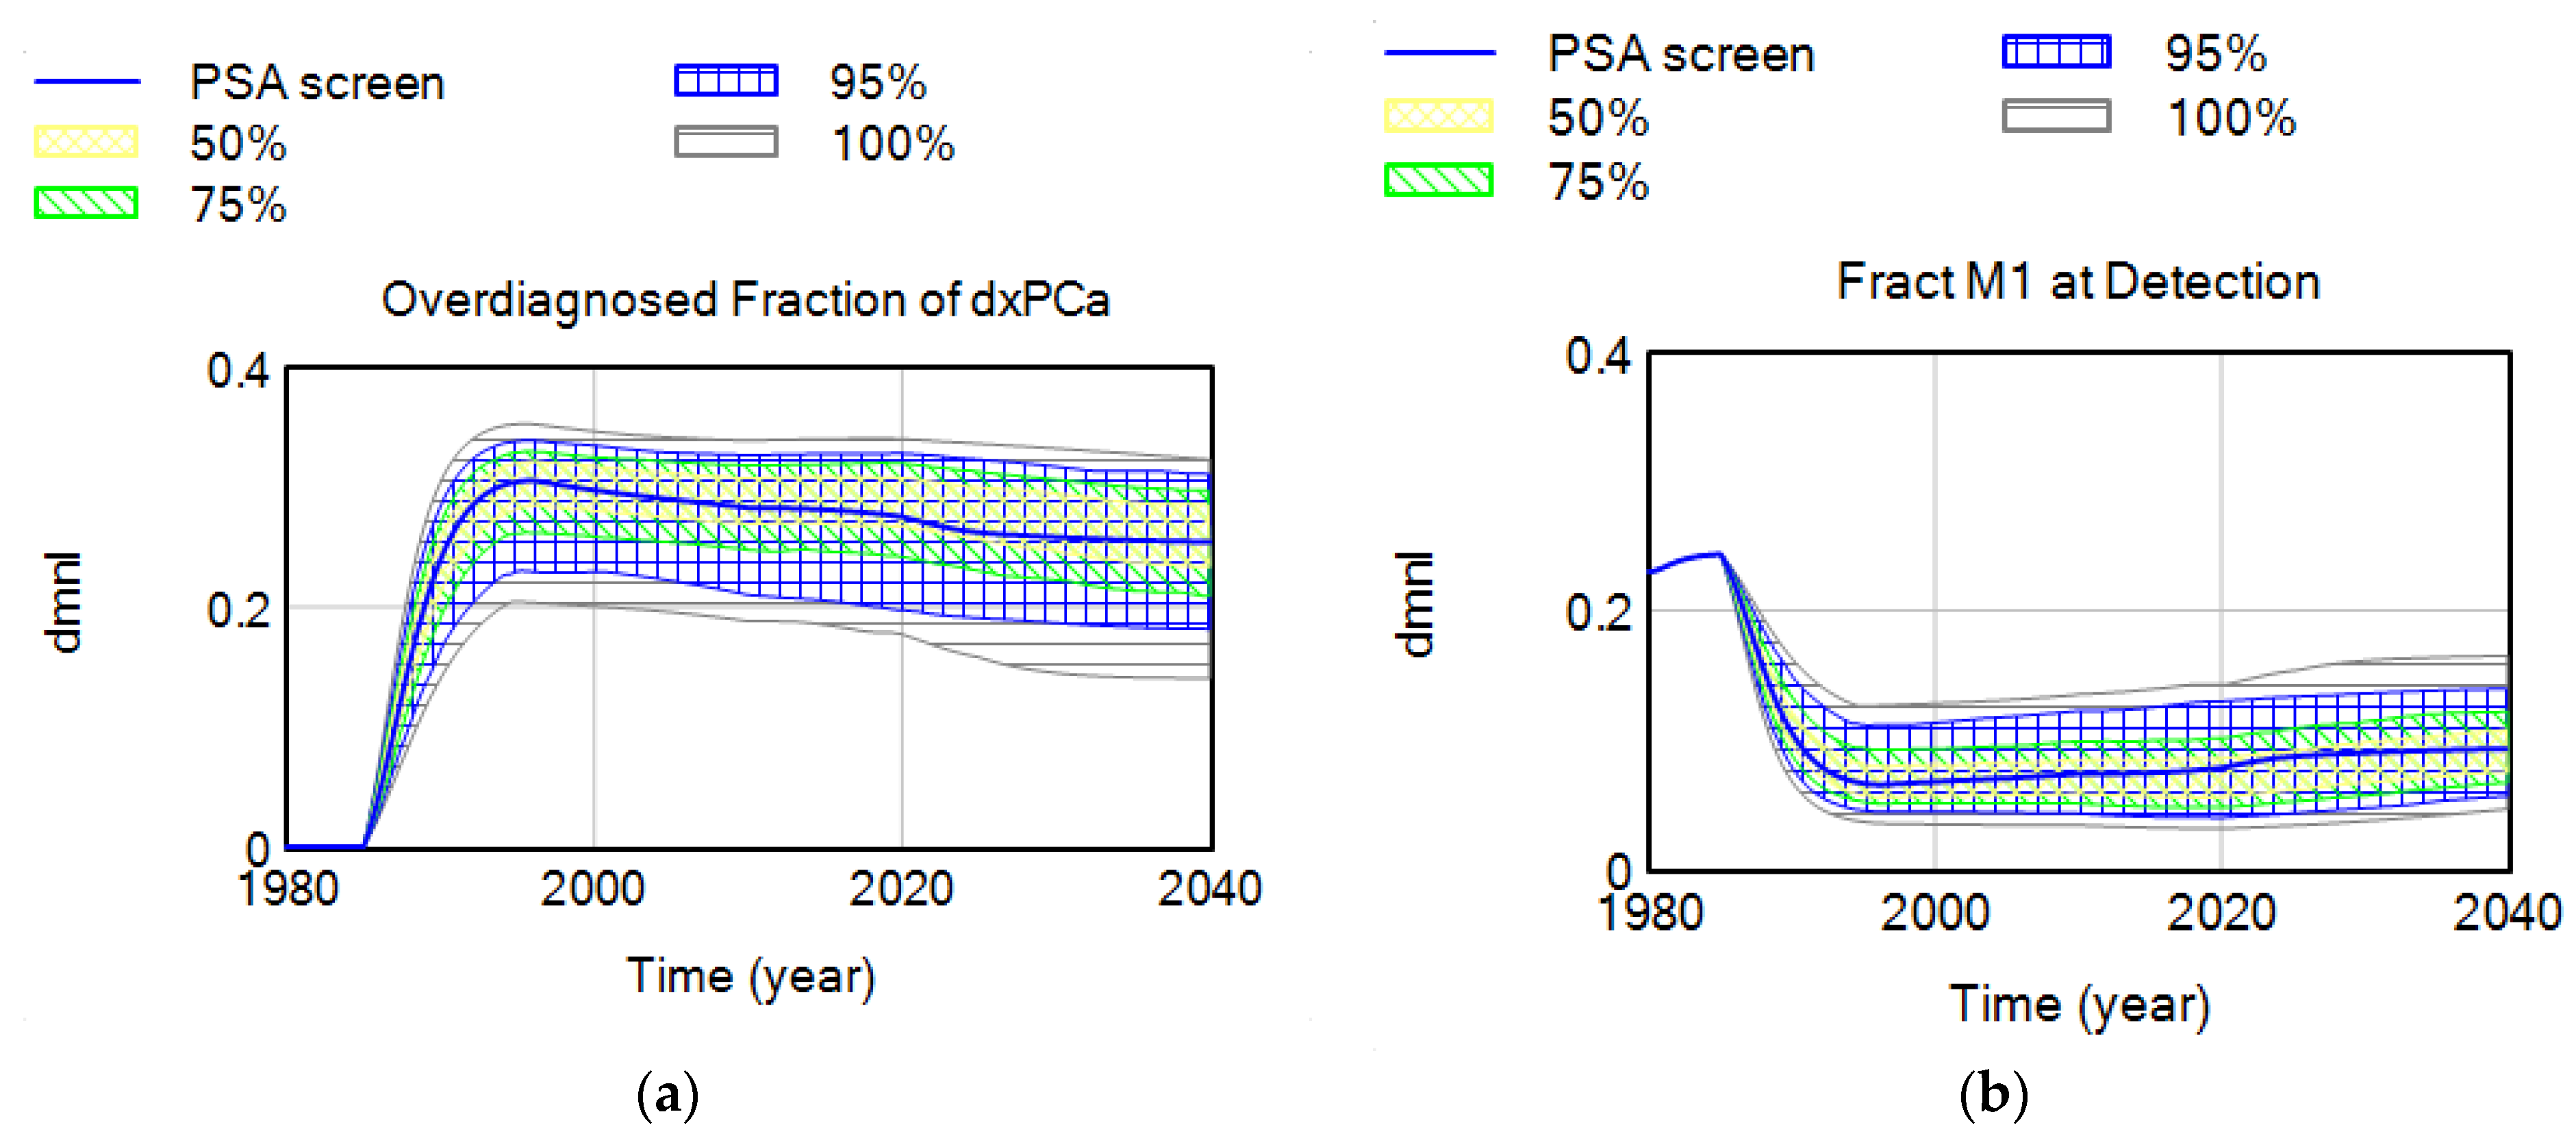
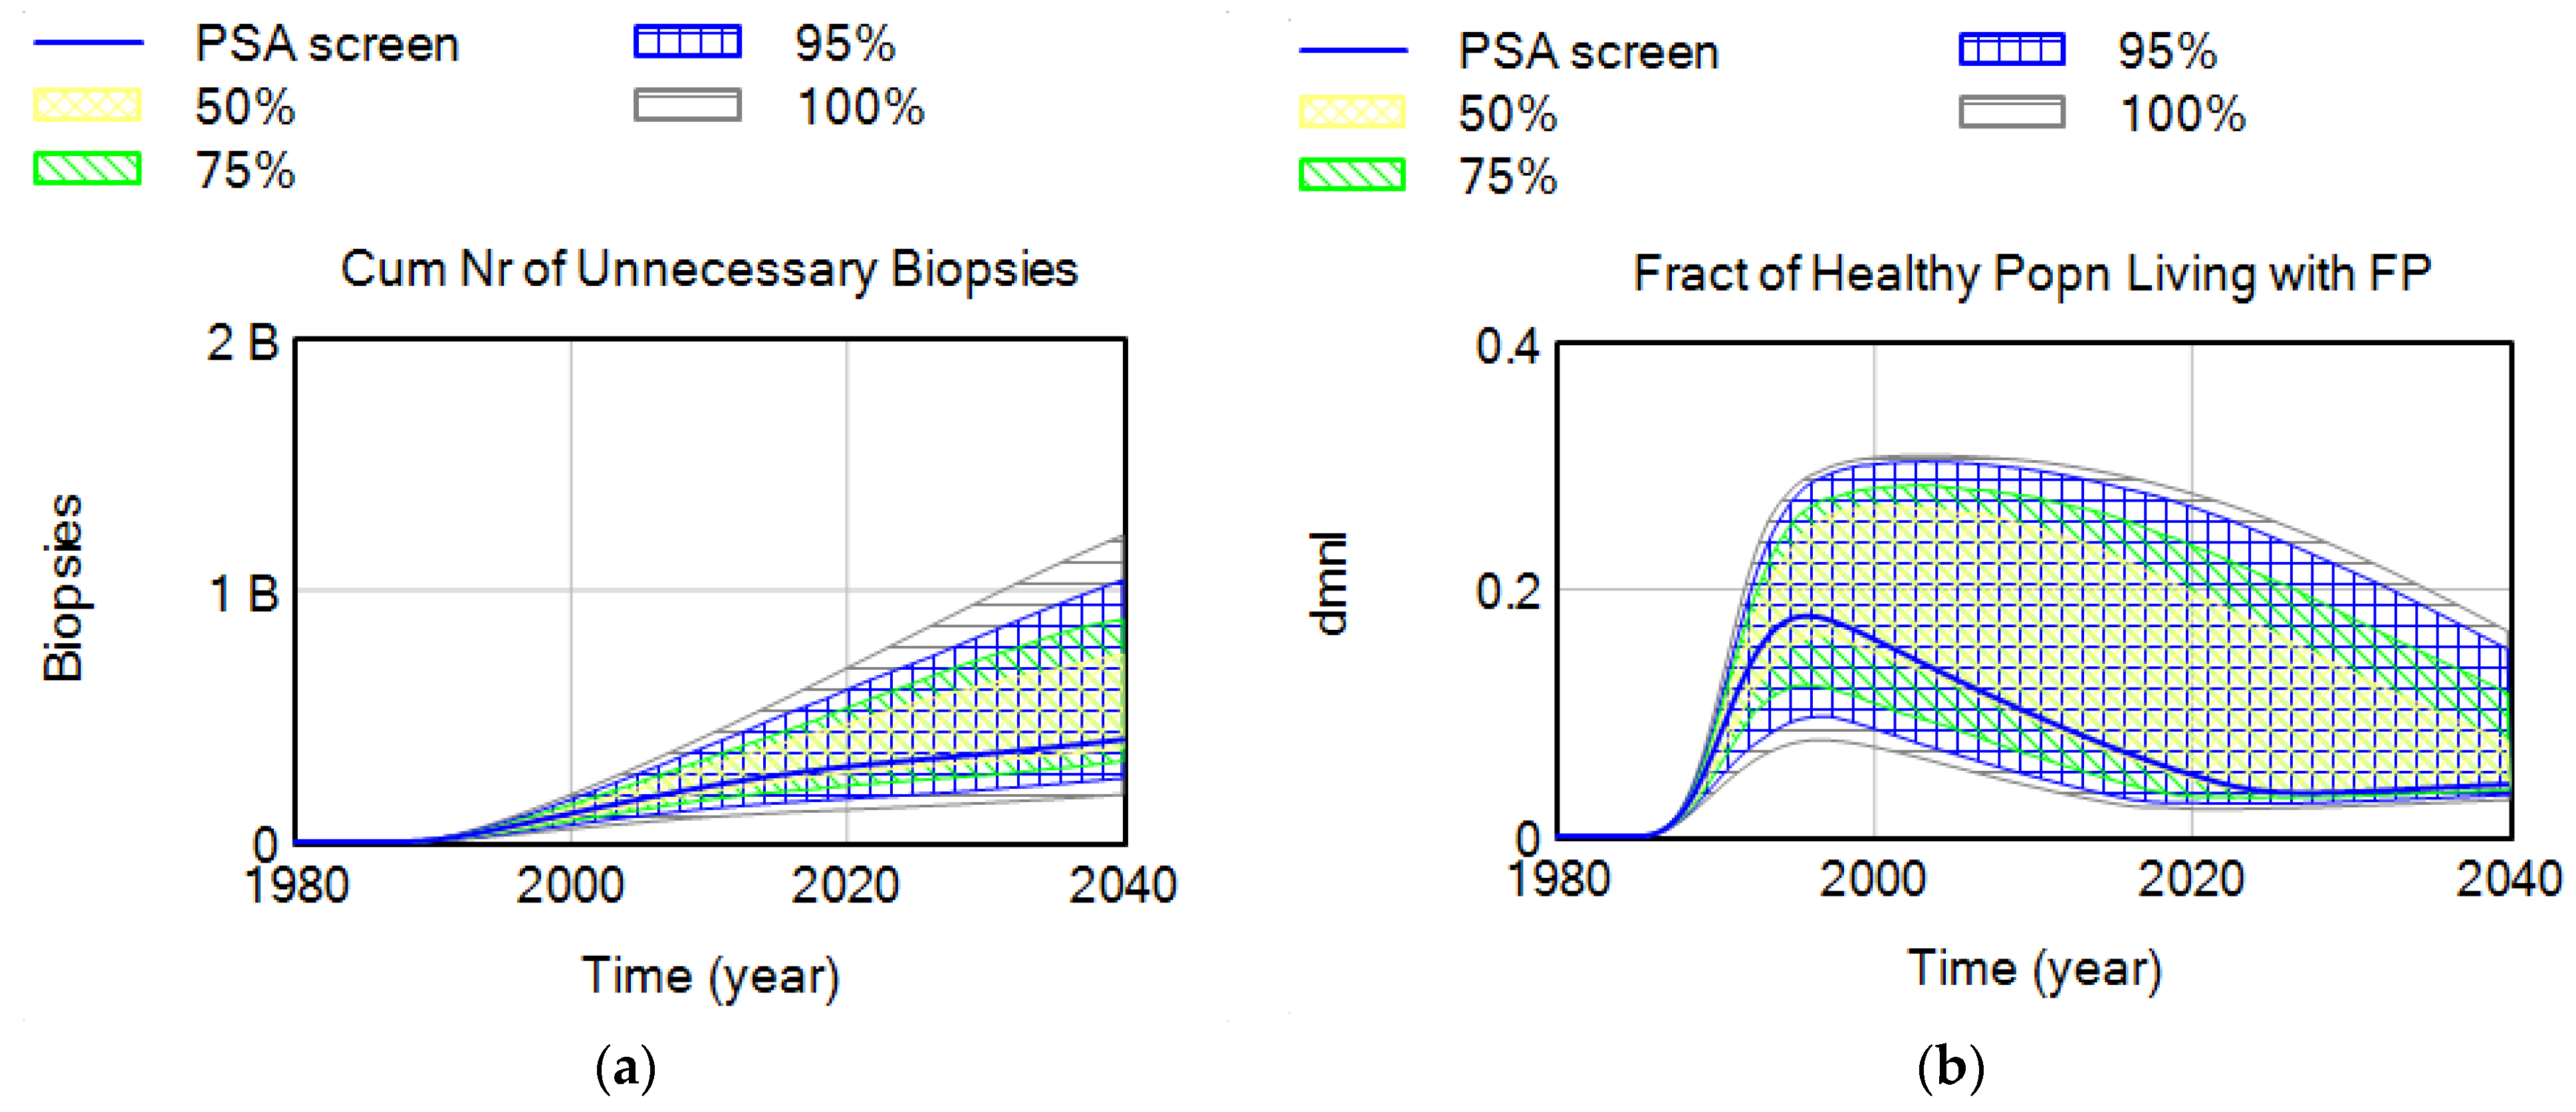
4.2.2. Parameter Set Exploration for Benefits and Harms of Screening

To explore the parameter space, we ran a global sensitivity analysis with combined variations in all the parameters the model is sensitive to (as identified in Table 1). These include all the important time constants related to screening, including the harms and benefits ratio (HBR) translation delay indicating how long it takes to translate scientific evidence to clinical practice, the time between screenings, the stopping age to screen, and the time to act. Other sensitive parameters include the biopsy compliance rate (by patients with a positive test result) and the maximum adoption fraction (of the PSA test by clinicians). The experimental results, in turn, show the confidence intervals (up to 100%) of the key indicators for harms and benefits from 300 runs, sufficient to explore the state space of the harms and benefits in the screening and adoption subsystems. A Monte Carlo simulation, also known as multivariate sensitivity simulation (MVSS), was used to automate the sensitivity analysis. The experiment gives us the full range of possibilities for potential harms and benefits of screening and allows us to observe their tradeoff.
Confidence plots in Figure 9 and Figure 10 demonstrate the common and extreme operating ranges for the main harms of medical screening, and the tradeoff between its harms and benefits. The main harms of screening include (i) false positives, (ii) unnecessary biopsies, and (iii) overdiagnosis (and, hence, overtreatment). The main benefit includes saved lives, or early detection of cancer (before it gets metastasized). We selected respective proxy variables as (1) the overdiagnosed fraction of all detected cases, (2) the cumulative number of unnecessary biopsies, (3) the fraction of healthy male population living with an FP test result, and (4) the fraction of disease already metastasized at initial detection or the fraction of M1 at detection.

5. Discussion

We present a generic simulation model for medical screening, and a case study specific to PSA screening for PCa, including the natural history of the disease, screening, and clinical detection of PCa; the adoption of the PSA screening test by medical professionals; and the dissemination of the test in the U.S. context. While our focus for this study is primarily on the fundamental tradeoff between the main harms and benefits of screening as exemplified by the selected key proxy variables, the model can be used for policy analysis and the estimation of potential future trajectories for other important policy variables, such as the increasing pool of cancer survivors in the U.S. The reasons for choosing these key outcome measures are to (i) keep track of the critical stocks for the cancer screening problem, (ii) provide insights into different features of the system, (iii) inform policymakers regarding the tradeoffs of each indicator, and (iv) apply the notion of multiplism suggesting that a problem should be measured in different ways.

5.1. Strategic Insights

  • One of the important contributions of this study is the introduction of a more realistic yet flexible structure for routine medical screening that allows keeping track of critical stocks that have been generally overlooked in previous modeling studies. Existing modeling studies do not explicitly define some of these population stocks in the screening process, including men who currently live with an FP test result, which has implications for anxiety and depression. In this study, we use the flexibility of the SD modeling stock-flow structure to keep track and account for all critical stocks in the cancer screening problem, while their values are not readily measured in the literature. Simulations show that the fraction of healthy men who live with an FP may vary between 5 and 15% in most situations, depending on screening criteria, or breadth indications of disease, and may increase up to 30% with lower biopsy compliance rates. The value of the FP stock relative to the healthy population (i.e., “the fraction of healthy male population currently living with an FP”) may be an important indicator for policy making. Another variable for which we were not able to find historical data includes the the “fraction of disease in target screening population”. These metrics are potentially very important, yet not readily measured or considered in existing medical and modeling literature. Simulations show that the fraction of false positives in the healthy male population may have increased to as high as 18% in the 1990s when screening was overused. At the same time, the real diseased fraction of the target population must have dropped down to its historical minimum. We do not aim to suggest optimal estimates for these variables but would like to highlight the importance of having a better understanding of their dynamics by additional data collection, rather than excluding them from our “mental” models, or making the constancy assumption [52].
  • The addition of an “indolent/latent” disease category is a novel addition in this modeling study, facilitating to make of inferences about the real (yet unknown) occult disease prevalence in the population. One aspect that increases the reported cancer prevalence is the existence of a silent pool of indolent diseases, which varies among different types of cancers. These are “TP” cases where the disease identified has uncertain significance, and where men would never become aware of their disease if they were not tested for it, as evidenced by the silent reservoirs of undetected thyroid, breast, and prostate [41] cancers. Our interview data for the PCa case study confirms the importance of the size of this latent pool of disease: “…If you take enough time to understand what this means, if I tell a patient, “Look I’m 47, my probability to have a prostate cancer histologically under the microscope right now as I sit here, is about 30%. Period.” That’s a start, so there’s a pool of prostate cancer that we all carry, most of them they’ll never become symptomatic, some of us have to have bad cards. Do we understand who have bad cards and who don’t? No, we don’t. There’s a residual risk that there’s something going on. “—Peter Juni. MD-PhD, Director, Applied Health Research Centre, St. Michael’s Hospital, and Professor of Medicine, University of Toronto, Previous: University of Bern, Director of the Institute of Primary Health Care, Professor and Chair of Primary Health Care and Clinical Epidemiology in the Faculty of Medicine, Switzerland.
  • We endogenize variables that are mostly taken as constants in other studies. These include the breadth of indications of screening (including the biopsy threshold and the starting age to screen), the prevalence of disease in the screening population, the sensitivity and specificity of the test, and the harm reduction technology. It also separates the formal decision thresholds for screening from the decision thresholds that are implemented, showing their interdependency to each other as well as to the diagnostics of the test. For example, existing studies usually assume a constant PSA level as the trigger for biopsy, which stays constant over time, but this is not an accurate reflection of the clinical practice. Endogenizing such variables allows us to show how they are changing over time, affecting the target screening prevalence, and, hence, the screening diagnostics themselves which are also taken as constants in most studies. To be specific, the model endogenizes the adoption and diffusion of the screening process and defines the different components of screen detection explicitly. These include the fraction of the population that receives the screening test, the sensitivity of the test, biopsy compliance, and biopsy detection. The test sensitivity and currently screened fraction are endogenous to the model, while biopsy compliance and detection are exogenous. Subjects are eligible to receive regular screenings if their doctor adopted the PSA screening test at the time, and if they are around the age-eligible range for the test. Interview results confirm that one of the main determinants of screening is the doctor’s opinion: “Access to care, coverage, and I also think it is how the screening is presented by their doctor….a lot of medicine is sales, and if a doctor presents something as either optional or a bad idea like, “You don’t really want to do that, do you?” the patient’s going to say no. But if their doctor’s enthusiastic about it and believes in it, then they’re probably more likely to go ahead and get it done…”—MD, PhD Erin Hofstatter, Medical Oncologist, Yale School of Medicine.
  • Karanfil and Sterman show that the “formal” recommended starting age to screen varies, both over time and between different guideline-issuing organizations [32]. The recommended “formal” biopsy threshold for PSA testing stayed constant at 4 ng/mL throughout the initial years of screening dissemination, after which it starts to vary in the 2000s. The informal, “practice” threshold, however, has reportedly been lower than the formal one, suggesting poor compliance with recommendations. The real pattern for the average biopsy threshold is unknown, but it is generally accepted to be 2.5 ng/mL between 1990 and 2000 [39]. In addition, Pinsky et al. [53] have shown that biopsy frequencies of men with PSAs between 2.5 and 4 ng/mL were of the same order of magnitude as for men with a PSA higher than 4 ng/mL. The actual starting age data are also not available, but they presumably follow the same pattern as the biopsy threshold, where formal indications first expand in the early years of screening and then start to narrow as harms and the evidence for harms accumulate over time.
  • Since the test diagnostics are directly derived from the underlying probability distributions for diseased and healthy people, the model can as well be used to estimate the real prevalence of the disease.

5.2. Limitations and Further Research

The results of this study rest on several key assumptions. First, as with any other natural history model, we make assumptions about disease onset, progression, and diagnosis in the absence of screening. Second, we assume that disease incidence remains constant at pre-PSA levels after 1987. Third, the model assumes that baseline PCa survival remains constant in the PSA era. We use data from a variety of sources that are subject to limitations. Data on some key indicators, such as the actual starting age and the actual biopsy threshold used in clinical practice, are not available. We used data from expert opinions and published medical literature to justify model propositions.
We also assume a constant clinical detection hazard in the base case, which may lead to an overestimation of screening benefits. In fact, clinical detection rates may also have increased over time because of increased disease awareness in the PSA era. Immigration data was not available by age group and was assumed to be distributed proportionally between age groups, yet it may have implications for population aging. No historical data were available for some other variables we identified as important, including the fraction of healthy men with a false positive or true negative, or the progress of harm reduction technology. However, the focus of this study was on building the most reliable and flexible model structure for medical screening, rather than point prediction for policy variables.
This model is not primarily designed for making inferences about optimal screening policies but can inform modelers and policymakers about potential levers in the system and complement other modeling and interactive studies designed for cancer interventions [54]. Simulation models like ours are flexible tools that can aid healthcare professionals and policymakers in making complex decisions. They can provide constructive insights and dynamic intuition to supplement the typical empirical evidence for updating cancer screening recommendations and can offer a formal means to improve the development and implementation of evidence-based screening.
Future iterations of our simulation model can be employed to design policy recommendations and address important problem areas, such as policy making for cancer survivors, cost of care, or quality of life considerations. Particularly, the increasing pool of cancer survivors in the U.S. is an important consideration, as their numbers in the U.S. are at a record high. The AACR Cancer Progress Report 2022 reports that there are 18 million cancer survivors in the U.S., up from 3 million in 1971, and the number is expected to increase to 26 million by 2040 [55].
The aging of the U.S. population and the increase in life expectancy has serious implications for chronic disease incidence and prevalence since cancer is an age-related disease and the aging of the male population implies more PCa survivors in the future. As more and more men are given a cancer diagnosis by screening, the natural perception of each “survivor” is that screening “saved” his life. However, a portion of these survivors have a type of PCa that could have been treated as effectively when found later, or that might not have caused problems. The problem is that for each “survivor”, there is no way to know whether screening and the treatment “caused” survival, as there is no counterfactual. Thus, the number of men who perceive benefits from screening may be substantially greater than the actual number who receive benefits, and the impression of benefit may get exaggerated.
Existing studies primarily focus on the medical evidence supporting different screening guidelines but usually neglect the broad boundary processes that condition the adoption of and adherence to evidence-based guidelines by clinicians and the public. This simulation study is part of a continuing line of research in our investigation of the universal problem of evidence-based development of sound and reliable clinical practice guidelines (CPGs). Despite their importance especially in high-risk conditions, guidelines are far from optimal in practice. While there is a proliferation of modeling studies to inform CPGs, not many are addressing the actual guideline-making process itself. The scientific community also recently recognized the inherent complexity of the guideline formation process itself and invited researchers to explore the potential implications of this complexity that is inherent in complex decision-making environments. In line with this motivation, we aim to come up with empirically grounded theoretical frameworks and provide formal simulation models to document the long-term effects and unintended consequences of changing disease definitions on published screening guidelines and, consequently, on the actual practice, the specific mechanisms that influence different implementations of these guidelines, and the mechanisms which account for the gaps between the scientific evidence and the actual practice of screening.
Eventually, we aim to expand the boundaries of this case study model to create a more realistic life setting, including the influence of the socio-political environment where the actual screening decision is embedded. More specifically, we aim to look at how medical professional societies—including radiologists, patient advocacy groups, and other principal actors—influence the adoption and diffusion dynamics of medical screening in the U.S. context.

Supplementary Materials

The following supporting information can be downloaded at: https://www.mdpi.com/article/10.3390/systems11050252/s1, Figure S1: Supplementary PSA; Table S1: Supplementary PSA.

Funding

The project was funded by the BIDEB 2232 International Fellowship for Outstanding Researchers Program of TUBITAK (Project No: 118C327) supporting Dr. Özge Karanfil. However, all scientific contributions made in this project are owned and approved solely by the author/s.

Data Availability Statement

Data presented in this article were extracted from publicly available data sources. See Table 1 for data sources. Interview data and consent was obtained from the MIT Committee on the Use of Humans as Experimental Subjects (COUHES) Protocol # 1412006813 Study Title: Dynamics of Routine Screening.

Acknowledgments

The author gratefully thanks John D. Sterman, Hazhir Rahmandad, and Jack Homer for their review of earlier iterations of this work, and to the referees for their constructive and helpful comments and recommendations.

Conflicts of Interest

The authors declare no conflict of interest.

Abbreviations

AACRAmerican Association for Cancer Research
CDCCenters for Disease Control and Prevention
CISNETIntervention and Surveillance Modeling Network
COUHESCommittee on the Use of Humans as Experimental Subjects
CPG Clinical Practice Guidelines
DREDigital Rectal Exam
FNFalse Negative
FPFalse Positive
HBRHarms and Benefits Ratio
HRTHarm Reduction Technology
NCHSNational Center for Health Statistics
NCINational Cancer Institute
NHANESNational Health and Nutrition Examination Survey.
NHISNational Health Interview Survey
PCaProstate Cancer
PLCO Prostate, Lung, Colorectal and Ovarian Trial
PSA Prostate Specific Antigen
SEER Surveillance, Epidemiology, and End Results
USPSTF U.S. Preventive Services Task Force
TP True Positive
TNTrue Negative

References

  1. Hoffman, J.R.; Cooper, R.J. Overdiagnosis of Disease. Arch. Intern. Med. 2012, 172, 1123–1124. [Google Scholar] [CrossRef] [PubMed]
  2. Esserman, L.J.; Thompson, I.M.; Reid, B.; Nelson, P.; Ransohoff, D.F.; Welch, H.G.; Hwang, S.; Berry, D.A.; Kinzler, K.W.; Black, W.C.; et al. Addressing overdiagnosis and overtreatment in cancer: A prescription for change. Lancet Oncol. 2014, 15, e234–e242. [Google Scholar] [CrossRef] [PubMed]
  3. Global Cancer Facts & Figures, 4th ed.; American Cancer Society: Atlanta, GA, USA, 2018; Available online: https://www.cancer.org/research/cancer-facts-statistics/global.html (accessed on 12 April 2023).
  4. Seidman, H.; Mushinski, M.H.; Gelb, S.K.; Silverberg, E. Probabilities of Eventually Developing or Dying of Cancer--United States, 1985. CA Cancer J. Clin. 1985, 35, 36–56. [Google Scholar] [CrossRef] [PubMed]
  5. Altekruse, S.F.; Kosary, C.L.; Krapcho, M.; Neyman, N.; Aminou, R.; Waldron, W.; Ruhl, J.; Howlader, N.; Tatalovich, Z.; Cho, H.; et al. SEER Cancer Statistics Review, 1975–2007. 2010. Available online: http://seer.cancer.gov/csr/1975_2007/ (accessed on 12 April 2023).
  6. Faiena, I.; Holden, S.; Cooperberg, M.R.; Soule, H.R.; Simons, J.; Morgan, T.M.; Penson, D.; Morgans, A.K.; Hussain, M. Prostate Cancer Screening and the Goldilocks Principle: How Much Is Just Right? J. Clin. Oncol. 2018, 36, 937–941. [Google Scholar] [CrossRef] [PubMed]
  7. Ebell, M.H.; Thai, T.N.; Royalty, K.J. Cancer screening recommendations: An international comparison of high income countries. Public Health Rev. 2018, 39, 7. [Google Scholar] [CrossRef]
  8. US Preventive Services Task Force. Screening for Prostate Cancer: US Preventive Services Task Force Recommendation Statement. JAMA 2018, 319, 1901–1913. [Google Scholar] [CrossRef]
  9. SEER. Cancer of the Prostate—Cancer Stat Facts. Available online: https://seer.cancer.gov/statfacts/html/prost.html (accessed on 3 March 2023).
  10. Sterman, J.D. Business Dynamics: Systems Thinking and Modeling for a Complex World; Irwin/McGraw-Hill: Boston, MA, USA, 2000. [Google Scholar]
  11. Homer, J.B.; Hirsch, G.B. System Dynamics Modeling for Public Health: Background and Opportunities. Am. J. Public Health 2006, 96, 452–458. [Google Scholar] [CrossRef]
  12. Sterman, J.D. Learning from Evidence in a Complex World. Am. J. Public Health 2006, 96, 505–514. [Google Scholar] [CrossRef]
  13. Homer, J.B. A diffusion model with application to evolving medical technologies. Technol. Forecast. Soc. Change 1987, 31, 197–218. [Google Scholar] [CrossRef]
  14. Hirsch, G.; Trogdon, J.; Wile, K.; Orenstein, D. Using Simulation to Compare 4 Categories of Intervention for Reducing Cardiovascular Disease Risks. Am. J. Public Health 2014, 104, 1187–1195. [Google Scholar] [CrossRef]
  15. Milstein, B.; Homer, J.; Hirsch, G. Analyzing National Health Reform Strategies with a Dynamic Simulation Model. Am. J. Public Health 2010, 100, 811–819. [Google Scholar] [CrossRef]
  16. Yarnoff, B.; Honeycutt, A.; Bradley, C.; Khavjou, O.; Bates, L.; Bass, S.; Kaufmann, R.; Barker, L.; Briss, P. Validation of the Prevention Impacts Simulation Model (PRISM). In Prev. Chronic Dis.; 2021; 18, p. E09. Available online: www.cdc.gov/pcd/issues/2021/20_0225.htm (accessed on 12 April 2023). [CrossRef]
  17. Atun, R.A.; Lebcir, R.M.; McKee, M.; Habicht, J.; Coker, R.J. Impact of joined-up HIV harm reduction and multidrug resistant tuberculosis control programmes in Estonia: System dynamics simulation model. Health Policy 2006, 81, 207–217. [Google Scholar] [CrossRef]
  18. Burns, W.J.; Slovic, P. The Diffusion of Fear: Modeling Community Response to a Terrorist Strike (2006). Available online: https://ssrn.com/abstract=912736; http://dx.doi.org/10.2139/ssrn.912736 (accessed on 12 April 2023).
  19. Ghaffarzadegan, N.; Rahmandad, H. Simulation-based estimation of the early spread of COVID-19 in Iran: Actual versus confirmed cases. Syst. Dyn. Rev. 2020, 36, 101–129. [Google Scholar] [CrossRef]
  20. Rahmandad, H.; Sterman, J. Quantifying the COVID-19 endgame: Is a new normal within reach? Syst. Dyn. Rev. 2022, 38, 329–353. [Google Scholar] [CrossRef]
  21. Lim, T.Y.; Stringfellow, E.J.; Stafford, C.A.; DiGennaro, C.; Homer, J.B.; Wakeland, W.; Eggers, S.L.; Kazemi, R.; Glos, L.; Ewing, E.G.; et al. Modeling the Evolution of the US Opioid Crisis for National Policy Development. Proc. Natl. Acad. Sci. USA 2022, 119, e2115714119. [Google Scholar] [CrossRef]
  22. Darabi, N.; Hosseinichimeh, N. System dynamics modeling in health and medicine: A systematic literature review. Syst. Dyn. Rev. 2020, 36, 29–73. [Google Scholar] [CrossRef]
  23. Rahmandad, H.; Sterman, J.D. Reporting guidelines for simulation-based research in social sciences. Syst. Dyn. Rev. 2012, 28, 396–411. [Google Scholar] [CrossRef]
  24. Martinez-Moyano, I.J. Documentation for model transparency. Syst. Dyn. Rev. 2012, 28, 199–208. [Google Scholar] [CrossRef]
  25. Richmond, B. Towards a Structural Theory of Cancer. D-Memos. D-4151. MIT Sloan School of Management, Cambridge, MA, USA, 1990. Available online: https://systemdynamics.org/d-memos-4000-4499/ (accessed on 12 April 2023).
  26. Fett, M.J. Developing Simulation Dynamic Models of Breast Cancer Screening; Wellington, New Zealand, 1999. Available online: https://proceedings.systemdynamics.org/1999/PAPERS/PARA47.PDF (accessed on 12 April 2023).
  27. Fett, M. Computer modelling of the Swedish two county trial of mammographic screening and trade offs between participation and screening interval. J. Med. Screen. 2001, 8, 39–45. [Google Scholar] [CrossRef]
  28. Royston, G.; Dost, A.; Townshend, J.; Turner, H. Using System Dynamics to Help Develop and Implement Policies and Programmes in Health Care in England. Syst. Dyn. Rev. 1999, 15, 293–313. [Google Scholar] [CrossRef]
  29. Sheldrick, R.C.; Breuer, D.J.; Hassan, R.; Chan, K.; Polk, D.E.; Benneyan, J. A System Dynamics Model of Clinical Decision Thresholds for the Detection of Developmental-Behavioral Disorders. Implement. Sci. 2016, 11, 156. [Google Scholar] [CrossRef]
  30. Sheldrick, R.C.; Garfinkel, D. Is a Positive Developmental-Behavioral Screening Score Sufficient to Justify Referral? A Review of Evidence and Theory. Acad. Pediatr. 2017, 17, 464–470. [Google Scholar] [CrossRef] [PubMed]
  31. Palma, A.; Lounsbury, D.W.; Schlecht, N.F.; Agalliu, I. A System Dynamics Model of Serum Prostate-Specific Antigen Screening for Prostate Cancer. Am. J. Epidemiol. 2015, 183, 227–236. [Google Scholar] [CrossRef] [PubMed]
  32. Karanfil, Ö.; Sterman, J. “Saving lives or harming the healthy?” Overuse and fluctuations in routine medical screening. Syst. Dyn. Rev. 2020, 36, 294–329. [Google Scholar] [CrossRef]
  33. Karanfil, Ö. Why Clinical Practice Guidelines Shift over Time: A Dynamic Model with Application to Prostate Cancer Screening. Ph.D. Thesis, Massachusetts Institute of Technology, Cambridge, MA, USA, 2016. Available online: http://dspace.mit.edu/handle/1721.1/107531 (accessed on 12 April 2023).
  34. United States Department of Health and Human Services (US DHHS), Centers for Disease Control and Prevention (CDC), National Center for Health Statistics (NCHS), Compressed Mortality File (CMF) on CDC WONDER Online Database. Available online: https://wonder.cdc.gov/mortsql.html (accessed on 12 April 2023).
  35. Life Tables for the United States Social Security Area 1900–2100. August 2025. Available online: https://www.ssa.gov/oact/NOTES/as120/TOC.html (accessed on 12 April 2023).
  36. Cowen, M.E.; Chartrand, M.; Weitzel, W.F. A Markov model of the natural history of prostate cancer. J. Clin. Epidemiol. 1994, 47, 3–21. [Google Scholar] [CrossRef]
  37. Etzioni, R.; Cha, R.; Cowen, M.E. Serial prostate specific antigen screening for prostate cancer: A computer model evaluates competing strategies. J. Urol. 1999, 162, 741–748. [Google Scholar] [CrossRef]
  38. Tsodikov, A.; Szabo, A.; Wegelin, J. A population model of prostate cancer incidence. Stat. Med. 2006, 25, 2846–2866. [Google Scholar] [CrossRef]
  39. Gulati, R.; Inoue, L.; Katcher, J.; Hazelton, W.; Etzioni, R. Calibrating disease progression models using population data: A critical precursor to policy development in cancer control. Biostatistics 2010, 11, 707–719. [Google Scholar] [CrossRef]
  40. Ayer, T.; Alagoz, O.; Stout, N.K. OR Forum—A POMDP Approach to Personalize Mammography Screening Decisions. Oper. Res. 2012, 60, 1019–1034. [Google Scholar] [CrossRef]
  41. Jahn, J.L.; Giovannucci, E.L.; Stampfer, M.J. The high prevalence of undiagnosed prostate cancer at autopsy: Implications for epidemiology and treatment of prostate cancer in the Prostate-specific Antigen-era. Int. J. Cancer 2015, 137, 2795–2802. [Google Scholar] [CrossRef]
  42. Bell, K.J.; Del Mar, C.; Wright, G.; Dickinson, J.; Glasziou, P. Prevalence of incidental prostate cancer: A systematic review of autopsy studies. Int. J. Cancer 2015, 137, 1749–1757. [Google Scholar] [CrossRef]
  43. Haas, G.P.; Delongchamps, N.; Brawley, O.W.; Wang, C.Y.; de la Roza, G. The Worldwide Epidemiology of Prostate Cancer: Perspectives from Autopsy Studies. Can. J. Urol. 2008, 15, 3866–3871. [Google Scholar]
  44. Scardino, P.T.; Beck, J.R.; Miles, B.J. Conservative management of prostate cancer. N. Engl. J. Med. 1994, 330, 1831; author reply 1831–1832. [Google Scholar]
  45. Andriole, G.L.; Crawford, E.D.; Grubb, R.L.; Buys, S.S.; Chia, D.; Church, T.R.; Fouad, M.N.; Isaacs, C.; Kvale, P.A.; Reding, D.J.; et al. Prostate Cancer Screening in the Randomized Prostate, Lung, Colorectal, and Ovarian Cancer Screening Trial: Mortality Results after 13 Years of Follow-up. Gynecol. Oncol. 2012, 104, 125–132. [Google Scholar] [CrossRef]
  46. Mariotto, A.B.; Etzioni, R.; Krapcho, M.; Feuer, E.J. Reconstructing PSA testing patterns between black and white men in the US from Medicare claims and the National Health Interview Survey. Cancer 2007, 109, 1877–1886. [Google Scholar] [CrossRef]
  47. Messing, E.M.; Manola, J.; Yao, J.; Kiernan, M.; Crawford, D.; Wilding, G.; di’SantAgnese, P.A.; Trump, D. Immediate versus deferred androgen deprivation treatment in patients with node-positive prostate cancer after radical prostatectomy and pelvic lymphadenectomy. Lancet Oncol. 2006, 7, 472–479. [Google Scholar] [CrossRef]
  48. Aus, G.; Robinson, D.; Rosell, J.; Sandblom, G.; Varenhorst, E. Survival in prostate carcinoma—Outcomes from a prospective, population-based cohort of 8887 men with up to 15 years of follow-up. Cancer 2005, 103, 943–951. [Google Scholar] [CrossRef]
  49. Hoffman, R.M.; Harlan, L.C.; Klabunde, C.N.; Gilliland, F.D.; Stephenson, R.A.; Hunt, W.C.; Potosky, A.L. Racial differences in initial treatment for clinically localized prostate cancer. J. Gen. Intern. Med. 2003, 18, 845–853. [Google Scholar] [CrossRef]
  50. Carter, H.B.; Piantadosi, S.; Isaacs, J.T. Clinical Evidence for and Implications of the Multistep Development of Prostate Cancer. J. Urol. 1990, 143, 742–746. [Google Scholar] [CrossRef]
  51. Hoffman, R.M.; Zeliadt, S.B. The Cautionary Tale of Psa Testing: Comment on ‘risk Profiles and Treatment Patterns among Men Diagnosed as Having Prostate Cancer and a Prostate-Specific Antigen Level below 4.0 Ng/mL. Arch. Intern. Med. 2010, 170, 1262–1263. [Google Scholar] [CrossRef] [PubMed]
  52. Forrester, J.W. 14 ‘Obvious Truths’. Syst. Dyn. Rev. 1987, 3, 156–159. [Google Scholar] [CrossRef]
  53. Pinsky, P.F.; Andriole, G.L.; Kramer, B.S.; Hayes, R.; Prorok, P.C.; Gohagan, J.K. Prostate biopsy following a positive screen in the prostate, lung, colorectal and ovarian cancer screening trial. J. Urol. 2005, 173, 746–751; discussion 750–751. [Google Scholar] [CrossRef] [PubMed]
  54. Castellano, T.; Moore, K.; Ting, J.; Washington, C.; Yildiz, Y.; Surinach, A.; Sonawane, K.; Chhatwal, J.; Ayer, T. Cervical cancer geographical burden analyzer: An interactive, open-access tool for understanding geographical disease burden in patients with recurrent or metastatic cervical cancer. Gynecol. Oncol. 2022, 169, 113–117. [Google Scholar] [CrossRef]
  55. Cancer Progress Report. AACR Cancer Progress Report. Available online: https://cancerprogressreport.aacr.org/progress/ (accessed on 9 April 2023).
Figure 1. Framework for modeling of PSA screening for prostate cancer (PCa).
Systems 11 00252 g001
Figure 2. Simplified structure for natural disease progression, screen- and clinical detection.
Systems 11 00252 g002
Figure 3. Generic structure of cancer screening for the general (at-risk) population—simplified.
Systems 11 00252 g003
Figure 4. Combined sector diagram for natural disease progression, screen detection and clinical detection (net immigration, aging, all cause and cancer death flows, and other parameters not shown).
Systems 11 00252 g004
Figure 5. Screening Adoption Sector.
Systems 11 00252 g005
Figure 6. Age specific prevalence of asymptomatic PCa among symptom-free men based on autopsy studies [50] vs. base case simulation.
Systems 11 00252 g006
Figure 7. Base-case (a) fraction of screen- vs. clinically detected cancers; (b) overdiagnosis fraction of all diagnosed vs. screen-detected cases.
Systems 11 00252 g007
Figure 8. Overdiagnosis of (a) screen-detected vs. (b) all cases by varying latent fraction, after adoption trends are stabilized, and (c) overdiagnosis rates as maximum adoption fraction for the PSA practice varies between 0–100%.
Systems 11 00252 g008
Figure 9. Confidence plot for (a) overdiagnosed fraction of cases; (b) fraction of metastasized disease at time of diagnosis.
Systems 11 00252 g009
Figure 10. Confidence plot for (a) cumulative number of unnecessary biopsies; (b) fraction of healthy male population living with an FP test result.
Systems 11 00252 g010
Table 2. Extreme condition tests with the corresponding (expected and confirmed) qualitative behavior.
Extreme Condition TestQualitative Behavior
Screening switch turned offPSA screening tests go to zero, % Ever had PSA goes to zero, % of Screen detected cancer goes to zero, % of Clinically detected cancer goes to 100%, Reported PCa prevalence goes down, % of men healthy with a FP goes to zero, no detection, and treatment of latent (indolent) disease
Clinical detection switch turned off% of Cancer clinically detected goes to zero, All cancer detection is through PSA screening
Both screen and clinical detection switches turned offReported PCa incidence goes to zero, Reported PCa prevalence goes to zero, no new PCa cancer survivors
Treatment switch turned off% Ever treated goes to zero, There are no survivors with primary treatment
Treatment is 100% effectiveNo one dies of prostate cancer, M0 and M1 PCa deaths go to zero
Metastasis switch turned offM0 loco-regional disease doesn’t get metastasized, no distant M1 cases, no M1 prostate cancer deaths
All-cause mortality turned offMean population age increases, only deaths are PCa deaths
Decrease in mortality trend is removedOverall deaths increase, population’s mean age goes down
All disease is indolentNo prostate cancer deaths, 100% overdiagnosis
Other logic tests
% PSA detected % of disease detected by screening is 100% for indolent disease (Latent cancer cannot get detected clinically)
PCa incidence/prevalence Reported PCa incidence is higher for older age groups
% Loco-regional at detection 100% for latent disease, as latent disease cannot get metastasized to M1 disease
% Distant at detection 0% for latent disease, higher for higher grade cancer
Disclaimer/Publisher’s Note: The statements, opinions and data contained in all publications are solely those of the individual author(s) and contributor(s) and not of MDPI and/or the editor(s). MDPI and/or the editor(s) disclaim responsibility for any injury to people or property resulting from any ideas, methods, instructions or products referred to in the content.

