Article

Multidimensional Evolution and Driving Factors of Securities Firms’ Collaborative Bond Joint Underwriting Networks in China: A Comprehensive Analysis from 2011 to 2020

1
College of Geography and Environment, Shandong Normal University, Jinan 250358, China
2
School of Economics, Shandong Normal University, Jinan 250358, China
*
Author to whom correspondence should be addressed.
Systems 2023, 11(5), 253; https://doi.org/10.3390/systems11050253
Submission received: 10 April 2023 / Revised: 22 April 2023 / Accepted: 9 May 2023 / Published: 16 May 2023
(This article belongs to the Section Systems Practice in Social Science)

Abstract

:
This study utilizes the joint bond joint underwriting data of China’s securities firms from 2011 to 2020 to systematically explore the evolutionary characteristics of China’s collaborative bond joint underwriting networks from temporal, topological, and spatial dimensions. By employing social network analysis, Ucinet, and ArcGIS, we construct a longitudinal network panel data to quantitatively analyze the driving factors and their underlying mechanisms. The findings reveal that, in terms of topological structure, China’s bond joint underwriting networks exhibit increasingly mature, active, balanced, and accessible features, with domestic securities firms such as China Securities Co., Ltd. emerging as the backbone and foreign-backed firms gradually fading. In the spatial dimension, urban collaboration presents a transformation from triangular to butterfly-shaped, quadrilateral, and ultimately multicore networks. At the regional scale, inter-regional collaboration is most extensive between the eastern regions, followed by eastern–central regions, with eastern–western and central–western regions relatively less engaged. At the urban scale, the central positions of Beijing, Shenzhen, and Shanghai are gradually strengthening, and their external radiation scope is expanding annually. The underlying mechanism driving this evolution is the increasing opportunities for securities firms to establish and adjust their cooperative relationships due to the maturing and active bond joint underwriting networks in China. To compensate for the opportunity cost of bond joint underwriting and to maximize collaboration benefits, securities firms need to select potential partners with close geographical proximity, similar business domains, larger underwriting scales, “friends of friends,” and “network star” status, thereby promoting the continuous evolution of China’s bond joint underwriting syndicates.

1. Introduction

In recent years, global capital markets have been continuously developing and evolving amidst turbulence. Securities firms, playing a vital role in promoting capital flow, enhancing market efficiency, fostering financial innovation, and managing and diversifying risks, have increasingly become the key driving force behind the growth and prosperity of capital markets [1,2]. Business collaboration among securities firms has become a norm due to considerations such as resource complementarity, risk diversification, market share expansion, overall competitiveness enhancement, and cost reduction [3]. As the number of securities firms surges and business volume correspondingly increases, the networked collaboration trends among them become increasingly evident. Adjustments in their business collaborations, driven by regulatory changes, technological advancements, and market dynamics, lead to the continuous evolution of securities firms’ collaborative networks [4]. Delving into the evolutionary characteristics of these networks and systematically identifying the driving factors behind their evolution is of great significance for strengthening business cooperation among securities firms and promoting the healthy development of their collaborative networks.
Bond markets, serving as one of the main avenues for enterprises to raise funds, play a pivotal role in capital market operations [5]. In this regard, securities firms, as core intermediaries in bond joint underwriting, are crucial to the development and prosperity of bond markets. Effective cooperation among securities firms in bond underwriting is essential for bond joint underwriting, capital market operations, and financial stability. After more than two decades of growth, China’s bond market has become the second largest globally, further elevating its importance in the international financial markets [6]. Hence, examining the evolutionary characteristics and driving factors of China’s bond joint underwriting syndicates is necessary for optimizing the collaborative networks of Chinese securities firms in bond joint underwriting and promoting the healthy development of global bond and capital markets.
This study is divided into two parts: the multidimensional evolutionary characteristics of China’s bond joint underwriting networks and the intrinsic mechanisms driving their evolution. In the first part, we employ social network analysis, Ucinet, and ArcGIS analytical tools to analyze the evolutionary characteristics of China’s bond joint underwriting networks from topological, spatial, and temporal dimensions. In the second part, we utilize a stochastic actor-oriented model to quantitatively analyze the factors and underlying mechanisms driving the aforementioned evolution. Compared to existing research, the innovations of this study lie in (1) exploring the network’s evolutionary characteristics from temporal, topological, and spatial dimensions, and (2) applying a newly established stochastic actor-oriented model, leveraging network panel data, to investigate the intrinsic mechanisms driving network evolution. This research aims to provide valuable theoretical and practical insights for policymakers, market participants, and researchers.

2. Literature Review

The investigation of securities firms’ collaboration networks and their driving factors has garnered significant attention from researchers and policymakers, particularly in the context of a rapidly changing global financial market. An expanding body of literature has been devoted to examining the mechanisms and determinants of collaboration networks among securities firms.
First and foremost, numerous studies have sought to delineate the structure and characteristics of collaboration networks in the securities industry. For example, Granovetter [7] and Uzzi [8] have highlighted the importance of strong and weak ties in fostering trust and information diffusion within networks, while Burt [9] has emphasized the role of structural holes in facilitating brokerage opportunities for securities firms. Several empirical analyses have corroborated these theoretical insights by examining the topology, centrality, and clustering of collaboration networks in various financial markets [10,11,12,13,14].
In parallel, researchers have investigated the dynamics and evolution of securities firms’ collaboration networks over time. Longitudinal studies by Scholtens and Wensveen [15], Fricke and Lux [16], and Newman [17] have documented the emergence of core–periphery structures and the changing distribution of power within these networks. Recent work by Zhou et al. [18], Hao et al. [19], Goyal and Vega-Redondo [20], and Battiston et al. [21] has extended this line of inquiry by examining the role of network adaptation and resilience in response to external shocks, such as the global financial crisis and regulatory changes.
A key concern in the literature has been to identify the driving factors behind the formation and evolution of collaboration networks among securities firms. Several studies have pointed to the importance of reputation, expertise, and trust as key determinants of network ties [22,23,24,25]. Other research has emphasized the role of resource complementarities and strategic alliances in shaping collaboration patterns [26,27,28,29].
Moreover, studies by DiMaggio and Powell [30], Scott [31], Acemoglu et al. [32], and Gai et al. [33] have underscored the influence of institutional factors, such as regulatory pressures, market norms, and systemic risk, on the evolution of securities firms’ collaboration networks. Furthermore, research by Herring and Santomero [34], Rochet and Tirole [35], and Goyal and Joshi [36] has examined the impact of financial innovation and technological advances on network structures and inter-firm collaboration.
In summary, the growing body of literature on securities firms’ collaboration networks highlights the complexity and multifaceted nature of the factors driving their formation and evolution. However, there remains room for further expansion on existing research. Firstly, studies on the evolution of securities firms’ cooperation networks generally focus more on the topological structure, with less attention paid to the evolution of these networks in the spatial dimension. Additionally, investigations into the factors driving network evolution often overlook the impact of endogenous factors within the network. To further supplement the existing literature, this paper examines the evolution characteristics of securities firms’ cooperation networks by distinguishing between the topological and spatial structures. Subsequently, it explores the temporal–spatial–topological evolution characteristics of the Chinese securities bond joint underwriting network at the time series level. In examining the factors influencing network evolution, this study applies the stochastic actor-oriented (SAO) model, processing network evolution as longitudinal matrix data and incorporating individual effects of securities firms and endogenous network effects as independent variables, thereby enabling a systematic investigation of the driving factors of network evolution.

3. Theoretical Analysis

3.1. Adequate Opportunity as a Prerequisite for Adjusting Collaborative Relationships

In the bond joint underwriting network x 0 at time t, the basic premise for a securities firm i to establish, adjust, or exit a particular collaborative relationship is the availability of opportunities to carry out such actions. Snijders et al. [37] propose that, in dynamically changing collaborative networks, the aforementioned opportunities are determined by the rate function. The rate function depends on multiple factors, such as the current network x 0 , future network x , individual characteristics of the securities firm v , and the external environment w .The expression of the rate function is as follows:
P x 0 x = p i ( x 0 , x , v , w , ) = exp ( f i ( x 0 , x , v , w , ) ) x C ( x 0 ) exp ( f i ( x 0 , x , v , w , ) )
In Equation (1), P x 0 x represents the opportunity for securities firm i to change its collaborative relationship, where x 0 and x denote the current and future collaborative networks, respectively, v represents the individual characteristics of the securities firm, and w represents external factors.

3.2. The Purpose of Adjusting Collaborative Relationships for Securities Firms Is to Maximize Collaborative Utility

Suppose that securities firms i and j intend to establish a collaborative relationship x i j . For both i and j , the establishment of the collaborative relationship x i j must maximize their respective utilities. Overall, the establishment of a new collaborative relationship can only be realized when both parties fully consider various factors and achieve the maximization of their weighted utilities, thereby promoting the evolution of the collaborative network from x 0 to a new network x , where x C ( x 0 ) . Snijders et al. [37,38] defined the objective function for securities firms when selecting collaboration partners and simulated the evolution of collaborative relationships based on the utility function. Similar to the rate function, the magnitude of the utility function is also influenced by multiple factors, such as the current network x 0 , the future network x , the individual characteristics of the securities firms v , and the external environment w . The expression of the utility function is defined as follows:
f i ( x 0 , x , v , w ) = k β k s k i ( x 0 , x , v , w )
In Equation (2), f i ( x 0 , x , v , w ) indicates the collaborative utility of firm i , β k represents the coefficients of various influencing factors in the utility function, s k i ( x 0 , x , v , w ) represents the influencing factors of the utility function for securities firms, x 0 and x denote the current and future collaborative networks, respectively, v represents the individual characteristics of the securities firm, and w represents external factors.
Overall, the evolution of China’s bond joint underwriting network at the micro level can be regarded as the result of each securities firm, acting as a node, making successive decisions on how to adjust its collaborative relationships. The basic premise of this behavior is that there are sufficient opportunities for adjusting collaborative relationships in the network, as characterized by the rate function. The adjustment of collaborative relationships depends on the magnitude of the utility function calculated by securities firms considering both their own factors and network factors. To comprehensively estimate the rate and utility functions involved in the evolution of the collaboration network, Snijders et al. [31] developed the stochastic actor-oriented (SAO) model. When estimating parameters, the SAO model, as a dependent variable for longitudinal network data, iterates coherently for all nodes in the network data, simulating the continuous evolution of network data at different time periods while corresponding each change in the dependent variable network data with the change in the independent variable data, thereby achieving parameter estimation [39]. Specifically, first, the SAO model can integrate the relevant parameters of the collaborative networks at periods t and t + 1 to estimate the rate function; second, based on the overall utility function (objective function) of securities firms, the SAO model can estimate the parameters of the influence of various factors, such as the network factors and individual factors of securities firms, on their decision making.

4. Data and Methodology

4.1. Data Source and Processing

4.1.1. Data Source

The data in this study were sourced from the Wind Economic Database. Considering factors such as data availability and sample size, bond underwriting data from 2011–2020 within Mainland China was downloaded, including bond varieties such as corporate bonds, company bonds, and asset-backed securities. A total of 13,158 bond underwriting records were obtained, each containing bond name, issuance date, issuance amount, and all lead underwriters involved in the bond issuance (including lead and co-lead underwriters).

4.1.2. Data Processing

(1) Data Cleaning: as this study focuses on the evolution of the bond joint underwriting network, bond information solely underwritten by a single securities firm was removed, retaining information on bonds jointly underwritten by two or more securities firms.
(2) Data Preprocessing: The retained bond information was uniformly processed into pairwise collaborations between securities firms. If a bond was jointly underwritten by three or more securities firms, corresponding processing was performed through permutations and combinations.
(3) Construction of Collaboration Matrix: based on the pairwise collaboration bond joint underwriting information, the bond joint underwriting matrix was constructed for each year from 2011 to 2020.
(4) By excluding securities firms that reappear over the years, a total of 121 securities firms engaged in bond joint underwriting from 2011 to 2020. Attribute information of the 121 securities firms was obtained using the Tianyancha app; the latitude and longitude information of the firms’ headquarters were obtained using Python software in Baidu Maps for future use.

4.2. Research Method

4.2.1. Data Processing

This study applies social network analysis and its dedicated quantitative analysis software, Ucinet, to construct and present the Chinese bond joint underwriting network and systematically measure network indicators. In recent years, social network analysis, specifically for quantitative analysis of relational data, has been increasingly used in the field of economic management research [40,41,42]. As bond joint underwriting is a typical network relationship issue, this study employed social network analysis to first construct the Chinese bond joint underwriting matrix based on bond joint underwriting data; subsequently, Ucinet, a specialized analysis software for social network analysis, was utilized to perform quantitative measurements and interpretations of the network, which formed the basis for summarizing the evolution characteristics of the Chinese bond joint underwriting network.

4.2.2. Stochastic Actor-Oriented Model

This study employs the stochastic actor-oriented (SAO) model for parameter estimation. The SAO model is an econometric model developed by Professor Snijders of Oxford University and others in recent years, specifically for statistical inference and parameter estimation using longitudinal network empirical data [43,44,45]. When estimating parameters, the SAO model iterates coherently for all nodes in the network data as a dependent variable for longitudinal network data, simulating the continuous evolution of network data at different time periods while corresponding each change in the dependent variable network data with the change in the independent variable data, thereby achieving parameter estimation [39]. In this study, since the estimation of the underlying mechanism driving the evolution of the Chinese bond joint underwriting network involved a large amount of relational data, and severe multicollinearity existed among variables, conventional parameter estimation methods could not be used. The SAO model does not impose strict requirements on the correlations between variables; even if there is a significant correlation between variables, it does not affect the model’s parameter estimation, thus allowing for a comprehensive and systematic parameter estimation of the interactions between variables.

4.3. Model Specification

The RSiena software was employed to estimate the parameters of the SAO model. The dependent variables, independent variables, and control variables were set as follows:

4.3.1. Dependent Variables

The dependent variables consist of 10 longitudinal cooperation matrices from 2011 to 2020, with both the rows and columns representing the 121 securities firms. These matrices are denoted as Y n × n t ( t 2011 2020 ; n = 121 ) .

4.3.2. Independent Variables

Eight indicators were selected as independent variables, encompassing individual effects of securities firms and network endogenous effects (Table 1).

4.3.3. Control Variables

Referring to existing research [46,47,48], the density effect of the cooperation network was used as a control variable, with the data type being vector data (n × 1).

4.4. Variable Measurement

4.4.1. Dependent Variables

The 10 longitudinal cooperation matrices from 2011 to 2020 are all binary matrices. The 0–1 variables were determined by examining the bond joint underwriting data from 2011 to 2020 to identify whether there was a bond joint underwriting relationship between the 121 securities firms. If a cooperation relationship existed in the corresponding year, it was denoted as 1; if not, it was denoted as 0. This results in 10 longitudinal cooperation matrices, denoted as Y n × n t ( t 2011 2020 ; n = 121 ) .

4.4.2. Independent Variables

(1)
Individual Effects
Individual effects encompass both homogeneity and heterogeneity aspects. Homogeneity mainly considers geographic, domain, institutional, and organizational similarity between securities firms as independent variables, ultimately forming an n × n similarity matrix based on the calculated results. Heterogeneity is determined by calculating the bond joint underwriting experience and scale of securities firms, resulting in an n × 1 vector. As the RSiena analysis software used in this study is more suitable for analyzing non-negative integers with no more than 10 independent variables, the specific calculations are as follows:
 1.
Geographic Similarity
Based on the geographic information of securities firms, the spatial distance between them is calculated. To reduce heteroscedasticity, the spatial distance is increased by 1, and its logarithm is taken. The difference between 10 and the logarithm value is rounded to the nearest integer and used as the measure of geographic similarity between securities firms. The formula is as follows:
P G i j = 10 ln ( 1 + d i s i j )
In this formula, d i s i j denotes the spatial distance between securities firms i and j , and P G i j represents the numerical value of geographic similarity between the firms. The larger the value, the greater the geographic similarity.
 2.
Domain Similarity
Domain similarity is characterized by the similarity of underwriting domains between securities firms in the same year. Specifically, the ratio of the number of bonds jointly underwritten by two securities firms to the square root of the product of the number of bonds underwritten by each firm is calculated. The formula is as follows:
T P i j = 2 P i j P i + P j
In this formula, T P i j represents the domain similarity value between securities firms i and j , P j denotes the number of bonds underwritten by securities firms i and j , respectively, and P i j represents the number of bonds jointly underwritten by securities firms i and j . The closer the T P i j value is to 1, the stronger the domain similarity between securities firms i and j .
To meet the data requirements for non-negative integers, a slight modification is needed by setting a threshold value of 0.5 and processing the calculation results into 0/1 variables. The formula is as follows:
T P i j = 1 ( 0.5 T P i j 1 ) 0 ( 0 T P i j < 0.5 )
 3.
Institutional Similarity
Securities firms are mainly classified into central state-owned enterprises, provincial state-owned enterprises, and mixed-ownership enterprises, and different types of securities firms have significant differences in management models and corporate systems. As a result, dummy variables are introduced, using 0 and 1 to represent whether the securities firms engaging in underwriting cooperation belong to the same type.
I P i j = 1 ( a i = a j ) 0 ( a i a j )
In this formula, I P i j represents the institutional similarity value between securities firms i and j . When the securities firms are the same type, the value is 1, if not, it is 0.
 4.
Organizational Similarity
Organizational similarity is characterized by whether there exists an affiliation relationship between securities firms. “Affiliation relationship” is defined as a limited number of categories, such as belonging to the same group, and holding or shareholding relationship. By introducing dummy variables, 0 and 1 are used to represent the presence or absence of organizational similarity between securities firms.
O P i j = 1 ( e x i s t   t h e   i n c i d e n t   r e l a t i o n ) 0 ( i n e x i s t   t h e   i n c i d e n t   r e l a t i o n )
 5.
Experience Heterogeneity
Referring to the method of Zhou Can [49], the number of years which a securities firm appears in the period 2011–2020 is used to measure its underwriting experience and characterize its experience heterogeneity.
 6.
Scale Heterogeneity
Drawing on the research of Balland et al. [48] and Zhou Can [49], the logarithm of the total number of bonds underwritten by securities firms (calculated by the number of bonds, including independent and joint underwriting) is taken and rounded to the nearest integer, which is used to measure their underwriting scale.
(2)
Network Endogenous Effects
Network endogenous effects refer to the influence of the overall or local structural characteristics of the network on the selection of cooperation partners by securities firms. In this study, the structural embeddedness and preferential attachment dimensions of the network are explored.
 1.
Structural Embeddedness
The structural embeddedness of the network is measured using the method proposed by Balland et al. [48] and Shi, X. et al. [50]. The number of triadic closures related to securities firm i is used to characterize its level of structural embeddedness. The formula is as follows:
T i = i j x i k x j k x j k
In this formula, T i represents the structural embeddedness value of securities firm i ; j and k are securities firms that have established cooperative relationships with each other outside of node i , so the value of x j k is fixed at 1. The existence of cooperative relationships between securities firm i and firm j and k is represented by 0 or 1, with x i k x j k x j k equal to 1 indicating the formation of a triadic closure, and 0 indicating the absence of a triadic closure.
 2.
The preferential attachment
The preferential attachment of a network refers to the tendency of a securities firm to establish cooperative relationships with other entities of higher status. In the context of bond joint underwriting networks, the direct manifestations of high status lie in two aspects, which are broad scope of cooperation and high intensity of cooperation. These are measured by the number of cooperation partners and the number of cooperative relationships of a securities firm, respectively. To comprehensively consider these two factors, this study calculates node preferential attachment using the following formula, rounding the results to the nearest integer:
P i = j x i j j a j x i j
In this formula, P i represents the network preferential attachment of securities firm i , which is equal to the product of the square roots of the number of securities firms with which i has established cooperative relationships and the total number of cooperative relationships established with i ; j represents other securities firms that have direct cooperative relationships with i ( x i j ), and a j represents the number of times j cooperates with i .

4.4.3. Control Variables

In this study, drawing on the calculation method of Balland et al. [48], the degree centrality of a securities firm is used to represent its density effect. The formula is as follows:
D i = j x i j
In this formula, D i represents the density effect value of securities firm i , and j denotes the securities firms with which i has established cooperative relationships.

5. Research Results

5.1. Multidimensional Evolution of China’s Bond Joint Underwriting Network

From 2011 to 2020, the scale of China’s bond joint underwriting network has been continuously expanding. In terms of the absolute number of securities firms engaging in bond joint underwriting, the number of securities firms in China’s bond joint underwriting network increased from 20 in 2011 to 96 in 2020, a growth of 4.85 times. In relative terms, the number of securities firms participating in bond joint underwriting accounted for 22.22% of the total number of securities firms in China in 2011, and this ratio rose to 72.18% in 2020 (Figure 1). The significant growth indicates that the enthusiasm of domestic securities firms in China in bond joint underwriting has been steadily increasing, and the bond joint underwriting network in China is becoming more active. This serves as the foundation for the continuous evolution of China’s bond joint underwriting network.

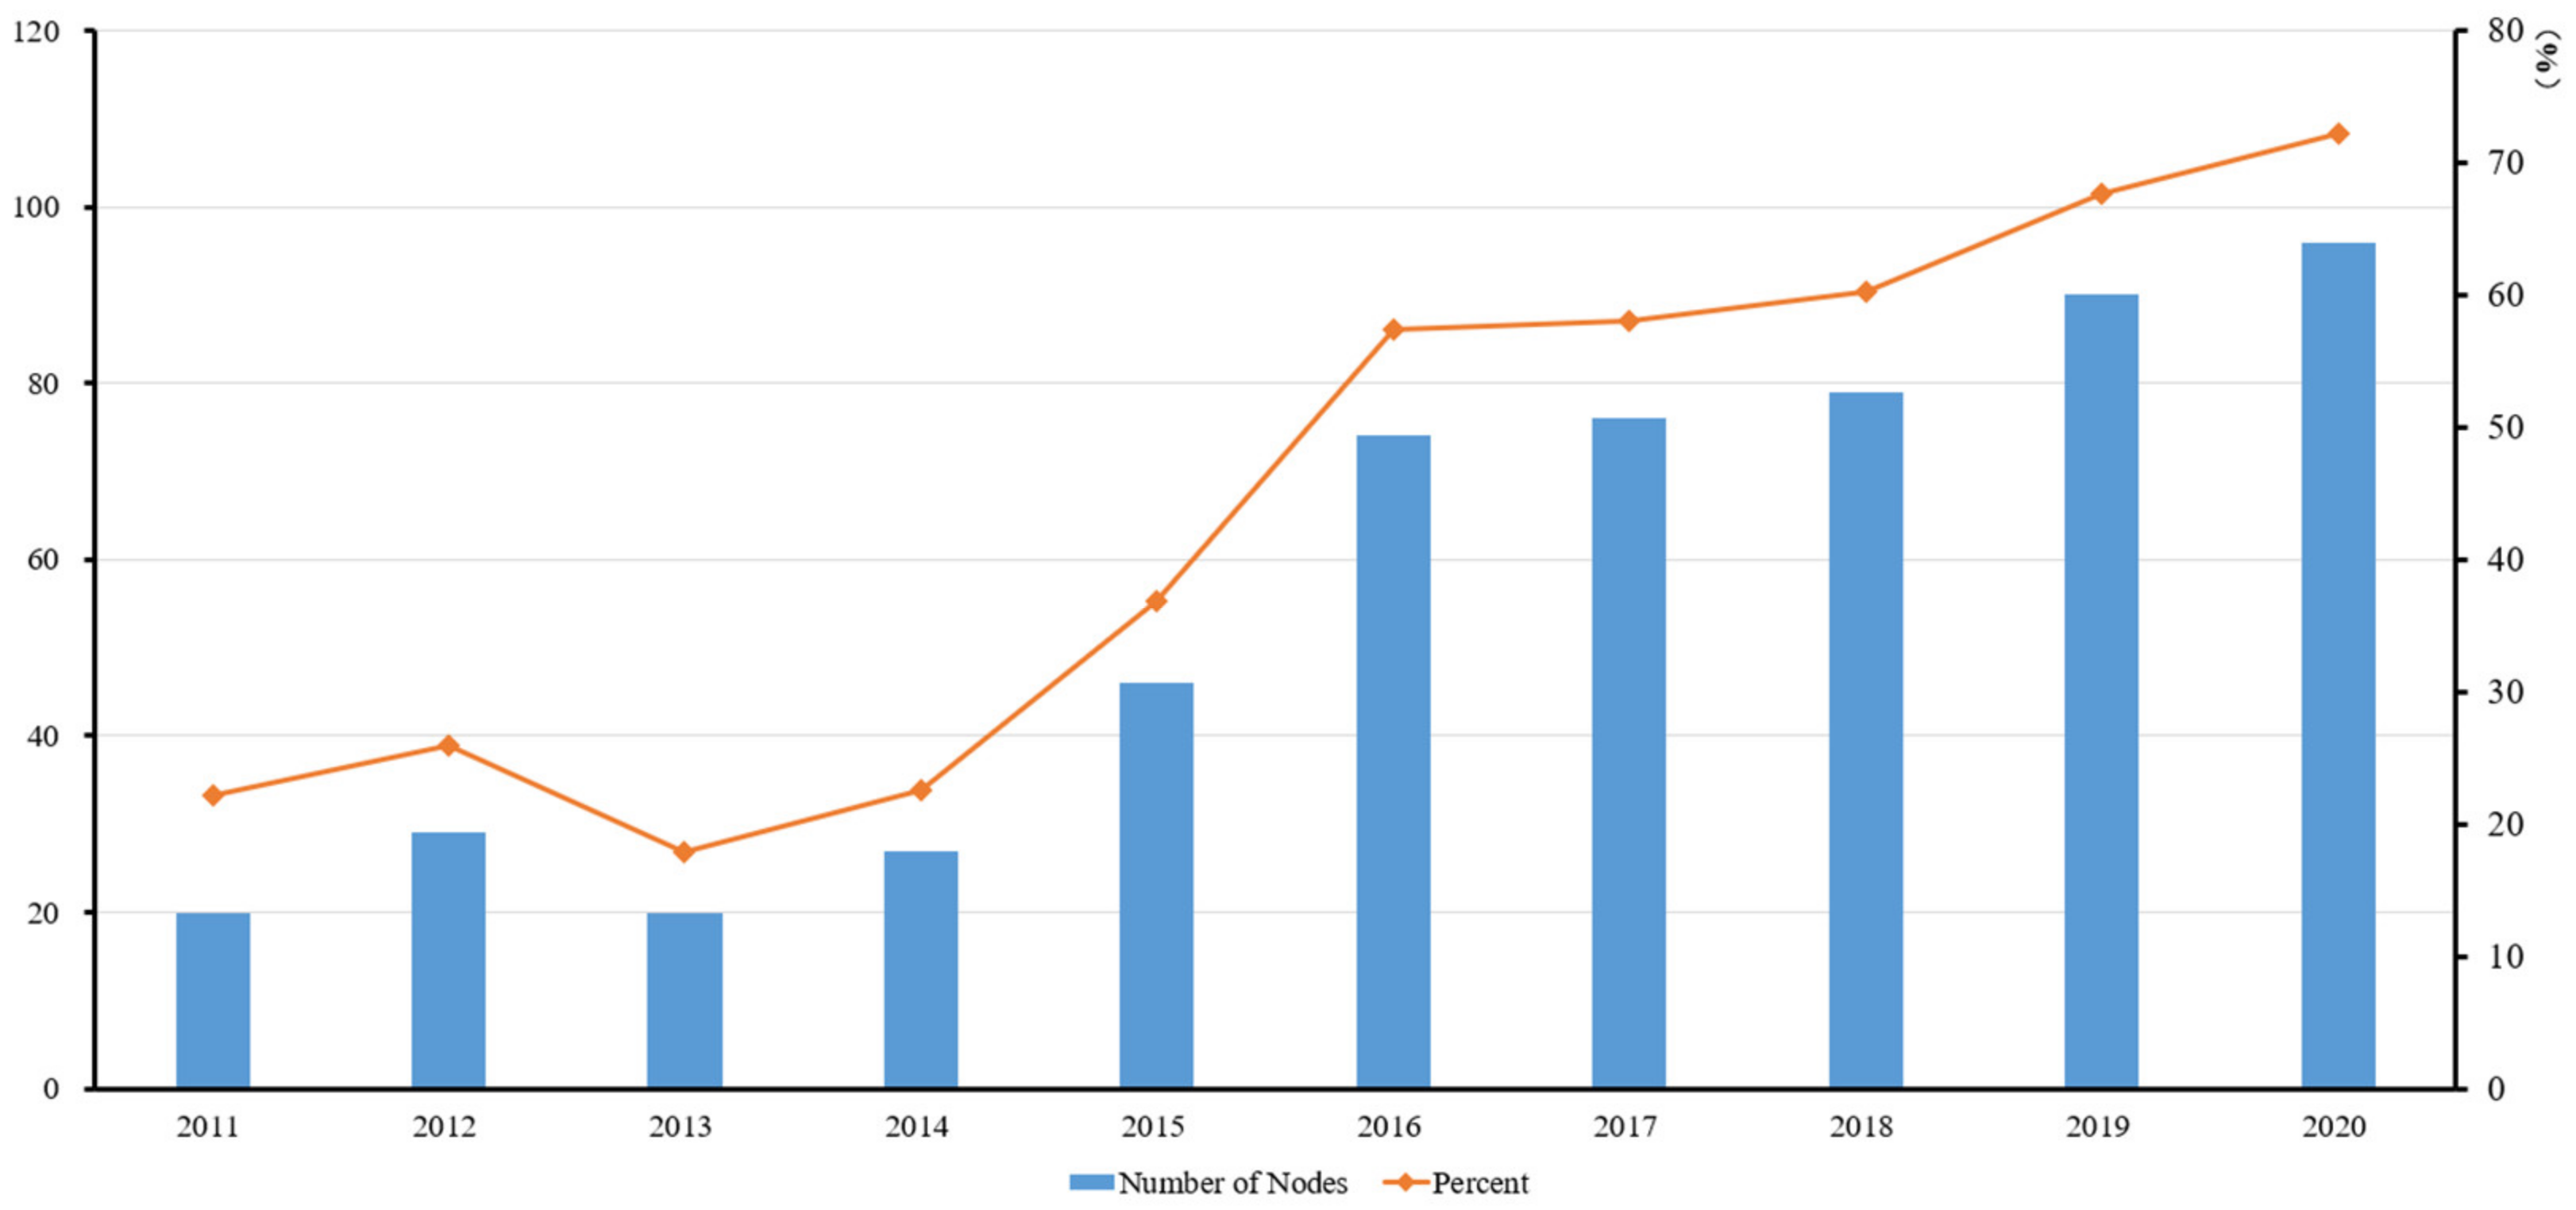
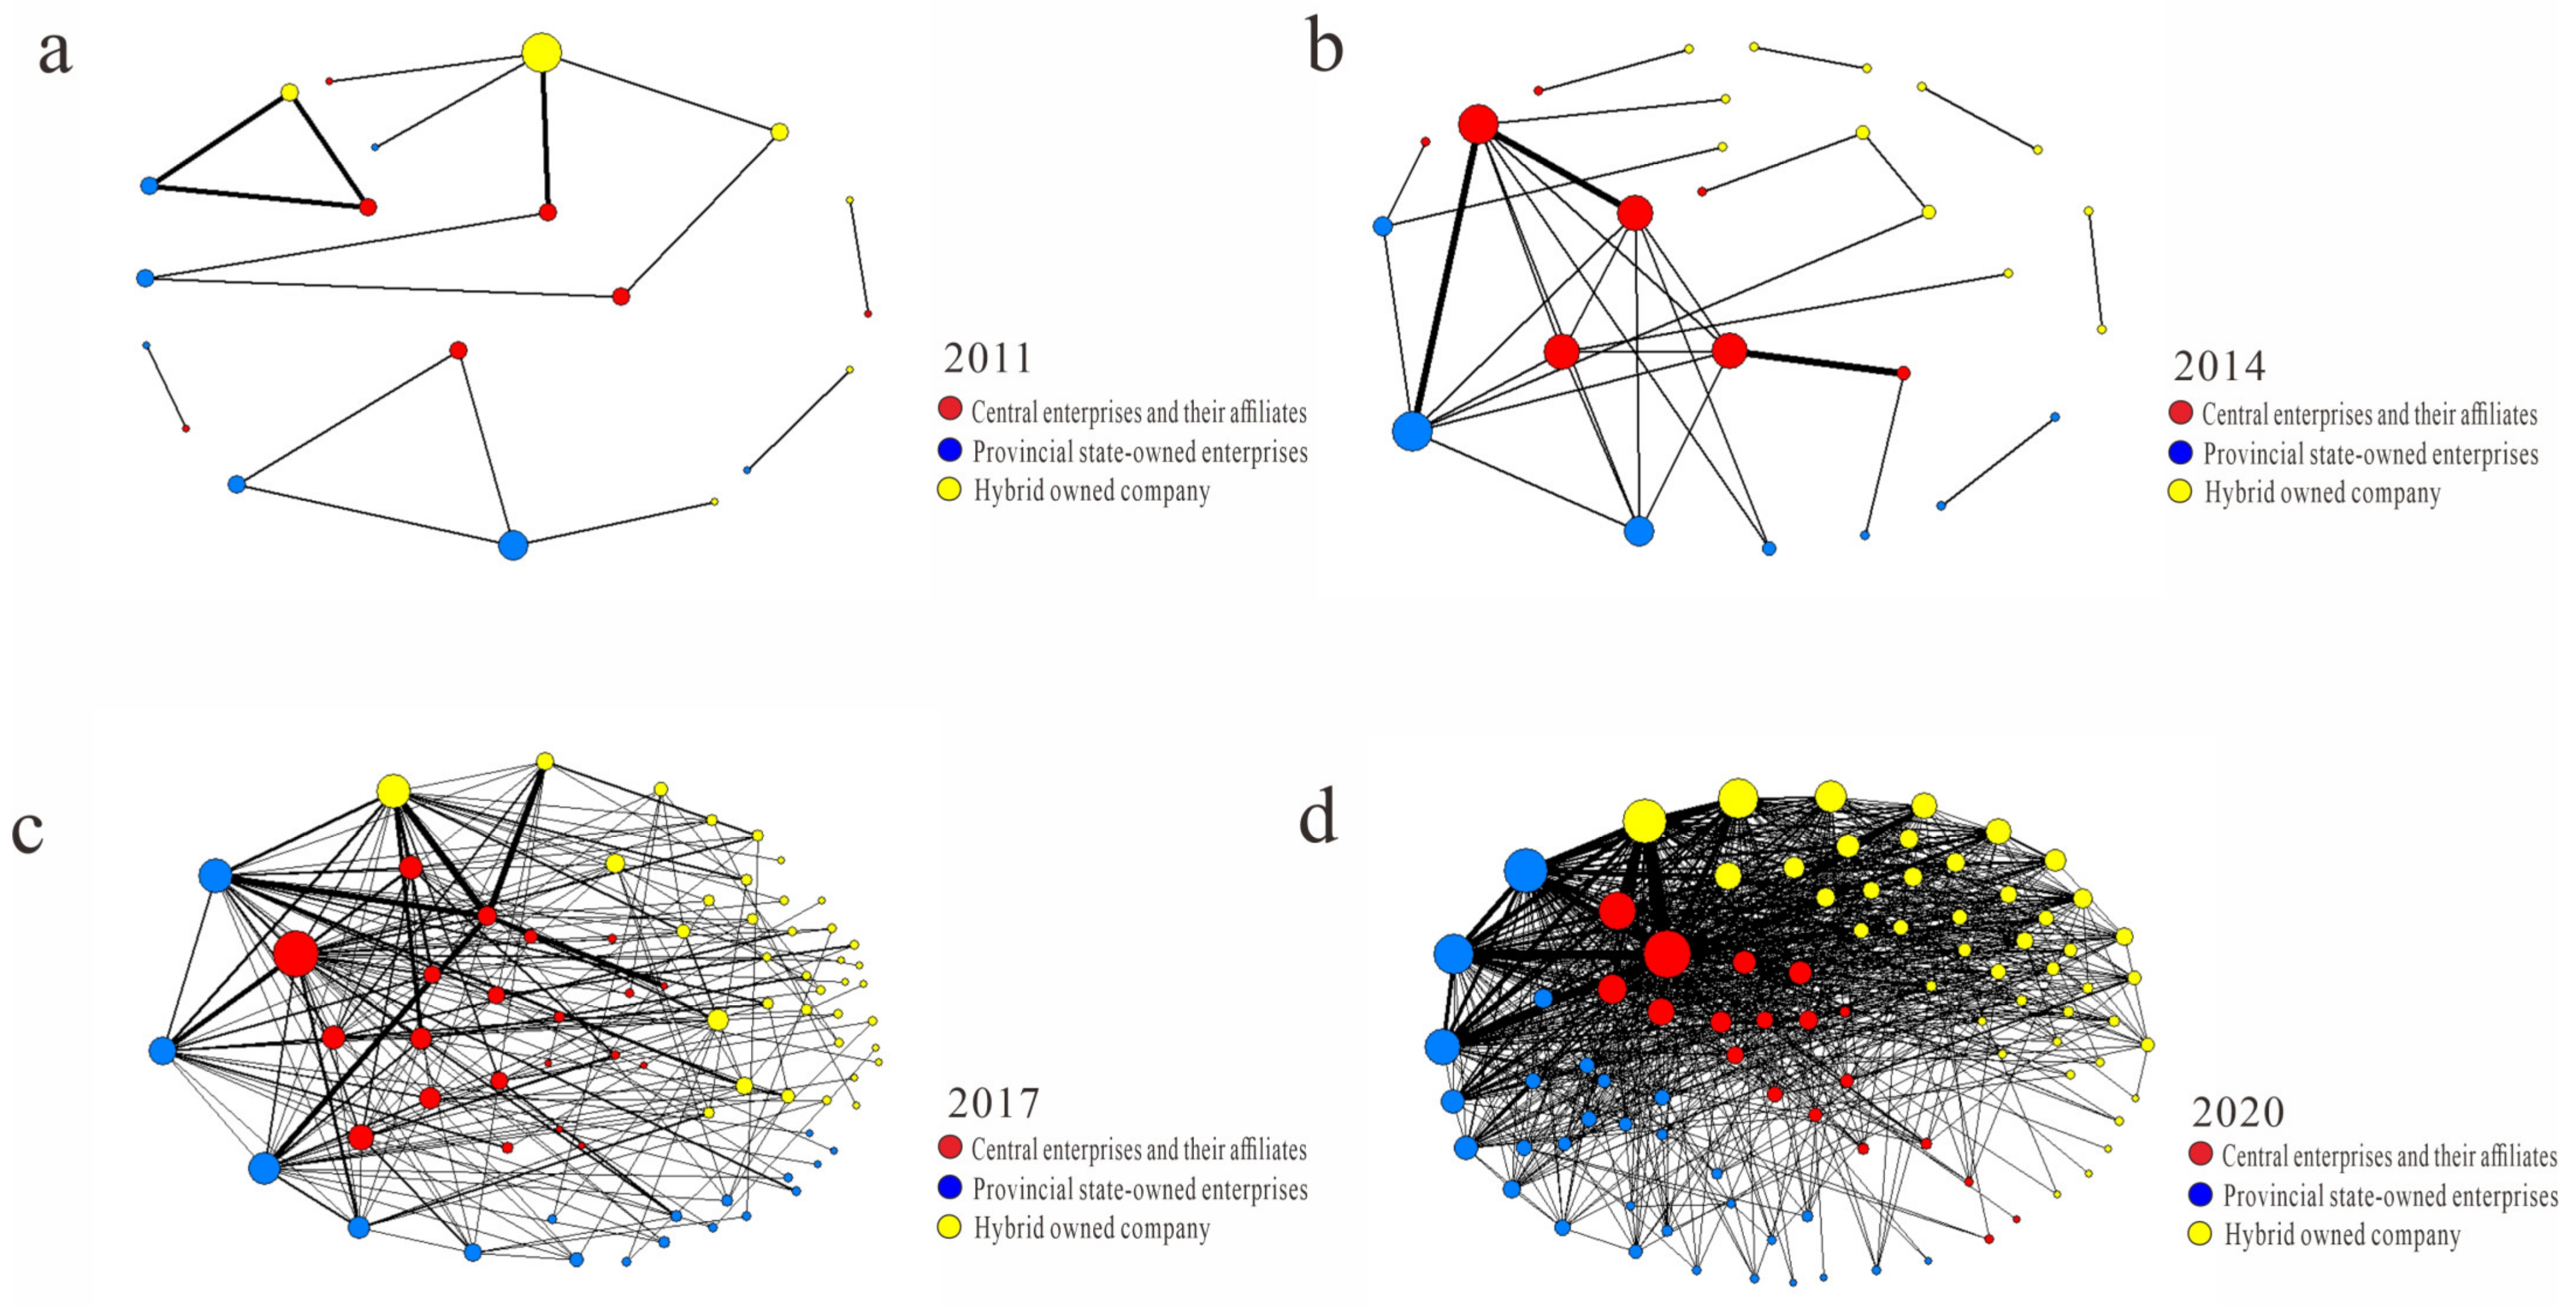
5.1.1. Network Structure Evolution

(1)
Overall Evolutionary Characteristics
Overall, China’s bond joint underwriting network is becoming increasingly mature and active (Figure 2). In terms of network density, the network density indicator calculated through Ucinet represents the ratio of the actual number of cooperative relationships in the joint underwriting network to the maximum theoretical number of relationships. The closer the network density is to 1, the closer the actual number of relationships between network nodes is to the maximum theoretical value. For China’s bond joint underwriting network, the network density in 2011 was 0.111, which rapidly increased to 0.979 in 2020, approaching the maximum theoretical value. This indicates that by 2020, Chinese securities firms had engaged in relatively comprehensive cooperation in the field of bond joint underwriting. This is also indirectly confirmed by the average degree indicator. The average degree indicator represents the average number of cooperative partners each network node has in the network. In 2011, each node in China’s bond joint underwriting network had an average of 1.7 partners, which significantly increased to 17.261 by 2020, implying that each securities firm, on average, collaborated with nearly 17 other securities firms in bond joint underwriting.
Although the cooperation intensity of securities firms in the bond joint underwriting field has been gradually strengthening, the “dominance of a single firm” has not emerged in China’s bond joint underwriting network. On the contrary, the development of China’s bond joint underwriting network is becoming increasingly balanced. This can be seen from the calculation of the clustering coefficient indicator. In 2011, the clustering coefficient of China’s bond joint underwriting network was 0.741. Since then, this indicator has decreased annually, dropping to 0.044 by 2020, indicating that China’s bond joint underwriting network is becoming more dispersed.
At the same time, thanks to the enhanced strength and increasing balance of securities firms’ underwriting cooperation, the overall convenience of securities firms in China’s bond joint underwriting network collaborating with other firms has improved. In 2015, the average path length for securities firms to collaborate with other firms in China’s bond joint underwriting network was 3.201. Subsequently, this value gradually decreased, and by 2020, the average path length indicator had dropped to 1.916, which is approximately 60% of the 2015 value (Table 2).
(2)
Evolutionary Characteristics of Key Nodes
Key nodes are the backbone of China’s bond joint underwriting network. The evolutionary characteristics of key nodes are a concentrated manifestation of the evolution of China’s bond joint underwriting network. Overall, the key nodes in China’s bond joint underwriting network exhibit the following evolutionary features: Firstly, the attractiveness of foreign securities firms as bond joint underwriting partners is gradually weakening. In 2012, foreign-dominated securities firms such as UBS Securities and Goldman Sachs Gao Hua Securities attracted a large number of partners. Among them, UBS Securities established cooperative relationships with 12% of the securities firms in China’s bond joint underwriting network, accounting for 17.6% of the total cooperative relationships in the network. By 2020, all of the top five securities firms were domestic Chinese firms. Secondly, China Securities Co., Ltd. and other securities firms are increasingly becoming stars in China’s bond joint underwriting network, with their positions becoming more and more stable. Since 2016, China Securities Co., Ltd. has held the top position, being the most important securities firm in both binary and weighted cooperation networks. Moreover, China Securities Co., Ltd., Guotai Junan Securities, Haitong Securities, and Huatai United Securities have consistently ranked among the top firms (Figure 2 and Table A1).

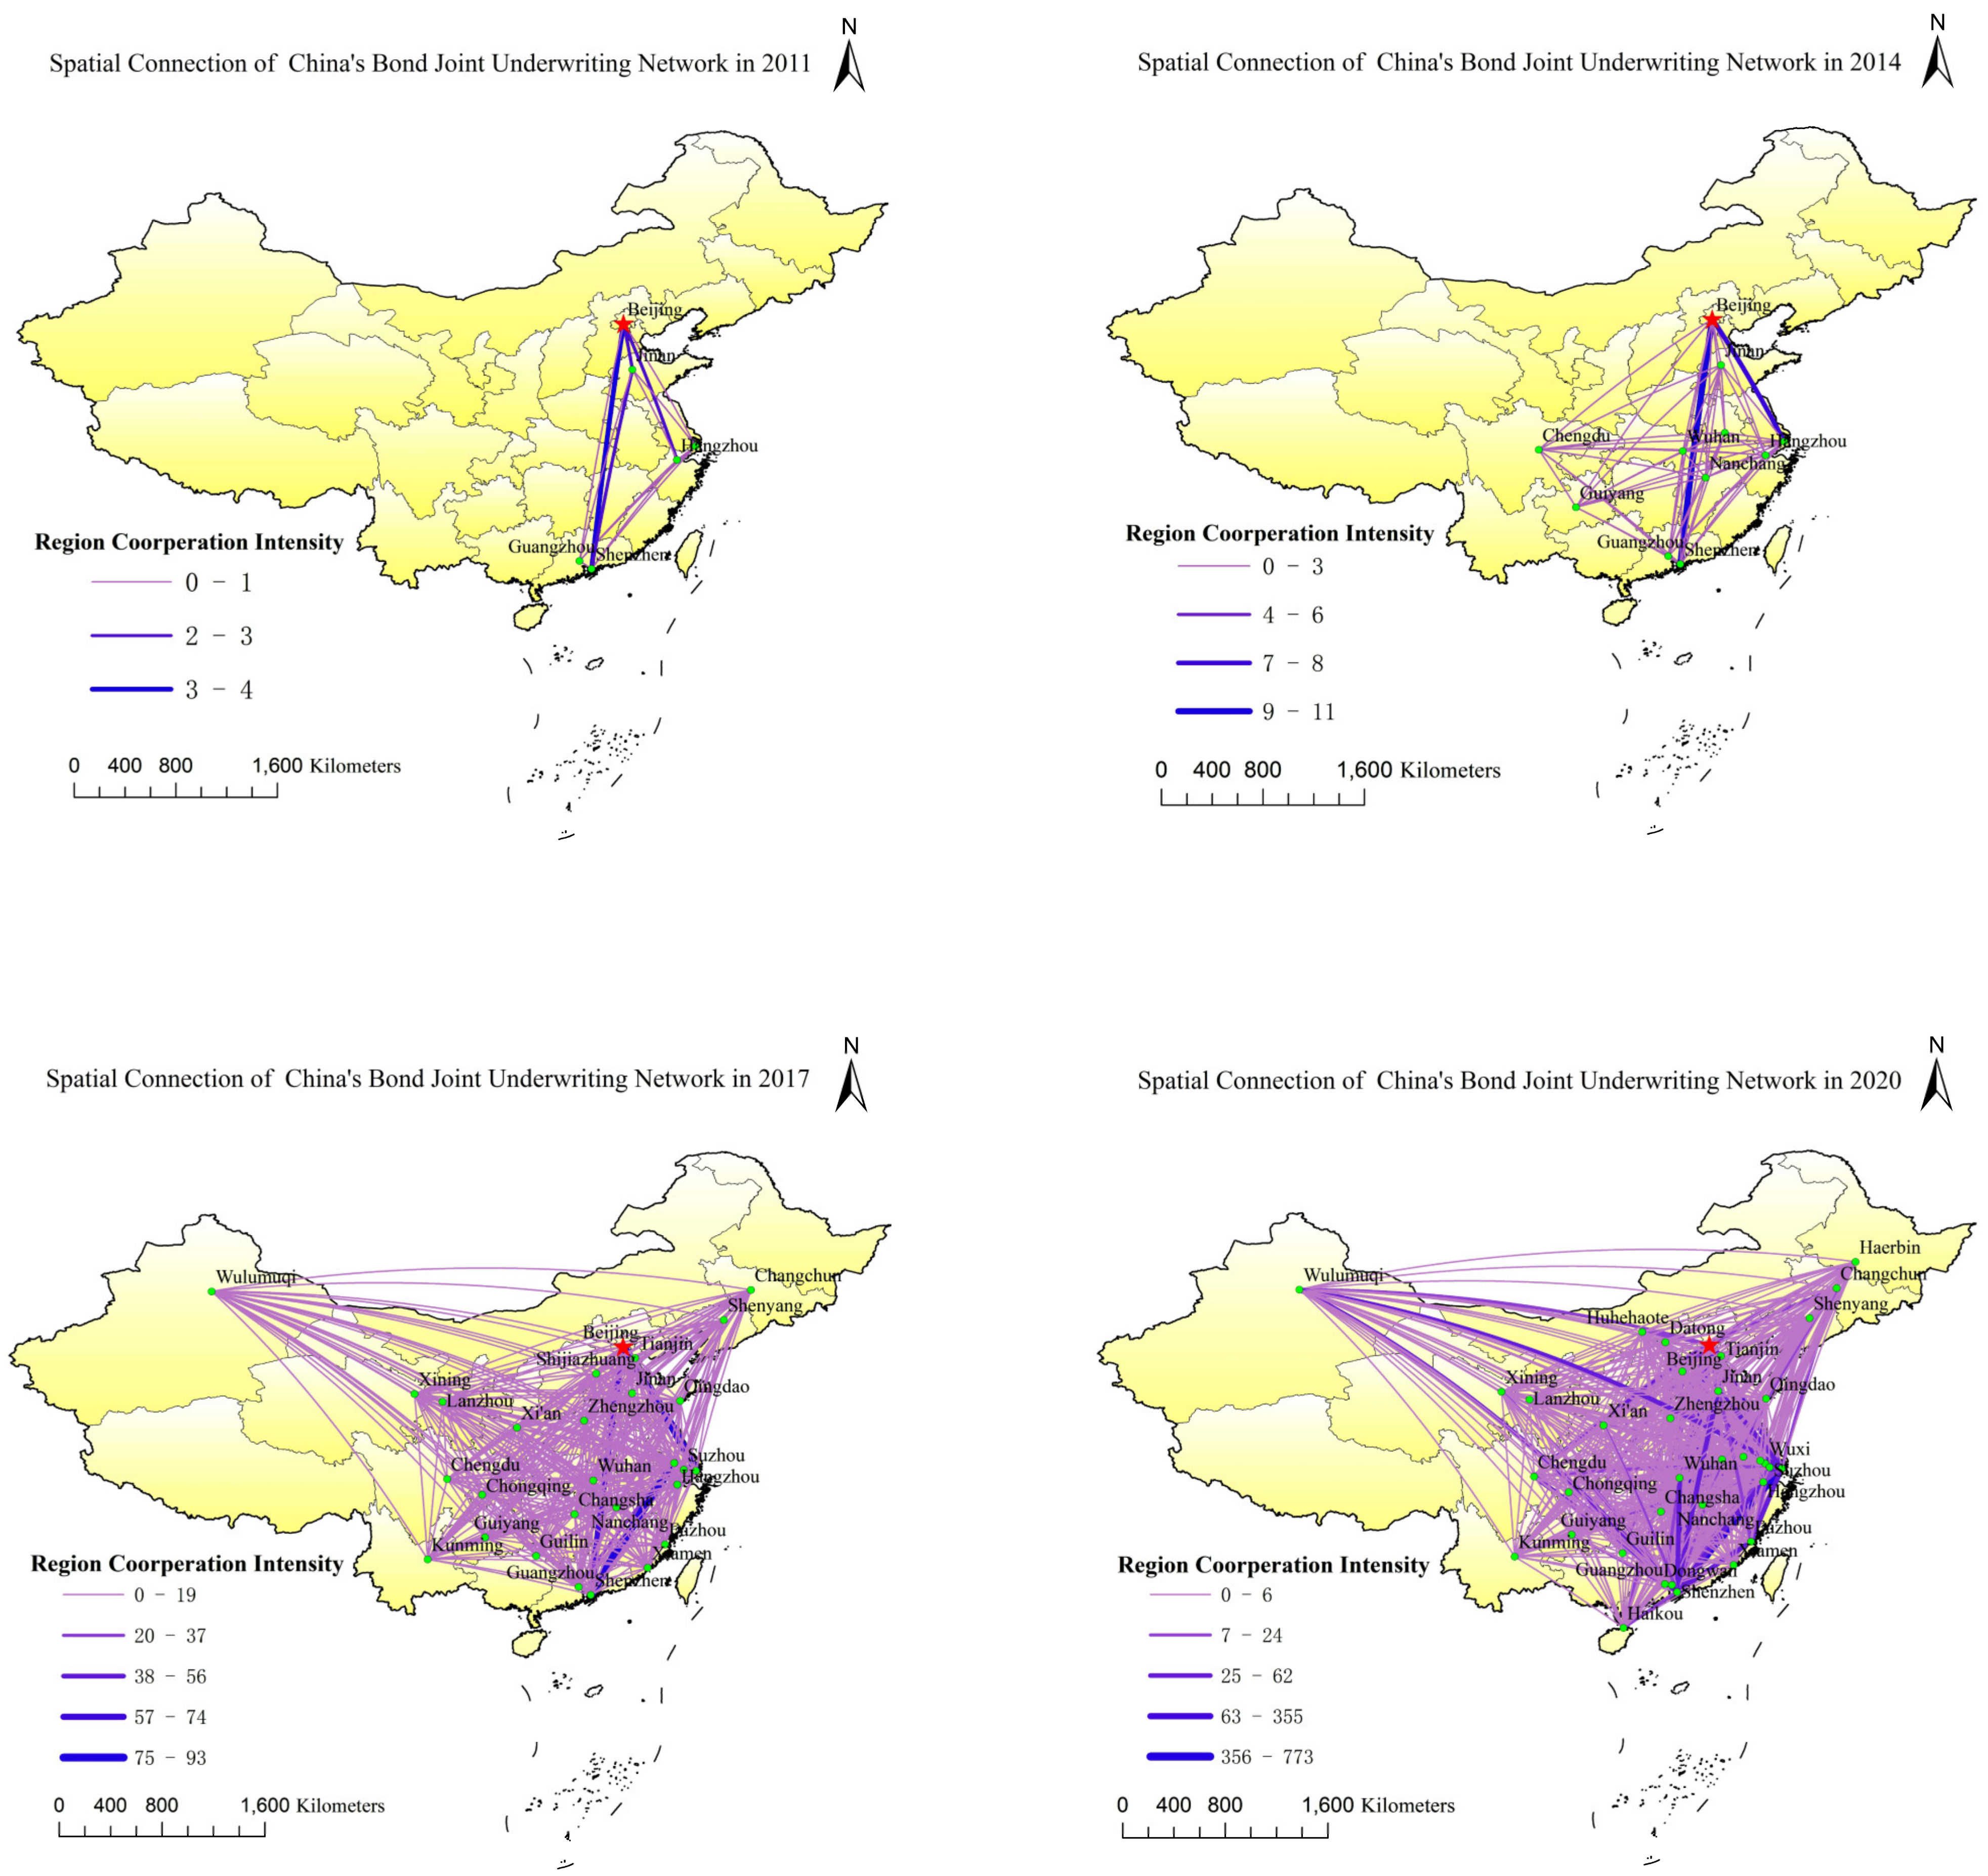
5.1.2. Evolution of Network Spatial Pattern

From the perspective of the overall pattern, the urban cooperation pattern presents a changing trend, from a triangular, to a butterfly, quadrilateral, and then multi-core network (Figure 3). In 2011, urban cooperation presented a triangular pattern supported by Beijing, Shenzhen, and Shanghai; in 2014, urban cooperation exhibited a butterfly pattern primarily supported by Beijing, Shenzhen, Shanghai, and Chengdu, with a significantly expanded scope of urban cooperation; in 2017, urban cooperation showed a quadrilateral pattern mainly supported by Beijing, Shanghai, Shenzhen, and Chengdu, with urban cooperation expanding inward and outward to the northwestern China and northeastern China regions; in 2017, urban cooperation presented a multi-core network pattern, with Beijing, Shanghai, Shenzhen, Chengdu, and other cities still playing important roles in urban cooperation, and the positions of more cities, such as Xiamen, Changsha, Harbin, and Lanzhou, in urban cooperation were strengthened, making urban cooperation increasingly intricate and complex.
From a regional scale perspective, cooperation is most extensive between the eastern–eastern regions, followed by eastern–central regions, while cooperation between eastern–western and central–western regions is relatively lower. In 2011, urban cooperation mainly concentrated in the eastern–eastern region, with the highest number of urban cooperation occurrences not exceeding four times; in 2014, urban cooperation still primarily focused on the eastern–eastern region, with cooperation between the eastern–central regions represented by Chengdu–Shanghai and Guiyang–Shanghai has started to form, and the highest number of urban cooperation occurrences not exceeding eleven times; in 2017, urban cooperation mainly concentrated in the eastern–eastern region, with cooperation between the eastern–western regions growing, and cooperation between the eastern–western regions represented by Urumqi–Shanghai and Urumqi–Shenzhen has started to form, with the highest number of urban cooperation occurrences increasing to 93 times; in 2020, urban cooperation mainly focused on the eastern–eastern, eastern–central regions, with cooperation between the eastern–western regions growing, and cooperation between the central–western regions represented by Urumqi–Chengdu starting to form, with the number of urban cooperation occurrences increasing rapidly, reaching a maximum of 773 times.
From an urban scale perspective, Beijing, Shenzhen, and Shanghai have maintained central positions over the past decade, with the external radiation range of the three cities expanding year by year, and the connections between the three cities being the strongest. With the development of transportation and the growth in economic scale, the positions of provincial capital cities such as Chengdu, Jinan, Wuhan, Changsha, and Xi’an have been elevated, with an increase in the number of inter-city cooperation occurrences. The cooperation between cities has evolved from one-to-one to one-to-many and is gradually moving towards a many-to-many development trend (Figure 3).

5.2. Driving Mechanisms of above Evolution

5.2.1. Estimation of Rate Functions

Rate functions are utilized to characterize the opportunities for securities firms to adjust their cooperative relationships within the joint underwriting network. According to the estimation results in Table 3, the rate function estimation for China’s bond joint underwriting network exhibits an overall upward trend. This implies that, during the 10-year period from 2011 to 2020, the opportunities for securities firms seeking to establish, withdraw, or dynamically adjust cooperative relationships within China’s bond joint underwriting network have been increasing. The growing opportunities to adjust cooperative relationships serve as the foundation for the continuous evolution of the structure of China’s bond joint underwriting network.

5.2.2. Estimation of Utility Functions

(1)
Opportunity cost of bond joint underwriting cooperation
The density effect is the constant term in the parameter estimation of this study. The estimated constant term is −1.998, significant at the 1% statistical level, indicating that there is an opportunity cost for securities firms to establish and adjust bond joint underwriting cooperative relationships. On one hand, when engaging in bond joint underwriting with other securities firms, they need to conduct partner searches, preliminary communications, and business negotiations, which are costs inherent in cooperation. On the other hand, due to the fierce competition in the bond joint underwriting field, establishing cooperation with one partner often means giving up potential cooperation with another securities firms.
It is precisely because of the presence of opportunity costs that securities firms need to choose the most ideal cooperative partners based on the principle of utility maximization to compensate for the opportunity costs of bond cooperation underwriting. In the subsequent bond joint underwriting process, securities firms continuously search for more ideal partners and adjust cooperative relationships, thereby promoting the evolution of China’s bond joint underwriting network.
(2)
Factors influencing the adjustment of bond joint underwriting cooperative relationships
Selecting the most ideal partners for bond joint underwriting enables securities firms to maximize their utility and compensate for the opportunity costs of bond joint underwriting. This study estimates the parameters of factors influencing the choice of cooperative partners for securities firms from two aspects: individual effects and network endogenous effects.
 1.
Individual effects
From the perspective of individual homogeneity, first, the parameter estimation of geographical similarity is significantly positive at the 1% statistical level, indicating that securities firms tend to establish cooperative relationships with other entities with geographical similarity. In today’s society, with the rapid development of communication, especially information technology, virtual communication has largely replaced face-to-face interactions. Even without virtual means of communication, the improvement of transportation networks has gradually weakened the barriers of geographical distance to communication. However, for bond joint underwriting, proximity in geographical distance facilitates securities firms’ personnel to conduct due diligence and documentation sorting, making it difficult for virtual communication to replace face-to-face communication, while the development of other transportation networks still requires time and financial costs. Secondly, the parameter estimation of domain similarity is significantly positive at the 10% level, indicating that securities firms tend to engage in underwriting cooperation with other securities firms with similar business domains. In the bond joint underwriting process, the higher the degree of specialization, the more conducive it is to thoroughly analyzing the issuer’s business and financial status, as well as future development prospects, which greatly benefits the reduction in bond repayment risk. This is an important reason for securities firms to seek partners with similar underwriting domains. Meanwhile, as the degree of specialization of securities firms improves, seeking cooperation with securities firms with similar domains can effectively reduce communication costs, making underwriting cooperation smoother.
From the perspective of individual heterogeneity, the parameter estimation of scale heterogeneity is significantly positive at the 1% statistical level, indicating that securities firms are more inclined to cooperate with securities firms with larger bond joint underwriting scales. On one hand, a larger bond joint underwriting scale for a securities firm implies that the company has accumulated more experience in business processes and communication with supervisory authorities, and cooperating with large-scale underwriters will help reduce their own work costs. On the other hand, scale implies capability, and a larger bond joint underwriting scale indicates that the securities firm can allocate more existing or potential resources, making cooperation with these securities firms conducive to promoting their own business development.
 2.
Network endogenous effects
In terms of structural embeddedness, the estimation results in Table 4 show that structural embeddedness has a positive impact on the establishment of bond joint underwriting cooperative relationships, with the estimated results significant at the 10% statistical level. This result further indicates that, in China’s bond joint underwriting network, securities firms are more inclined to establish cooperative relationships with the “friends of friends” in the network, thus forming triadic closure structures. On one hand, establishing cooperative relationships with “friends of friends” takes advantage of the guarantee role played by the “friend” objectively, which can effectively reduce the potential moral hazard and future uncertainty of bond joint underwriting cooperation. On the other hand, similar to the principle in physics where the triangle is the most stable shape, forming a cooperative triangle with “friends” and “friends of friends” helps enhance the stability of bond joint underwriting cooperative relationships.
Regarding preferential attachment, its parameter estimation value is significantly positive at the 5% statistical level, indicating that there is a “Matthew effect” in bond joint underwriting cooperation, where securities firms in China’s bond joint underwriting network are easily attracted by the star effect and tend to establish cooperative relationships with securities firms that have already attracted many partners in the network.

6. Conclusions and Discussion

6.1. Conclusions

This study uses bond joint underwriting data from Chinese securities firms from 2011 to 2020 and employs a comprehensive social network analysis method, as well as analytical tools such as Ucinet and ArcGIS, to systematically explore the evolutionary characteristics of China’s bond joint underwriting network from multiple dimensions, including time, topology, and space. Subsequently, by constructing longitudinal network panel data using the stochastic actor-oriented model, the factors and mechanisms driving the aforementioned evolution of China’s bond joint underwriting network are quantitatively analyzed. The findings reveal that in the topological dimension, the network exhibits overall characteristics of increasing maturity, activity, balanced and convenience cooperation; key nodes such as China Securities Co., Ltd. and other domestic securities firms have increasingly become the backbone of the joint underwriting network, while the network status of securities firms with foreign backgrounds has gradually faded. In the spatial structure dimension, at the overall spatial pattern level, urban cooperation exhibits a trend of changing from triangular to butterfly-shaped to quadrangular to multi-core networks; at the regional scale level, cooperation is most extensive between eastern regions, followed by eastern–central regions, while eastern–western and central–western regions have relatively less cooperation; at the city scale level, Beijing, Shenzhen, and Shanghai have maintained central positions for nearly a decade, with the external radiation range of the three cities expanding year by year, and the connections between the three cities being the strongest. The underlying mechanism for these evolutionary characteristics is that, thanks to the increasingly mature and active bond joint underwriting network in China, securities firms have more opportunities to establish and adjust cooperative relationships. In order to compensate for the opportunity costs of bond joint underwriting and achieve maximum cooperation benefits, securities firms need to choose potential partners that are geographically close, have similar business areas, larger underwriting scales, utilize “friends of friends”, and possess a “star” network effect, continuously adjusting their cooperative relationships, thus promoting the continuous evolution of China’s bond joint underwriting network.

6.2. Discussion

Among all the independent variables, geographic similarity and scale heterogeneity have the most significant impact on the selection of cooperation partners. In addition, the influence of domain similarity, structural embeddedness, and preferential attachment are also relatively significant. In contrast, the impact of organizational similarity, institutional similarity, and experience heterogeneity is not remarkable. The possible reason for these results is that China’s securities industry is a highly market-oriented sector, and the purpose of securities companies in undertaking bond joint underwriting is relatively direct and pragmatic, i.e., to obtain higher returns. Under this objective, the cooperation that facilitates higher returns becomes a crucial factor in selecting partners for securities companies.
The parameter estimation results for density effect in this study are significantly negative, which is similar to the conclusions drawn by Ter Wal [51] in their studies on the evolution of German biotechnology invention networks. This suggests that opportunity costs are present in both innovative cooperation networks and general cooperation networks with less innovative potential. The concept of opportunity cost can be traced back to the research of economists such as Friedrich von Wieser and Frank P. Ramstetter [52,53]. Their theory posits that every choice entails corresponding opportunity costs, which are particularly evident in cooperation.
On the one hand, during the cooperation process, all parties need to invest limited resources, such as time, energy, and funds. The investment of these resources implies that they cannot be used for other potential projects or collaborations, thus generating opportunity costs [52]. On the other hand, the goals and interests of individuals or groups involved in cooperation may conflict. In order to reach consensus and promote cooperation, actors in the network may need to sacrifice some of their interests. This sacrifice of interests also constitutes opportunity costs [53]. Moreover, individuals or groups in cooperative relationships may have potential competitive relationships. Consequently, cooperation may lead to competitors gaining advantages or capturing market shares. In this case, the opportunity costs of cooperation manifest as losses in competitiveness [54]. Furthermore, information asymmetry often exists among actors involved in cooperation, which may lead to reduced cooperation efficiency and consequently generate opportunity costs. Responsible partners may need to bear more risks and costs to compensate for the losses caused by information asymmetry [55].
At the same time, the parameter estimation results for domain similarity in this study are contrary to the conclusions of Zhang Jieyao [56] on the fashion creative industry and Balland et al. [46] on the satellite navigation industry. In this study, the parameter estimation results for domain similarity are significantly positive, while those of Zhang Jieyao [56] and Balland et al. [46] are significantly negative. The possible reasons for this discrepancy include the following: for practitioners in the fashion creative industry, the entry barrier is relatively low, thus the importance of knowledge proximity is not high; for the satellite navigation industry, each project involves multiple fields, such as aerospace technology, project management, meteorological research, transportation, and integrated support. To ensure the successful implementation of projects, technical personnel must establish cooperation with staff from other disciplines to seek knowledge complementarity. However, for the bond joint underwriting industry, on the one hand, it involves professional knowledge in finance, accounting, and risk management, which pose high knowledge requirements for professionals and hinder the entry of other securities firms from different fields; on the other hand, compared to the satellite navigation industry, a bond joint underwriting project requires fewer teams and personnel and does not necessitate the formation of large-scale cross-industry teams.
In addition, the parameter estimation results for institutional similarity, organizational similarity, and experience heterogeneity in this study are not significant, which is unlike many other existing studies on cooperative network evolution. However, in this study, the estimation results for scale heterogeneity are significantly positive at the 1% statistical level. In summary, in the bond joint underwriting field, when securities firms choose cooperation partners, they pay less attention to the potential partners’ company system, organizational attributes, and work experience, but pay relatively more attention to the bond joint underwriting scale of securities firms. The possible underlying reason is that the securities business, including bond underwriting, is highly open and market-oriented. For Chinese securities firms, the company system, organizational attributes, and work experience of potential partners do not have a substantial impact on their interests. A more pragmatic approach is to seek cooperation with securities firms that have good bond joint underwriting performance to obtain a share of the bond underwriting market.

6.3. Limitations and Future Research

Although in-depth research has been conducted, this study still has limitations. Firstly, limited by the SAO model in the current phase, the dependent variable of this study is the vertical binary network, which can only reflect whether a cooperative relationship exists between securities and cannot reflect the intensity of cooperation. Restrictions on data types may cause enterprises to have high-intensity cooperation, while fewer partners in the network cannot be fully reflected. In the future, with the development of the SAO model, if the multi-valued network can be taken as a dependent variable, the estimation results of this study may be different and more reasonable. Secondly, similar to the SAO model, although coefficient estimation can be conducted, other functions—including robustness tests—cannot be realized. Thirdly, due to data limitations, this study is unable to compare the evolution of China’s bond underwriting network with the cooperation networks of securities firms in other global regions or conduct an in-depth analysis of China’s bond underwriting network within the general financial network of China. Moreover, our exploration of factors driving securities firms’ collaboration is also limited by data availability, preventing us from further analyzing other potential factors driving network evolution, such as macroeconomic factors, institutional factors, and personal relationships within securities firms. In the future, we will continue to collect data to address these research shortcomings.

Author Contributions

Methodology, Y.C., Y.Y. and H.M.; software, X.K. and H.M.; data curation, X.L., Y.D. and D.C.; writing—original draft preparation, Y.C., Y.Y. and H.M.; writing—review and editing, Y.C., Y.Y. and H.M.; supervision, H.M.; project administration, Y.C. All authors have read and agreed to the published version of the manuscript.

Funding

This research was funded by National Natural Science Foundation of China “A Study on the Co-evolution of the Relationship between the Power Pattern and the Geo-economy in the Arctic Region from the Perspective of Evolutionary Game”, grant number 42201243, and the Humanities and Social Science Foundation of China “Research on the Evolution and Driving Mechanism of the Geopolitical Pattern in Northeast Asia Based on the Analysis of Geopolitical Relations and Power Structure”, grant number 18YJCZH005.

Data Availability Statement

Not applicable.

Conflicts of Interest

The authors declare no conflict of interest.

Appendix A

Table A1. Key securities firms.
20122014201620182020
Securities Firms/C/C’Securities Firms/C/C’ (Weighted)Securities Firms/C/C’Securities Firms/C/C’ (Weighted)Securities Firms/C/C’Securities Firms/C/C’ (Weighted)Securities Firms/C/C’Securities Firms/C/C’ (Weighted)Securities Firms/C/C’Securities Firms/C/C’ (Weighted)
UBS Securities/12/0.125UBS Securities/33/0.176Zhongtai Securities/8/0.123CITIC Securities/9/0.145China Securities Co., Ltd./42/0.055China Securities Co., Ltd./238/0.099China Securities Co., Ltd./52/0.059China Securities Co., Ltd./474/0.109China Securities Co., Ltd./70/0.044China Securities Co., Ltd./896/0.109
China International Capital
/11/0.115
China International Capital
/28/0.149
Credit Suisse Founder Securities/7/0.108Zhong De Securities/9/0.145HAITONG Securities/32/0.042HAITONG Securities/146/0.061Guotai Junan Securities/37/0.042Guotai Junan Securities/360/0.082Guotai Junan Securities/63/0.039CITIC Securities/761/0.093
Guotai Junan Securities/6/0.063China Merchants Securities/20/0.106China Securities Co., Ltd. /6/0.092China Securities Co., Ltd. /7/0.113Guotai Junan Securities/31/0.041Guotai Junan Securities/142/0.059Ping’an Securities/35/0.040Ping’an Securities/345/0.079CITIC Securities/63/0.039Guotai Junan Securities/693/0.085
Goldman Sachs Gao Hua Securities/6/0.063Guotai Junan Securities/13/0.069China Great Wall Securities/6/0.092China International Capital
/7/0.113
China Merchants Securities/30/0.040China Merchants Securities/141/0.059HAITONG Securities/34/0.039CITIC Securities/316/0.072Huatai United Securities/57/0.036HAITONG Securities/557/0.068
China Merchants Securities/6/0.063China Great Wall Securities/12/0.064China Merchants Securities/6/0.092Guokai Securities/6/0.097GF Securities/28/0.037GF Securities/131/0.054GF Securities/33/0.038HAITONG Securities/252/0.058HAITONG Securities/57/0.036China International Capital
/495/0.060
Note: C refers to degree centrality of key securities firms in the binary network and weighted network. C’ represents the ratio of the degree centrality of one firm to the total degree of the network. The purpose of calculating C’ is to facilitate cross-sectional comparisons.

References

  1. Omir, A. Financial instruments—The driving force of the capital market. Bull. Turan Univ. 2021, 02, 184–190. [Google Scholar] [CrossRef]
  2. Jia, R.X.; Liu, Y.; Hou, X.L. Enterprise cooperation model and its effects on regional economic development: A case study on enterprises in Tongzhou city, Jiangsu province. Geogr. Res. 2005, 04, 641–651. [Google Scholar]
  3. Demirbag, M.; McGuinness, M.; Akin, A.; Bayyurt, N. The professional service firm (PSF) in a globalised economy: A study of the efficiency of securities firms in an emerging market. Int. Bus. Rev. 2016, 25, 1089–1102. [Google Scholar] [CrossRef]
  4. Carbó-Valverde, S.; Cuadros-Solas, P.J.; Rodríguez-Fernández, F. The impact of lending relationships on the choice and structure of bond underwriting syndicates. J. Int. Financ. Mark. Inst. Money 2021, 3, 101403. [Google Scholar] [CrossRef]
  5. Kim, S.J.; Moshirian, F.; Wu, E. Evolution of international stock and bond market integration: Influence of the European Monetary Union. J. Bank. Financ. 2006, 30, 1507–1534. [Google Scholar] [CrossRef]
  6. Lan, R.X.; Wu, J.X. The Evolution of China’s Bond Market in Modern Times. China Financ. 2021, 24, 105–106. [Google Scholar]
  7. Granovetter, M. Economic action and social structure: The problem of embeddedness. Am. J. Sociol. 1985, 91, 481–510. [Google Scholar] [CrossRef]
  8. Uzzi, B. The sources and consequences of embeddedness for the economic performance of organizations: The network effect. Am. Sociol. Rev. 1996, 61, 674–698. [Google Scholar] [CrossRef]
  9. Burt, R.S. Structural Holes: The Social Structure of Competition; Harvard University Press: Cambridge, MA, USA, 1992. [Google Scholar]
  10. Li, M.; Zhang, H.; Chen, W. Evolution of the global crude oil network. Energy 2018, 148, 534–546. [Google Scholar]
  11. Noh, Y.; Jeong, H.; Lee, S. A comprehensive framework for constructing the global collaboration network of financial institutions. PLoS ONE 2019, 14, e0214086. [Google Scholar]
  12. Zeng, Y.; Li, D.; Zhu, J. Evolution of the global financial network and its stability in the process of financial globalization. Phys. A Stat. Mech. Its Appl. 2021, 562, 125105. [Google Scholar]
  13. Allen, F.; Gale, D. Financial contagion. J. Political Econ. 2000, 108, 1–33. [Google Scholar] [CrossRef]
  14. Haldane, A.G.; May, R.M. Systemic risk in banking ecosystems. Nature 2011, 469, 351–355. [Google Scholar] [CrossRef]
  15. Scholtens, B.; Wensveen, D.V. Patterns of financial fragility. J. Financ. Stab. 2003, 1, 255–275. [Google Scholar]
  16. Fricke, D.; Lux, T. Core-periphery structure in the overnight money market: Evidence from the e-MID trading platform. Comput. Econ. 2015, 45, 359–395. [Google Scholar] [CrossRef]
  17. Newman, M.E. The structure of scientific collaboration networks. Proc. Natl. Acad. Sci. USA 2010, 98, 404–409. [Google Scholar] [CrossRef]
  18. Zhou, X.; Liu, Y.; Guo, X. Measuring the resilience of an interbank network. Expert Syst. Appl. 2019, 126, 206–215. [Google Scholar]
  19. Hao, L.; An, H.; Gao, X. Measuring the resilience of the banking system: The Chinese case. Financ. Res. Lett. 2020, 35, 101253. [Google Scholar]
  20. Goyal, S.; Vega-Redondo, F. Structural holes in social networks. J. Econ. Theory 2007, 137, 460–492. [Google Scholar] [CrossRef]
  21. Battiston, S.; Gatti, D.D.; Gallegati, M.; Greenwald, B.; Stiglitz, J.E. Liaisons dangereuses: Increasing connectivity, risk sharing, and systemic risk. J. Econ. Dyn. Control 2012, 36, 1121–1141. [Google Scholar] [CrossRef]
  22. Stuart, T.E.; Hoang, H.; Hybels, R.C. Interorganizational endorsements and the performance of entrepreneurial ventures. Adm. Sci. Q. 1999, 44, 315–349. [Google Scholar] [CrossRef]
  23. Gomes-Casseres, B. The Alliance Revolution: The New Shape of Business Rivalry; Harvard University Press: Cambridge, MA, USA, 1996. [Google Scholar]
  24. Podolny, J.M. Market uncertainty and the social character of economic exchange. Adm. Sci. Q. 1994, 39, 458–483. [Google Scholar] [CrossRef]
  25. Beunza, D.; Millo, Y. Proximity and innovation in the trading room. Sociol. Trav. 2004, 46, 449–465. [Google Scholar]
  26. Gulati, R. Social structure and alliance formation patterns: A longitudinal analysis. Adm. Sci. Q. 1995, 40, 619–652. [Google Scholar] [CrossRef]
  27. Dyer, J.H.; Singh, H. The relational view: Cooperative strategy and sources of inter organizational competitive advantage. Acad. Manag. Rev. 1998, 23, 660–679. [Google Scholar] [CrossRef]
  28. Lavie, D. Alliance portfolios and firm performance: A study of value creation and appropriation in the U.S. software industry. Strateg. Manag. J. 2007, 28, 1187–1212. [Google Scholar] [CrossRef]
  29. MacKenzie, D.; Millo, Y. Constructing a market, performing theory: The historical sociology of a financial derivatives exchange. Am. J. Sociol. 2003, 109, 107–145. [Google Scholar] [CrossRef]
  30. DiMaggio, P.J.; Powell, W.W. The iron cage revisited: Institutional isomorphism and collective rationality in organizational fields. Am. Sociol. Rev. 1983, 48, 147–160. [Google Scholar] [CrossRef]
  31. Scott, W.R. Institutions and Organizations; Sage Publications: Thousand Oaks, CA, USA, 2001. [Google Scholar]
  32. Acemoglu, D.; Ozdaglar, A.; Tahbaz-Salehi, A. Systemic risk and stability in financial networks. Am. Econ. Rev. 2015, 105, 564–608. [Google Scholar] [CrossRef]
  33. Gai, P.; Haldane, A.; Kapadia, S. Complexity, concentration and contagion. J. Monet. Econ. 2011, 58, 453–470. [Google Scholar] [CrossRef]
  34. Herring, R.J.; Santomero, A.M. The corporate structure of financial conglomerates. J. Financ. Serv. Res. 1991, 5, 471–497. [Google Scholar]
  35. Rochet, J.C.; Tirole, J. Interbank lending and systemic risk. J. Money Credit. Bank. 1996, 28, 733–762. [Google Scholar] [CrossRef]
  36. Goyal, S.; Joshi, S. Networks of collaboration in oligopoly. Games Econ. Behav. 2003, 43, 57–85. [Google Scholar] [CrossRef]
  37. Snijders, T.A.B.; Van de Bunt, G.G.; Steglich, C.E.G. Introduction to stochastic actor-based models for network dynamics. Soc. Netw. 2010, 32, 44–60. [Google Scholar] [CrossRef]
  38. Snijders, T.A.B.; Steglich, C.E.G.; Van de Bunt, G.G. Introduction to actor-based models for network dynamics. Soc. Netw. 2008, 33, 32–46. [Google Scholar] [CrossRef]
  39. Van de Bunt, G.G.; Groenewegen, P. An actor-oriented dynamic network approach: The case of interorganizational network evolution. Organ. Res. Methods 2007, 10, 463–482. [Google Scholar] [CrossRef]
  40. Chen, Y.; Qiu, H.; Li, J. Social network analysis of industrial symbiosis: The case of waste-to-energy industry in China. J. Clean. Prod. 2018, 174, 196–205. [Google Scholar]
  41. Ritala, P.; Golnam, A.; Wegmann, A. Coopetition-based business models: The case of Amazon.com. Ind. Mark. Manag. 2014, 43, 236–249. [Google Scholar] [CrossRef]
  42. Gomes, R.; Salerno, M. Influence of critical factors of clusters on the innovation of small and medium-sized enterprises: A social network analysis in the Brazilian aeronautics industry. Int. J. Technol. Manag. 2017, 73, 97–116. [Google Scholar]
  43. Snijders, T.A.B. Models for longitudinal network data. Model. Methods Soc. Netw. Anal. 2005, 1, 215–247. [Google Scholar]
  44. Steglich, C.; Snijders, T.A.B.; West, P. Applying siena. Methodology 2006, 2, 48–56. [Google Scholar] [CrossRef]
  45. Snijders, T.A.B. Longitudinal methods of network analysis. Encycl. Complex. Syst. Sci. 2009, 24, 5998–6013. [Google Scholar]
  46. Balland, P.A. Proximity and the evolution of collaboration networks: Evidence from research and development projects within the Global Navigation Satellite System (GNSS) industry. Reg. Stud. 2012, 46, 741–756. [Google Scholar] [CrossRef]
  47. Balland, P.A.; Vaan, M.D.; Boschma, R. The dynamics of interfirm networks along the industry life cycle: The case of the global video game industry, 1987–2007. J. Econ. Geogr. 2013, 13, 741–765. [Google Scholar] [CrossRef]
  48. Balland, P.A.; Belso-Martínez, J.A.; Morrison, A. The dynamics of technical and business knowledge networks in industrial clusters: Embeddedness, status or proximity? Econ. Geogr. 2016, 92, 35–60. [Google Scholar] [CrossRef]
  49. Zhou, C.; Zeng, G.; Xin, X.R.; Mi, Z.F. The dynamics of China’s electronic information industry innovation networks: An empirical research based on SAO model. Econ. Geogr. 2018, 38, 116–122. [Google Scholar]
  50. Shi, X.; Lu, L.; Zhang, W. Structural network embeddedness and firm incremental innovation capability: The moderating role of technology cluster. J. Bus. Ind. Mark. 2020. ahead-of-print. [Google Scholar] [CrossRef]
  51. Ter Wal, A.L. The dynamics of the inventor network in German biotechnology: Geographic proximity versus triadic closure. J. Econ. Geogr. 2013, 14, 589–620. [Google Scholar] [CrossRef]
  52. Von Wieser, F.; Zhang, K. Social Economics: Theorie der Gesellschaftlichen Wirtschaft; Zhejiang University Press: Hangzhou, China, 2012. [Google Scholar]
  53. Ramstetter, F.P. Opportunity Cost. In International Encyclopedia of the Social Sciences; Sills, D., Ed.; Macmillan and the Free Press: New York, NY, USA, 1968; Volume 11, pp. 361–367. [Google Scholar]
  54. Coase, R.H. The Regulated Industries: Discussion. American Economic Review. Am. Econ. Rev. 1964, 54, 194–197. [Google Scholar]
  55. Akerlof, G.A. The Market for ‘Lemons’: Quality Uncertainty and the Market Mechanism. Q. J. Econ. 1970, 84, 488–500. [Google Scholar] [CrossRef]
  56. Zhang, J.Y. Organization and optimization knowledge flowing path of creative industrial. Stat. Decis. 2017, 05, 46–50. [Google Scholar]
Figure 1. Absolute and relative number of securities firms participating in bond joint underwriting. Note: the bar chart represents the absolute number of securities firms participating in bond joint underwriting, while the line chart indicates the relative number.
Systems 11 00253 g001
Figure 2. Topological structural evolution of China’s bond joint underwriting network. Note: the size of the circle represents the magnitude of the degree centrality of the node; the thickness of the connecting lines represents the strength of the collaboration between nodes; the color of the nodes indicates their different attributes.
Systems 11 00253 g002
Figure 3. Spatial evolution of China’s bond joint underwriting network. Note: the thickness of the lines reflects the frequency of inter-city cooperation. It can be observed that the frequency of inter-city cooperation has experienced rapid growth, the scope of cooperation between cities is continuously expanding, and the degree of closeness in city collaboration is increasingly high.
Systems 11 00253 g003
Table 1. Independent Variables.
VariablesDescriptionData Type
Geographic SimilarityProximity of the securities firm’s geographical locationMatrix (n × n)
Domain SimilaritySimilarity of key underwriting areas of securities firmsMatrix (n × n)
Institutional SimilaritySimilarity of institutional attributes of securities firmsMatrix (n × n)
Organizational SimilarityWhether the securities firms have a related relationshipMatrix (n × n)
Experience Heterogeneity The number of times securities firms appear in the networkVector (n × 1)
Scale HeterogeneityThe logarithm of the number of bonds underwritten by a securities firmVector (n × 1)
Structural EmbeddednessNumber of securities firms forming ternary closure structuresVector (n × 1)
Preferential AttachmentComprehensive value of cooperation breadth and intensity of securities firmsVector (n × 1)
Table 2. Overall evolutionary characteristics of China’s bond joint underwriting syndicates.
2011201220132014201520162017201820192020
Network density0.1110.1180.1670.0910.1070.4660.1890.7840.7250.979
Average degree1.73.313.52.373.18210.235.94711.08913.81117.261
Condensation coefficient0.7410.2020.3620.3920.1510.0640.080.1180.0330.044
Average path length1.6062.8741.6772.613.2012.2312.5872.1391.9921.916
Table 3. Parameter Estimation Results of the Rate Function.
YearParameterSD
2011–20123.459 ***0.169
2012–20134.215 ***0.229
2013–20144.431 ***0.232
2014–20155.129 ***0.309
2015–20166.667 ***0.373
2016–20176.688 ***0.402
2017–20187.129 ***0.490
2018–20198.818 ***0.501
2019–20209.235 ***0.551
*** represent significant levels of 10%, 5%, and 1%, respectively.
Table 4. Parameter estimation results of the influencing factors of adjusting the partnership.
VariablesParameter SD
Density Effect
(Constant)
−1.998 ***0.306
Geographic Similarity0.075 ***0.048
Domain Similarity0.028 *0.013
Institutional Similarity0.0240.021
Organizational Similarity0.1290.039
Experience Heterogeneity 0.0870.054
Scale Heterogeneity0.065 ***0.052
Structural Embeddedness0.119 *0.062
Preferential Attachment0.072 **0.055
*, **, and *** represent significant levels of 10%, 5%, and 1%, respectively.
Disclaimer/Publisher’s Note: The statements, opinions and data contained in all publications are solely those of the individual author(s) and contributor(s) and not of MDPI and/or the editor(s). MDPI and/or the editor(s) disclaim responsibility for any injury to people or property resulting from any ideas, methods, instructions or products referred to in the content.

