Article

Use of System Dynamics Modelling for Evidence-Based Decision Making in Public Health Practice

1
Public Health Department, Kent County Council, Sessions House, County Road, Maidstone ME14 1XQ, Kent, UK
2
Whole Systems Partnership, 8 York Place, Knaresborough HG5 0AA, North Yorkshire, UK
*
Author to whom correspondence should be addressed.
Systems 2023, 11(5), 247; https://doi.org/10.3390/systems11050247
Submission received: 22 March 2023 / Revised: 9 May 2023 / Accepted: 12 May 2023 / Published: 14 May 2023
(This article belongs to the Special Issue System Dynamics Models for Public Health and Health Care Policy)

Abstract

:
In public health, the routine use of linear forecasting, which restricts our ability to understand the combined effects of different interventions, demographic changes and wider health determinants, and the lack of reliable estimates for intervention impacts have limited our ability to effectively model population needs. Hence, we adopted system dynamics modelling to forecast health and care needs, assuming no change in population behaviour or determinants, then generated a “Better Health” scenario to simulate the combined impact of thirteen interventions across cohorts defined by age groups and diagnosable conditions, including “no conditions”. Risk factors for the incidence of single conditions, progression toward complex needs and levels of morbidity including frailty were used to create the dynamics of the model. Incidence, prevalence and mortality for each cohort were projected over 25 years with “do nothing” and “Better Health” scenarios. The size of the “no conditions” cohort increased, and the other cohorts decreased in size. The impact of the interventions on life expectancy at birth and healthy life expectancy is significant, adding 5.1 and 5.0 years, respectively. We demonstrate the feasibility, applicability and utility of using system dynamics modelling to develop a robust case for change to invest in prevention that is acceptable to wider partners.

1. Introduction

In any local health system, data and intelligence are essential for service planning and investment/disinvestment decision making for a defined population. This will invariably include forecasting demographics, health determinants, disease distribution and health status. At present, most attempts at forecasting the future health and care needs of local populations rely on linear extrapolations, which use a series of limited assumptions to estimate the likely burden of a specific health condition or demand for a service. These assumptions include trends in population change as well as in the condition or service under investigation [1]. This method of forecasting can be described as predictive analytics, where historical data are used to make predictions about future events [2]. Prevention is a key activity in public health, and this requires robust evidence to convince decision makers to invest in prevention where the gains may not be immediately apparent.
A variety of tools explaining the public health cost-effectiveness of individual interventions have been published, providing evidence for implementing them or not [3]. However, the use of such tools may not be feasible when it comes to extrapolating directly to local systems and contexts for financial and capacity planning, and decision making for investing in prevention. While this provides a baseline estimate, it does not consider the complexities and interdependencies within populations and systems. For example, the onset of multimorbidity, the effect of intersectionality [4] and the interaction between social and economic factors. Historically, evidence-based public health relied upon estimating the health impacts of interventions separately. However, in local health systems, health planners are routinely expected to calculate the combined effect of multiple interventions to make robust decisions on resource allocation. Due to the current limitations of evidence in the field of public health, this is not always feasible. Moreover, estimates of the effectiveness of interventions are from varied populations and may not be externally valid. Traditional public health approaches are limited by our inability to assess the combined effects of multiple interventions and their interdependencies, the issues of external validity, i.e., applying the results of peer-reviewed external research to a given local population, and the use of linear extrapolation in forecasting. Hence, we need an evidence-based approach that overcomes the above limitations and addresses the key properties of complex systems, such as systems dynamics modelling (SDM). SDM is a powerful tool for assessing the impact of multiple interventions within a complex and dynamic system [5]. Jadeja et al. [6] conducted a recent systematic review that found at least 29 studies that used SDM approaches that incorporate health economic efficiency analyses for decision making, either as embedded sub-models or as cost calculations based on SDM outputs, across a variety of themes ranging from communicable diseases to behavioural and wider health determinants.
There have been previous attempts to use SDM “to align prevention efforts and maximise the effect of limited resources” [7]. A prevention impacts simulation model [8] was employed in the field of cardiovascular disease prevention to simulate the medium- and long-term impact of the various interventions. However, the simulation and the application of the SDM approach here were disease-specific. From a complex adaptive system perspective, population health needs are dynamic, and are shaped by socio-economic risk factors as well as the level of access to health and care services. Rutter et al. [9] describe the following properties of complex systems: emergence is defined as “properties of a complex system which cannot be directly predicted from the elements within it and are more than just the sum of its parts”, feedback where “a change reinforces, or balances further change” and adaptation, which refers to “adjustments in behaviour in response to interventions”. Such properties are the basis on which public health practice operates within a local health system. As such, it is essential that we move towards an approach that takes these complexities into account to help to answer the key questions in public health of what can be done and how it can be done in practice. Prescriptive analytics is the process of using data to determine an optimal course of action [2]. This would not only provide more accurate estimates of future health need but enable the system to better plan services and to ultimately reduce health inequalities. There are many evaluations of the use of SDM in health policy and planning; however, recent reviews [10,11] in this area have highlighted the lack of research prior to 2013. Reviews also highlighted the importance of stakeholder involvement [12], which was highly valued in our study.
Cohort modelling using SDM is an accepted methodology in improving health policy making in complex systems, using qualitative and quantitative approaches. One such international example is the “Rethink health dynamics model” developed by the Rippel Foundation [13]. The model simulates a range of scenarios for a combination of preventive interventions, including reducing health risks and improving healthcare, on a defined US population over a 40-year period. This has generated evidence on the value of these interventions, which informs the planning and decision making, including investment in prevention. To our knowledge, such an approach has not been employed across multiple programme areas within a local health system in the United Kingdom to inform policy and decision making.
The Joint Strategic Needs Assessment (JSNA) uses a range of health indicators to identify the current health and care needs of the population and is a mandatory requirement for all local authority public health departments in England. Using the JSNA [14], local system leaders can work together to understand and agree on the needs of all local people, setting the priorities for collective action. Our aim is to demonstrate and apply the use of simulation modelling in the area of routine public health intelligence, analysis and inference. In this regard, our objective is to create a population cohort model using SDM to generate necessary evidence on the value of various preventive interventions for local priority setting within the current Kent JSNA development process and intelligence tools.

2. Materials and Methods
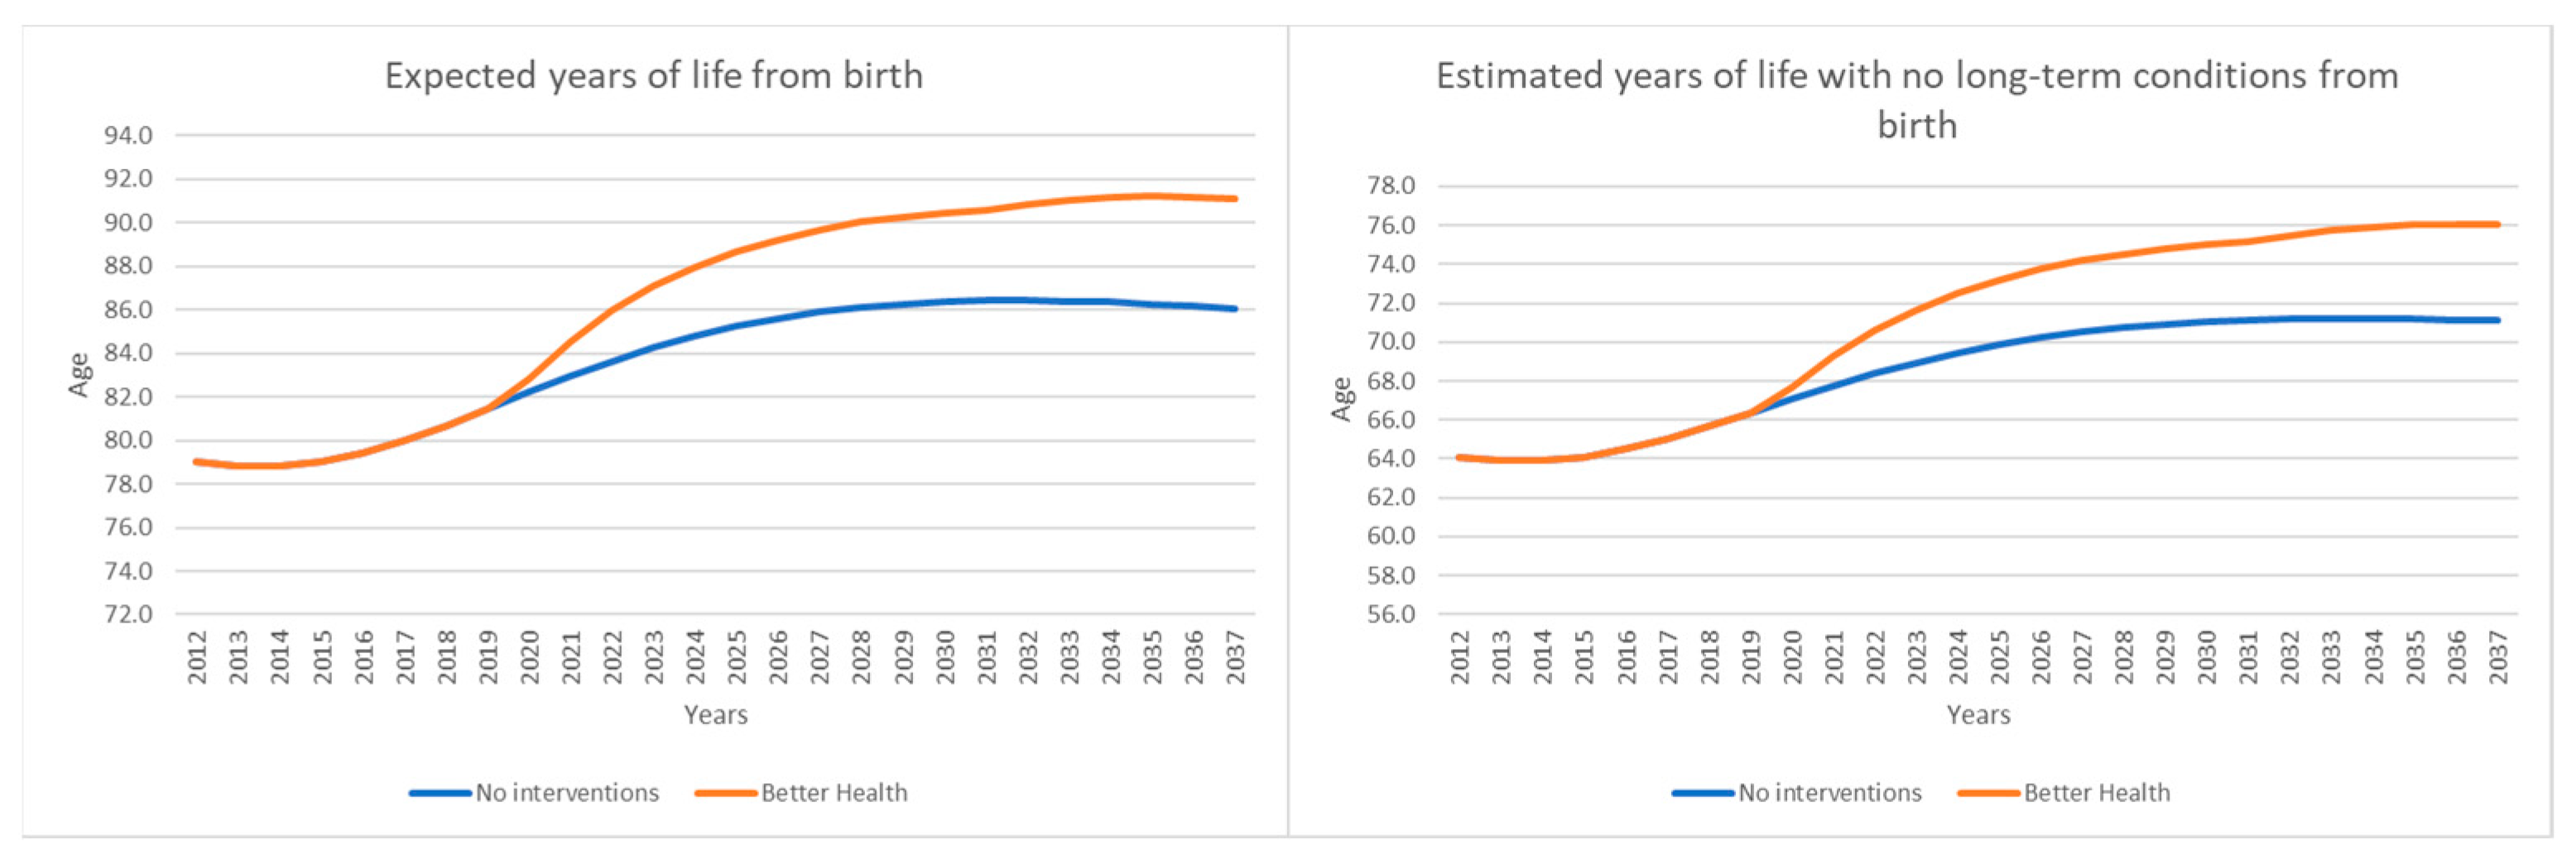
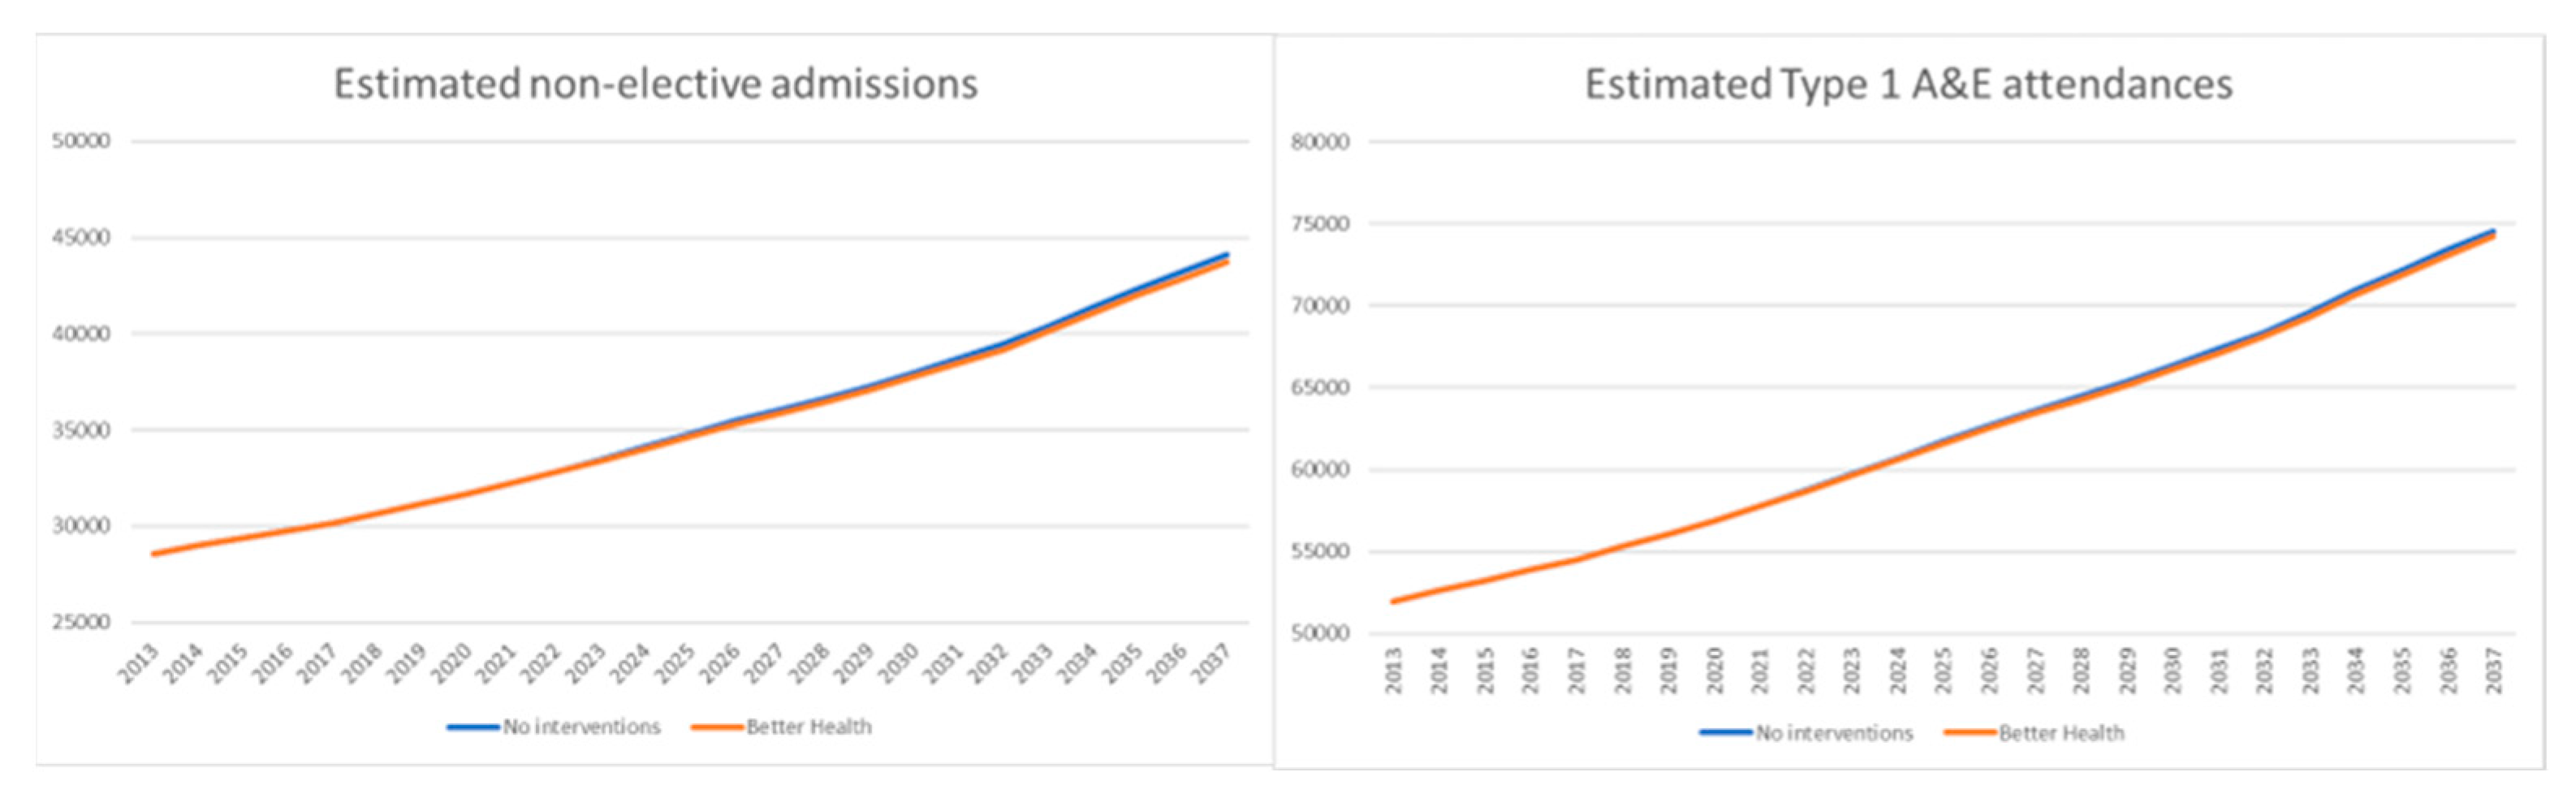
This study was carried out in the county of Kent, positioned in the southeast of England, with a diverse population of approximately 1.6 million [15] that varies considerably in terms of deprivation and ethnicity. Like other local areas in England, Kent exhibits wide health inequalities by geography and different vulnerable groups [16]. The model outputs were presented at the level of three sub-geographical regions, which aligned with existing commissioning boundaries—West Kent, East Kent and North Kent—and for this communication, we present selected examples from North Kent.
The prototype model was co-produced with the local council public health team, and was conceptualised, tested, populated and validated over a period of 9–12 months. Two parallel group model building workshops were run alongside each other, one for adults and one for children and young people (CYP). A series of three dedicated engagement sessions were carried out for each cohort and involved between 8 and 12 experts from across health and care settings as appropriate, as well as regular contact, dialogue and checking in with group participants in between sessions. These two groups were brought together at the Better Health Workshop in 2018. The model conceptualisation was socialised and developed, followed by scenario generation and testing, which was an iterative process. Stakeholders explored the key factors that influenced better health outcomes for population health within the Kent system. Variables, interactions and feedback loops were identified and informed the design of the causal loop diagram. We discussed key interventions impacting population health outcomes, identified cohorts of interest, selected relevant peer-reviewed evidence and agreed on appropriate data sources to input into the model. Data sources are described in Table S1 [17,18,19,20,21,22,23,24,25,26,27]. Cohorts were based on the health or disease status of the individuals, and disease status is further broken down into individual long-term conditions (LTCs). The Kent County Council (KCC) senior team of public health specialists met to identify a combined scenario in which thirteen prevention/public health measures were achieved, including, for example, the rates of breastfeeding, the presence of adverse childhood experiences and the levels of smoking and obesity in the population. This has resulted in a ‘Better Health’ scenario being created that forecasts potential changes in the prevalence of a range of conditions, and, as a result, the prospects for increasing healthy life expectancy and the potential demand for health and care services. This exercise took place in January 2019 within days of the release of the NHS Long Term Plan [28] blueprint, in which many of the prevention strategies included in the model were heralded. This gave the public health specialists a ‘real-time’ opportunity to evidence the benefit of the Long Term Plan in our local context.
Population segmentation: Segmentation aims to categorise the population according to their health status, healthcare needs and priorities. According to this approach, groups of people share characteristics that influence the way they interact with health and care services. There is value in segmenting patients by need, complexity and severity of conditions. Segmentation was performed differently for children and adults. Segmentation for the CYP cohort was based on earlier work from the Derbyshire local health system [29]. Adult segmentation was based the work carried out by Outcome Based Health Care on behalf of NHS England [30].
For CYP, the population aged under 25 years was initially segmented into 8 cohorts and 6 age groups using a local person-level longitudinally linked population dataset known as the Kent Integrated Dataset (KID) [17]. The hierarchy for segmentation is illustrated in Figure 1. The eight cohorts for CYP were physical enduring, mental health enduring, learning disability, physical non-enduring, mental health non-enduring, autism and attention deficit hyperactivity disorder and no identified condition. This list is comprehensive and includes 100% of all people within the KID. These cohorts are described in Table S2.
For adults, the population was segmented using the English Longitudinal Study of Ageing (ELSA) [31] to gain insight about the progression of need and mortality. The hierarchy of segmentation is illustrated in Figure 2. The KID was also accessed in the same hierarchy to extract local prevalence and rates of access to health and care services.
The modelled adult population was segmented into five cohorts based on the presence of pre-defined health conditions or frailty. These cohorts are (1) severely frail, (2) single conditions with high/complex needs, (3) multiple conditions, (4) single conditions and (5) no conditions. In Figure 2, cohorts (2) and (3) are combined into “Multiple and Complex needs”. These cohorts have an increasing progression of need, with cohort (5) as the lowest and cohort (1) as the highest need, and if an individual meets the requirements for more than one cohort, they are assigned to the highest need cohort. Cohort (1) includes those who are severely frail, which is defined as a score of 6 or more disabilities equivalent to moderate and severe frailty within the electronic frailty index [32]. Cohort (2) includes individuals with high-needs serious mental illness, severe learning disability, dementia or neurological conditions. Cohort (3) includes individuals with more than one of the following conditions: asthma, coronary heart disease, chronic obstructive pulmonary disease, type 2 diabetes, heart failure, stroke or moderate frailty. Cohort (4) includes individuals who have one of the conditions listed for cohort (3). Cohort (5) includes individuals who do not meet the requirements for cohorts (1–4). These cohorts are described in Table S3.
Model building: The model was split into two sections, CYP (under 18 years and under 25 years for selected health conditions) and adults (18 years and over). The CYP section and adult section have different structures, and the CYP section provides projected populations at age 18 years (and 25 years for selected health conditions), which form inputs to the adult section. The starting point for the model used the incidence, prevalence and mortality for each cohort in 2012 and projects forward to 2037. Initial prevalence as well as incidence and mortality for CYP and adults are shown in Tables S4–S10 [17,19,31]. This was calculated using local data analysis from the KID and nationally published longitudinal studies [17,18,19,20] The approach used epidemiological information to estimate the contributions of changes in population-level risk factors relating to health and wellbeing where the impacts were mainly on the incidence of individual conditions and cohorts. Changes in the uptake of evidence-based interventions were subsequently applied and the impacts of these interventions were mainly measured using case fatality rates over time. The model scope incorporated additional risk factors relating to socioeconomic circumstances. Tables S11 and S12 [21,31] provide details about the sources and methods that were used to accommodate socio-economic circumstances. We used socio-economic status as a proxy indicator of socioeconomic circumstances. This model examined the effects of changes in treatment uptake and risk factor trends on changes in cohort incidence, prevalence and mortality. It also explored the extent to which prevention strategies impact the incidence and mortality of cohorts.
The model estimated changes in incidence and deaths related to changes in adult risk factor levels in the population. The risk factors considered were cigarette smoking, total cholesterol (TC), systolic blood pressure (SBP), body mass index (BMI), physical inactivity and alcohol consumption, and these are listed in Table S13 [21]. The Health Survey for England was used to calculate trends in the prevalence (or mean values) of each risk factor. In both the CYP and adult sections of the model, two approaches to calculating relative risk reductions from changes in risk factors were used: the regression approach and change in the population attributable fraction (PAF). In the regression model for adults, the incidences of cohorts in 2012 (the start year) were multiplied by the absolute change in risk factor level and by a regression coefficient (‘beta’) quantifying the estimated relative change in cohort incidence and mortality that would result from a one-unit change in risk factor level. The regression (beta) coefficients used in these analyses for key risk factors are listed in Tables S14–S16 [33,34,35,36]. A ‘fixed gradient’ approach was used to stabilise the estimates of risk factor change across the quintiles. Natural logarithms were used, as is conventional, in order to best describe the log-linear relationship between absolute changes in risk factor levels and relative change in incidence and mortality. The PAF approach can be interpreted as the proportion by which the incidence or mortality would be reduced if the exposure were eliminated. Worked examples for the two approaches are presented in Figures S1 and S2. Relative risks are displayed in Tables S17–S23 [37,38,39,40,41,42,43]. The CYP section included 5 interventions, as shown in Table 1, which were activated to test projected future impact. For each of the CYP cohorts, we estimated the proportions of incidence that were attributable to various treatments or interventions. We adopted the general approach of calculating the risk reduction from an intervention among a particular cohort by multiplying the change in the proportion of people exposed to a risk factor by the incidence rate and by the relative reduction due to the change in intervention or exposure. The approach to measuring the impact of interventions or risk factors for children was exactly the same as for adults using the PAF in most cases. The only difference was the application of a delay if the impact of an intervention in childhood occurs in adulthood. For example, the impact of changes in adverse childhood experience upon serious mental illness in adults is delayed by an average of 10 years. However, changes in smoking during pregnancy impact upon stillbirths immediately, similarly for breastfeeding upon child obesity.
The primary outcome measures of the model were cohort incidence, prevalence and deaths projected over the model timescale and the impacts of cohort incidence and prevalence on potential demand for health and wellbeing services. The calculation of the modelled impacts of change on incidence and mortality was based on utilising two well-studied relationships. The first is a change in risk factor against a relative change in incidence and mortality, and the second is changes in intervention uptake resulting in mortality reductions. Estimates in relative risk reduction for both relationships were derived from previous randomised controlled trials and meta-analyses, as shown in Tables S17–S23 [37,38,39,40,41,42,43]. The incidence and mortality benefits from the risk factor reduction in the population and the treatment and intervention benefits in patient groups were then summed. This summing used a cumulative approach rather than an additive approach [44] to avoid double-counting benefits in the same individual. This sum represents the changes in incidence and mortality ‘explained’ by policy changes made within the model.
Model structure: SDM was chosen for this project due to the complex interactions and dynamic nature of the system. An example of the causal loop diagrams used to investigate and visualise relationships in the system prior to model building is demonstrated in the Supplementary Materials (Figure S3). As the final SDM model has a total of 63 stocks, 170 flows and 869 converters, which generated 9024 variables including multiple element arrays and graphical functions, a simplified model structure is illustrated in Figure 3. The first five interventions in Table 1 apply to CYP section of the model and the others apply to the adult section. The left of the figure shows the CYP model structure and illustrates the movement of the population from birth through an aging chain (0–1, 2–4, 5–10, 11–15, 16–17 and 18–24 years) whilst also moving between different health cohorts, represented by the vertical arrows. The aging chain arrows represent the natural flow of the population from birth on to different age groups and flowing to the adult model at 18 and 25 years. The physical and mental enduring and LD cohorts move to the adult model at 25 years and progress to the same cohort group. For all other cohorts, they enter the adult model at 18 years and progress to the healthy cohort. Risk factors for CYP do carry a rate of risk across to the adult cohorts (e.g., child obesity and adult diabetes). The vertical arrows represent the progression or recovery of CYP who are flowing from different cohorts or health states over time (incidence). Adults flow from one cohort to another cohort without an aging chain, e.g., from healthy to a single condition. People flowing into or out of the geography are included in the model via net migration per cohort and people flowing out of a cohort due to death are represented by the red arrows. These rates of flow were determined by the data outlined in Tables S4–S12 [17,19,31]. Tables S2 and S3 outline the cohorts used in the model and illustrate the SD model structure in more detail.
Model calibration: To initiate the model with population cohorts through incidence, prevalence and mortality, we used various data sources, which are outlined in Tables S4–S12 [17,19,31]. Additionally, population-level risk factors were used to influence the impacts across cohorts, which are listed in Tables S17–S23 [37,38,39,40,41,42,43]. In the first instance, we used local data to initiate the model to consider differences in demographics and risk factors. The process of calibration involved importing baseline data and projections from various national sources including the Office for National Statistics and KCC housing forecast [18] to carry out validation of general outcome measures such as population and mortality. Locally, further validation took place to check against known outcome measures such as the Quality Outcome Framework [45] and health and care activity data.
The model validation process followed the framework outlined by Yarnoff et al. [46], and the five validation stages were undertaken in accordance with this. Face validation, involving assessment by subject matter experts (public health consultants from the locality), was achieved through model development in group model building workshops and through ongoing testing. This included continual one-way sensitivity analysis in order to validate input factors and the ranges of variables with their associated effect. Internal validation, verifying the model’s code and calculations, involved a secondary modeller and analyst, who had not participated in the model development, reviewing model logic and calculations and evaluating the sensitivities. In cross validation, which compared the model output to other available models, we reviewed all of the available evidence of comparable models. Due to the novel nature and aims of this project, we were unable to find models with a similar magnitude and scope; however, individual sources of evidence were used in calibration and sensitivity testing. We encountered a similar challenge with external validation, which compares modelled outputs to surveillance data, and predictive validation, which compares modelled impacts to actual observations resulting from interventions. Although surveys were not available for the local health population and limited intervention and actual data could be retrieved, consensus amongst public health experts and healthcare providers along with the triangulation of academic literature was used where data were not available. Where appropriate, proxies for comparable regions or national average data were used in agreement with subject matter experts. Due to the complexity of the model and high number of variables, including graphical functions and arrayed elements, a small number of key prevalence percentages were selected for single output-level validation through discussion with subject matter experts and ongoing sensitivity testing throughout development. Similarly to Zhang et al., [47] relative deviation rate and average relative deviation rate were used to demonstrate the deviation between simulated outputs and surveillance data or externally modelled data (calculations for these are available in Figure S4). Single output and population validation results are shown in Figures S5 and S6 and Tables S24 and S25. The model represented the time trends in the population for CYP (0–17) and adults (18+) well when compared to ONS 2018 [48] population projections, with the largest average relative deviation of 1.12% (Table S25 and Figure S6). Validation against external data sources was difficult because the base population of the model included major longitudinal studies. However, there was good agreement between modelled condition prevalence for CHD, COPD, stroke and diabetes compared to quality and outcomes framework (QoF) data (Table S24 and Figure S5) [45]. The relative deviation for these variables ranges from 0.01% to 10.35%, and the average relative deviation ranges from 3.77% to 4.84%.
Sensitivity testing was based on Hekimoğlu and Barlas’ behaviour sensitivity analysis algorithm [49]. The initial screening of key input factors was created during development, where sensitivities and ranges of input values, practical for public health planning and policy, were agreed on by experts. As noted above, sensitivities were further tested during internal validation. The regression model of behaviours was undertaken using ranges around selected input values (for example, input variables for healthy life expectancy at 18 are shown in Table S26), and five runs for each variable based on incremental steps were run through Stella Architect’s model analysis tool (including all combinations). For the healthy life expectancy at 18 output, this resulted in 625 runs and the behaviour shown in Figure S7. However, selecting a dependent variable value that represents the behaviour did not fall within the examples of Hekimoğlu and Barlas’ work [49]. Firstly, this model can not be defined as an inherently oscillating or tipping point. Secondly, our model is significantly more complex and has a far greater number of elements, including graphical interface variables and multiple arrays. The regression-dependent variable selected was based on the difference between the start and end values of the outputs, representing the change in health over the modelled period. The results of the regression in this example based on this calculation showed an R2 adjusted >80 and significance at p < 0.05 of all included variables.
The model was developed using a software platform known as Stella Architect developed by Isee Systems, which is accessible via Isee exchange [50]. Following calibration of the model, outputs were viewed and extracted.
Model interventions: Thirteen public health interventions were agreed on by Kent County Council public health professionals to achieve “Better Health” for their population. They were selected based on the latest published evidence and national policy [27] of these interventions in improving health. The interventions are listed in Table 1. The level of change and the target to be achieved were also agreed on by local professionals in the better health workshop by mutual consensus.
The CYP section of the model included interventions 1–5 in Table 1, and relative risk is shown in Table S27 [51,52,53,54,55,56,57]. The adult section of the model included interventions 6–13 in Table 1, which could be activated to test the projected future impact. For each cohort, we estimated the proportion of incidence and deaths that were attributable to various treatments or interventions. Data sources used to estimate the percentage at risk from the included interventions are displayed in Table S1 [17,18,19,20,21,22,23,24,25,26,27]. The general approach to calculating the risk reduction from an intervention among a particular cohort was to multiply the change in the proportion of people exposed to a risk factor by the incidence rate and by the relative reduction due to the change in intervention or exposure. Sources for current risk factors and treatment uptake are shown in Table S1 [17,18,19,20,21,22,23,24,25,26,27]. Sources for estimates of treatment efficacy (relative risk reductions) are shown in Tables S17–S23 and S27 [37,38,39,40,41,42,43,44,45,46,47,48,49,50,51,52,53,54,55,56,57]. When multiple risk factors impacted simultaneously on incidence and mortality, they were jointly estimated by calculating cumulative risk reduction. Examples of the calculations to find treatment or incidence impacts, cumulative risk factor impact and proportional changes in incidence and mortality over time are shown in Figures S8–S11. This accounts for risk factor prevalence overlap but assumes independence of effects [44].

3. Results

We present the outputs of the model using North Kent as an example, which covers 22% of the Kent population and 27% of Kent County’s land mass.
The children’s section was primarily used for setting appropriate assumptions on interventions and other factors within the children age group, and the model scenarios were run to determine the consequential impact in the adult population over time. Hence, results are presented for the adult population of the model (Figure 4, Figure 5 and Figure 6). Table 2 shows the prevalence of long-term conditions in 2012 and 2037 and demonstrates the percentage difference between no interventions and “Better Health” scenarios.

4. Discussion

Main Finding

We have described an SD simulation model for the population of Kent in southeast England, showing the impacts of a range of prevention interventions on life expectancy, the prevalence of long-term conditions, healthcare utilisation and cost. The model was initialised from 2012 and closely matches the historical data up till 2018. Of the 13 evidence-based prevention interventions that were simulated, 5 were applied to children and young people and 8 to the adult section. The application of the “Better Health” scenario in the model resulted in changes to the size of the four cohorts over the model period (Figure 4). The size of the no-condition cohort increased, and the other three cohorts decreased in size. This shows the marginal benefit of the combined effect of the interventions across the course of life, at pace and scale. The impact of the interventions on both life expectancy at birth and healthy life expectancy is significant, adding 5.1 and 5.0 years, respectively (Figure 5). This is significant from an individual perspective in terms of adding years to life and life to years, but the increase in the overall proportion and size of the healthy living population is moderated due to the dynamic properties of complex systems. Any improvement in the health status of the population leads to a productive workforce and its associated positive impact on the wider economy and society as a whole.
Figure 4. Population changes in the four cohorts due to no interventions or “Better Health” scenario. This shows the four cohorts and the difference in percentage of the population of that cohort at the end of the model period from the do nothing (no interventions) or “Better Health” scenarios.
Systems 11 00247 g004
Figure 5. Output of the model showing change in life expectancy and healthy life expectancy from birth due to no interventions or “Better Health” scenario.
Systems 11 00247 g005
Figure 6. Model output of non-elective admissions and accident and emergency attendance due to no interventions or “Better Health” scenario.
Systems 11 00247 g006
Using the modelling approach, we have also demonstrated the impact on healthcare utilisation in terms of emergency admissions and attendance at accident and emergency centres. Although the reduction in activity appears insignificant, the estimated accrued cost savings calculated using the unit price of activity over the model period is noteworthy, as for one area of Kent, it is GBP 7.8 million (GBP (Pound Sterling) 1 = USD (United States Dollar) 1.22) (Figure 6). In the “Better Health” scenario, the modelling shows a significant reduction in most of the long-term conditions over the course of the model. All thirteen conditions except neurological conditions and moderate frailty show varying levels of reduction. Three conditions show a reduction well over 5% when compared to no interventions—stroke (15.04%), COPD (8.13%) and diabetes (6.66%). This demonstrates the robustness of the evidence base behind the included interventions (Table 2).
The result of our study aligns with broader research in this area that uses SDM to address the complexities of preventing chronic diseases and other associated conditions. By creating “do nothing” versus “do something” scenarios, important distinctions are revealed, showing the long-term gains by investing in preventative actions [58]. To our knowledge, the systematic review by Wang et al. is the first attempt to evaluate the application of SDM to chronic diseases, which included 34 studies. Surprisingly, there were no studies from the UK, and the majority were from the USA. This represents a gap in the literature in the UK and the relevance of this research. Studies analysed differences between upstream and downstream prevention measures for chronic conditions. Upstream interventions include wider determinants such as improving income and community cohesion, whereas downstream interventions include behaviour-related interventions. Although only downstream interventions were found to significantly reduce chronic disease and mortality, the resources to fund them would need to be redirected from upstream allocations to meet these pressures. Upstream interventions, however, would reduce the prevalence of chronic illness but would have the added value of an increased impact on economic productivity. This demonstrated how SDM analyses health challenges as a whole, rather than taking a less reliable, simplistic view. Homer and Hirsh [7] explain the conditions that are best suited for the application of SDM to public health actions. They state that prevention models should incorporate all the elements of the ecological approach, incorporating disease outcomes, health and risk behaviour, environmental factors and health-related resources and delivery systems. There were notably very few examples of studies that simulated wider determinants, including employment, socioeconomic status and community cohesion, in the literature. This is one of the limitations of our model, as explained in the limitations section. Some studies focus on the qualitative process of engaging thought leaders and health planners in prioritising actions. Loyo et al. [59] demonstrated that SD modelling and local expertise were valuable tools in reprioritising community issues, obtaining community buy-in and determining the best use of community resources.
Further steps and future direction: The model provided the basis for conversations with health leaders, particularly in the North Kent system, where this needs-led approach to forecasting future demand became the subject of healthy debate. The approach was distinct from the extant ‘big consultancy’ solutions that projected future demand based on recent trends, sometimes also ‘adding on’ demographic changes, making the relationship between need and demand opaque. This led to a significant over-estimation of future demand, to the point that local plans to invest in community alternatives to inpatient care became unaffordable, thus undermining the confidence of local leaders in their ability to achieve a sustainable long-term solution. The use of the cohort model outputs formed the basis of a blended approach to demand forecasting that used trend analysis in the short term, gradually being replaced in a blended fashion using a needs-led approach. Cohort modelling is seen as complementary to population health management approaches [60] that are also based on segmentation but are designed to enable targeted interventions by professionals rather than strategic prospective modelling. Population health management represents the population segmented at a particular point in time. In SDM, the segmentation data are used to produce a dynamic projection of the population across segments and cohorts. Thus, both approaches complement each other. Going forward, investment is required to build up local research infrastructure to undertake evaluation studies in order to generate reliable evidence for model inputs. Currently, the cohort model does not include wider determinants. However, we are in the process of expanding the model by including wider determinants such as income, housing and education. This is likely to simulate much more pronounced health effects on the population than behavioural and healthcare determinants [61].
Strengths and limitations: SDM is a better approach than the traditional linear modelling and forecasting as it is able to deal with complex and dynamic systems and their interactions. For example, the draining of a stock through the application of incidence rates based on the presence of risk factors feeds back to reduce the absolute size of the stock and, therefore, the relationship between relative and absolute rates of flow, i.e., absolute rates of flow will reduce as a result of this feedback. These complex relationships are easily represented and calculated at each model time-step using the stock–flow characteristics of SDM, making these explicit and transparent to a model user. During the development of the model, we involved key stakeholders, including subject matter experts, in conceptualising the model, testing and developing the various inputs, and validated the selected scenarios. We also used validated, up-to-date local data to inform model assumptions and calibrate the model outputs.
In terms of the reliability of the results of the model, SDM is deterministic and, hence, the scenario run outputs will remain the same, assuming model inputs and assumptions remain constant, which is the case in our study.
Consideration of possible lag time and our approach: As the model is operating at a population level, the concept of considering lag at an individual patient level is not directly applicable. In the ‘no intervention’ scenario, disease incidence is routinely applied as an annual rate, which is converted into a monthly rate. Changes in risk factors in the Better Health scenario are applied to the incidence to increase or decrease this rate. Secondly, the specification of a timescale for each intervention is displayed in Table 1. This also affects disease incidence rates and is applied over the model timeframe.
Our model did not include an aging chain for the adult model and, hence, age-level assumptions could not be used. This led to the model being more generic. As set out in the Main Finding section, our initial model also did not incorporate wider determinants, and we are addressing all the identified limitations in the future version of the model, which is currently under development. Additionally, in regard to the sensitivity analysis performed, the significance of the input values on change in health over the model period are meaningful. However, the understanding of behaviour patterns and the ability to compute the simulation runs needed to test the model based on the behaviour sensitivity analysis algorithm [48] mentioned above require further study.

5. Conclusions

We have demonstrated the feasibility, applicability and utility of using system dynamics modelling to simulate the impacts of various preventive interventions on health status and healthcare utilisation in the local population. We created a “Better Health” scenario based on 13 interventions and were able to produce outputs through the model compared to the “no intervention” scenario. From the model conception stage to selecting interventions, we worked with stakeholders and subject matter experts, which further strengthened and added value to our approach. Through our modelling, we were able to demonstrate to the decision makers that investing in these prevention interventions will lead to an increase in the proportion of healthy people in the local population, a reduction in those with one or more health conditions and frailty, an increase in life expectancy, reduced urgent healthcare utilisation and reduced expenditure to the local health services, and will prevent the occurrence of many long-term conditions. If these results are scaled up to a wider geography, this could be potentially very significant. This modelling approach has helped us to have informed conversations backed by evidence with local healthcare leaders in our attempt to provide a realistic view of prevention impact on population health and reducing demand on local health services and cost.

Supplementary Materials

The following supporting information can be downloaded at: https://www.mdpi.com/article/10.3390/systems11050247/s1. The Supplementary Materials include Table S1: Data inputs and sources, Table S2: Children and young people cohort definitions, Table S3: Adult cohort definitions, Table S4: Prevalence of children and young people long-term conditions, Table S5: Prevalence of adult long-term conditions, Table S6: Adult percentage prevalence of single-condition long-term conditions within multiple and frail cohorts, Table S7: Incidence per 1000 people aged 18 and over, Table S8: Incidence and mortality rates per 1000 people aged 18 and over, Table S9: Cause of death percentage aged 50 and over, Table S10: ONS mortality by main cause of death, Table S11: Adult percentage prevalence of long-term conditions by social group, Table S12: Observed risk factor levels in 1999 and 2009 by social class, Table S13: Variable definitions for adult risk factors, Table S14: Beta coefficients for major risk factors: systolic blood pressure, Table S15: Beta coefficients for major risk factors: body mass index, Table S16: Beta coefficients for major risk factors: cholesterol, Table S17: Relative risk for underlying risk, incidence and mortality: smoking in adults, Table S18: Relative risk for underlying risk, incidence and mortality: physical inactivity in adults, Table S19: Relative risk for underlying risk, incidence and mortality: obesity and overweight in adults, Table S20: Relative risk for underlying risk, incidence and mortality: dementia in adults, Table S21: Relative risk for underlying risk, incidence and mortality: hypertension and hypercholesterolaemia in adults, Table S22: Relative risk reduction for CHD and stroke, Table S23: Relative risk for underlying risk, incidence and mortality: alcohol consumption in adults, Table S24: Single prevalence validation through relative deviation rates for Kent, Table S25:Population validation through relative deviation rates for Kent, Table S26: Sensitivity analysis testing ranges, Table S27: Relative risk for underlying risk, incidence: breastfeeding, smoking in pregnancy, child obesity, fuel poverty and ACE in Children and Young People, Figure S1: Estimation of risk factor changes using regression method, Figure S2: Estimation of incidence and mortality changes from risk factor changes using the PAF method, Figure S3: Causal Loop Diagram, Figure S4: Relative deviation, Figure S5: Visual single prevalence model validation for Kent, Figure S6: Visual population model validation for Kent, Figure S7: Sensitivity analysis variation for Healthy Life Expectancy (HLE) at 18, Figure S8: Model validation, Figure S4: Estimation of incidence and mortality changes from a specific treatment, Figure S9: Estimation of incidence changes from fuel poverty changes, Figure S10: Cumulative risk-reduction and Figure S11: Proportional change in cohort incidence and mortality rate over time.

Author Contributions

All authors have met authorship requirements. Specifically, all authors substantially contributed to manuscript development across the following inputs: conception and design (A.G. (Abraham George), A.G. (Alex Gray), P.B., C.H., P.T., P.L., D.S.), acquisition of data (A.G. (Abraham George)., A.G. (Alex Gray), C.H., P.T., P.L.), analysis (A.G. (Alex Gray), C.H., P.T., P.L.) and interpretation of data (A.G. (Abraham George), A.G. (Alex Gray), D.S., C.H., P.B., P.T., P.L.), drafting the article (A.G. (Abraham George), A.G. (Alex Gray), D.S., C.H., P.B., P.T., P.L.), data visualization (A.G. (Alex Gray), CH.) and reviewing the article and revising it critically (A.G. (Abraham George), A.G. (Alex Gray), D.S., C.H., P.B., P.T., P.L.) All authors have read and agreed to the published version of the manuscript.

Funding

This research received no specific external funding. Kent County Council commissioned the Whole Systems Partnership to develop a system modelling tool for the local Joint Strategic Needs Assessment.

Data Availability Statement

All data presented in this article were extracted from local and publicly available data sources.

Acknowledgments

The authors are grateful to Natalie Adams for her contributions in the development of the manuscript in its early stages.

Conflicts of Interest

A.G., C.T., P.T. and P.L. are part of the Whole Systems Partnership, who provide support for partnership development and system redesign in health and social care, and one of the approaches they use is systems dynamic modelling. A.G., D.S. and P.B. have no conflicts of interest to declare.

References

  1. Oxford Brookes University: Protecting Older People Population Information. Available online: https://www.poppi.org.uk (accessed on 23 March 2023).
  2. Lepenioti, K.; Bousdekis, A.; Apostolou, D.; Mentzas, G. Prescriptive analytics: Literature review and research challenges. Int. J. Inf. Manag. 2020, 50, 57–70. [Google Scholar] [CrossRef]
  3. Public Health England: Health Economics: Evidence Resource. Available online: www.gov.uk/government/publications/health-economics-evidence-resource (accessed on 23 March 2023).
  4. Bauer, G.R. Incorporating intersectionality theory into population health research methodology: Challenges and the potential to advance health equity. Soc. Sci. Med. 2014, 110, 10–17. [Google Scholar] [CrossRef] [PubMed]
  5. McGill, E.; Er, V.; Penney, T.; Egan, M.; White, M.; Meier, P.; Whitehead, M.; Lock, K.; de Cuevas, R.A.; Smith, R.; et al. Evaluation of public health interventions from a complex systems perspective: A research methods review. Soc. Sci. Med. 2021, 272, 113697. [Google Scholar] [CrossRef] [PubMed]
  6. Jadeja, N.; Zhu, N.J.; Lebcir, R.M.; Sassi, F.; Holmes, A.; Ahmad, R. Using system dynamics modelling to assess the economic efficiency of innovations in the public sector—A systematic review. PLoS ONE 2022, 17, e0263299. [Google Scholar] [CrossRef] [PubMed]
  7. Homer, J.B.; Hirsch, G.B. System dynamics modeling for public health: Background and opportunities. Am. J. Public Health 2006, 96, 452–458. [Google Scholar] [CrossRef]
  8. Yarnoff, B.; Bradley, C.; Honeycutt, A.A.; Soler, R.E.; Orenstein, D. Estimating the relative impact of clinical and preventive community-based interventions: An example based on the Community Transformation Grant Program. Prev. Chronic Dis. 2019, 16, 180594. [Google Scholar] [CrossRef]
  9. Rutter, H.; Savona, N.; Glonti, K.; Bibby, J.; Cummins, S.; Finegood, D.T.; Greaves, F.; Harper, L.; Hawe, P.; Moore, L.; et al. The need for a complex systems model of evidence for public health. Lancet 2017, 390, 2602–2604. [Google Scholar] [CrossRef]
  10. Currie, D.J.; Smith, C.; Jagals, P. The application of system dynamics modelling to environmental health decision-making and policy—A scoping review. BMC Public Health 2018, 18, 402. [Google Scholar] [CrossRef]
  11. Davahli, M.R.; Karwowski, W.; Taiar, R. A System Dynamics Simulation Applied to Healthcare: A Systematic Review. Int. J. Environ. Res. Public Health 2020, 17, 5741. [Google Scholar] [CrossRef]
  12. Király, G.; Miskolczi, P. Dynamics of participation: System dynamics and participation—An empirical review. Syst. Res. Behav. Sci. 2019, 36, 199–210. [Google Scholar] [CrossRef]
  13. Apostolopoulos, Y.; Lich, H.K.; Lemke, M.K. Complex Systems and Population Health: A Primer; Oxford University Press: New York, NY, USA, 2020. [Google Scholar]
  14. Department of Health and Social Care. Joint Strategic Needs Assessment and Joint Health and Wellbeing Strategies Explained. 2011. Available online: www.gov.uk/government/publications/joint-strategic-needs-assessment-and-joint-health-and-wellbeing-strategies-explained (accessed on 23 March 2023).
  15. Statistical Bulletin. 2021 Mid-Year Population Estimates: Age and Sex Profile. Kent Analytics. January 2023. Available online: https://www.kent.gov.uk/__data/assets/pdf_file/0019/14725/Mid-year-population-estimates-age-and-gender.pdf (accessed on 23 March 2023).
  16. ONS. Census 2021: Total Population Change between 2011 and 2021. Available online: https://www.ons.gov.uk/peoplepopulationandcommunity/populationandmigration/populationestimates (accessed on 23 March 2023).
  17. Data Resource: The Kent Integrated Dataset (KID). Available online: https://ijpds.org/article/view/427 (accessed on 23 March 2023).
  18. Kent County Council (KCC) Housing Led Forecasts 2021. Available online: www.kent.gov.uk/__data/assets/pdf_file/0010/59806/KCC-housing-led-summary.pdf (accessed on 12 March 2023).
  19. ONS, Deaths Broken Down by Age, Sex, Area and Cause of Death. Available online: https://www.ons.gov.uk/peoplepopulationandcommunity/birthsdeathsandmarriages/deaths (accessed on 23 March 2023).
  20. ONS, General Lifestyle Survey: 2011. Available online: www.ons.gov.uk/peoplepopulationandcommunity/personalandhouseholdfinances/incomeandwealth/compendium/generallifestylesurvey/2013-03-07 (accessed on 23 March 2023).
  21. Health Survey for England. Available online: https://digital.nhs.uk/data-and-information/publications/statistical/health-survey-for-england (accessed on 3 March 2023).
  22. General Household Survey. Available online: https://www.data.gov.uk/dataset/138ca035-a90c-4e37-80f5-4c73eeb6ae04/general-household-survey (accessed on 23 March 2023).
  23. Maternity and Breastfeeding. Available online: https://www.england.nhs.uk/statistics/statistical-work-areas/maternity-and-breastfeeding/ (accessed on 23 March 2023).
  24. Statistics on Women’s Smoking Status at Time of Delivery: England. Available online: https://digital.nhs.uk/data-and-information/publications/statistical/statistics-on-women-s-smoking-status-at-time-of-delivery-england (accessed on 23 March 2023).
  25. National Child Measurement Programme. Available online: https://www.gov.uk/government/collections/national-child-measurement-programme (accessed on 23 March 2023).
  26. English Indices of Deprivation 2010. Available online: https://www.gov.uk/government/statistics/english-indices-of-deprivation-2010 (accessed on 23 March 2023).
  27. Millennium Cohort Study. Available online: https://cls.ucl.ac.uk/cls-studies/millennium-cohort-study/ (accessed on 23 March 2023).
  28. NHS Long Term Plan 2019. Available online: www.longtermplan.nhs.uk (accessed on 23 March 2023).
  29. Lacey, P. Strategic Workforce Planning (SWiPe) Derbyshire Re-shaping Community Workforce, Child health and wellbeing services Draft report—July 2016. (Unpublished report July 2016). 20 July 2016. [Google Scholar]
  30. Outcomes Based Healthcare. Available online: https://outcomesbasedhealthcare.com/segmentation-approaches (accessed on 23 March 2023).
  31. English Longitudinal Study of Ageing (ELSA). Available online: www.elsa-project.ac.uk (accessed on 23 March 2023).
  32. NHS Electronic Frailty Index (EFI). Available online: www.england.nhs.uk/ourwork/clinical-policy/older-people/frailty/efi/ (accessed on 23 March 2023).
  33. Lewington, S.; Clarke, R.; Qizilbash, N.; Peto, R.; Collins, R.; Prospective Studies Collaboration. Age specific relevance of usual blood pressure to vascular mortality: A meta-analysis of individual data for one million adults in 61 prospective studies. Lancet 2002, 360, 1903–1913. [Google Scholar] [CrossRef] [PubMed]
  34. Bogers, R.P.; Hoogenveen, R.T.; Boshuizen, H.; Woodward, M.; Knekt, P.; Van Dam, R.M.; Hu, F.B.; Visscher, T.L.S.; Menotti, A.; Thorpe, R.J.; et al. Overweight and obesity increase the risk of coronary heart disease: A pooled analysis of 30 prospective studies. Eur. J. Epidemiol. 2006, 21, 107. [Google Scholar]
  35. James, W.P.T.; Jackson-Leach, R.; Mhurchu, C.N.; Kalamara, E.; Shayeghi, M.; Rigby, N.J.; Nishida, C.; Rodgers, A. Overweight and obesity (high body mass index). In Comparative Quantification of Risk Global and Regional Burden of Disease Attributable to Selected Major Risk Factors; Ezatti, M., Lopez, A.D., Rodgers, A., Murray, C.J.L., Eds.; World Health Organization: Geneva, Switzerland, 2004; pp. 497–596. [Google Scholar]
  36. Lewington, S.; Whitlock, G.; Clarke, R.; Sherliker, P.; Emberson, J.; Halsey, J.; Qizilbash, N.; Peto, R.; Collins, R. Blood cholesterol and vascular mortality by age, sex, and blood pressure: A meta-analysis of individual data from 61 prospective studies with 55000 vascular deaths. Lancet 2007, 370, 1829–1839. [Google Scholar] [CrossRef] [PubMed]
  37. Statistics on Smoking, England—2013. Available online: https://digital.nhs.uk/data-and-information/publications/statistical/statistics-on-smoking/statistics-on-smoking-england-2013 (accessed on 23 March 2023).
  38. Bull, F.; Armstrong, T.P.; Dixon, T.; Ham, S.; Neiman, A.; Pratt, M. Physical inactivity. In Comparative Quantification of Risk Global and Regional Burden of Disease Attributable to Selected Major Risk Factors; Ezatti, M., Lopez, A.D., Rodgers, A., Murray, C.J.L., Eds.; World Health Organization: Geneva, Switzerland, 2004; pp. 729–881. [Google Scholar]
  39. Joubert, J.; Norman, R.; Lambert, E.V.; Groenewald, P.; Schneider, M.; Bull, F. Estimating the burden of disease attributable to physical inactivity in South Africa in 2000. SAMJ S. Afr. Med. J. 2007, 97, 725–731. [Google Scholar] [PubMed]
  40. Mathers, C.; Vos, T.; Stevenson, C. The Burden of disease and injury in Australia, (AIHW Catalogue No. PHE 17). In Comparative Quantification of Risk Global and Regional Burden of Disease Attributable to Selected Major Risk Factors; Ezatti, M., Lopez, A.D., Rodgers, A., Murray, C.J.L., Eds.; World Health Organization: Geneva, Switzerland, 2004. [Google Scholar]
  41. Tackling Obesity in England. Available online: https://www.nao.org.uk/reports/tackling-obesity-in-england/ (accessed on 23 March 2023).
  42. Livingston, G.; Sommerlad, A.; Orgeta, V.; Costafreda, S.G.; Huntley, J.; Ames, D.; Ballard, C.; Banerjee, S.; Burns, A.; Cohen-Mansfield, J.; et al. Dementia prevention, intervention, and care. Lancet Comm. 2017, 390, 2673–2734. [Google Scholar] [CrossRef]
  43. Ezatti, M.; Lopea, A.D.; Rodgers, A.; Murray, C.J.L. (Eds.) Comparative Quantification of Risk. Global and Regional Burden of Disease Attributable to Selected Major Risk Factors; World Health Organization: Geneva, Switzerland, 2004. [Google Scholar]
  44. Unal, B.; Critchley, J.A.; Capewell, S. Explaining the Decline in Coronary Heart Disease Mortality in England and Wales Between 1981 and 2000. Circulation 2004, 109, 1101–1107. [Google Scholar] [CrossRef]
  45. Public Health England, QoF Data: Public Health Profiles—OHID. Available online: www.phe.org.uk (accessed on 5 May 2023).
  46. Yarnoff, B.; Honeycutt, A.; Bradley, C.; Khavjou, O.; Bates, L.; Bass, S.; Kaufmann, R.; Barker, L.; Briss, P. Validation of the prevention impacts simulation model (PRISM). Prev. Chronic Dis. 2021, 18, 200225. [Google Scholar] [CrossRef]
  47. Zhang, Y.; Zhang, M.; Hu, H.; He, X. Research on supply and demand of aged services resource allocation in China: A system dynamics model. Systems 2022, 10, 59. [Google Scholar] [CrossRef]
  48. ONS, Population Projections. Available online: https://www.ons.gov.uk/peoplepopulationandcommunity/populationandmigration/populationprojections (accessed on 23 March 2023).
  49. Hekimoğlu, M.; Barlas, Y. Sensitivity analysis for models with multiple behavior modes: A method based on behavior pattern measures. Syst. Dyn. Rev. 2016, 32, 332–362. [Google Scholar] [CrossRef]
  50. Isee Systems, Stella Architect. Available online: https://www.iseesystems.com/store/products/stella-architect.aspx (accessed on 23 March 2023).
  51. Victora, C.G.; Bahl, R.; Barros, A.J.; França, G.V.; Horton, S.; Krasevec, J.; Murch, S.; Sankar, M.J.; Walker, N.; Rollins, N.C.; et al. Breastfeeding in the 21st century: Epidemiology, mechanisms, and lifelong effect. Lancet 2016, 387, 475–490. [Google Scholar] [CrossRef]
  52. Gaysina, D.; Fergusson, D.M.; Leve, L.D.; Horwood, J.; Reiss, D.; Shaw, D.S.; Elam, K.K.; Natsuaki, M.N.; Neiderhiser, J.M.; Harold, G.T. Maternal Smoking During Pregnancy and Offspring Conduct Problems. Evidence From 3 Independent Genetically Sensitive Research Designs. JAMA Psychiatry 2013, 70, 956–963. [Google Scholar] [CrossRef] [PubMed]
  53. Langley, K.; Heron, J.; Smith, G.D.; Thapar, A. Maternal and Paternal Smoking During Pregnancy and Risk of ADHD Symptoms in Offspring: Testing for Intrauterine Effects. Am. J. Epidemiol. 2012, 176, 261–268. [Google Scholar] [CrossRef] [PubMed]
  54. Oken, E.; Levitan, E.B.; Gillman, M.W. Maternal smoking during pregnancy and child overweight: Systematic review and meta-analysis. Int. J. Obes. 2008, 32, 201–210. [Google Scholar] [CrossRef] [PubMed]
  55. Barnes, M.; Butt, S.; Tomaszewski, W. The Dynamics of Bad Housing: The Impact of Bad Housing on the Living Standards of Children; National Centre for Social Research: London, UK, 2008. [Google Scholar]
  56. Boardman, B. Fixing Fuel Poverty: Challenges and Solutions; Earthscan: London, UK, 2010. [Google Scholar]
  57. Public Health Wales. Welsh Adverse Childhood Experiences (ACE) Study: Adverse Childhood Experiences and Their Impact on Health-Harming Behaviours in the Welsh Adult Population; Public Health Wales: Cymru, UK, 2016. [Google Scholar]
  58. Wang, Y.; Hu, B.; Zhao, Y.; Kuang, G.; Zhao, Y.; Liu, Q.; Zhu, X. Applications of system dynamics models in Chronic disease prevention: A systematic review. Prev. Chronic Dis. 2021, 18, 210175. [Google Scholar] [CrossRef] [PubMed]
  59. Loyo, H.K.; Batcher, C.; Wile, K.; Huang, P.; Orenstein, D.; Milstein, B. From model to action. Health Promot. Pract. 2012, 14, 53–61. [Google Scholar] [CrossRef] [PubMed]
  60. NHS England. Population Health and the Population Health Management Programme. Available online: https://www.england.nhs.uk/integratedcare/what-is-integrated-care/phm (accessed on 23 March 2023).
  61. Interdisciplinary Association for Population Health Science. County Health Ranking Model. Available online: https://iaphs.org/institutional-member-highlight-university-of-wisconsin (accessed on 23 March 2023).
Figure 1. Children and young people (CYP) population segmentation. This figure shows the logic tree for segmentation and its relationship to cohort modelling, progression of need and service utilisation for children and young people. If a CYP is eligible for more than one cohort, they are placed within the highest need cohort. The long-term conditions included within the health conditions segment and the risk factors are outlined in text boxes.
Systems 11 00247 g001
Figure 2. Adult population segmentation. This figure shows the logic tree for segmentation of the adult population and its relationship to cohort modelling, progression of need and service utilisation for adults. If an adult is eligible for more than one cohort, they are placed within the highest need cohort. The long-term conditions included within each segment and the risk factors are outlined in text boxes.
Systems 11 00247 g002
Figure 3. Conceptualisation of the system dynamics model. This figure shows a basic conceptualisation of the stocks and flows in the System Dynamics cohort model. Blue arrows show flows between cohorts, green arrows show ageing chains and red arrows show flow out of the stock due to death.
Systems 11 00247 g003
Table 1. Population-level interventions to achieve “Better Health” scenario. Impacts were applied proportionally or absolutely to the baseline to achieve the target.
InterventionTitleBaselineImpact (%)NumberStartEndTargetImplementation
1Increase breastfeeding at 6–8 weeks45.220NA2019202465.2absolute
2Reduce smoking in pregnancy13.96NA201920257.9absolute
3Reduce child obesity16.520NA2019202513.2proportional
4Reduce fuel poverty in children17.420NA2019202213.9proportional
5Reduce ACE in childhood2420NA2020203019.2proportional
6Improve recognition and treatment of hypertension4030NA2020202528proportional
7Improve recognition and treatment of CVD risk5030NA2020202565proportional
8Improve smoking cessation208NA2019202428absolute
9Increase weight management2510NA2019202427.5proportional
10Alcohol screeningNAScreening50,00020192025NAabsolute
11Alcohol treatmentNATreatment500020192030NAabsolute
12Reduce fuel poverty for older people11.520NA201920249.2proportional
13Reduce ACE at 15 years7.520NA202020306proportional
Table 2. Modelled changes in the prevalence of long-term conditions due to no interventions or “Better Health” scenario.
Long-Term
Condition
2012No InterventionsBetter HealthDifference between Better Health and No Interventions
2037Percentage Difference2037Percentage Difference
Asthma6.83%5.95%−12.90%5.88%−13.90%−1.00%
CHD1.92%1.59%−17.23%1.51%−21.48%−4.25%
COPD0.75%0.63%−15.79%0.57%−23.92%−8.13%
Diabetes2.76%3.25%18.02%3.07%11.35%−6.66%
HF0.02%0.02%−10.74%0.02%−10.96%−0.22%
Stroke0.67%0.59%−12.52%0.49%−27.56%−15.04%
Frail moderate1.30%1.53%17.88%1.55%19.27%1.39%
Multiple3.89%3.51%−9.61%3.42%−12.01%−2.40%
SE MI0.54%0.46%−14.18%0.44%−18.27%−4.09%
Neuro0.18%0.19%4.82%0.19%5.17%0.35%
Dementia0.32%0.34%8.12%0.34%7.60%−0.52%
LD0.28%0.26%−7.46%0.26%−7.59%−0.13%
Frail severe2.96%3.35%13.21%3.27%10.45%−2.76%
Disclaimer/Publisher’s Note: The statements, opinions and data contained in all publications are solely those of the individual author(s) and contributor(s) and not of MDPI and/or the editor(s). MDPI and/or the editor(s) disclaim responsibility for any injury to people or property resulting from any ideas, methods, instructions or products referred to in the content.

