

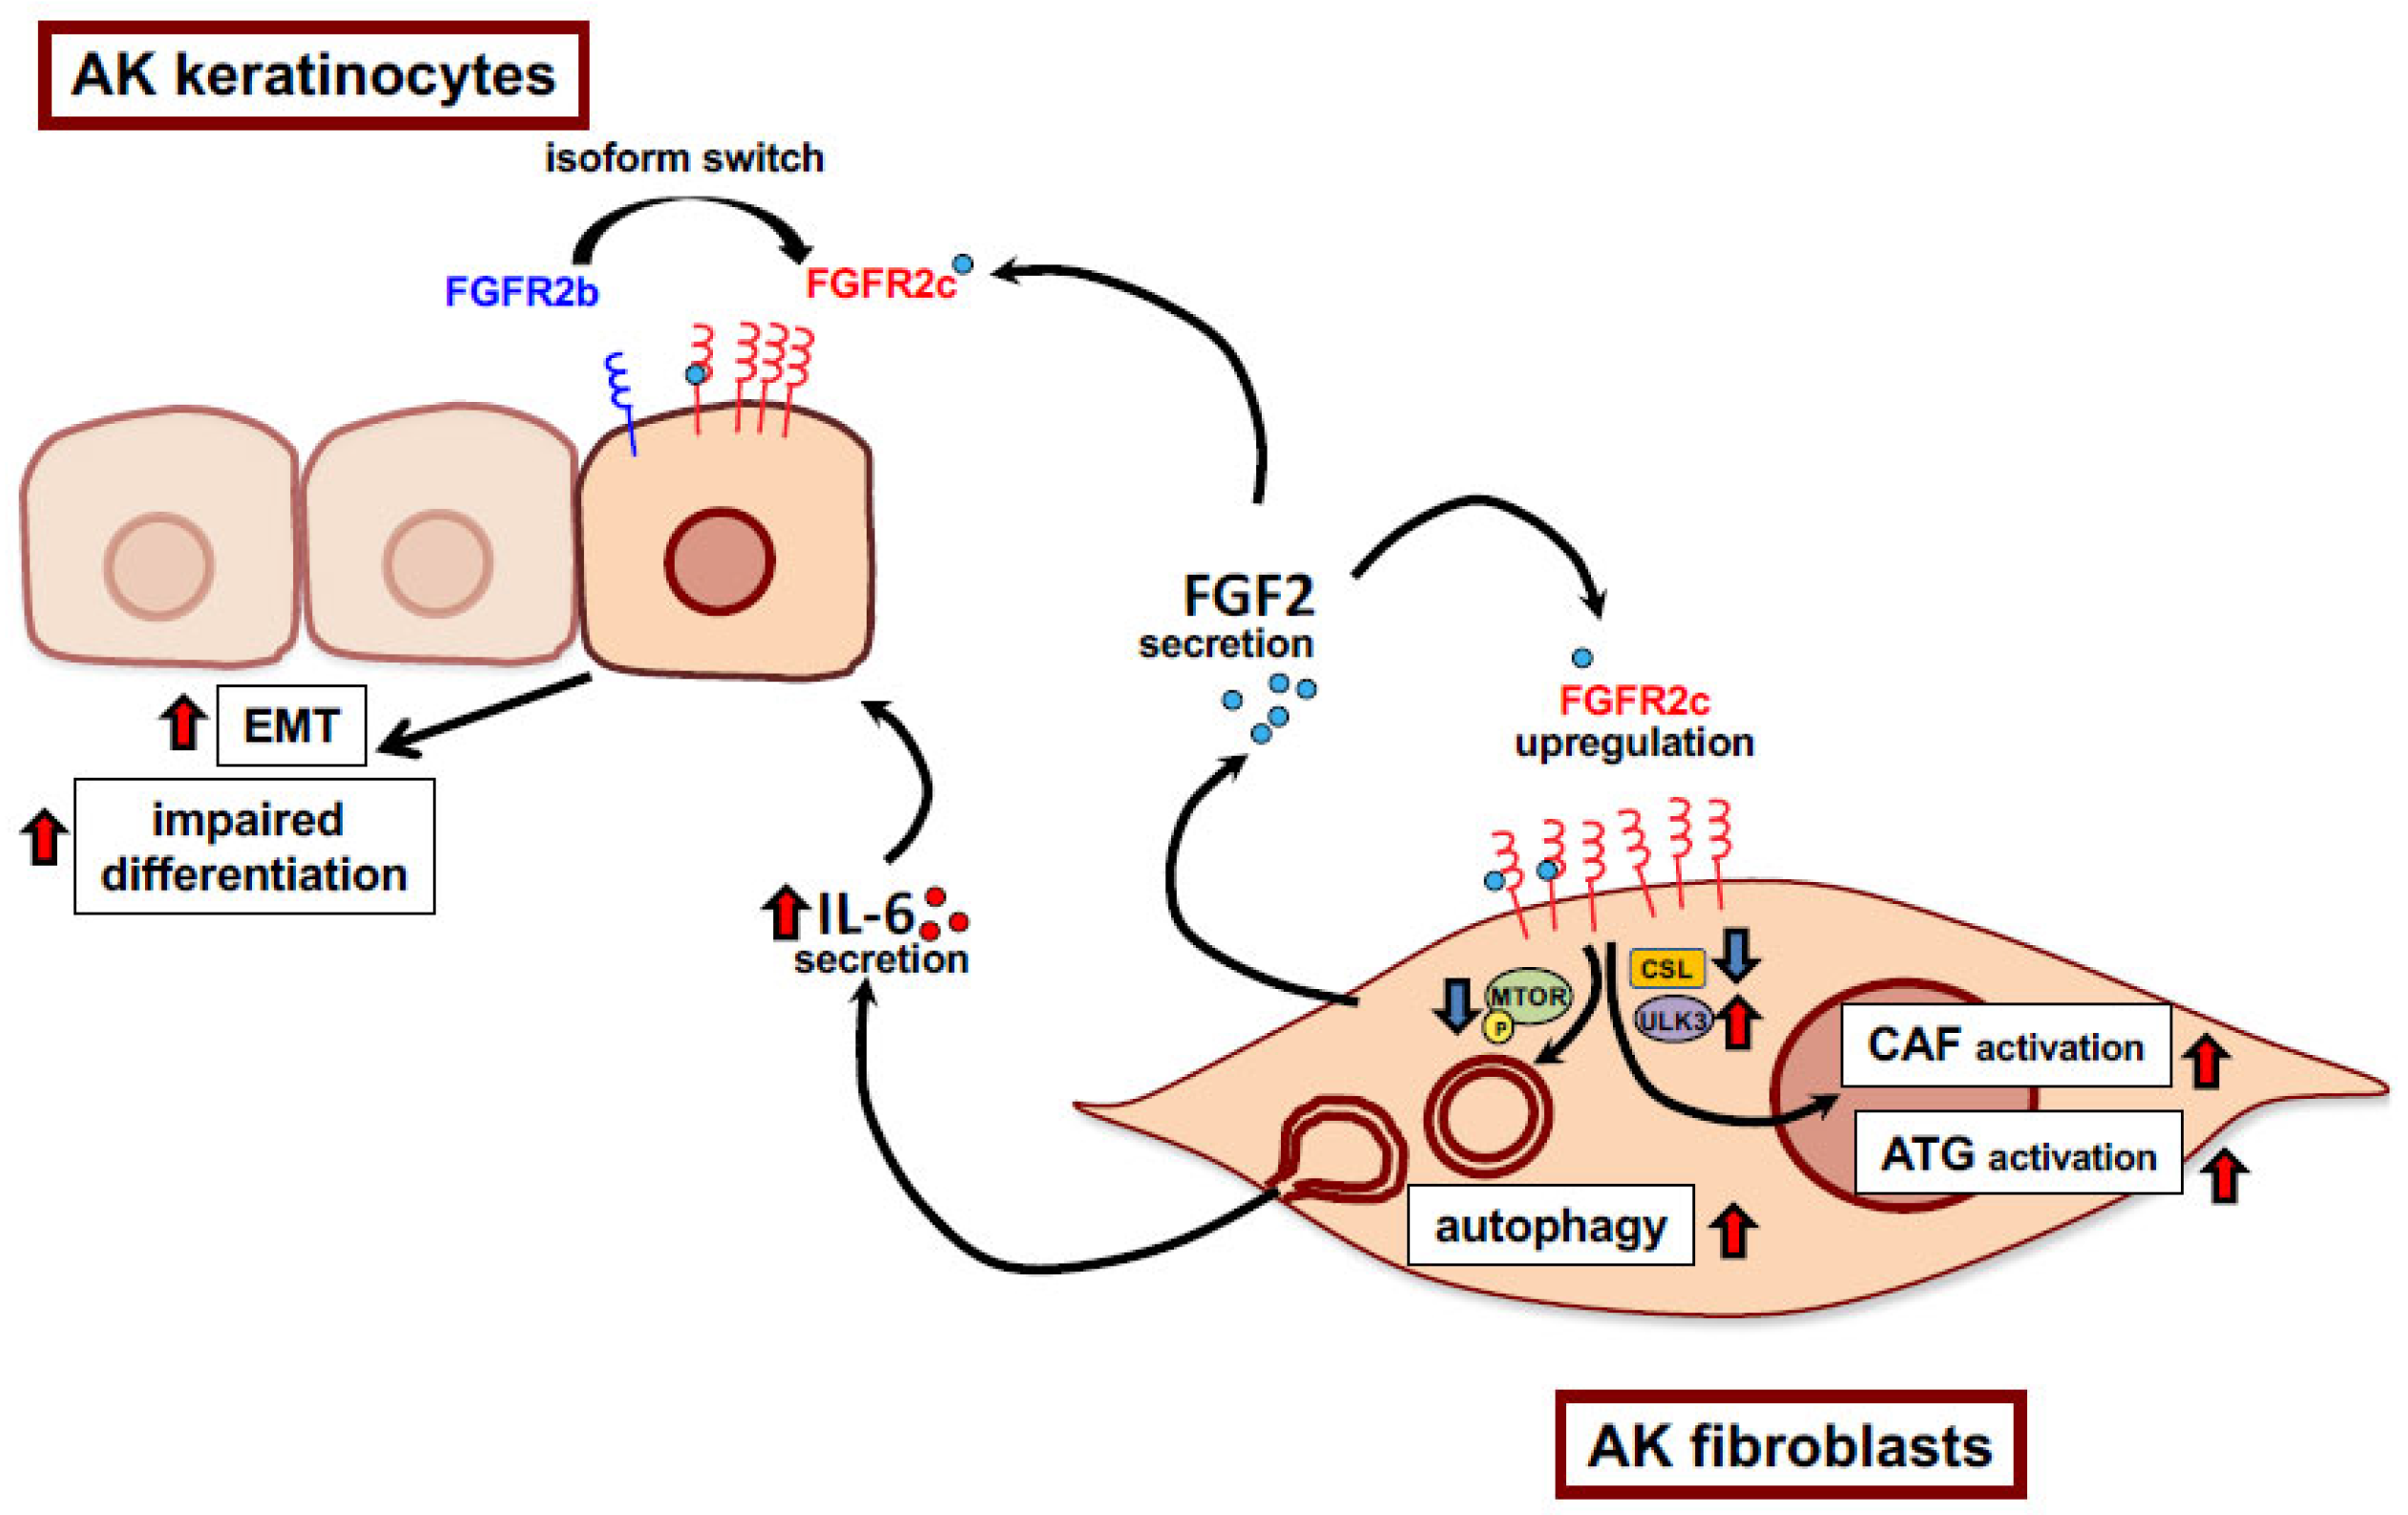
FGFR2c Upregulation Contributes to Cancer-Associated Fibroblast Program Activation and to Enhanced Autophagy in Actinic Keratosis-Derived Dermal Fibroblasts: A Possible Role in Precancerous Cell/Stromal Cell Crosstalk
 , , , , and
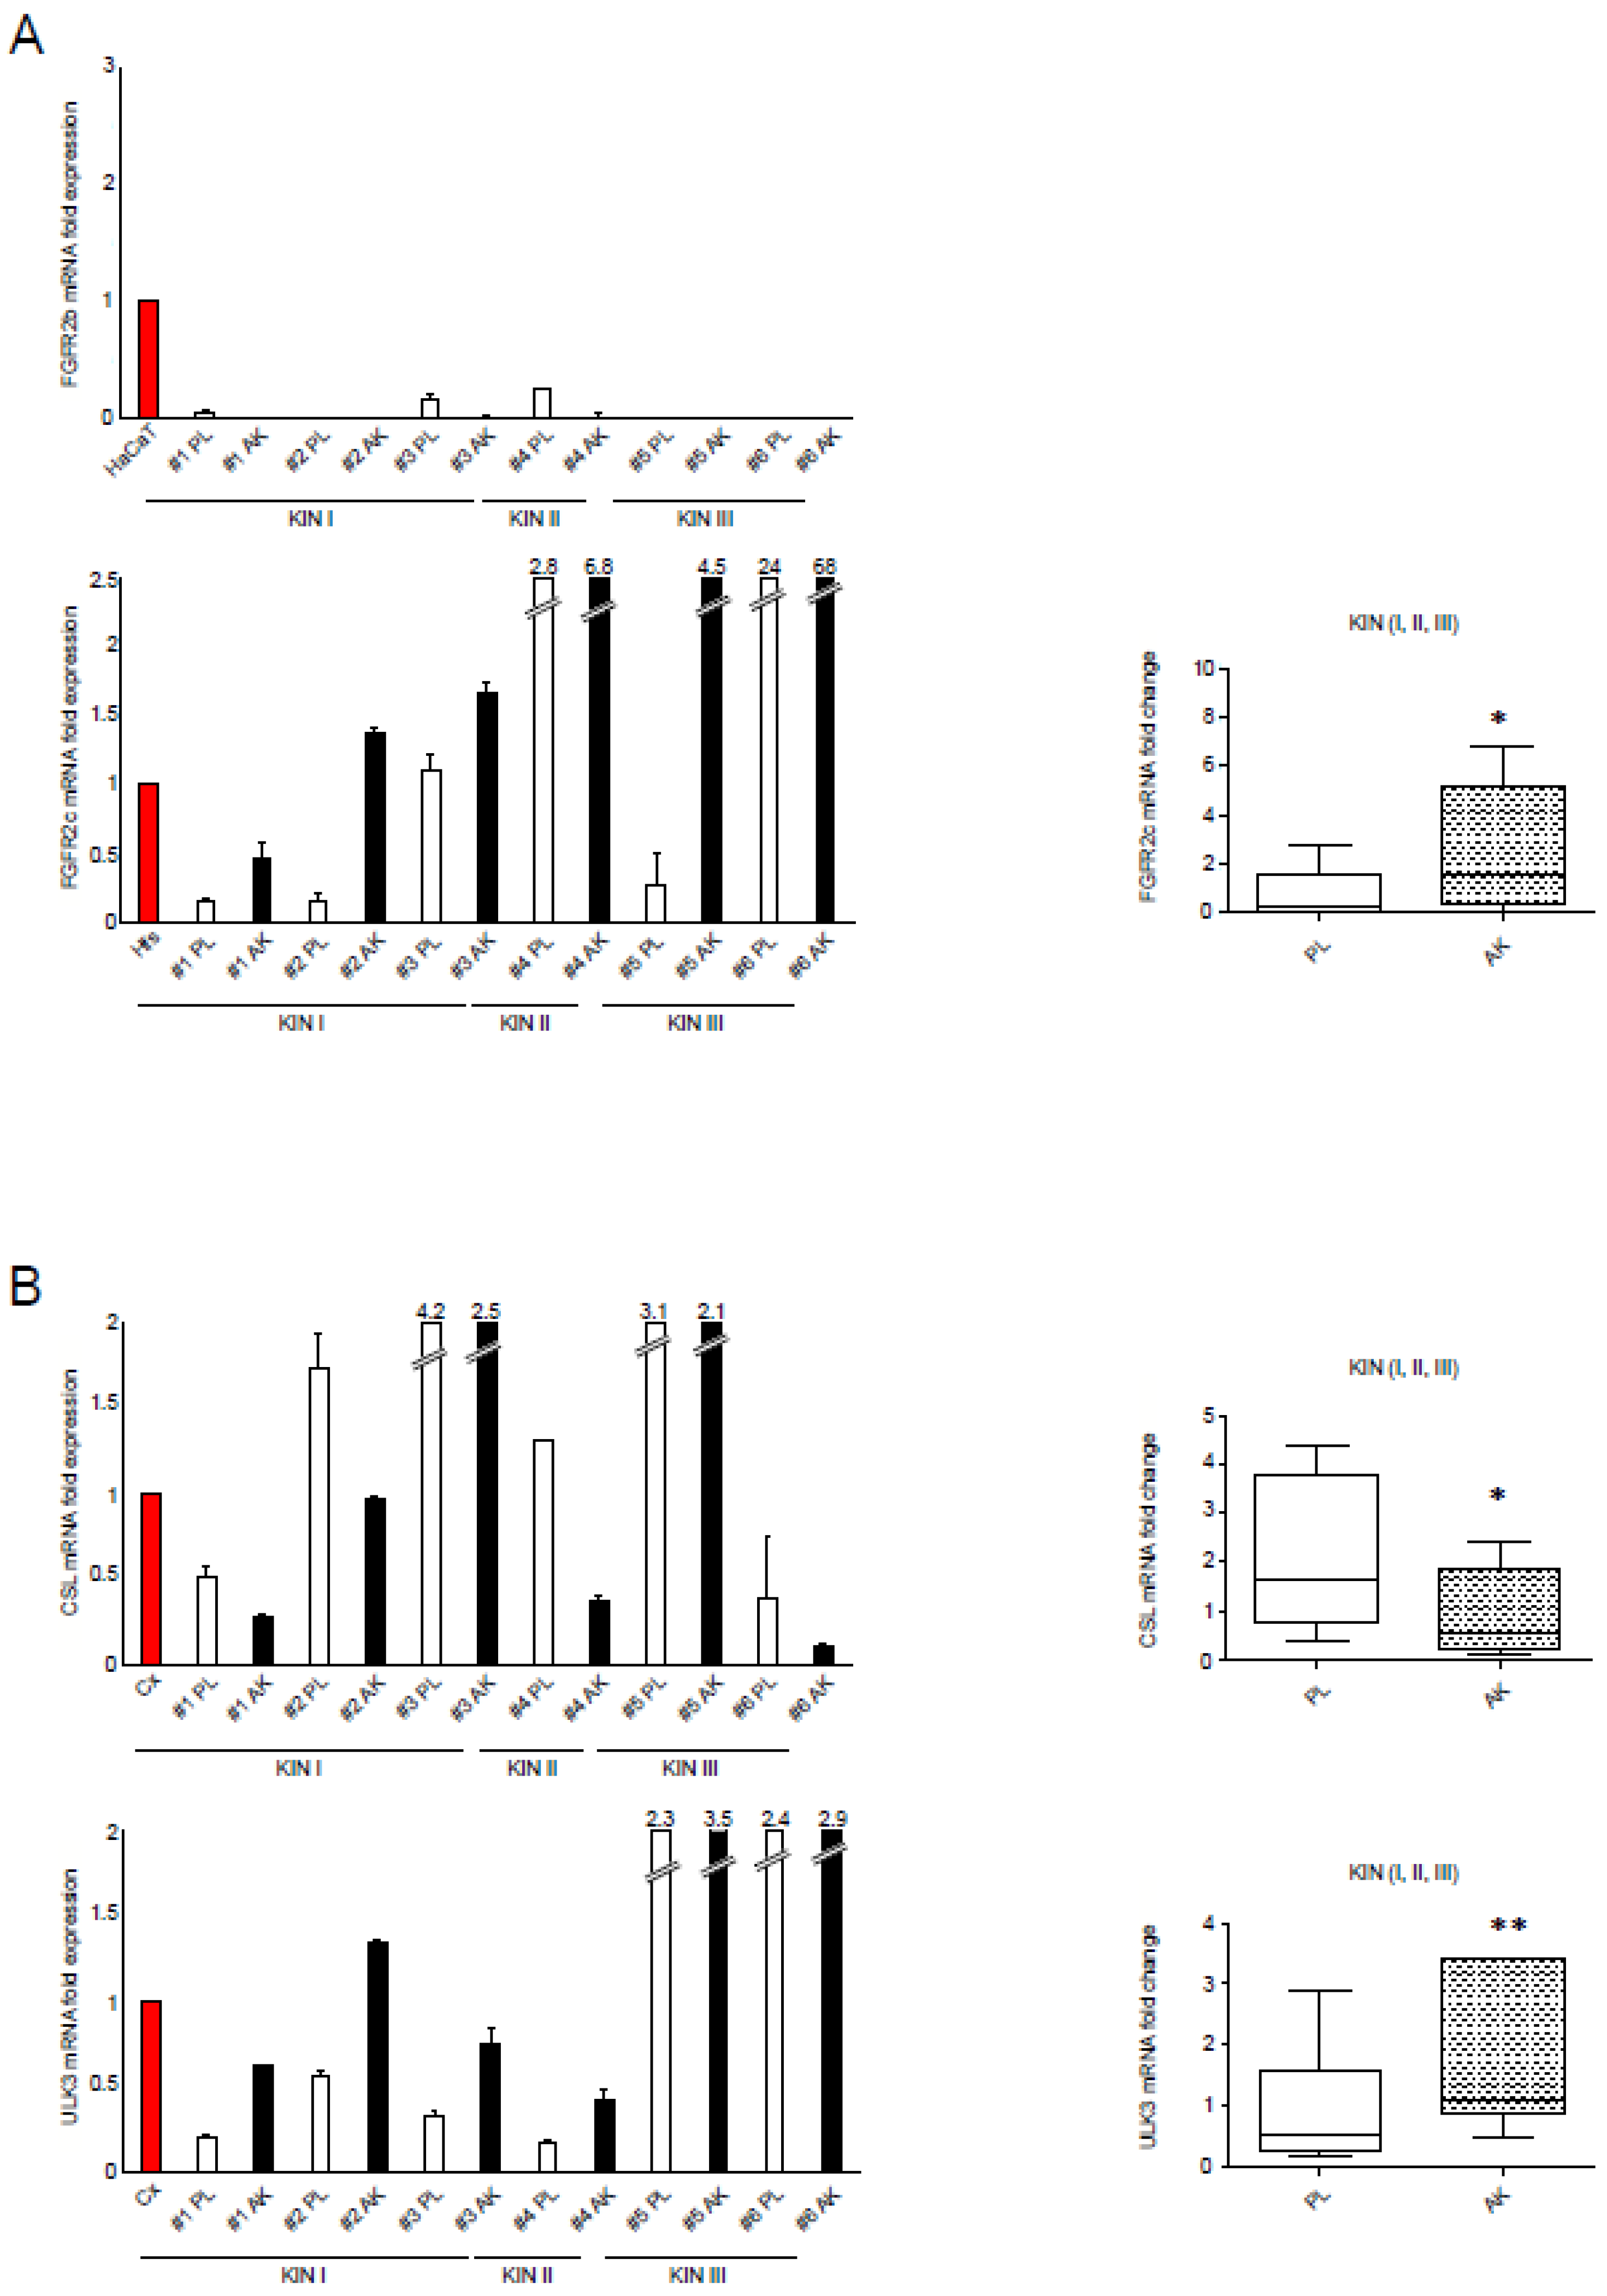
Abstract
:Simple Summary
Abstract
1. Introduction
2. Materials and Methods
2.1. Institutional Review Board Statement
2.2. Histological Samples
2.3. Primary Cell Cultures and Treatments
2.4. Immunofluorescence
2.5. Western Blot Analysis
2.6. Primers
2.7. RNA Extraction and cDNA Synthesis
2.8. PCR Amplification and Real-Time Quantitation
2.9. Magnetic Bead-Based Multiplex Assay
2.10. Statistical Analysis
3. Results
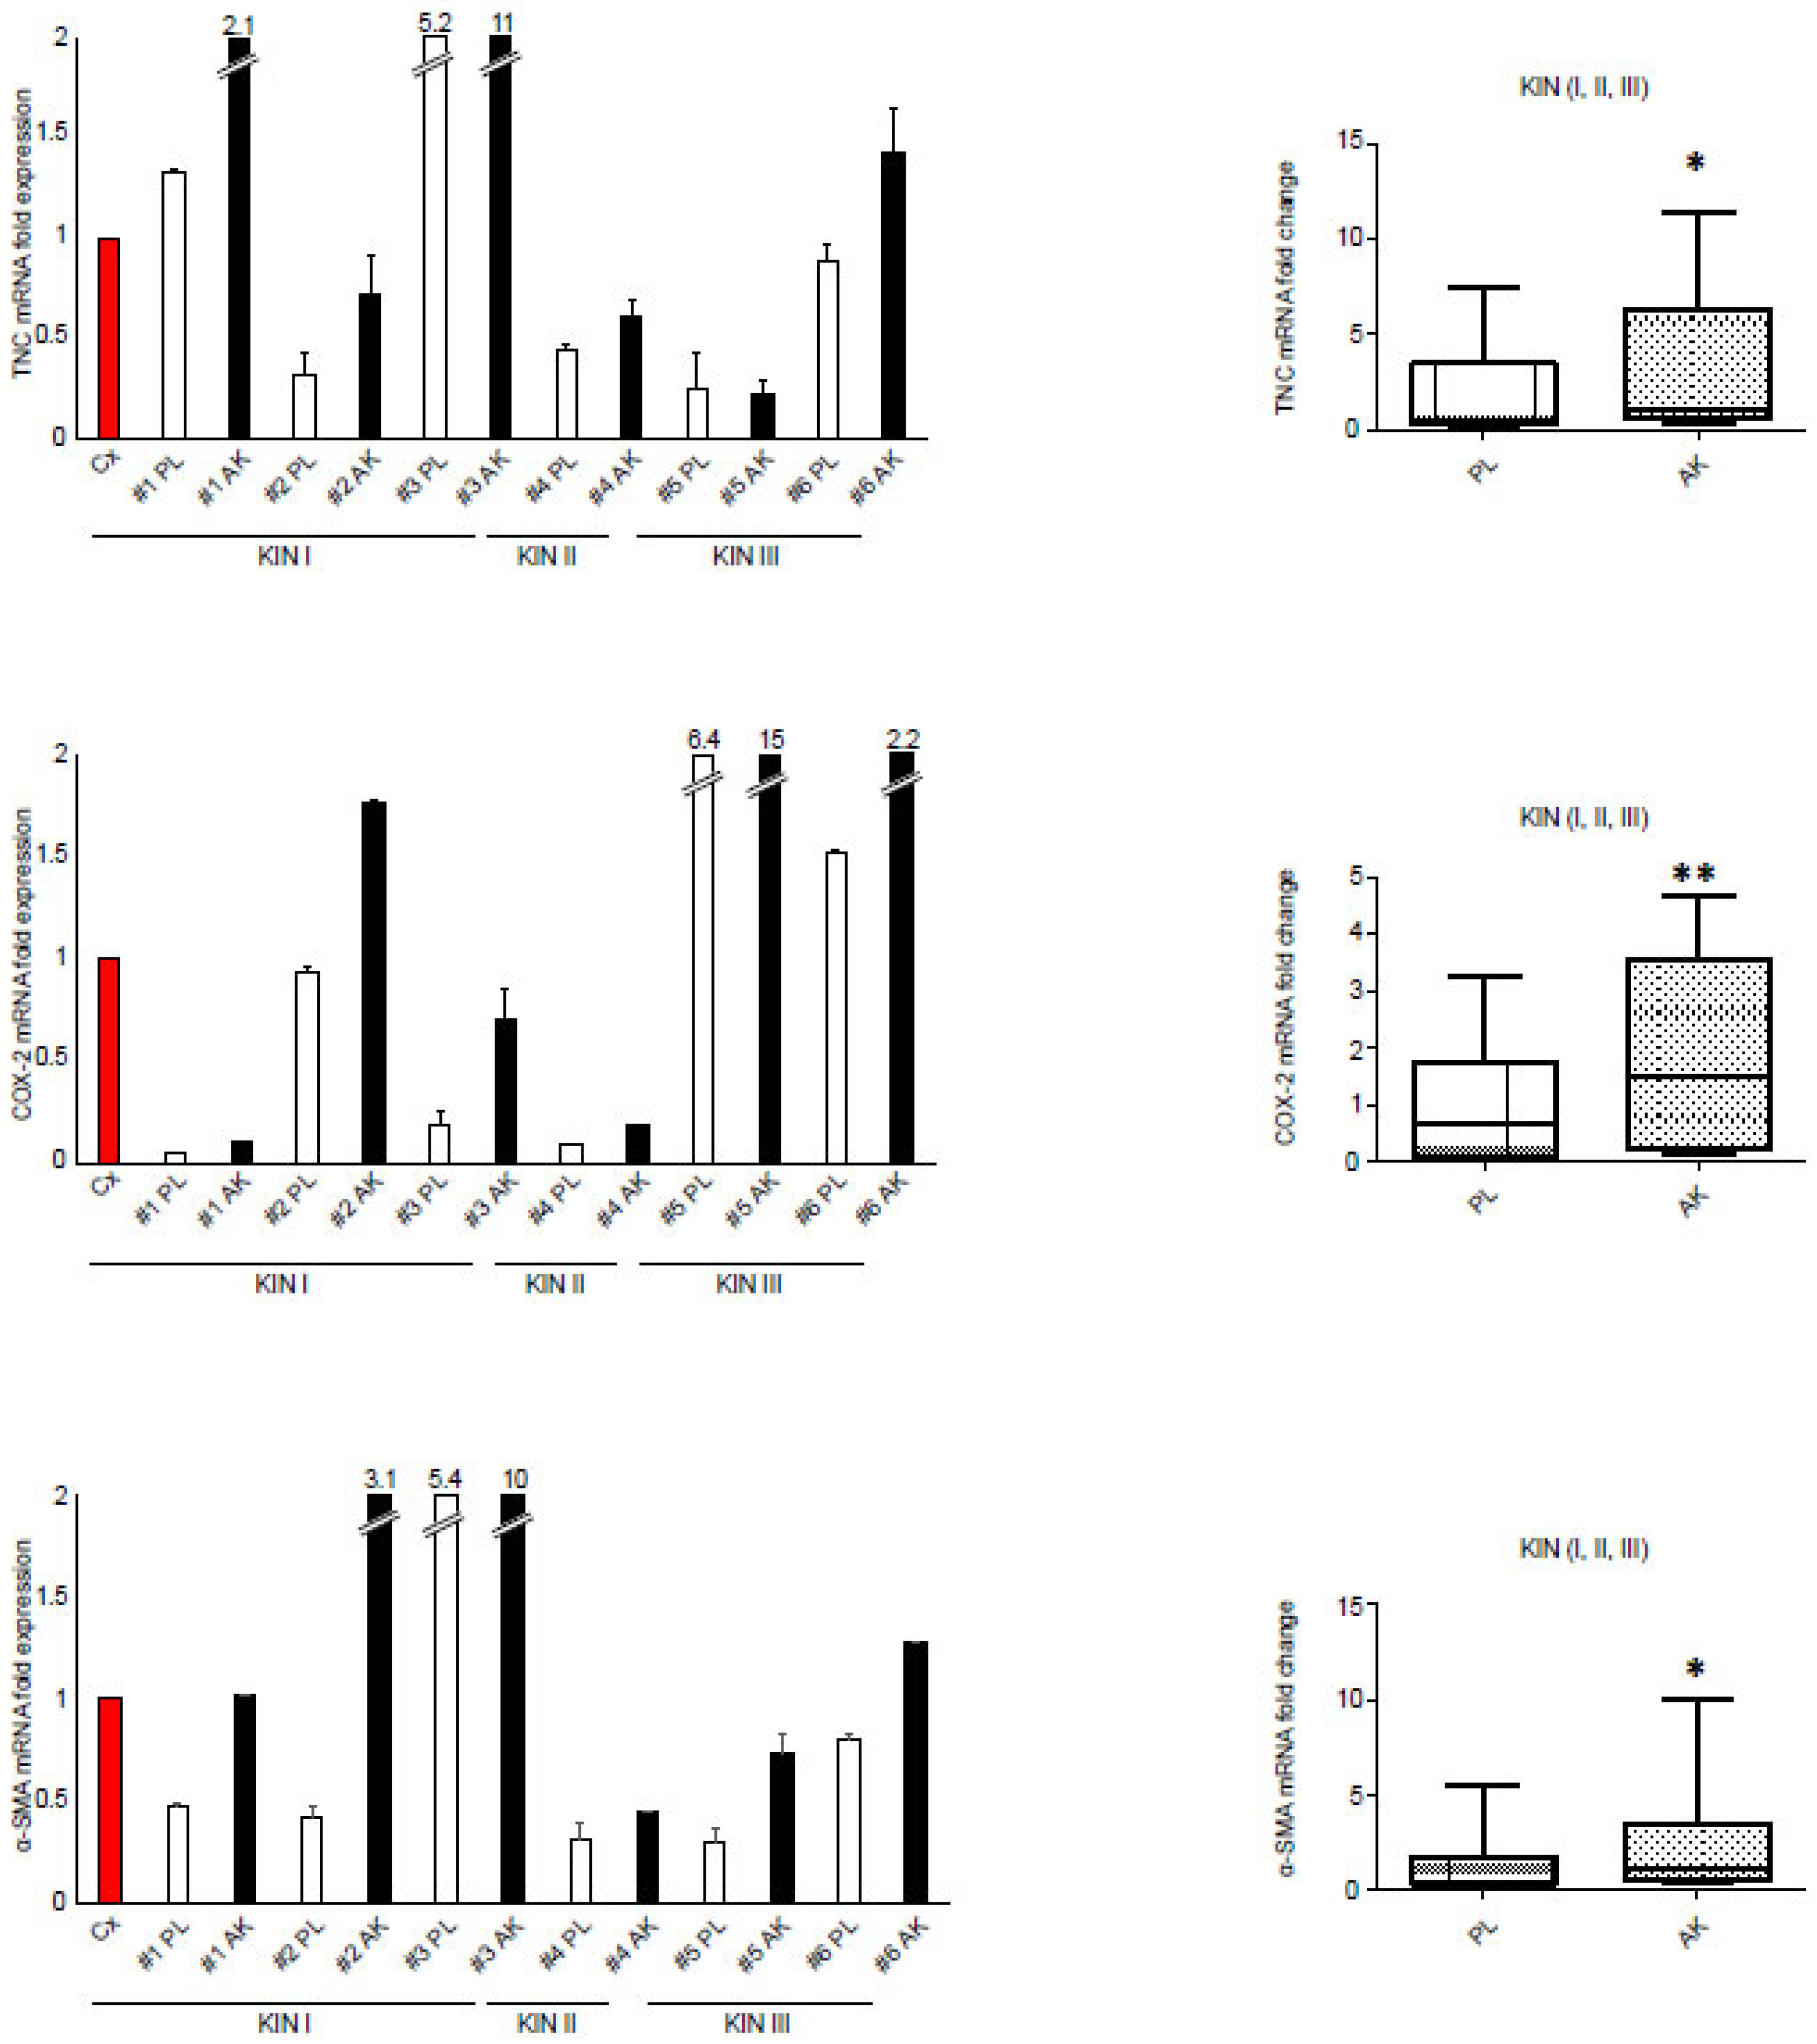
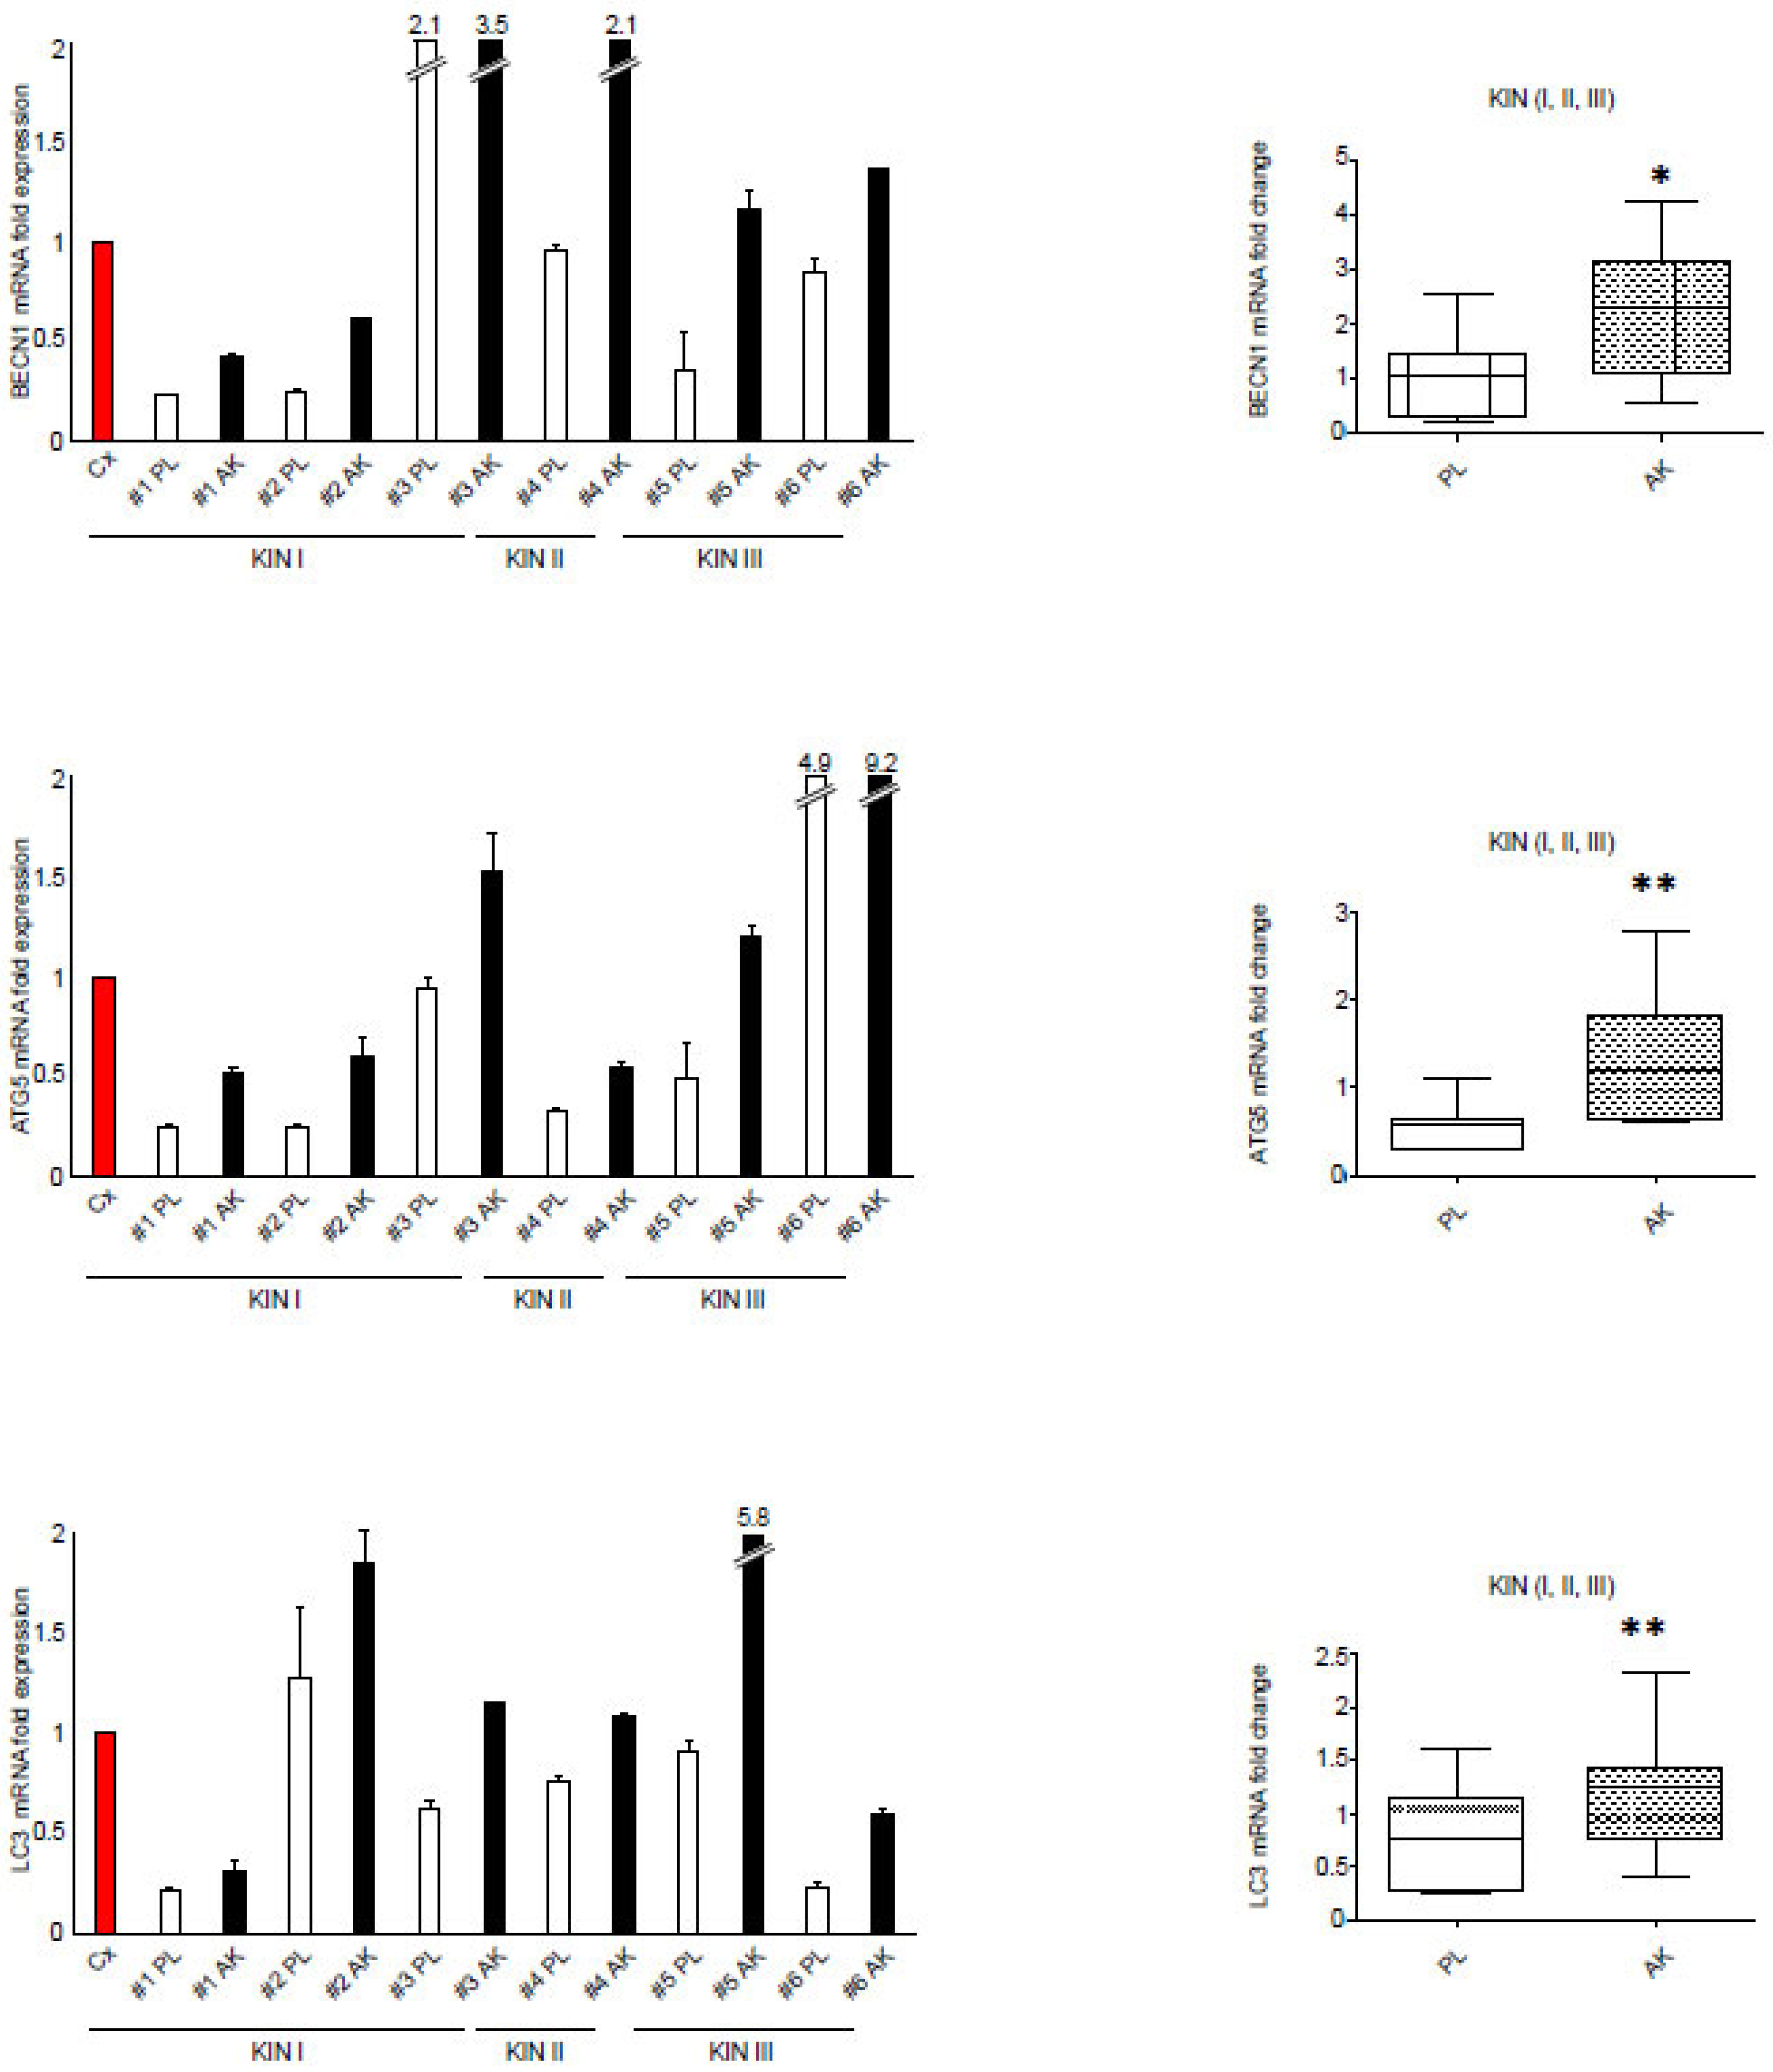
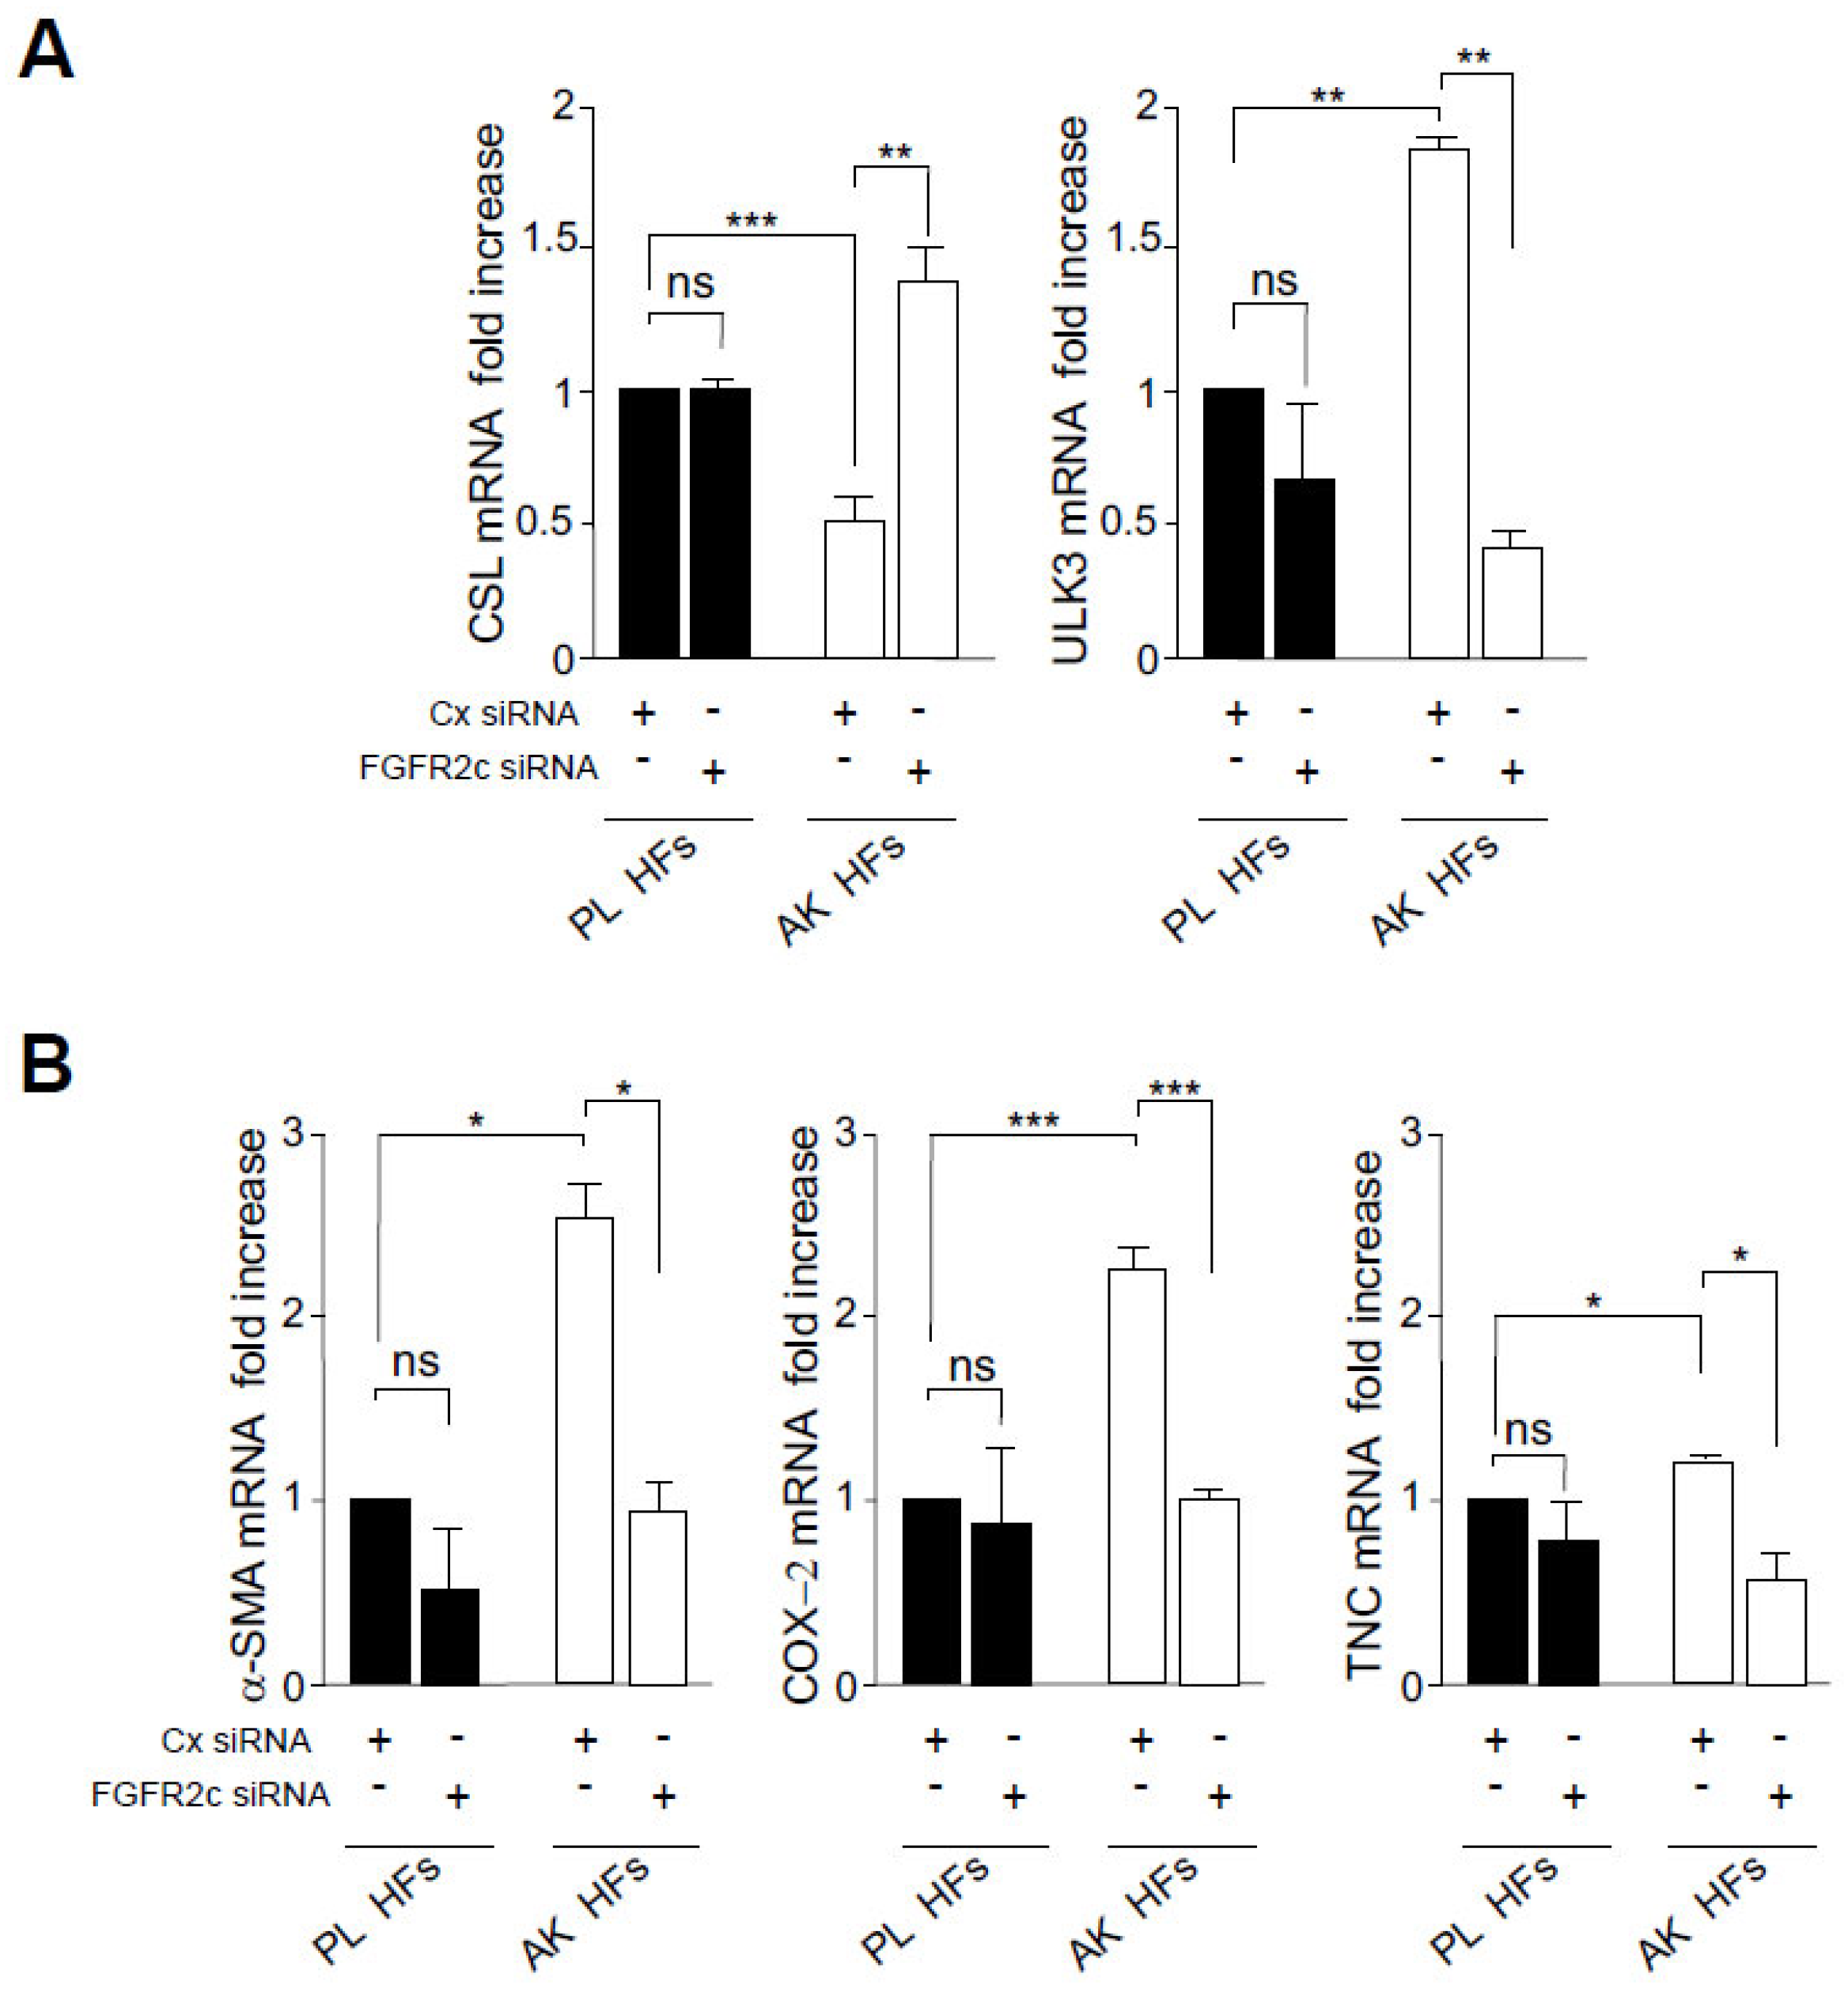
3.1. FGFR2c Upregulation in AK Samples, including KIN I, Is Accompanied by the CSL/ULK3 Loop Modulation and CAF Gene Increase, as Well as by the Transcriptional Induction of Key Autophagic Genes
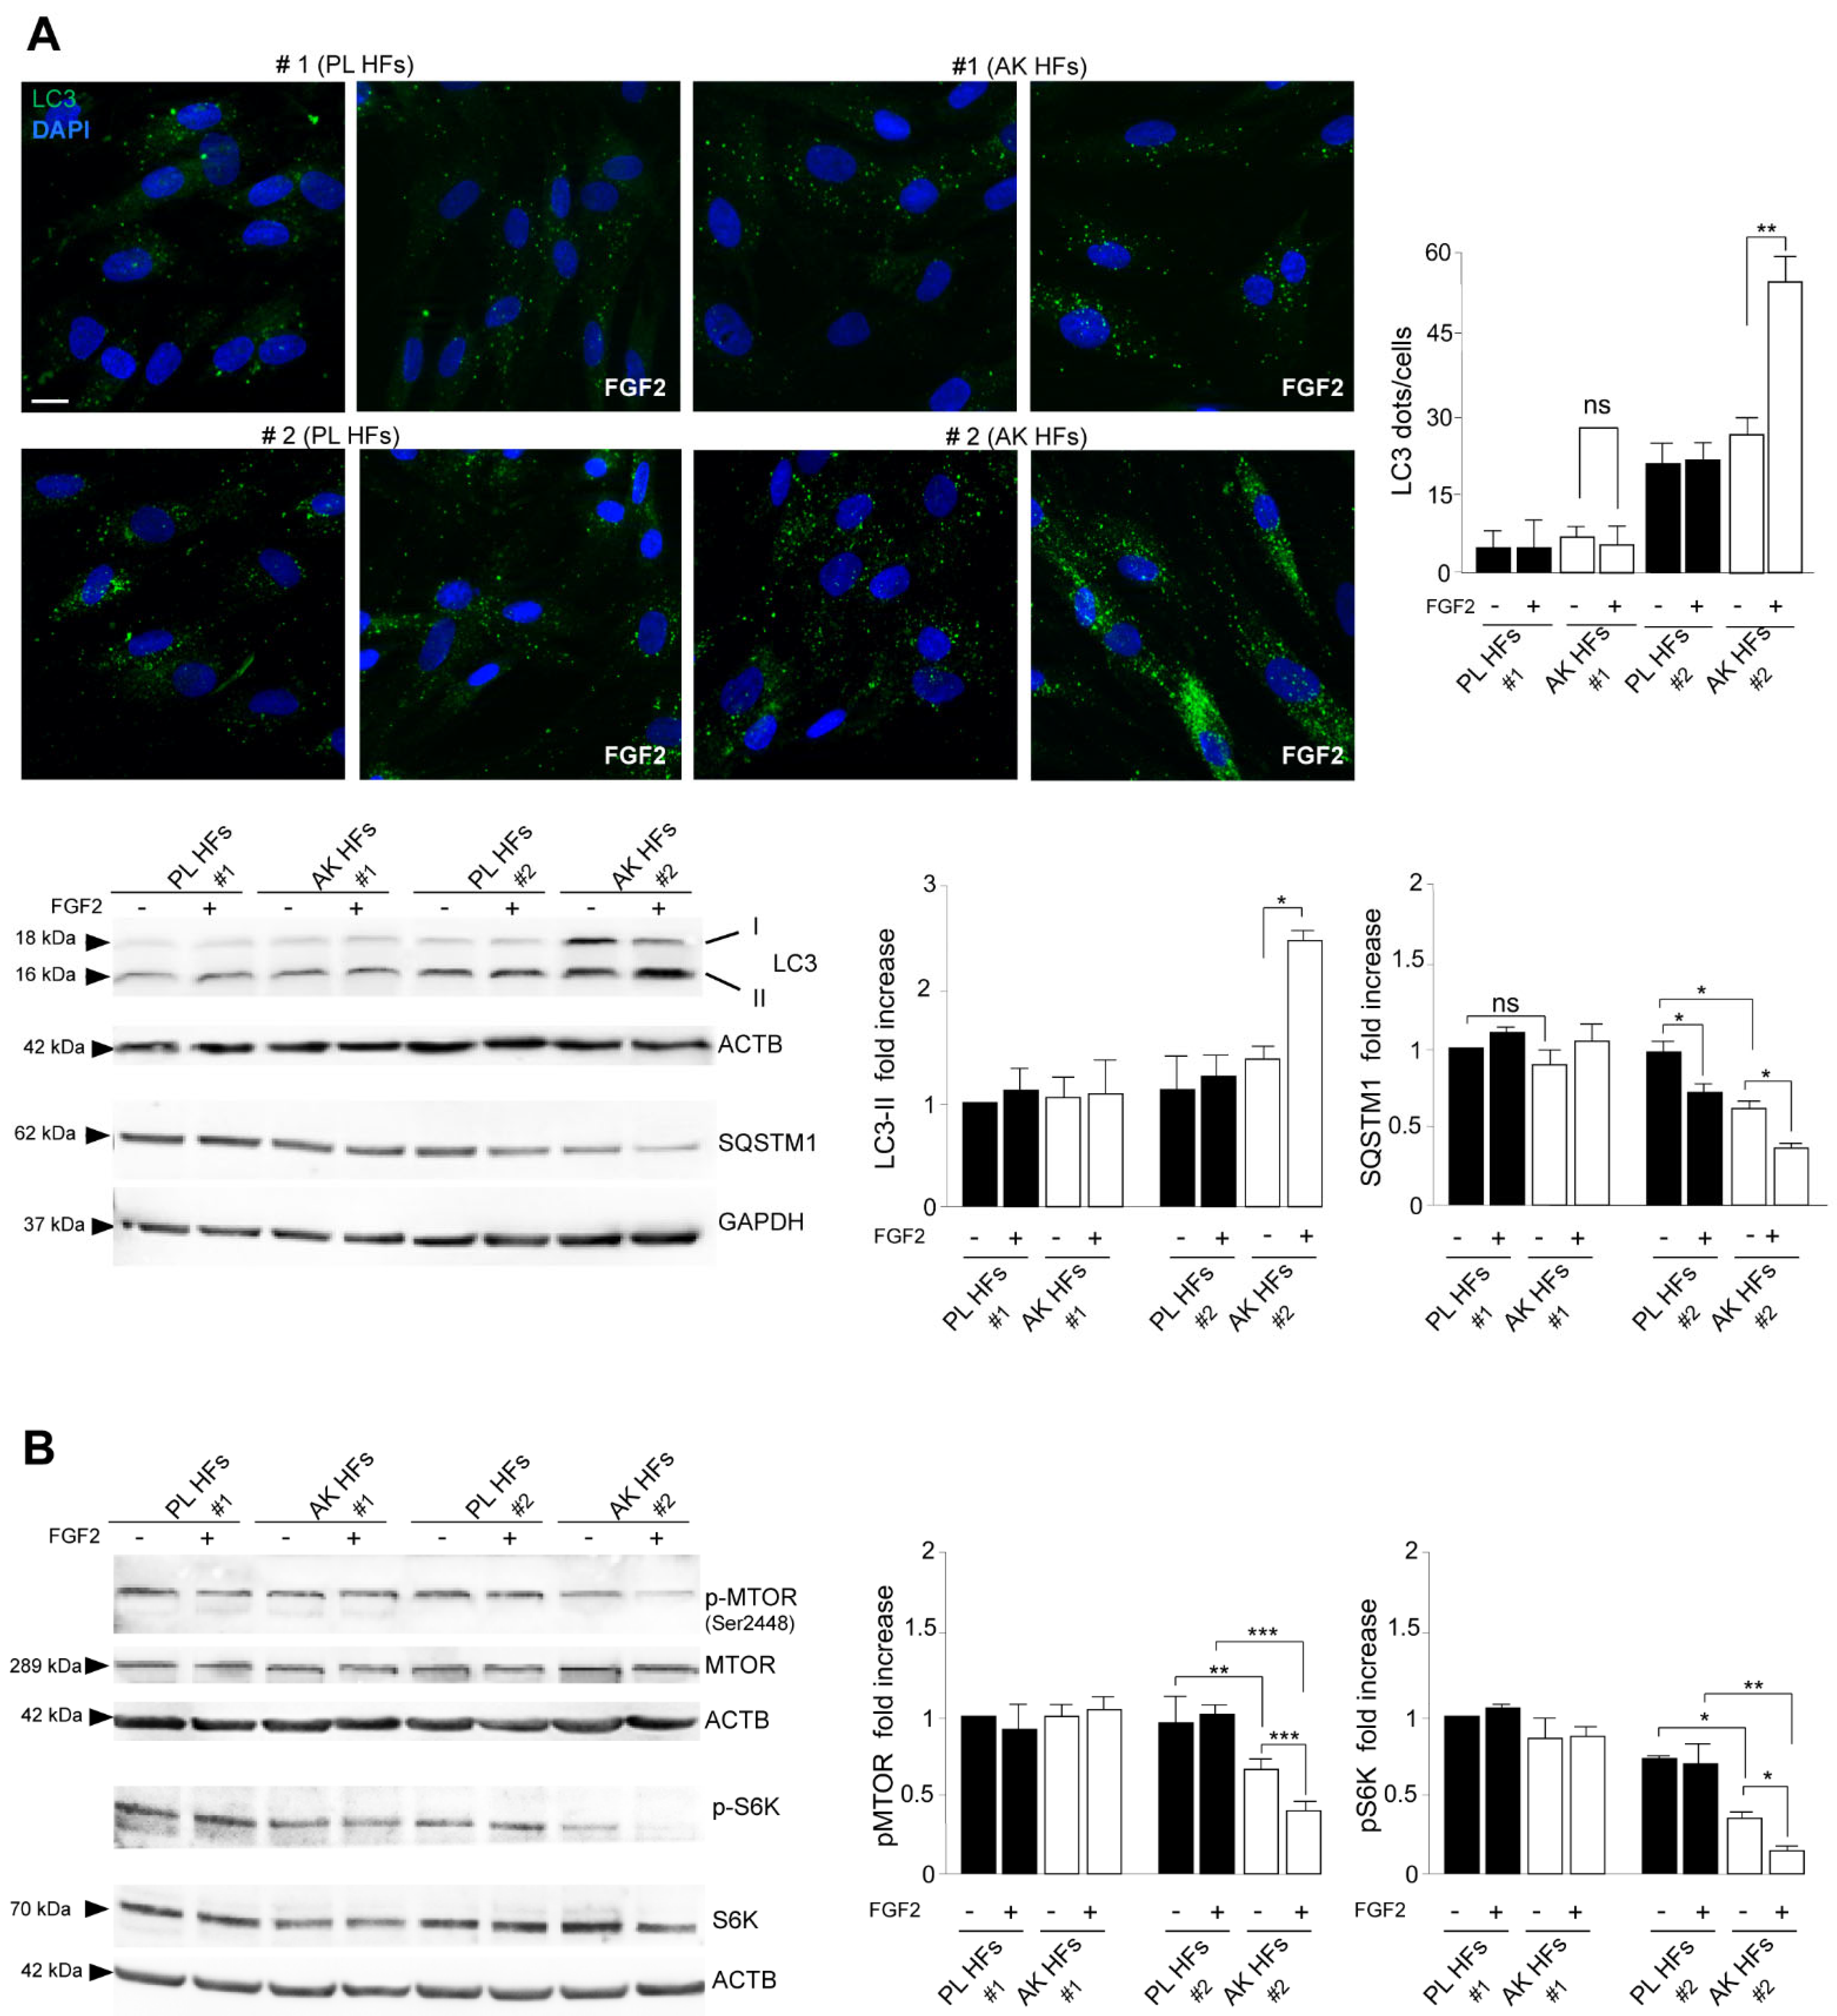
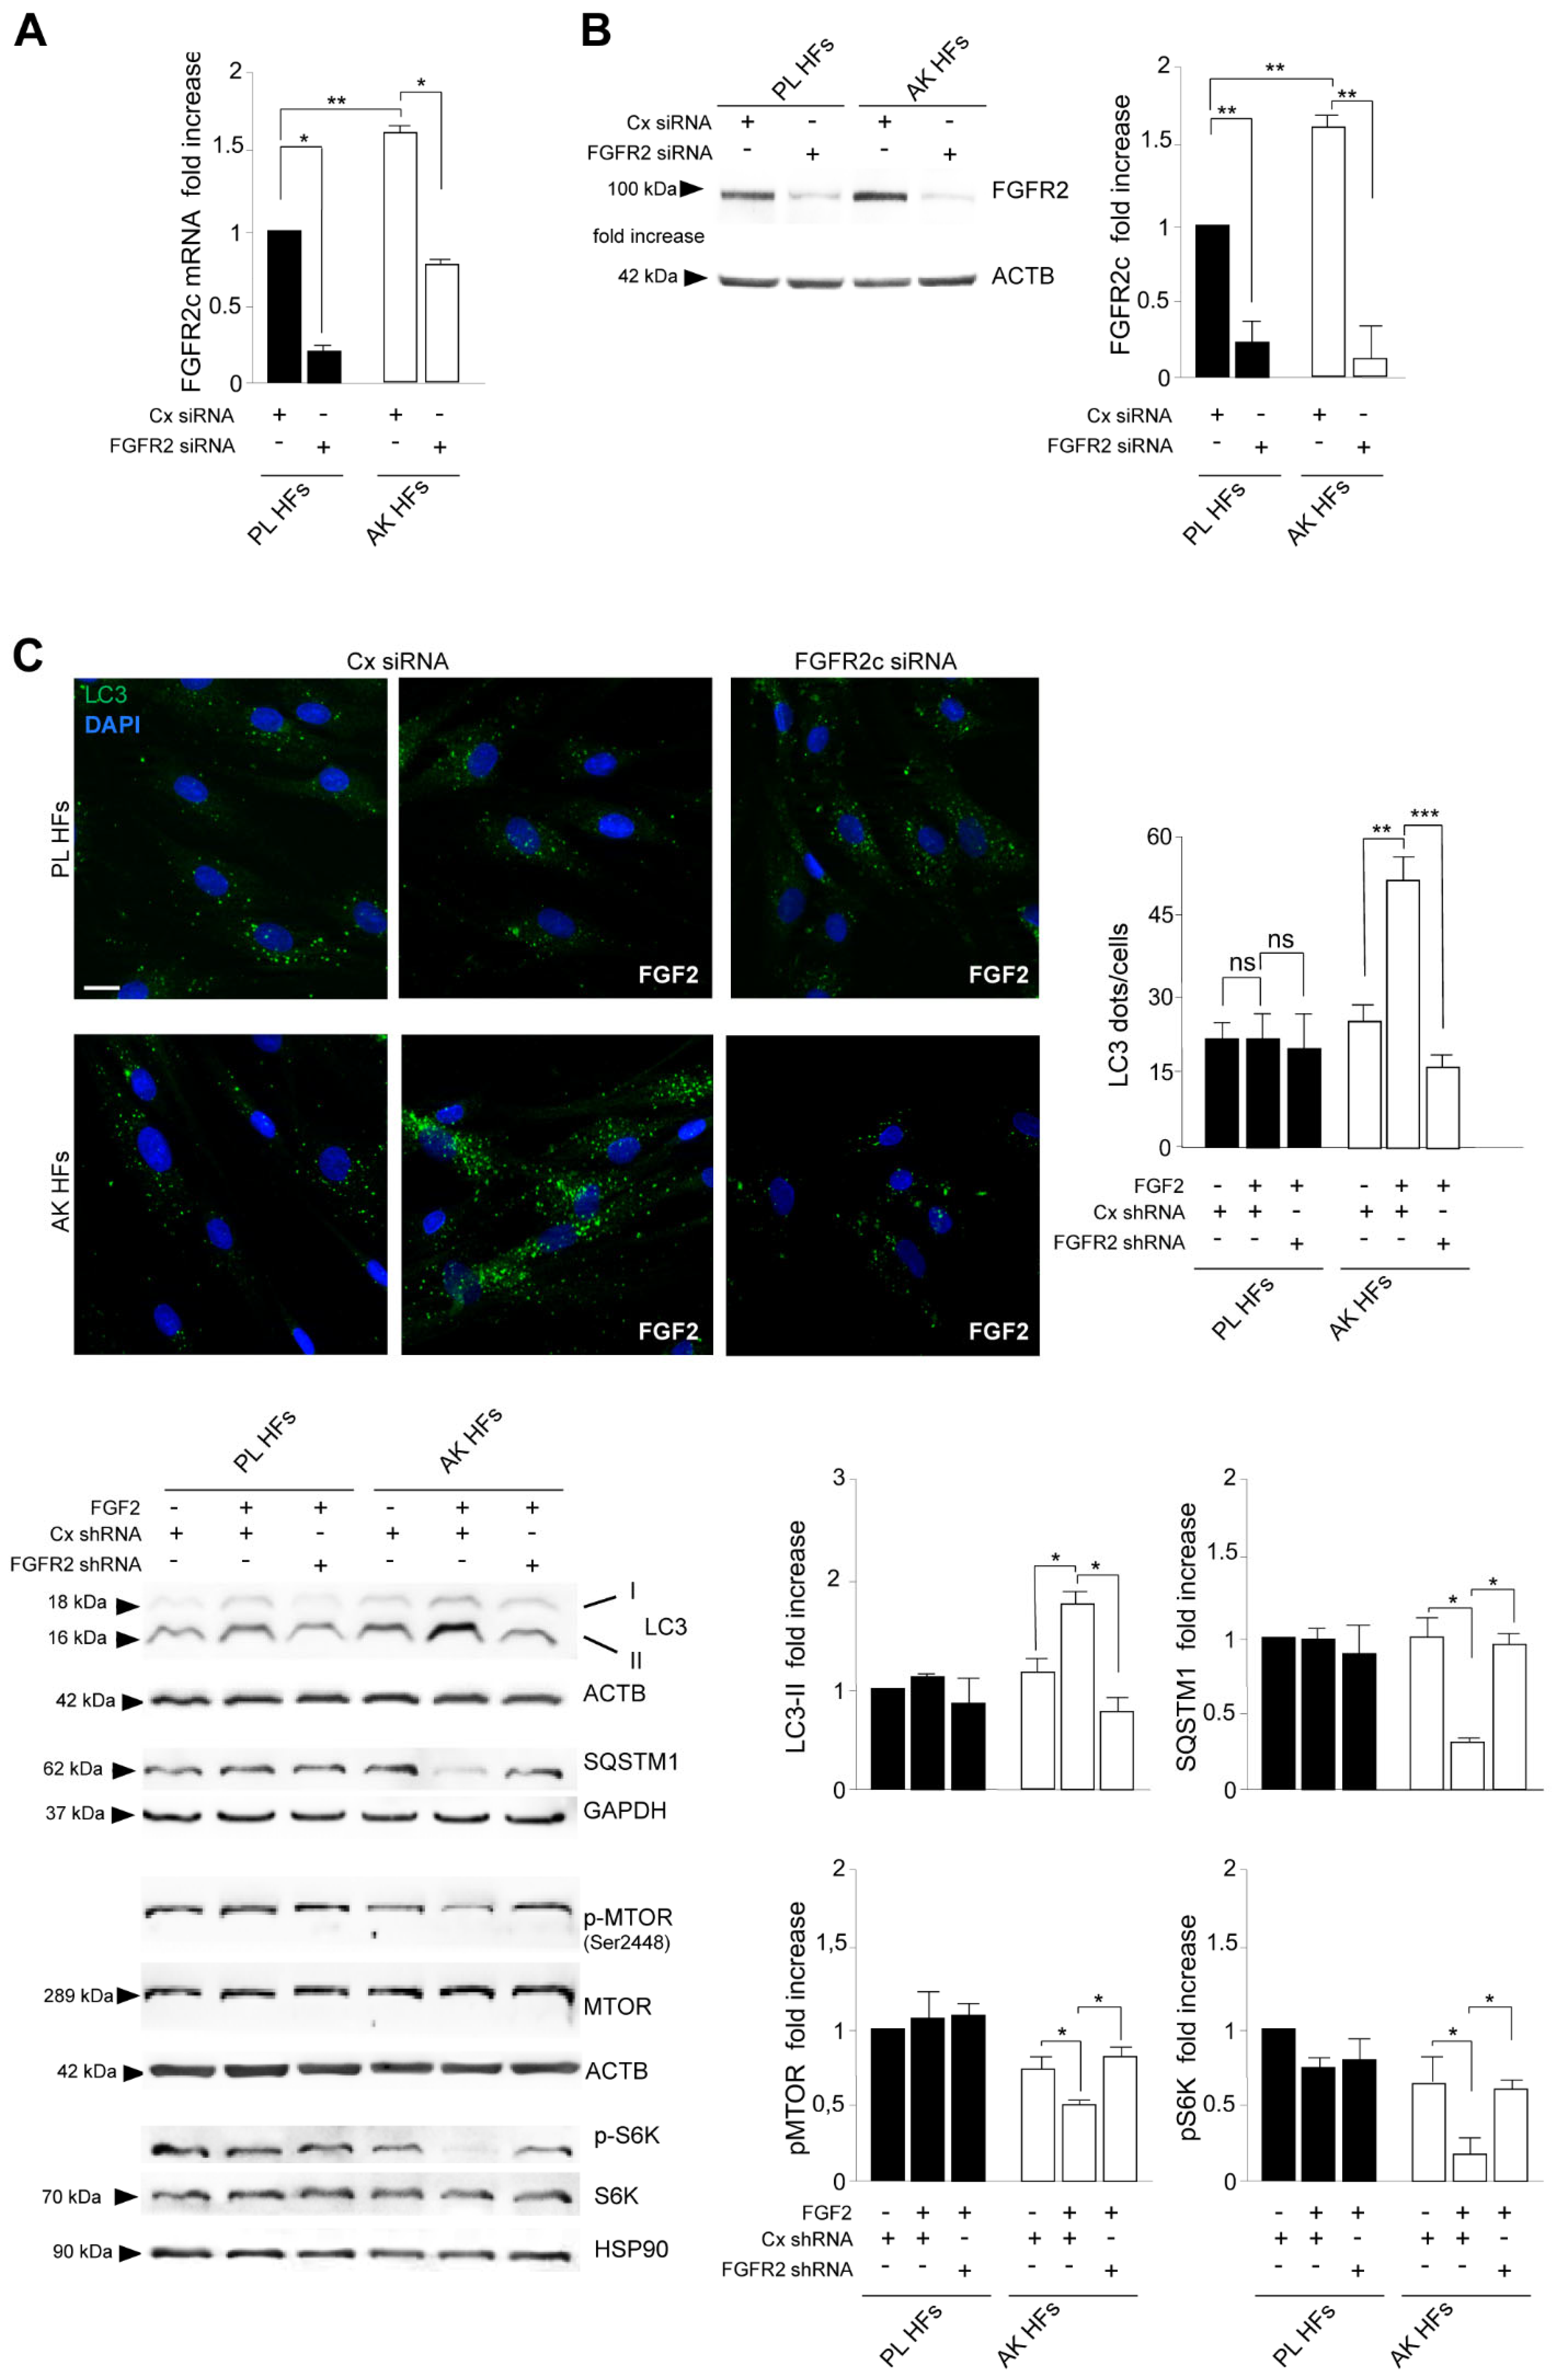
3.2. The Increased Expression of FGFR2c Contributes to the Enhancement of the Autophagic Process and CAF Gene Induction in KIN I-Derived Fibroblasts
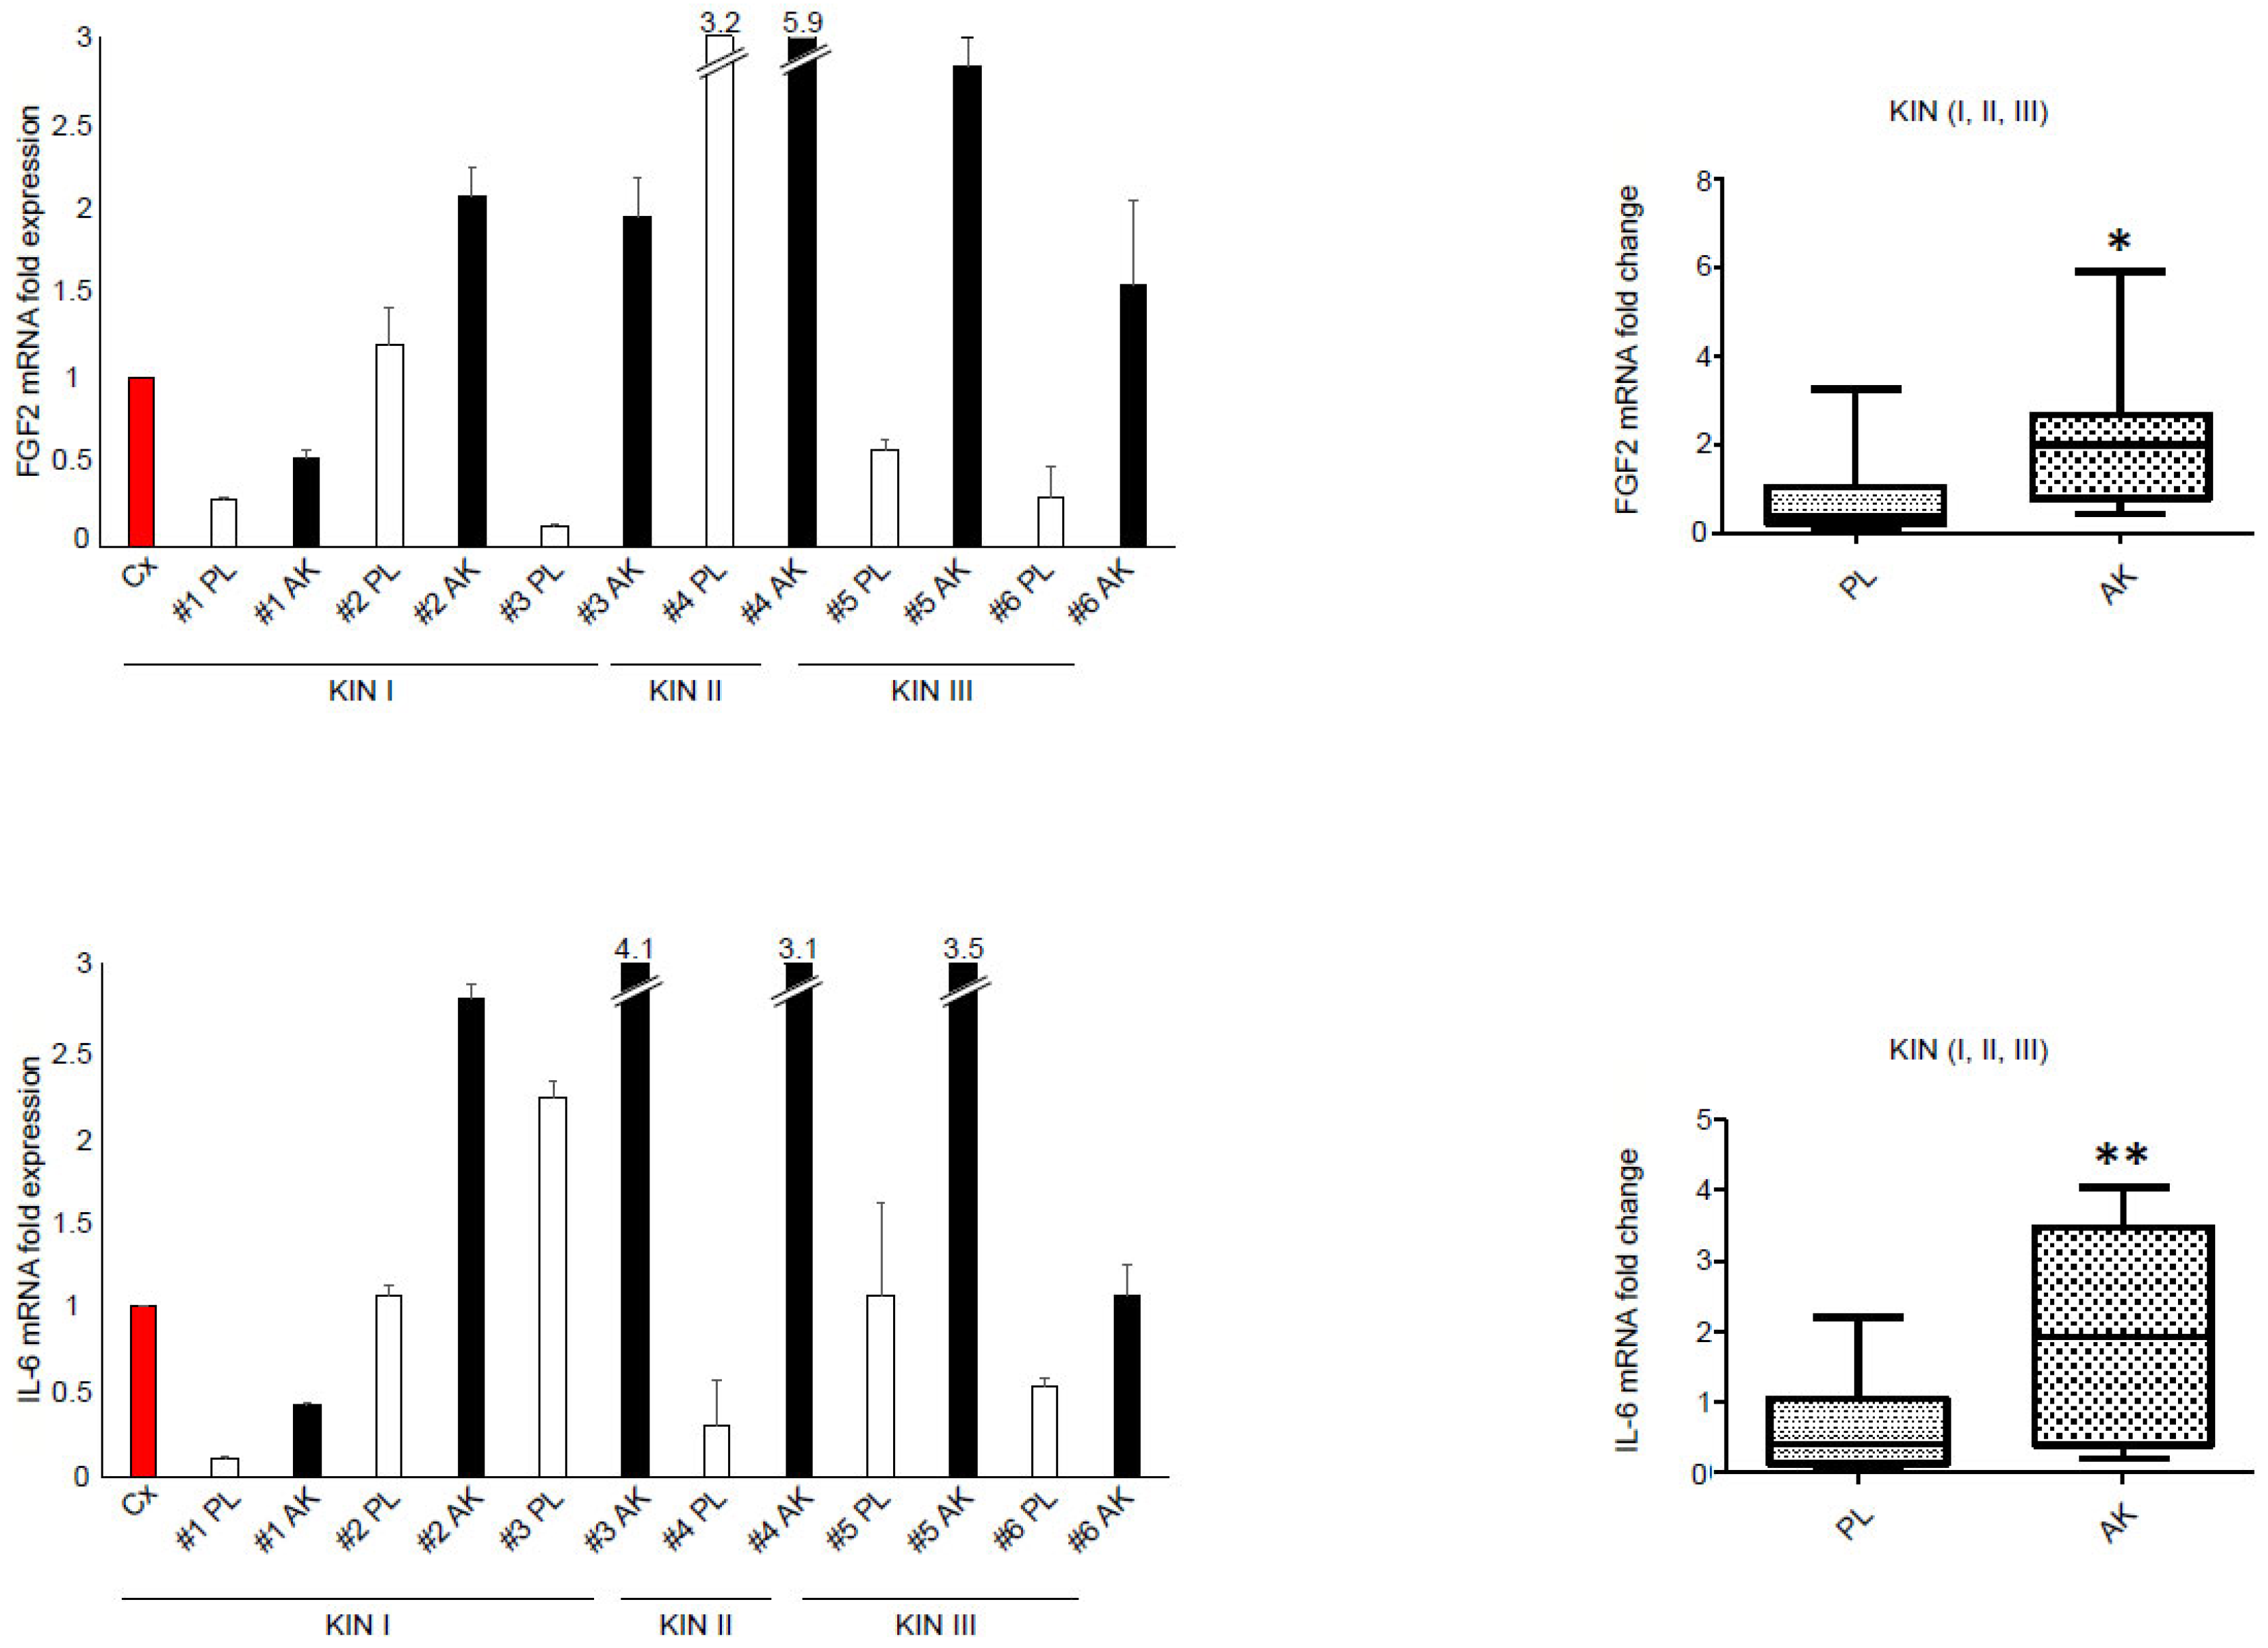
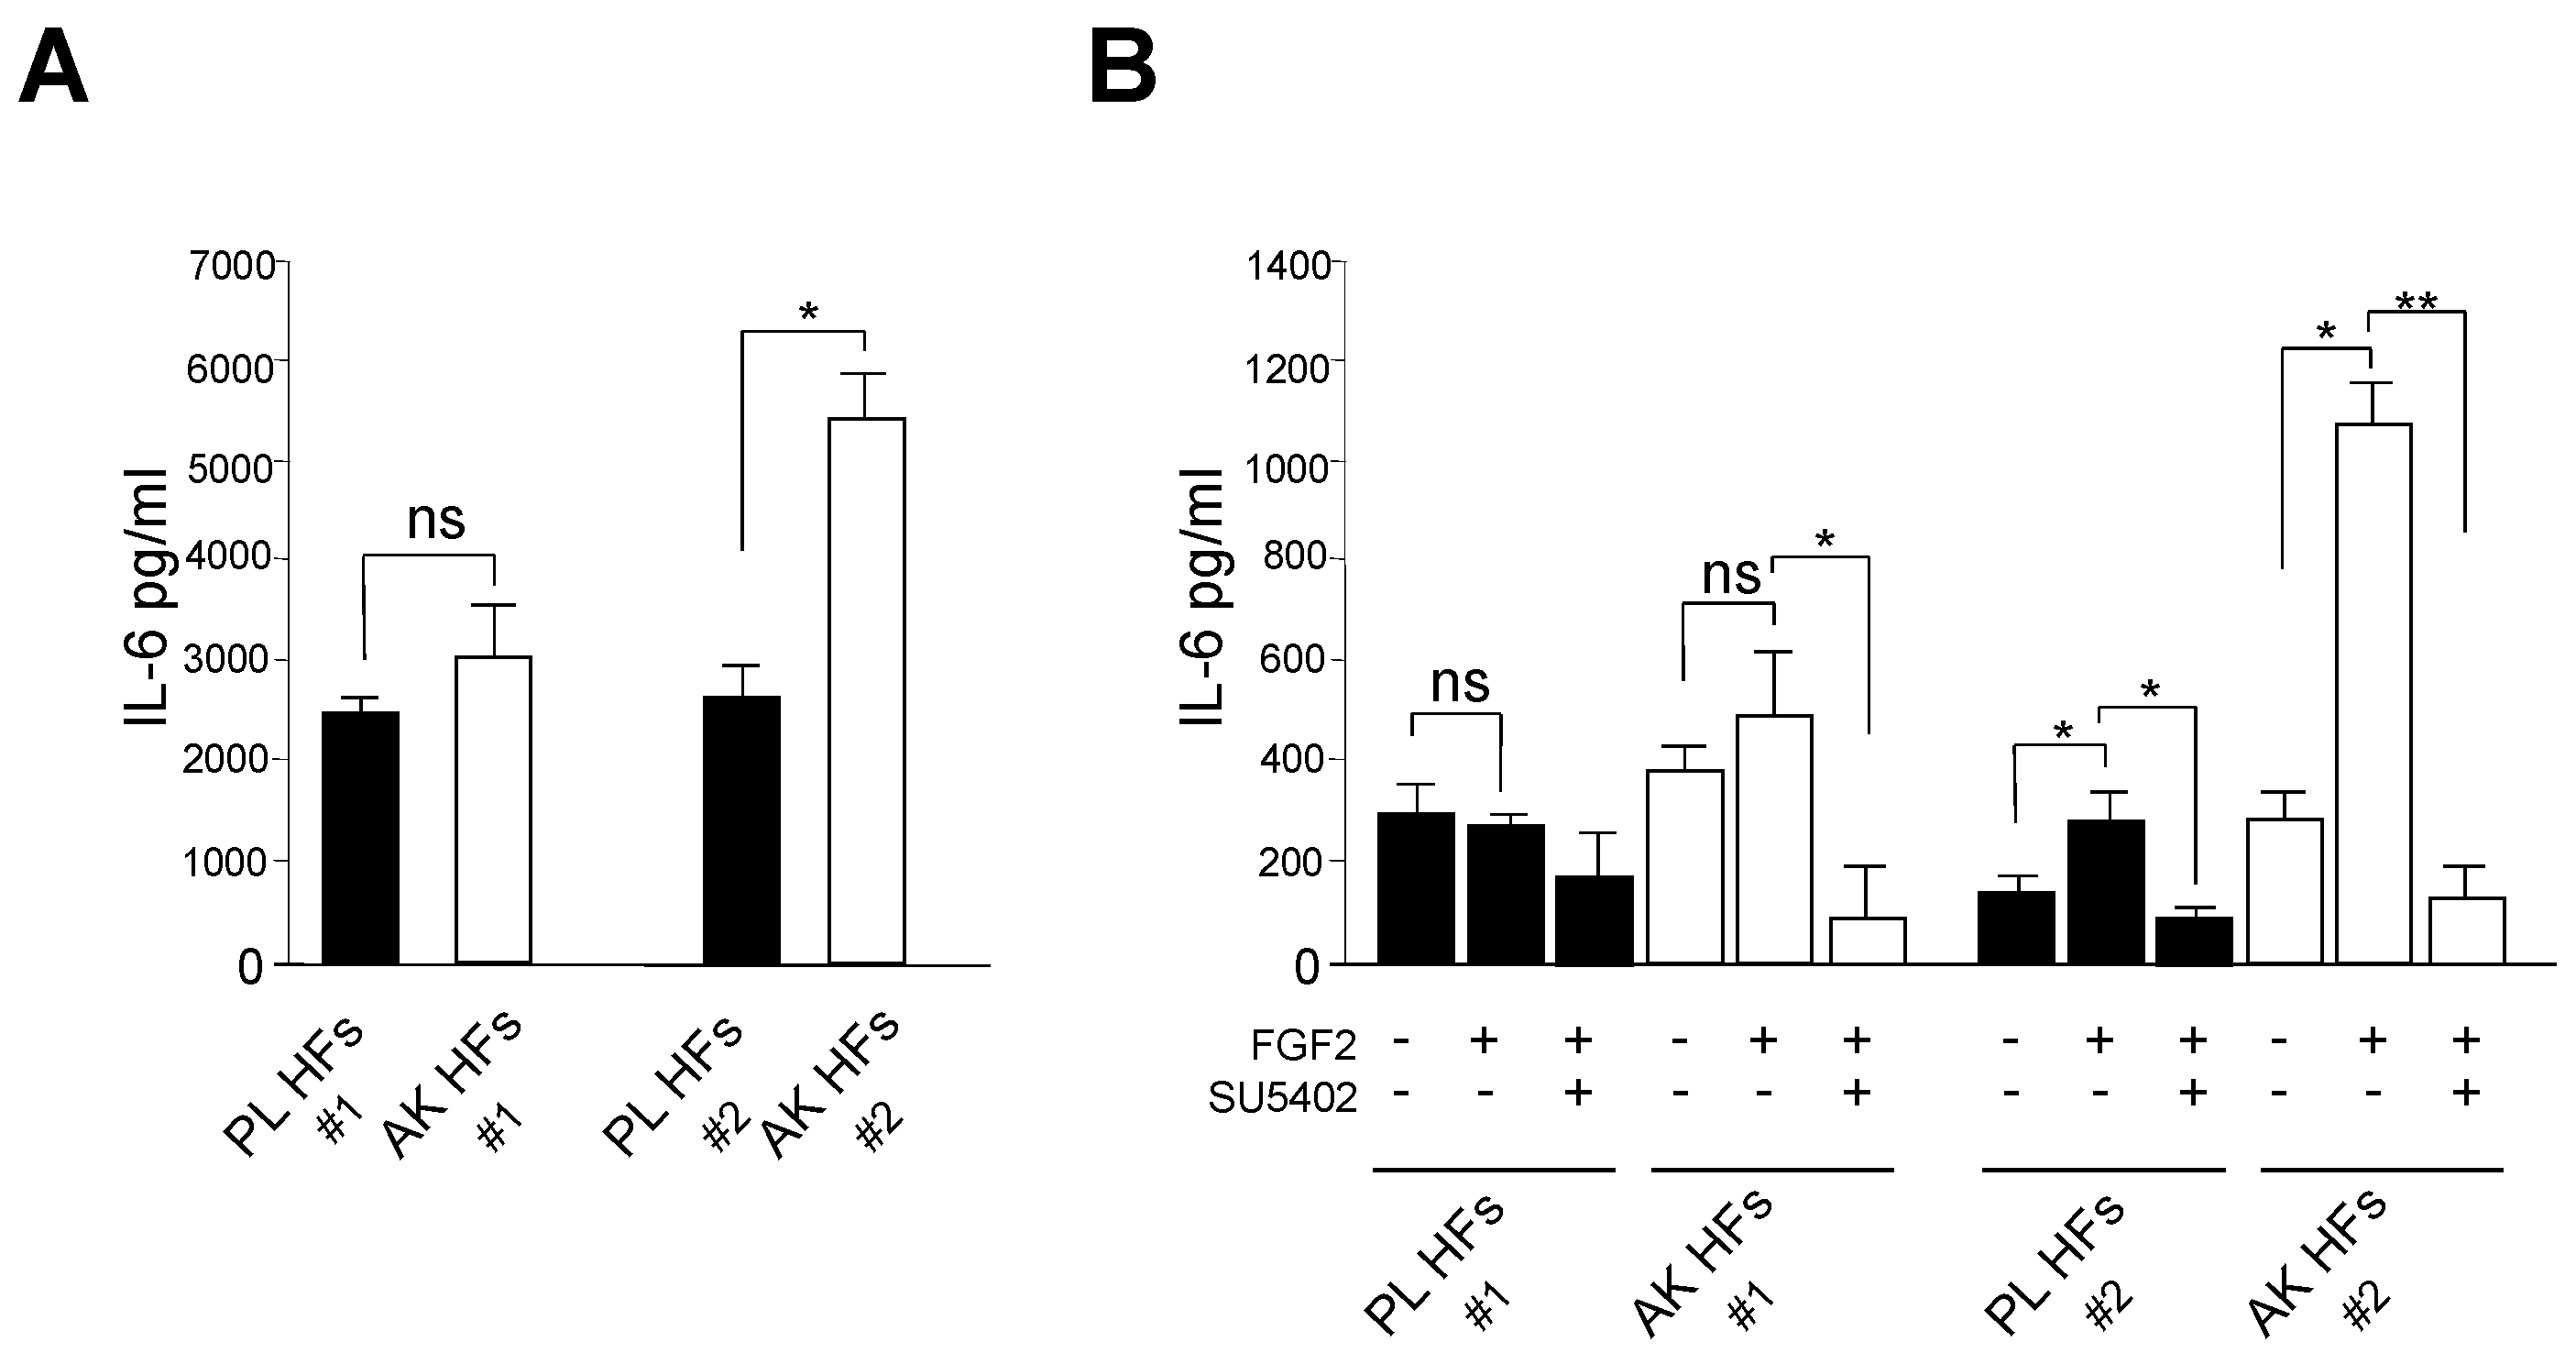
3.3. The Enhancement of IL-6 Secretion in KIN I-Derived Fibroblasts Can by Ascribed to FGFR2c High Expression and Signaling
4. Discussion
Supplementary Materials
Author Contributions
Funding
Institutional Review Board Statement
Informed Consent Statement
Data Availability Statement
Conflicts of Interest
References
- Röwert-Hubert, J.; Patel, M.J.; Forschner, T.; Ulrich, C.; Eberle, J.; Kerl, H.; Sterry, W.; Stockfleth, E. Actinic keratosis is an early in situ squamous cell carcinoma: A proposal for reclassification. Br. J. Derm. 2007, 156, 8–12. [Google Scholar] [CrossRef]
- Siegel, J.A.; Korgavkar, K.; Weinstock, M.A. Current perspective on actinic keratosis: A review. Br. J. Derm. 2017, 177, 350–358. [Google Scholar] [CrossRef] [PubMed]
- Cockerell, C.J. Histopathology of incipient intraepidermal squamous cell carcinoma (“actinic keratosis”). J. Am. Acad. Derm. 2000, 42, 11–17. [Google Scholar] [CrossRef] [PubMed]
- Pellacani, G.; Ulrich, M.; Casari, A.; Prow, T.W.; Cannillo, F.; Benati, E.; Losi, A.; Cesinaro, A.M.; Longo, C.; Argenziano, G.; et al. Grading keratinocyte atypia in actinic keratosis: A correlation of reflectance confocal microscopy and histopathology. J. Eur. Acad. Derm. Venereol. 2015, 29, 2216–2221. [Google Scholar] [CrossRef] [PubMed]
- Figueras, M.T.F. From actinic keratosis to squamous cell carcinoma: Pathophysiology revisited. J. Eur. Acad. Dermatol. Venereol. 2017, 31, 5–7. [Google Scholar] [CrossRef] [PubMed] [Green Version]
- Saenz-Sardà, X.; Carrato, C.; Pérez-Roca, L.; Puig, L.; Ferrándiz, C.; Ariza, A.; Fernández-Figueras, M.T. Epithelial-to-mesenchymal transition contributes to invasion in squamous cell carcinomas originated from actinic keratosis through the differentiated pathway, whereas proliferation plays a more significant role in the classical pathway. J. Eur. Acad. Derm. Venereol. 2018, 32, 581–586. [Google Scholar] [CrossRef]
- Cuevas Sánchez, P.; Espinoza, W.; Pérez, C.; Angulo, J.; Giménez-Gallego, G. Topical treatment of actinic keratoses with potassium dobesilate 5% cream. a preliminary open-label study. Eur. J. Med. Res. 2011, 16, 67–70. [Google Scholar] [CrossRef] [PubMed] [Green Version]
- Procopio, M.G.; Laszlo, C.; Al Labban, D.; Kim, D.E.; Bordignon, P.; Jo, S.H.; Goruppi, S.; Menietti, E.; Ostano, P.; Ala, U.; et al. Combined CSL and p53 downregulation promotes cancer-associated fibroblast activation. Nat. Cell Biol. 2015, 17, 1193–1204. [Google Scholar] [CrossRef] [Green Version]
- De Oliveira, E.C.V.; Da Motta, V.R.V.; Pantoja, P.C.; Ilha, C.S.O.; Magalhães, R.F.; Galadari, H.; Leonardi, G.R. Actinic keratosis—Review for clinical practice. Int. J. Dermatol. 2019, 58, 400–407. [Google Scholar] [CrossRef]
- Belleudi, F.; Leone, L.; Aimati, L.; Stirparo, M.G.; Cardinali, G.; Marchese, C.; Frati, L.; Picardo, M.; Torrisi, M.R. Endocytic pathways and biological effects induced by UVB-dependent or ligand-dependent activation of the keratinocyte growth factor receptor. FASEB J. 2006, 20, 395–397. [Google Scholar] [CrossRef]
- Lotti, L.V.; Rotolo, S.; Francescangeli, F.; Frati, L.; Torrisi, M.R.; Marchese, C. AKT and MAPK signaling in KGF-treated and UVB-exposed human epidermal cells. J. Cell Physiol. 2007, 212, 633–642. [Google Scholar] [CrossRef]
- Ranieri, D.; Rosato, B.; Nanni, M.; Belleudi, F.; Torrisi, M.R. Expression of the FGFR2c mesenchymal splicing variant in human keratinocytes inhibits differentiation and promotes invasion. Mol. Carcinog. 2018, 57, 272–283. [Google Scholar] [CrossRef] [PubMed] [Green Version]
- Ranieri, D.; Belleudi, F.; Magenta, A.; Torrisi, M.R. HPV16 E5 expression induces switching from FGFR2b to FGFR2c and epithelial-mesenchymal transition. Int. J. Cancer 2015, 137, 61–72. [Google Scholar] [CrossRef] [PubMed] [Green Version]
- Ranieri, D.; Rosato, B.; Nanni, M.; Magenta, A.; Belleudi, F.; Torrisi, M.R. Expression of the FGFR2 mesenchymal splicing variant in epithelial cells drives epithelial-mesenchymal transition. Oncotarget 2016, 7, 5440–5460. [Google Scholar] [CrossRef] [PubMed] [Green Version]
- Persechino, F.; Ranieri, D.; Guttieri, L.; Nanni, M.; Torrisi, M.R.; Belleudi, F. Expression Profile of Fibroblast Growth Factor Receptors, Keratinocyte Differentiation Markers, and Epithelial Mesenchymal Transition-Related Genes in Actinic Keratosis: A Possible Predictive Factor for Malignant Progression? Biology 2021, 10, 331. [Google Scholar] [CrossRef]
- Hu, B.; Castillo, E.; Harewood, L.; Ostano, P.; Reymond, A.; Dummer, R.; Raffoul, W.; Hoetzenecker, W.; Hofbauer, G.F.; Dotto, G.P. Multifocal epithelial tumors and field cancerization from loss of mesenchymal CSL signaling. Cell 2012, 149, 1207–1220. [Google Scholar] [CrossRef] [Green Version]
- Vanharanta, S.; Massagué, J. Field cancerization: Something new under the sun. Cell 2012, 149, 1179–1181. [Google Scholar] [CrossRef] [Green Version]
- Bordignon, P.; Bottoni, G.; Xu, X.; Popescu, A.S.; Truan, Z.; Guenova, E.; Kofler, L.; Jafari, P.; Ostano, P.; Röcken, M.; et al. Dualism of FGF and TGF-β Signaling in Heterogeneous Cancer-Associated Fibroblast Activation with ETV1 as a Critical Determinant. Cell Rep. 2019, 28, 2358–2372. [Google Scholar] [CrossRef] [Green Version]
- Cangkrama, M.; Wietecha, M.; Mathis, N.; Okumura, R.; Ferrarese, L.; Al-Nuaimi, D.; Antsiferova, M.; Dummer, R.; Innocenti, M.; Werner, S. A paracrine activin A-mDia2 axis promotes squamous carcinogenesis via fibroblast reprogramming. EMBO Mol. Med. 2020, 12, e11466. [Google Scholar] [CrossRef]
- New, J.; Arnold, L.; Ananth, M.; Alvi, S.; Thornton, M.; Werner, L.; Tawfik, O.; Dai, H.; Shnayder, Y.; Kakarala, K.; et al. Secretory Autophagy in Cancer-Associated Fibroblasts Promotes Head and Neck Cancer Progression and Offers a Novel Therapeutic Target. Cancer Res. 2017, 77, 6679–6691. [Google Scholar] [CrossRef] [Green Version]
- Schneider, C.A.; Rasband, W.S.; Eliceiri, K.W. NIH Image to ImageJ: 25 years of image analysis. Nat. Methods 2012, 9, 671–675. [Google Scholar] [CrossRef] [PubMed]
- Ye, J.; Coulouris, G.; Zaretskaya, I.; Cutcutache, I.; Rozen, S.; Madden, T. Primer-BLAST: A tool to design target-specific primers for polymerase chain reaction. BMC Bioinform. 2012, 13, 134. [Google Scholar] [CrossRef] [PubMed] [Green Version]
- Goruppi, S.; Procopio, M.G.; Jo, S.; Clocchiatti, A.; Neel, V.; Dotto, G.P. The ULK3 Kinase Is Critical for Convergent Control of Cancer-Associated Fibroblast Activation by CSL and GLI. Cell Rep. 2017, 20, 2468–2479. [Google Scholar] [CrossRef] [PubMed] [Green Version]
- Goruppi, S.; Jo, S.H.; Laszlo, C.; Clocchiatti, A.; Neel, V.; Dotto, G.P. Autophagy Controls CSL/RBPJκ Stability through a p62/SQSTM1-Dependent Mechanism. Cell Rep. 2018, 24, 3108–3114. [Google Scholar] [CrossRef] [Green Version]
- Chen, Z.; Malhotra, P.S.; Thomas, G.R.; Ondrey, F.G.; Duffey, D.C.; Smith, C.W. Expression of proinflammatory and proangiogenic cytokines in patients with head and neck cancer. Clin. Cancer Res. Off. J. Am. Assoc. Cancer Res. 1999, 5, 1369–1379. [Google Scholar]
- Fletcher, E.V.; Love-Homan, L.; Sobhakumari, A.; Feddersen, C.R.; Koch, A.T.; Goel, A. EGFR inhibition induces proinflammatory cytokines via NOX4 in HNSCC. Mol. Cancer Res. MCR 2013, 11, 1574–1584. [Google Scholar] [CrossRef] [Green Version]
- Nagasaki, T.; Hara, M.; Nakanishi, H.; Takahashi, H.; Sato, M.; Takeyama, H. Interleukin-6 released by colon cancer-associated fibroblasts is critical for tumour angiogenesis: Anti-interleukin-6 receptor antibody suppressed angiogenesis and inhibited tumour–stroma interaction. Br. J. Cancer 2014, 110, 469–478. [Google Scholar] [CrossRef] [Green Version]
- Wang, S.; Xia, P.; Ye, B.; Huang, G.; Liu, J.; Fan, Z. Transient activation of autophagy via Sox2-mediated suppression of mTOR is an important early step in reprogramming to pluripotency. Cell Stem Cell 2013, 13, 617–625. [Google Scholar] [CrossRef] [Green Version]
- Lomas, A.; Leonardi-Bee, J.; Bath-Hextall, F. A systematic review of worldwide incidence of nonmelanoma skin cancer. Br. J. Dermatol. 2012, 166, 1069–1080. [Google Scholar] [CrossRef]
- Rogers, H.W.; Weinstock, M.A.; Feldman, S.R.; Coldiron, B.M. Incidence estimate of nonmelanoma skin cancer (keratinocyte carcinomas) in the U.S. population, 2012. JAMA Dermatol. 2015, 151, 1081–1086. [Google Scholar] [CrossRef]
- Lanz, J.; Bavinck, J.N.B.; Westhuis, M.; Quint, K.D.; Harwood, C.A.; Nasir, S.; Vande-Velde, V.; Proby, C.M.; Ferrandiz, C.; Genders, R.E. Aggressive squamous cell carcinoma in organ transplant recipients. JAMA Dermatol. 2019, 155, 66–71. [Google Scholar] [CrossRef] [PubMed]
- Kalluri, R. The biology and function of fibroblasts in cancer. Nat. Rev. Cancer 2016, 16, 582–598. [Google Scholar] [CrossRef]
- Dotto, G.P. Multifocal epithelial tumors and field cancerization: Stroma as a primary determinant. J. Clin. Investig. 2014, 124, 1446–1453. [Google Scholar] [CrossRef] [PubMed] [Green Version]
- Curtius, K.; Wright, N.A.; Graham, T.A. An evolutionary perspective on field cancerization. Nat. Rev. Cancer 2018, 18, 19–32. [Google Scholar] [CrossRef] [PubMed]
- Sahai, E.; Astsaturov, I.; Cukierman, E.; DeNardo, D.G.; Egeblad, M.; Evans, R.M. A framework for advancing our understanding of cancer-associated fibroblasts. Nat. Rev. Cancer 2020, 20, 174–186. [Google Scholar] [CrossRef] [PubMed] [Green Version]
- Gascard, P.; Tlsty, T.D. Carcinoma-associated fibroblasts: Orchestrating the composition of malignancy. Genes Dev. 2016, 30, 1002–1019. [Google Scholar] [CrossRef] [Green Version]


Disclaimer/Publisher’s Note: The statements, opinions and data contained in all publications are solely those of the individual author(s) and contributor(s) and not of MDPI and/or the editor(s). MDPI and/or the editor(s) disclaim responsibility for any injury to people or property resulting from any ideas, methods, instructions or products referred to in the content. |
© 2023 by the authors. Licensee MDPI, Basel, Switzerland. This article is an open access article distributed under the terms and conditions of the Creative Commons Attribution (CC BY) license (https://creativecommons.org/licenses/by/4.0/).
Share and Cite
Guttieri, L.; Raffa, S.; Salerno, G.; Bigi, R.; Persechino, F.; Visco, V.; Torrisi, M.R.; Ranieri, D.; Belleudi, F. FGFR2c Upregulation Contributes to Cancer-Associated Fibroblast Program Activation and to Enhanced Autophagy in Actinic Keratosis-Derived Dermal Fibroblasts: A Possible Role in Precancerous Cell/Stromal Cell Crosstalk. Biology 2023, 12, 463. https://doi.org/10.3390/biology12030463
Guttieri L, Raffa S, Salerno G, Bigi R, Persechino F, Visco V, Torrisi MR, Ranieri D, Belleudi F. FGFR2c Upregulation Contributes to Cancer-Associated Fibroblast Program Activation and to Enhanced Autophagy in Actinic Keratosis-Derived Dermal Fibroblasts: A Possible Role in Precancerous Cell/Stromal Cell Crosstalk. Biology. 2023; 12(3):463. https://doi.org/10.3390/biology12030463
Chicago/Turabian StyleGuttieri, Luisa, Salvatore Raffa, Gerardo Salerno, Rachele Bigi, Flavia Persechino, Vincenzo Visco, Maria Rosaria Torrisi, Danilo Ranieri, and Francesca Belleudi. 2023. "FGFR2c Upregulation Contributes to Cancer-Associated Fibroblast Program Activation and to Enhanced Autophagy in Actinic Keratosis-Derived Dermal Fibroblasts: A Possible Role in Precancerous Cell/Stromal Cell Crosstalk" Biology 12, no. 3: 463. https://doi.org/10.3390/biology12030463