
Lipidomic Analysis of Liver Lipid Droplets after Chronic Alcohol Consumption with and without Betaine Supplementation
 , , , and
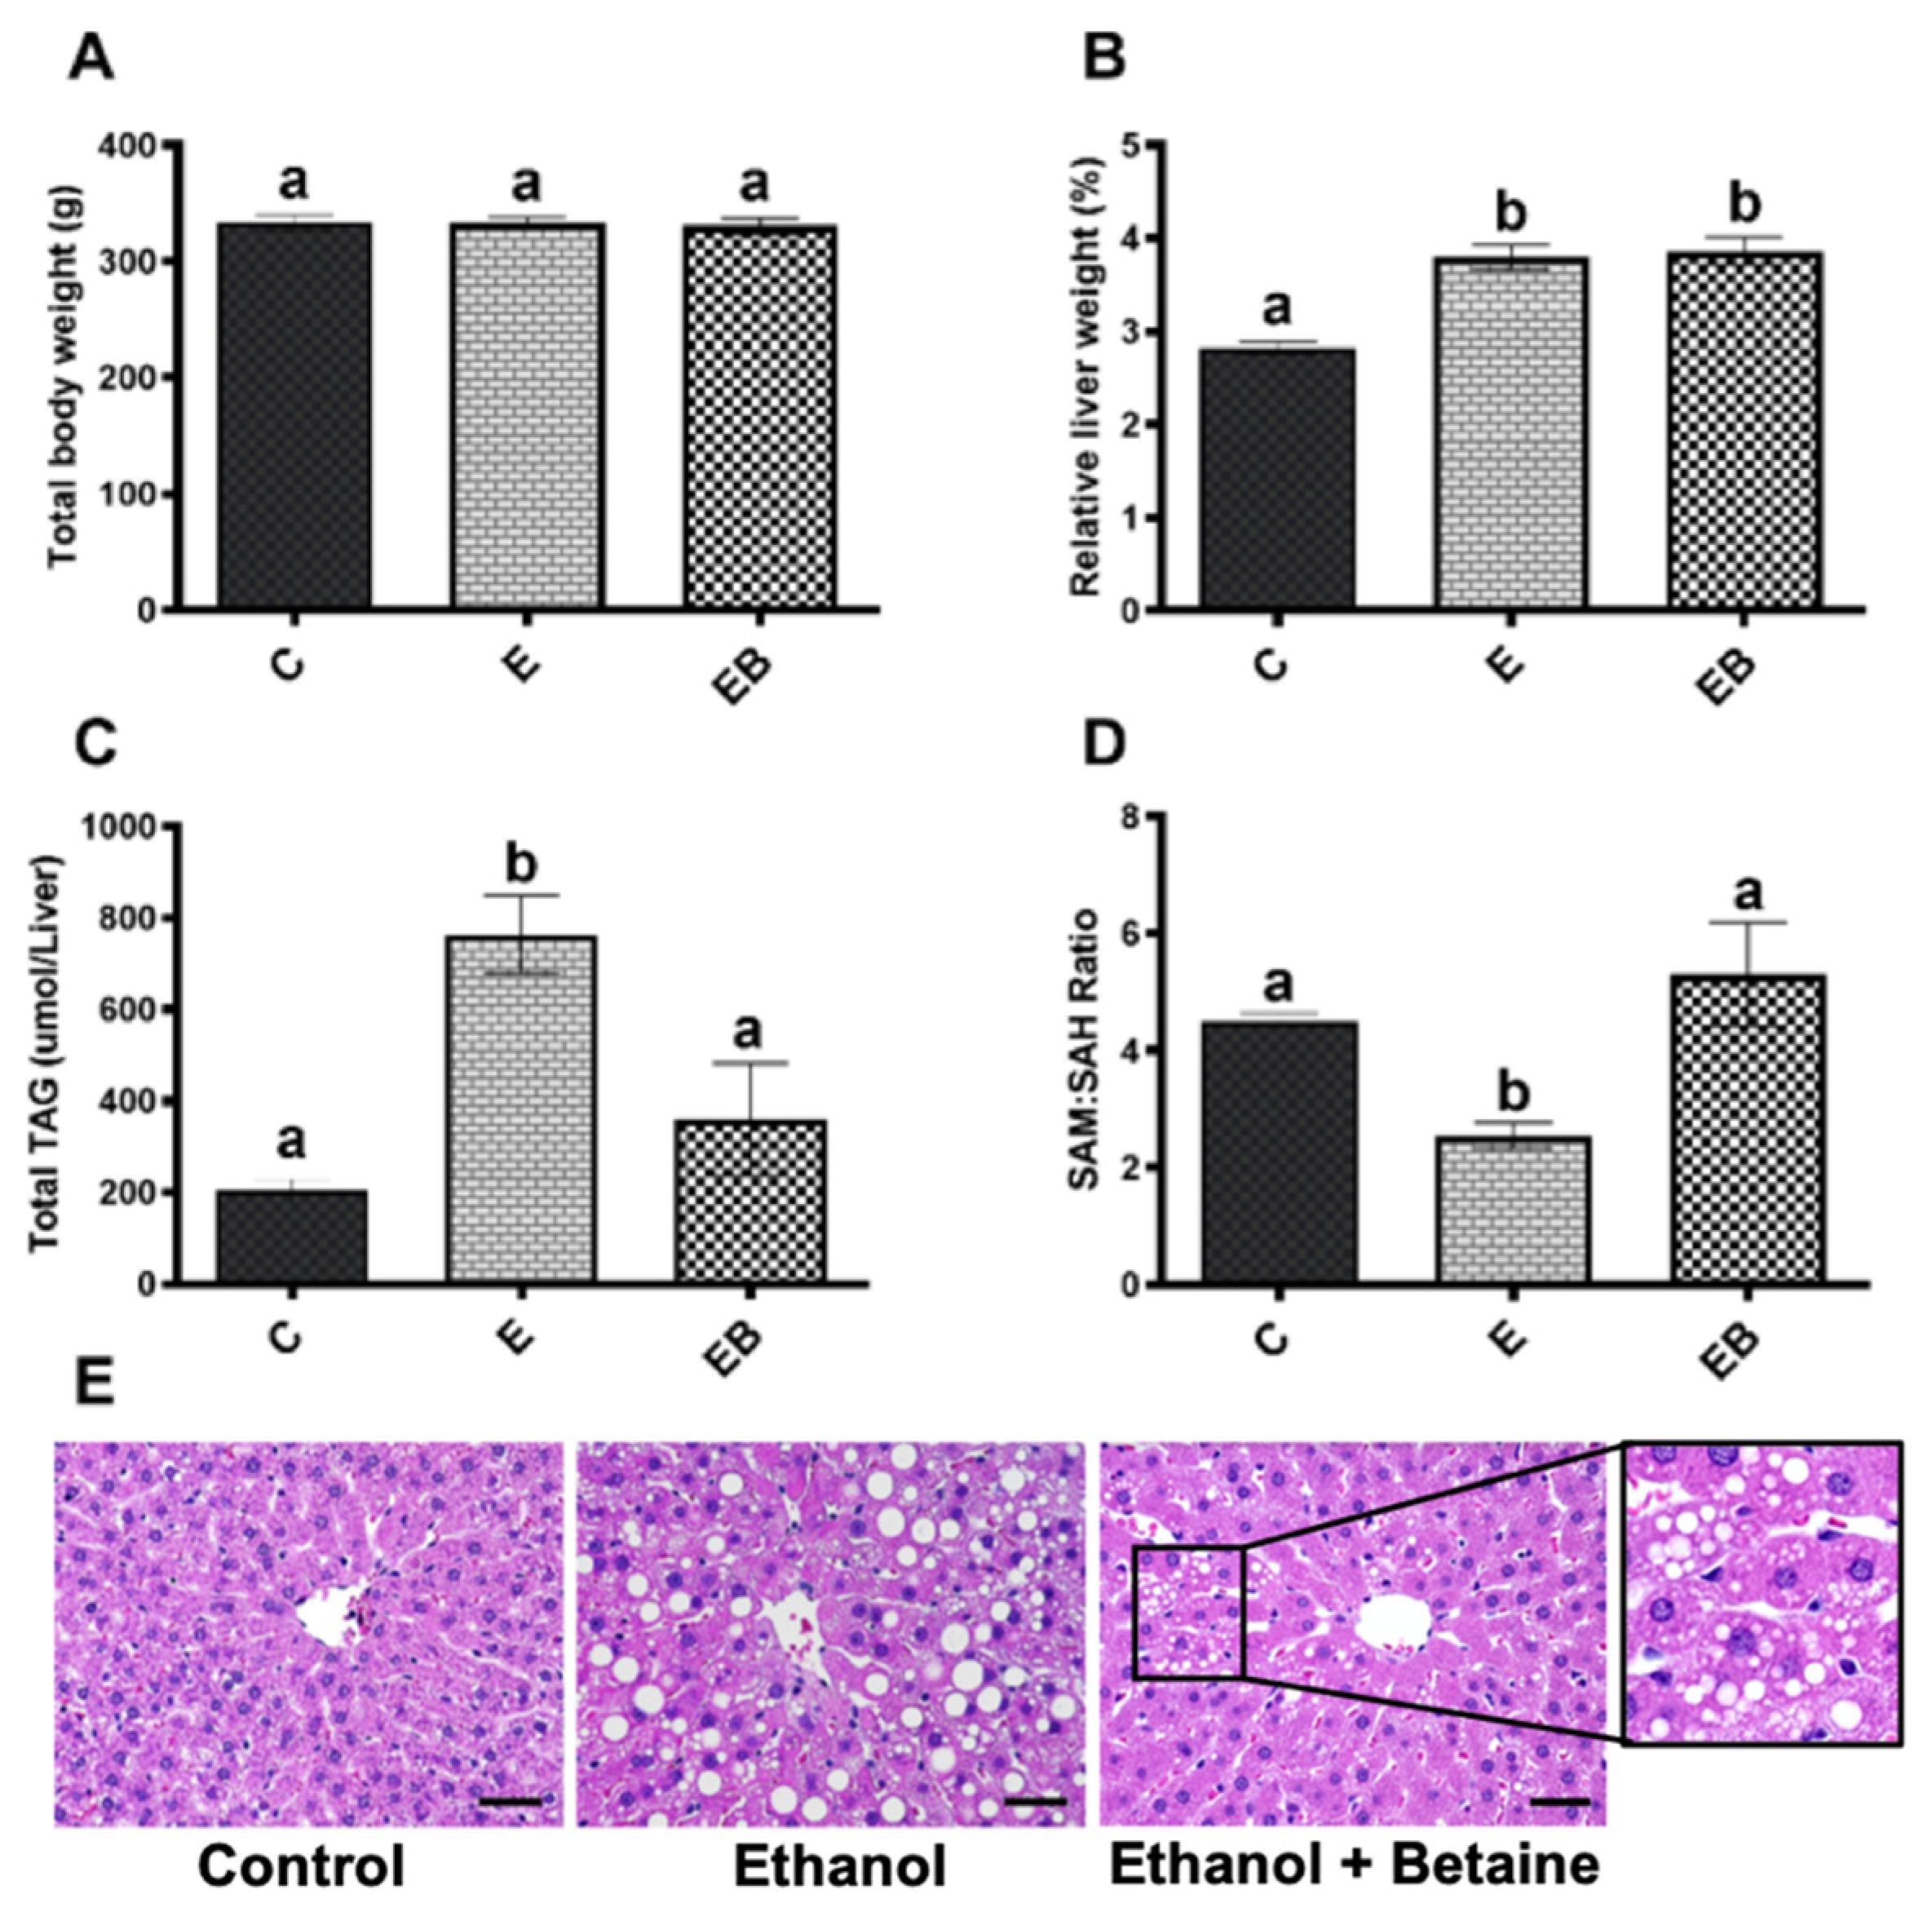
Abstract
:Simple Summary
Abstract
1. Introduction
2. Materials and Methods
2.1. Animal Experiments
2.2. Liver Histology
2.3. Separation and Isolation of Different-Sized LDs
2.4. Lipid Extraction
2.5. BODIPY Staining of LDs
2.6. Mass Spectrometry Analysis
2.7. Statistical Analysis
3. Results
3.1. Body Weights, Liver Weights, and Liver Histology
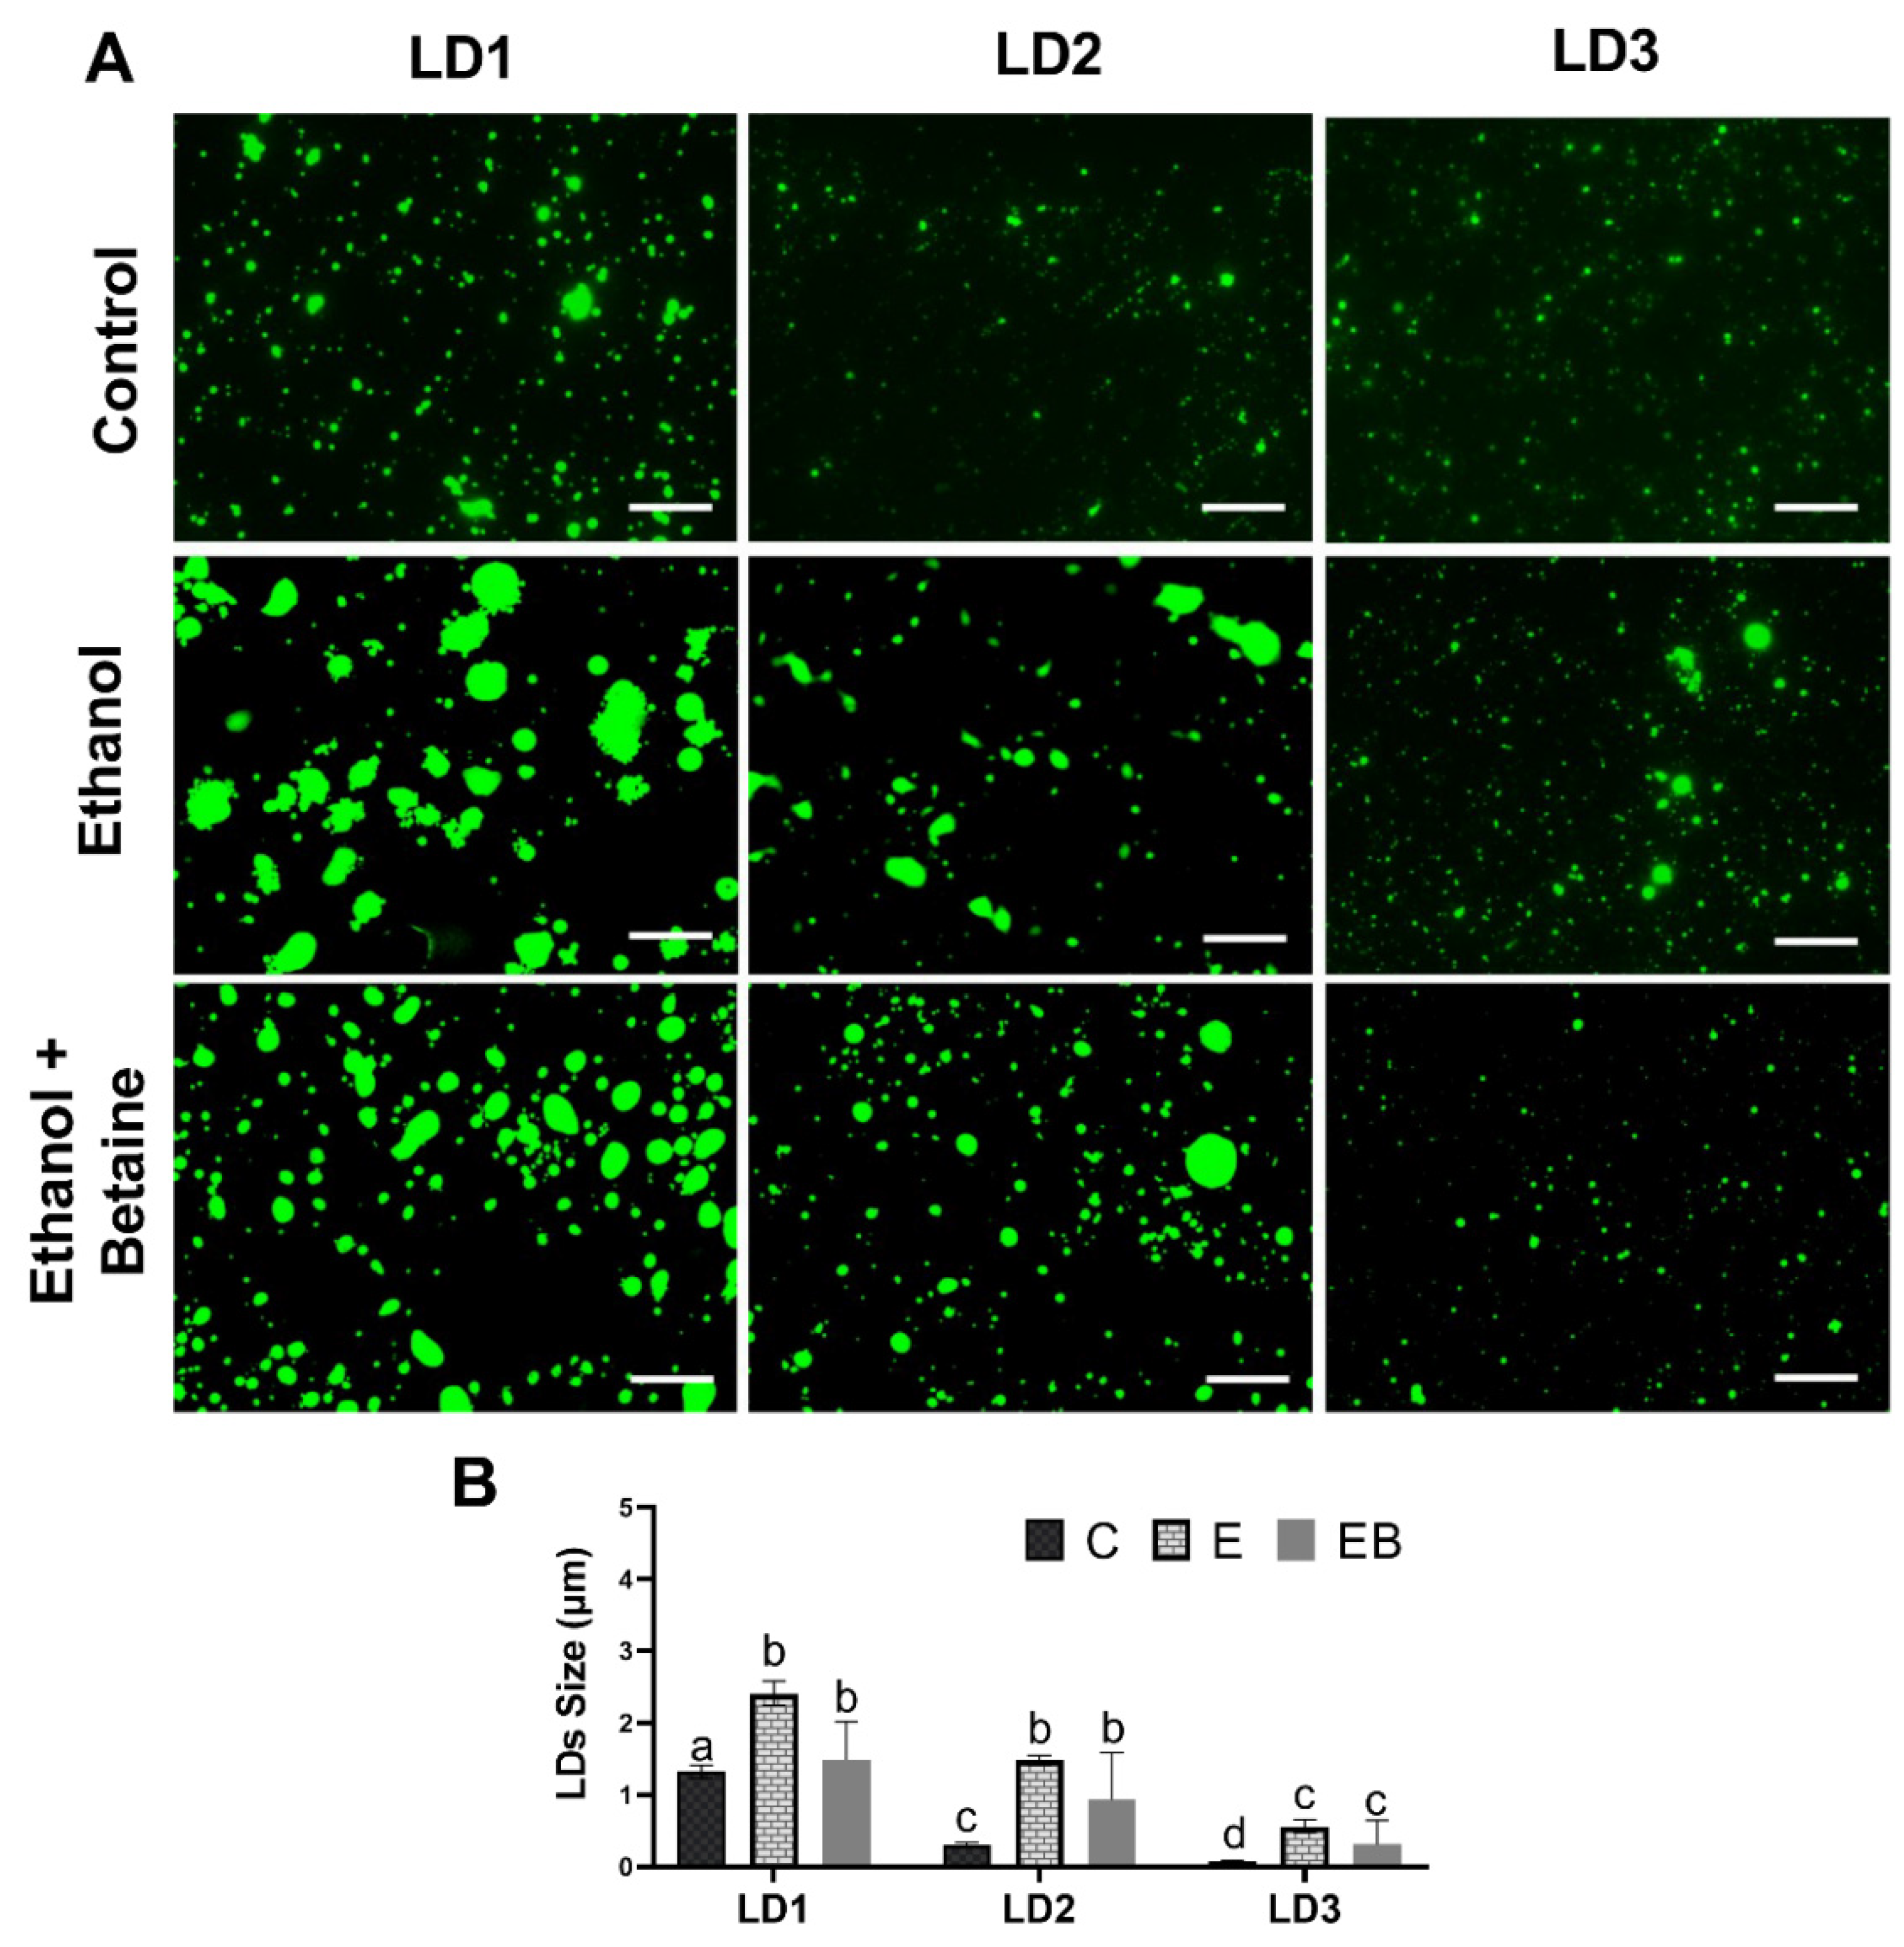
3.2. Effect of Ethanol and Betaine Co-Administration on LD Sizes
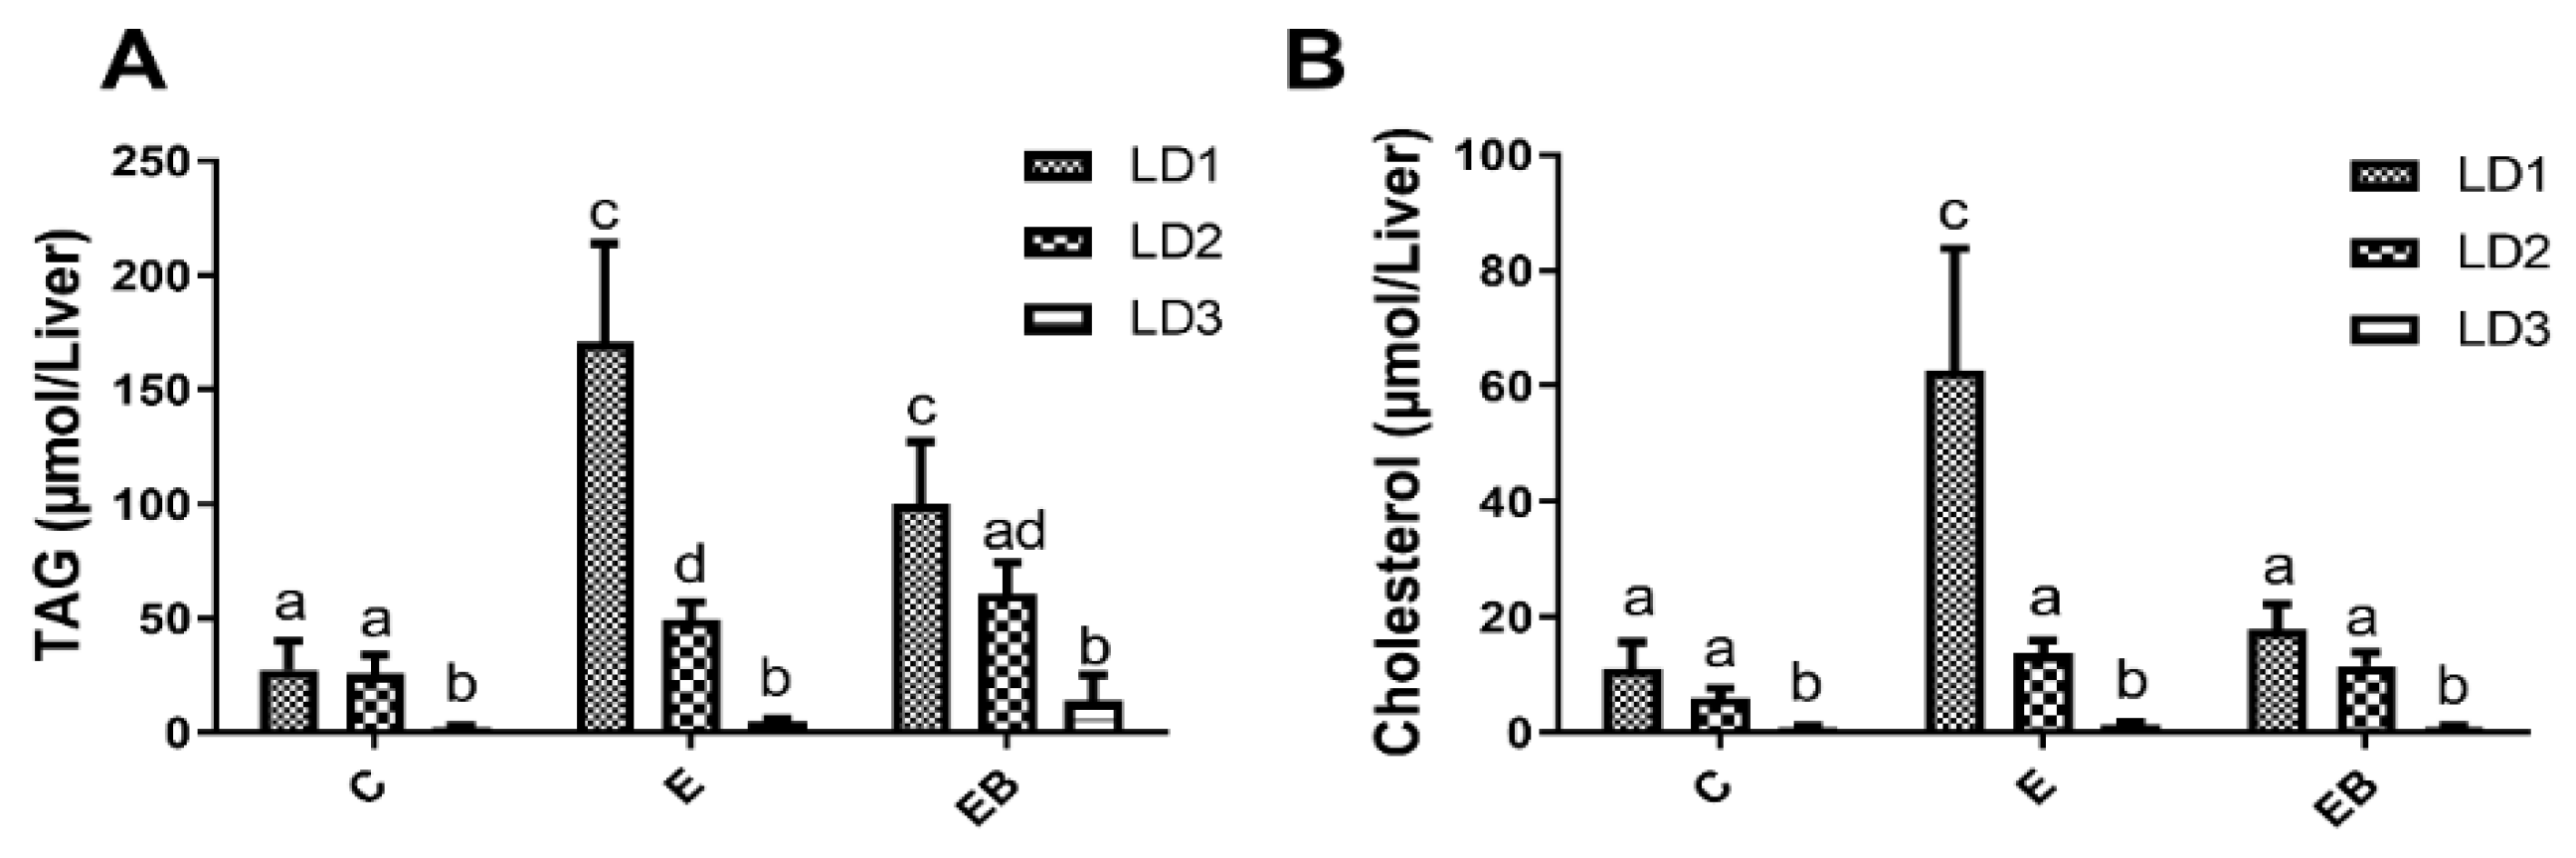
3.3. Effect of Ethanol and Betaine Co-Administration on TAG and Total Cholesterol Levels in LD Fractions
3.4. Lipidomic Analyses of Different Liver LD Fractions
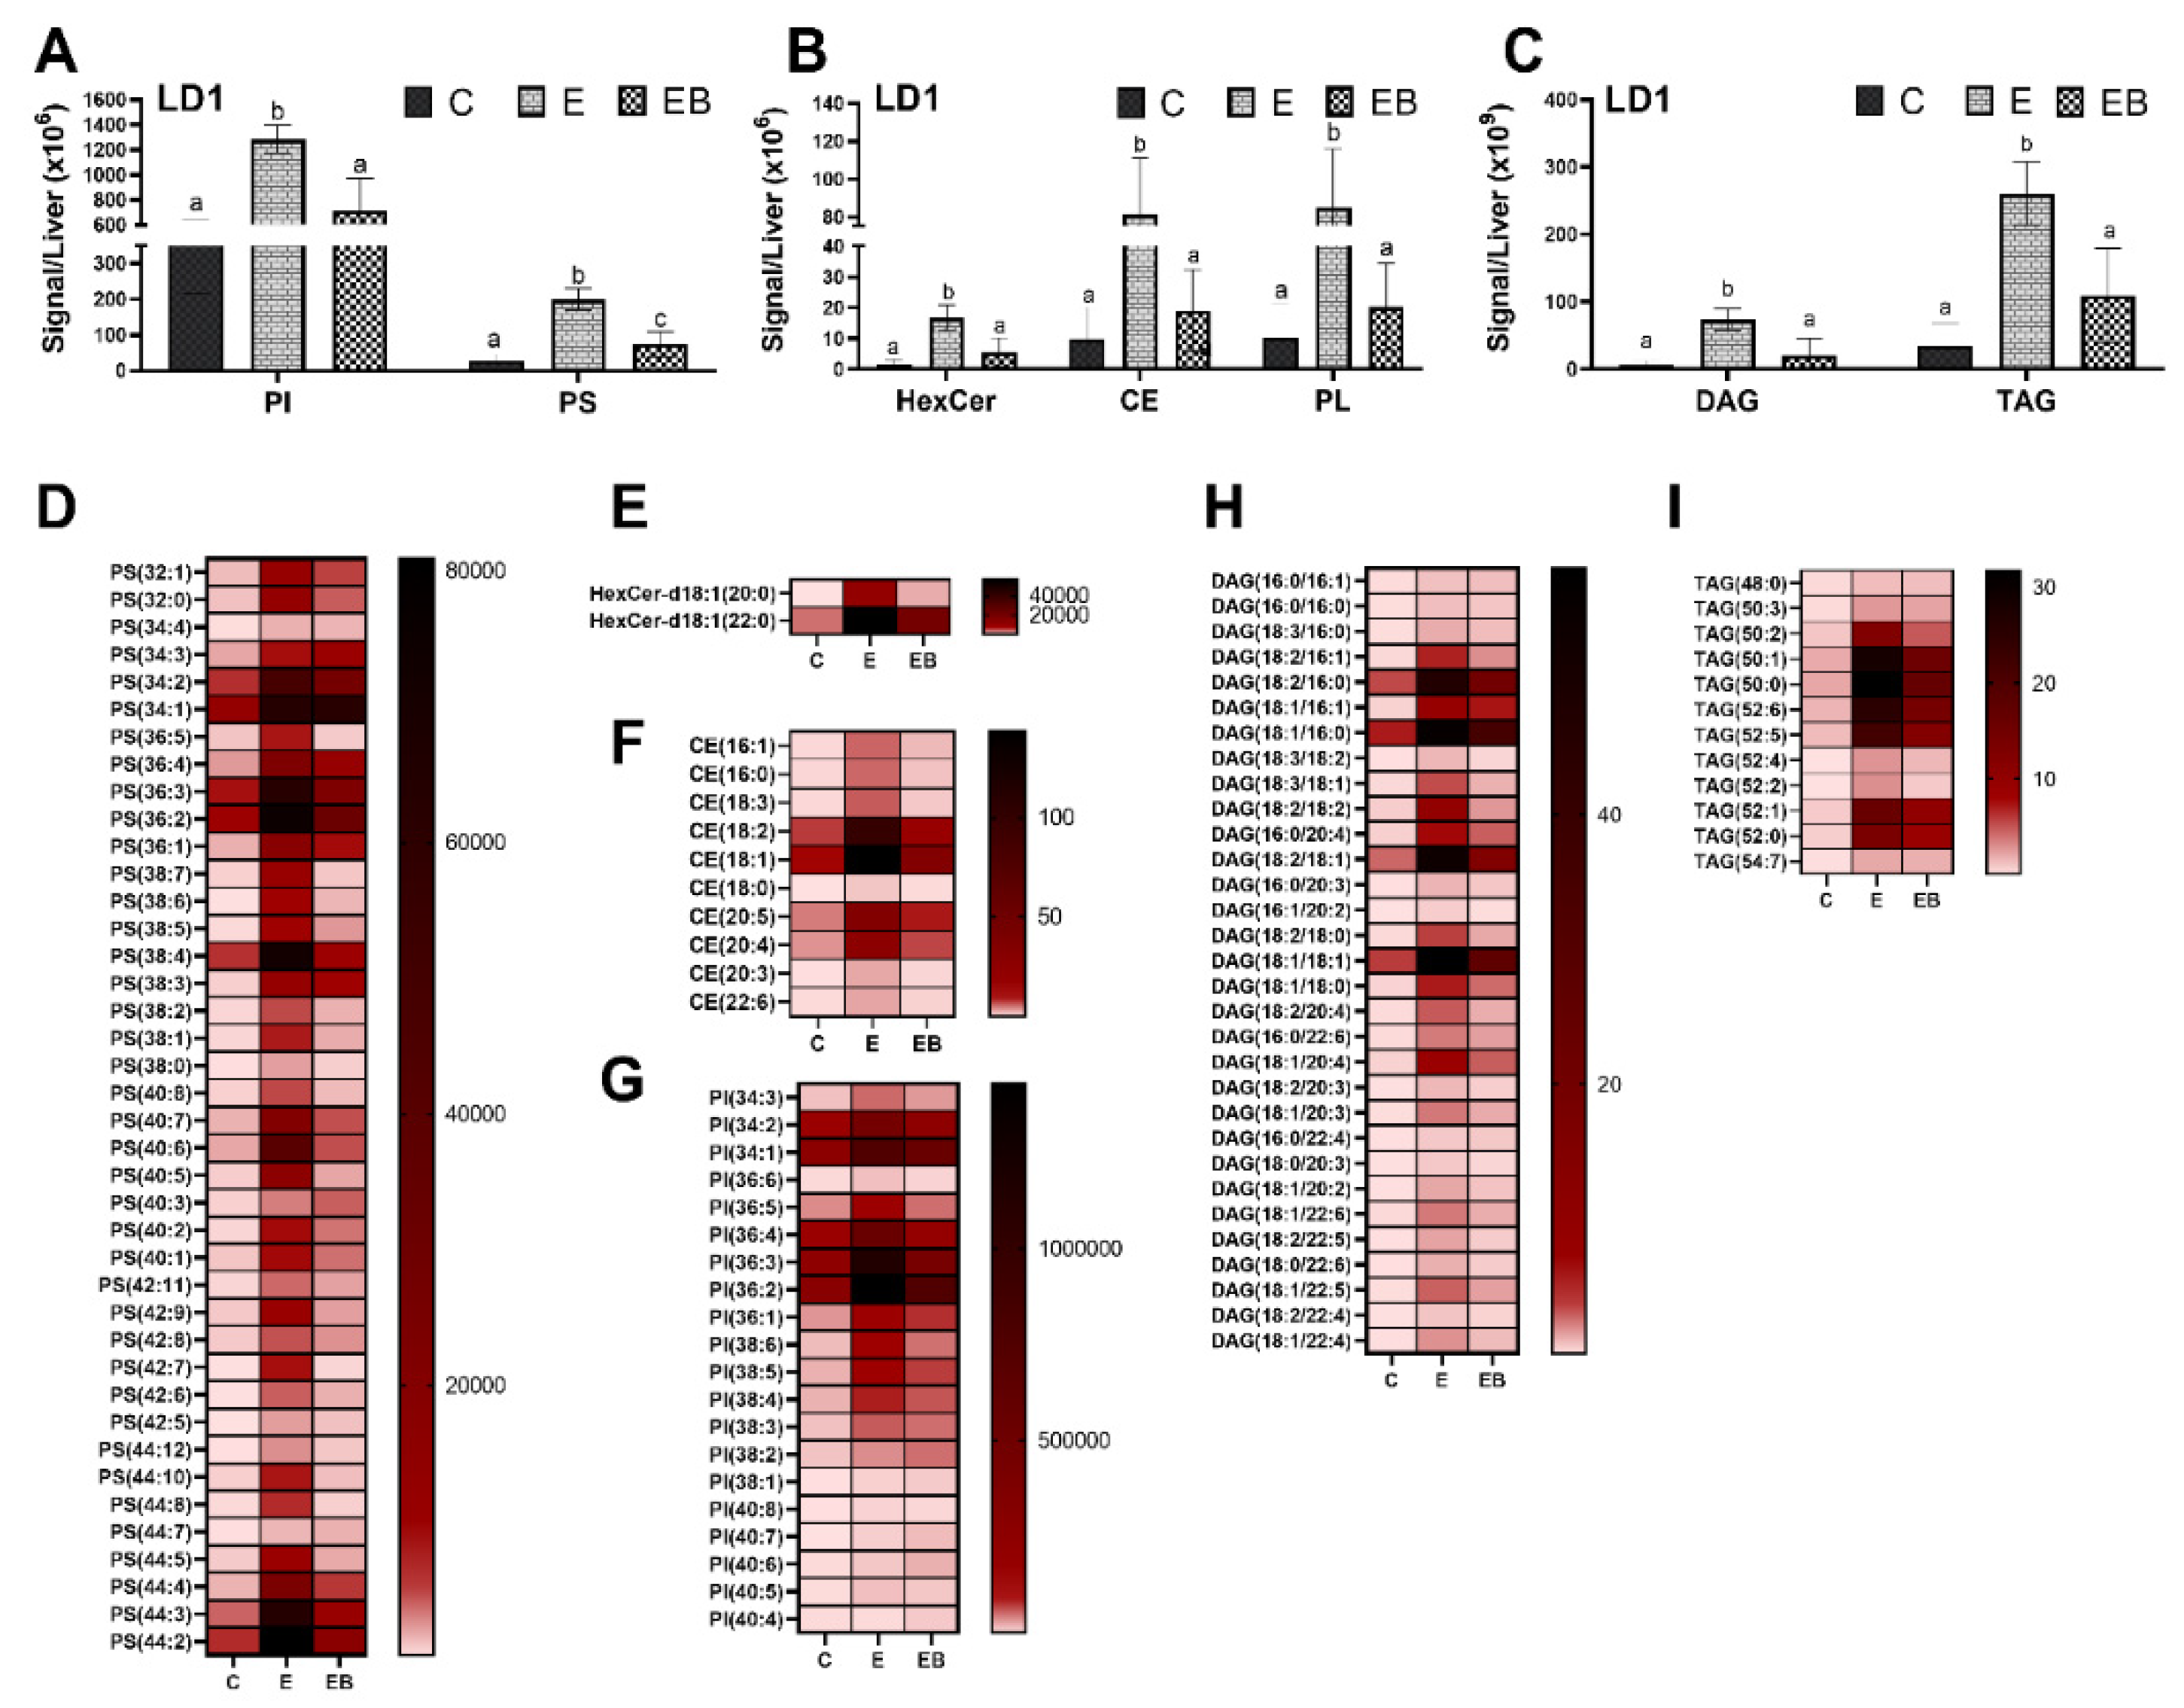
3.4.1. Effect of Ethanol and Betaine Co-Administration on LD1
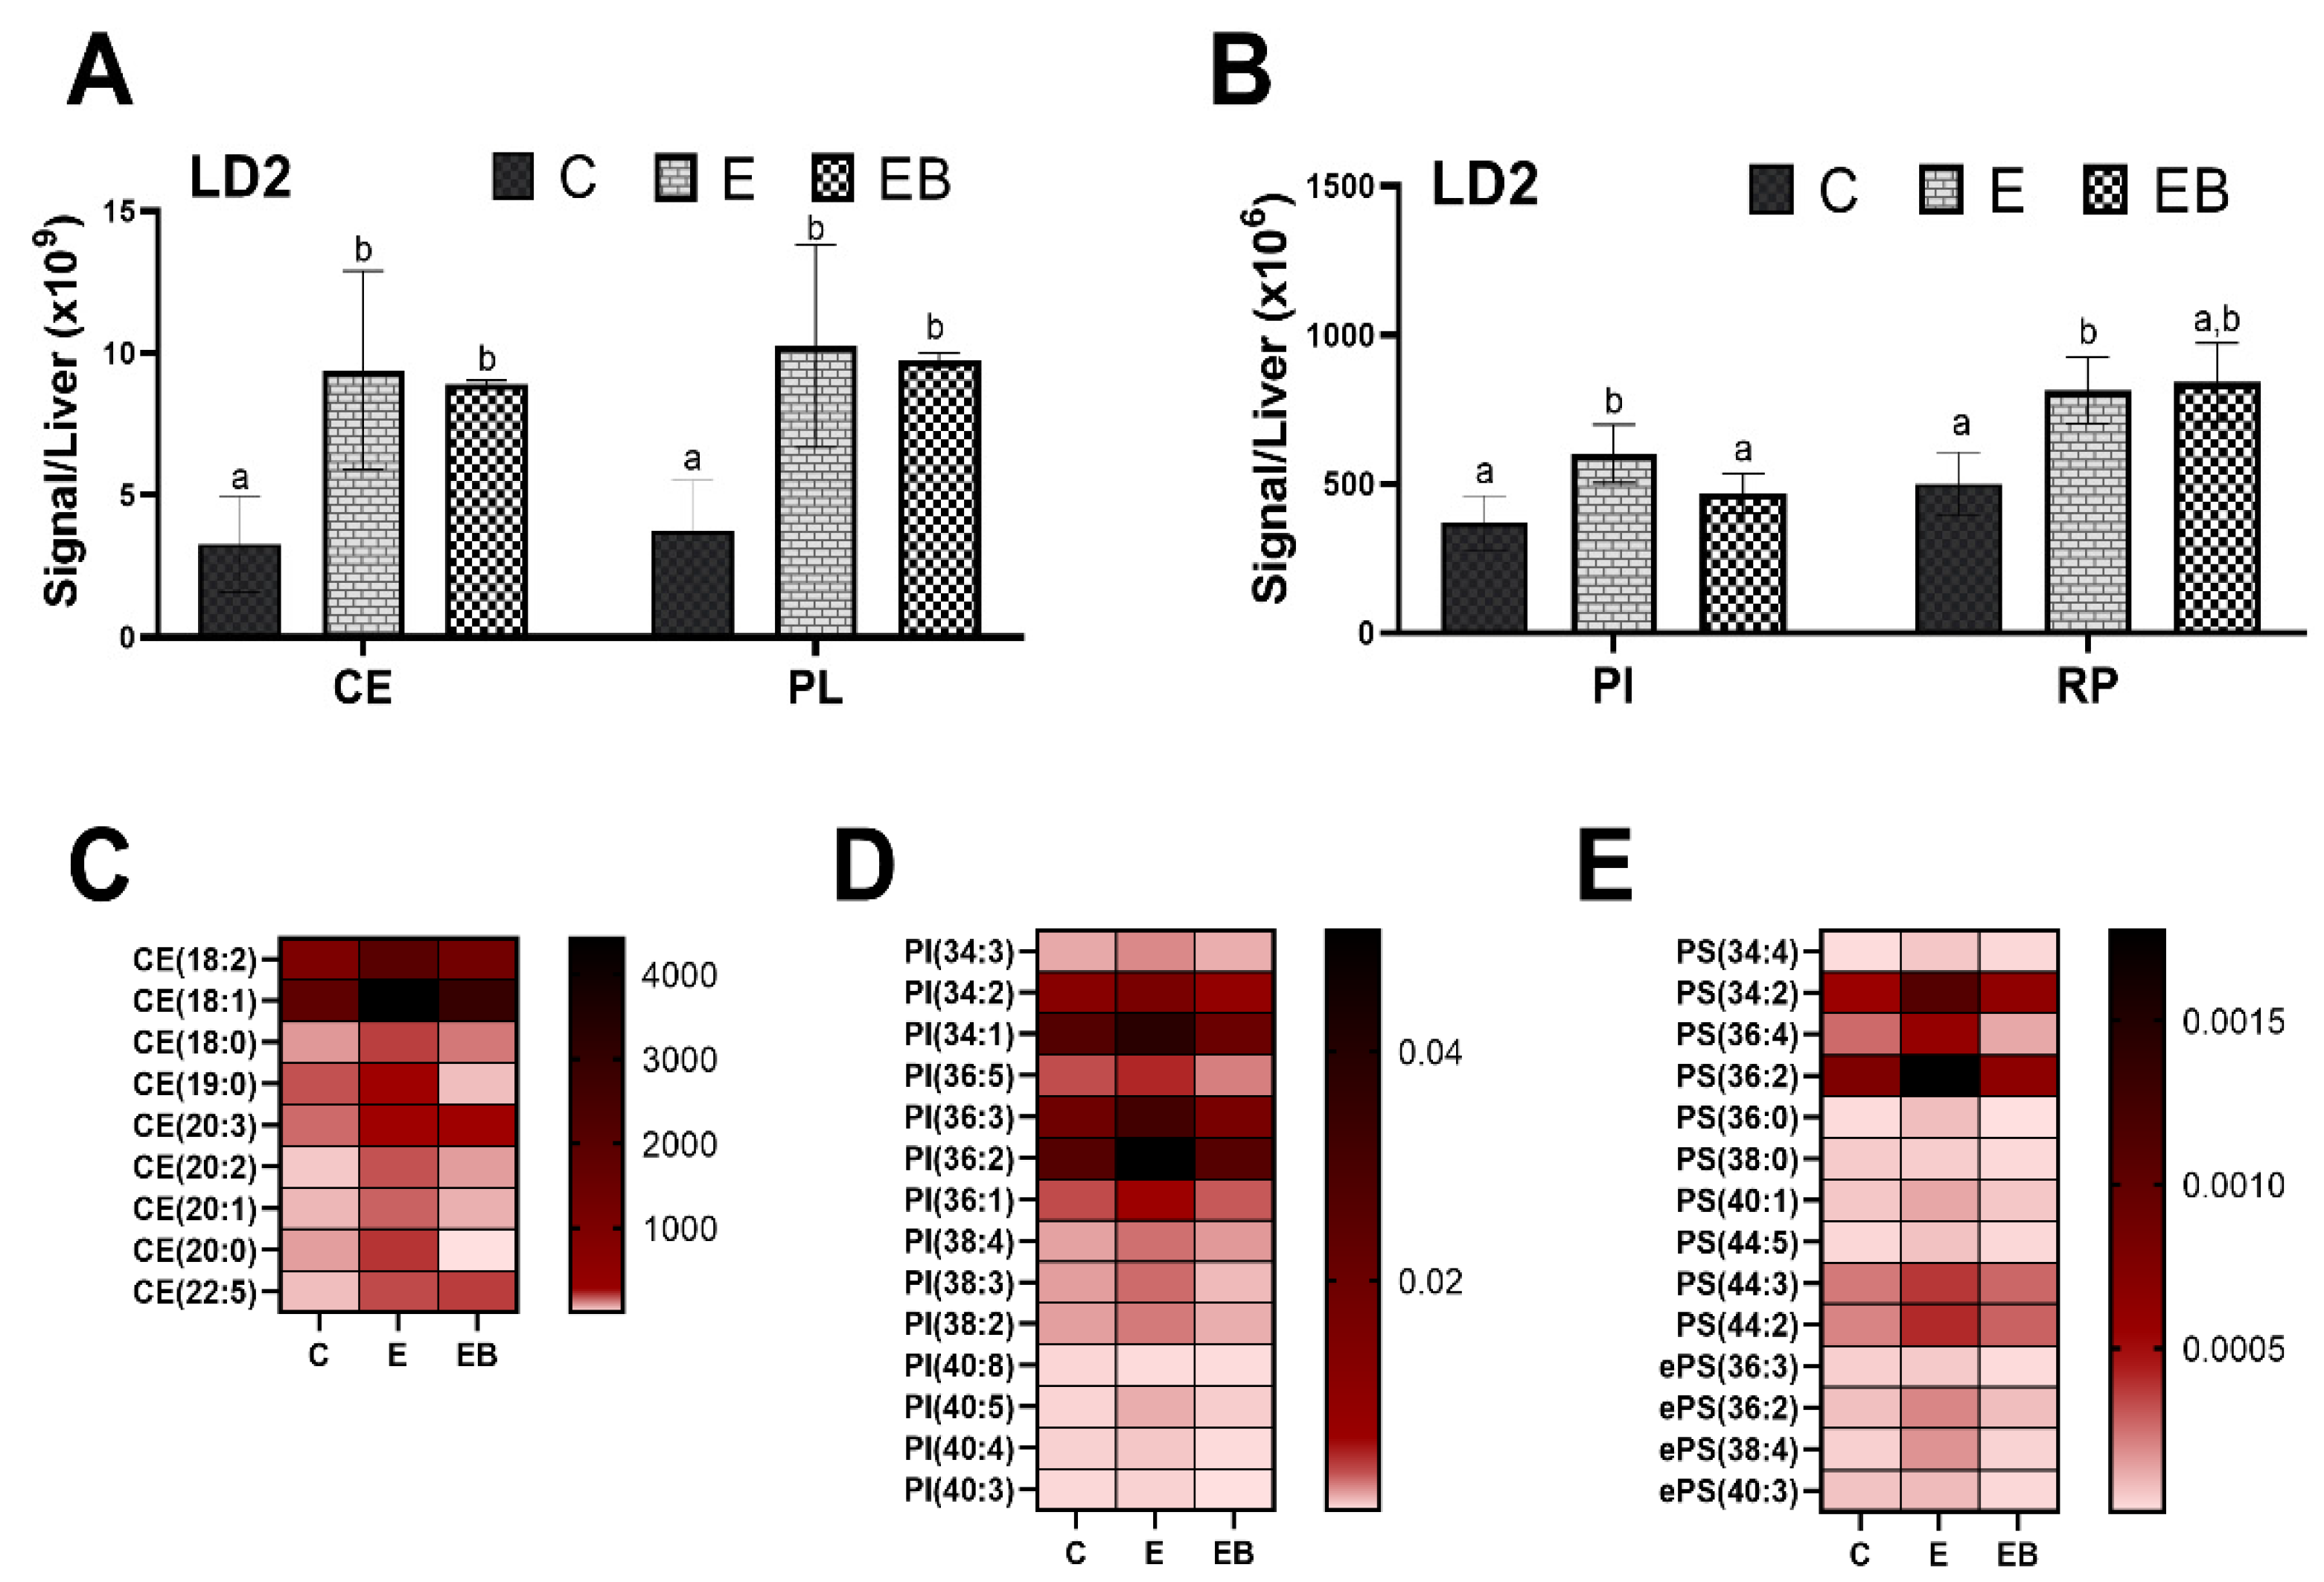
3.4.2. Effect of Ethanol and Betaine Co-Administration on LD2
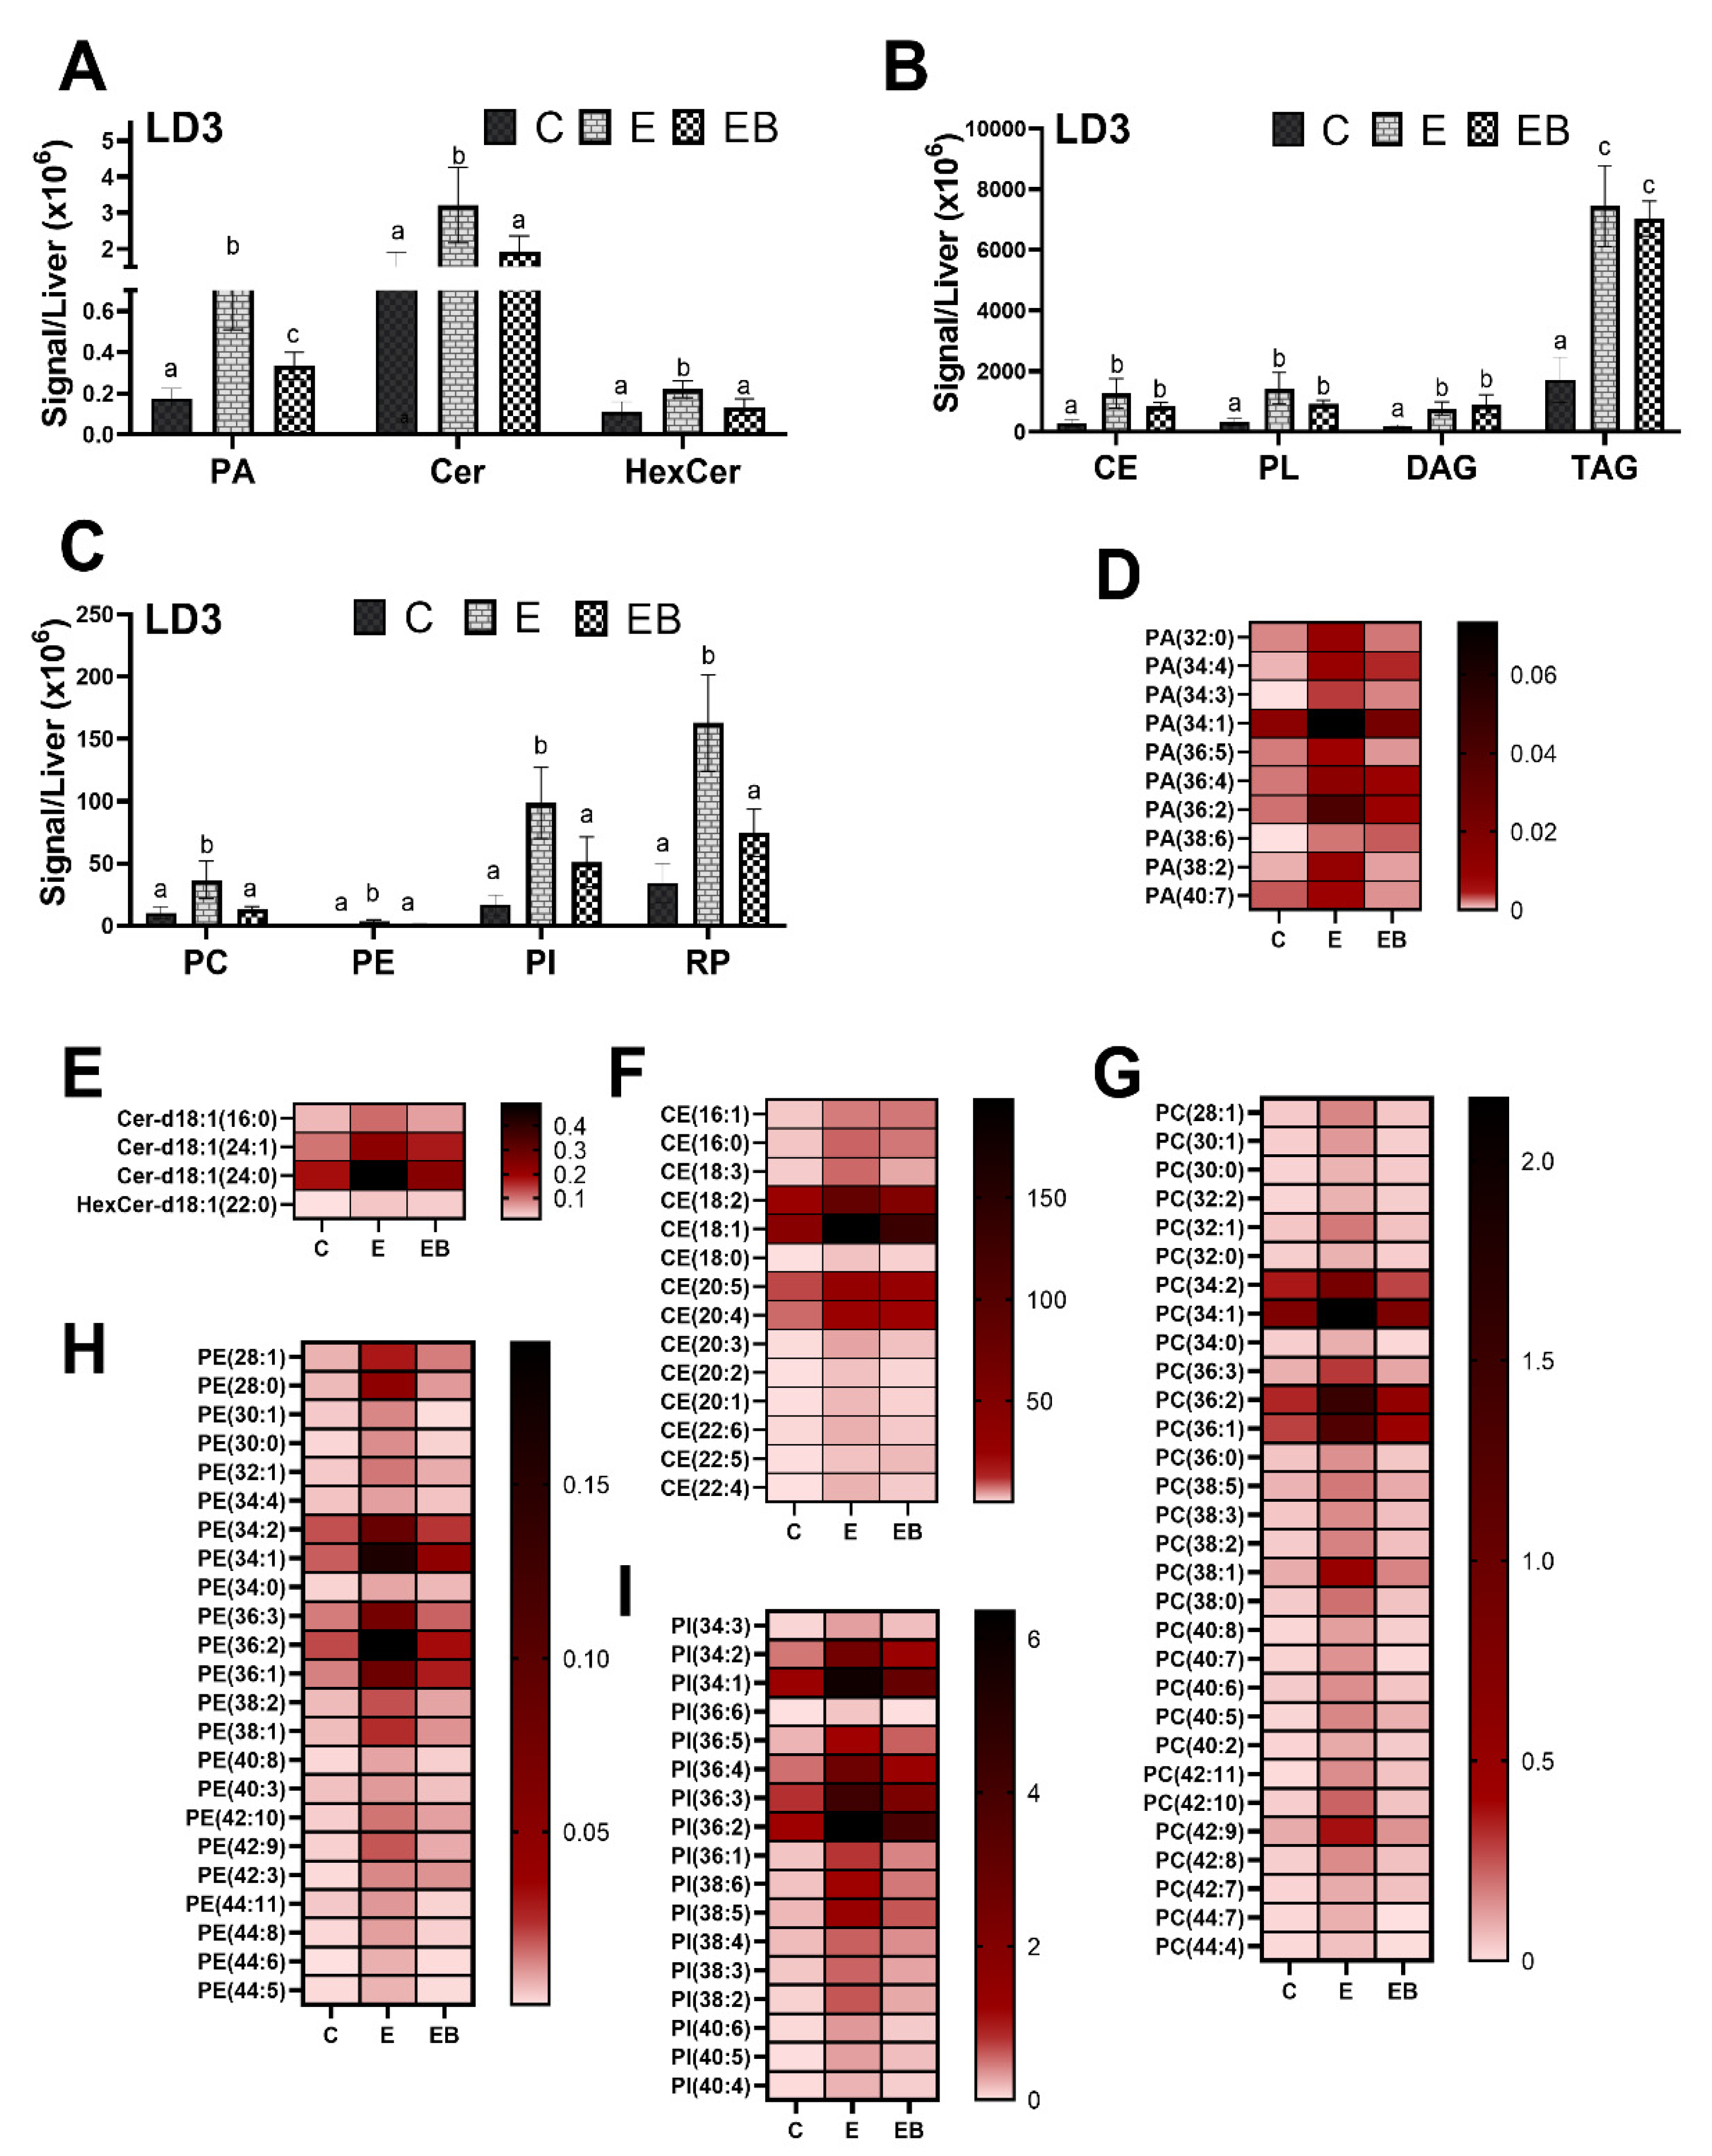
3.4.3. Effect of Ethanol and Betaine Co-Administration on LD3
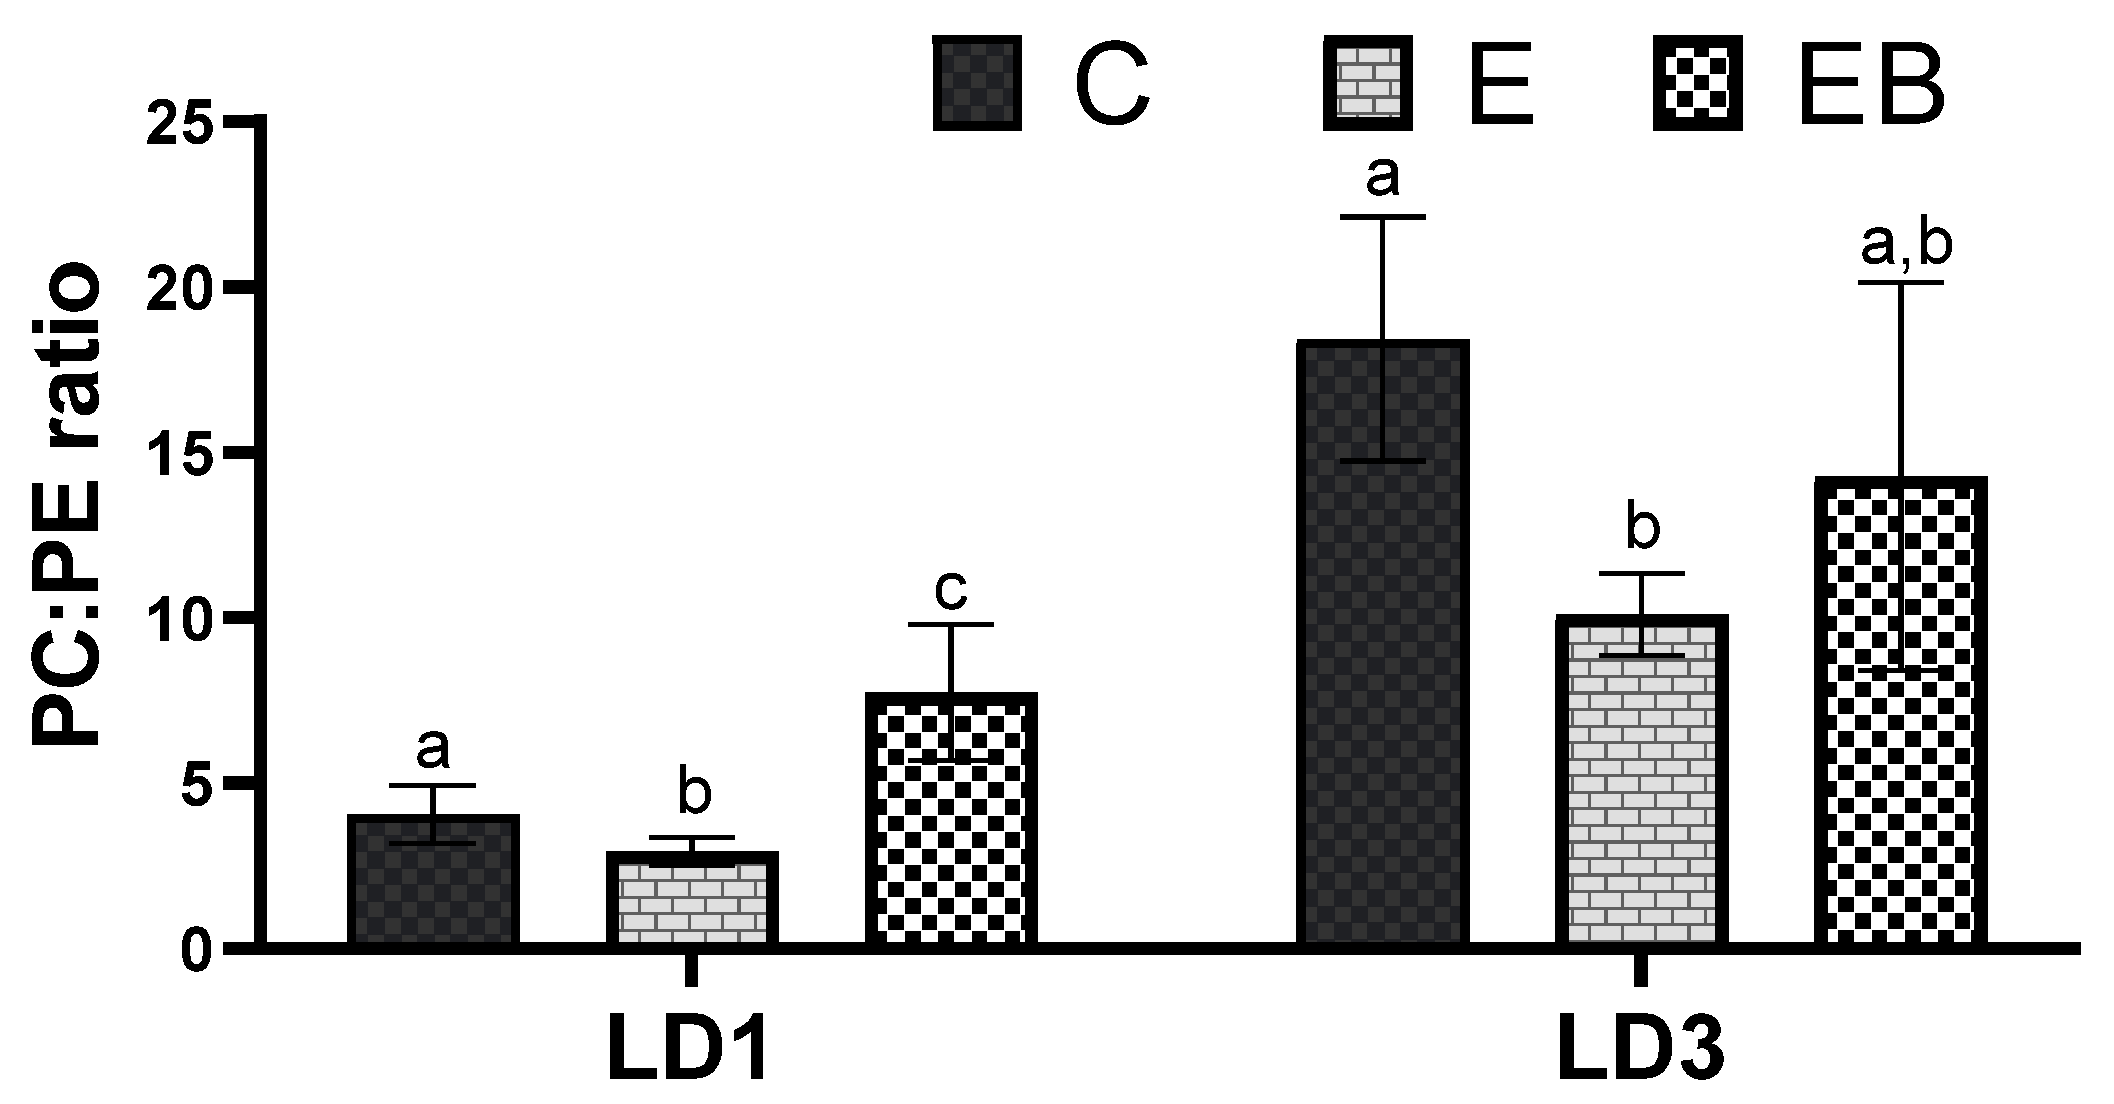
3.5. Analysis of PC:PE Ratio
4. Discussion
5. Conclusions
Supplementary Materials
Author Contributions
Funding
Institutional Review Board Statement
Informed Consent Statement
Data Availability Statement
Acknowledgments
Conflicts of Interest
References
- Ventura-Cots, M.; Ballester-Ferré, M.P.; Ravi, S.; Bataller, R. Public health policies and alcohol-related liver disease. JHEP Rep. 2019, 1, 403–413. [Google Scholar] [CrossRef] [PubMed] [Green Version]
- White, A.M.; Slater, M.E.; Ng, G.; Hingson, R.; Breslow, R. Trends in Alcohol-Related Emergency Department Visits in the United States: Results from the Nationwide Emergency Department Sample, 2006 to 2014. Alcohol. Clin. Exp. Res. 2018, 42, 352–359. [Google Scholar] [CrossRef] [PubMed]
- May, P.; Chambers, C.D.; Kalberg, W.O.; Zellner, J.; Feldman, H.; Buckley, D.; Kopald, D.; Hasken, J.M.; Xu, R.; Honerkamp-Smith, G.; et al. Prevalence of Fetal Alcohol Spectrum Disorders in 4 US Communities. JAMA 2018, 319, 474–482. [Google Scholar] [CrossRef] [PubMed] [Green Version]
- Mokdad, A.H.; Marks, J.S.; Stroup, D.F.; Gerberding, J.L. Actual Causes of Death in the United States, 2000. JAMA 2004, 291, 1238–1245. [Google Scholar] [CrossRef]
- Lakshman, M.R. Some novel insights into the pathogenesis of alcoholic steatosis. Alcohol 2004, 34, 45–48. [Google Scholar] [CrossRef]
- Sozio, M.S.; Liangpunsakul, S.; Crabb, D. The Role of Lipid Metabolism in the Pathogenesis of Alcoholic and Nonalcoholic Hepatic Steatosis. Semin. Liver Dis. 2010, 30, 378–390. [Google Scholar] [CrossRef] [PubMed]
- Arvind, A.; Osganian, S.A.; Cohen, D.E.; Corey, K.E. Lipid and lipoprotein metabolism in liver disease. In Endotext; Feingold, K.R., Anawalt, B., Boyce, A., Chrousos, G., de Herder, W.W., Dhatariya, K., Dungan, K., Grossman, A., Hershman, J.M., Hofland, J., et al., Eds.; Endotext [Internet]; MDText.com, Inc.: South Dartmouth, MA, USA, 2000. [Google Scholar]
- Mellinger, J.L. Epidemiology of Alcohol Use and Alcoholic Liver Disease. Clin. Liver Dis. 2019, 13, 136–139. [Google Scholar] [CrossRef] [Green Version]
- Xu, S.; Chen, Y.; Ma, Y.; Liu, T.; Zhao, M.; Wang, Z.; Zhao, L. Lipidomic Profiling Reveals Disruption of Lipid Metabolism in Valproic Acid-Induced Hepatotoxicity. Front. Pharmacol. 2019, 10, 819. [Google Scholar] [CrossRef] [Green Version]
- Wu, Z.; Shon, J.C.; Liu, K.-H. Mass Spectrometry-based Lipidomics and Its Application toBiomedical Research. J. Lifestyle Med. 2014, 4, 17–33. [Google Scholar] [CrossRef] [Green Version]
- Fernando, H.; Bhopale, K.K.; Kondraganti, S.; Kaphalia, B.S.; Shakeel Ansari, G.A. Lipidomic changes in rat liver after long-term exposure to ethanol. Toxicol. Appl. Pharmacol. 2011, 255, 127–137. [Google Scholar] [CrossRef] [PubMed] [Green Version]
- Draijer, L.G.; Froon-Torenstra, D.; van Weeghel, M.; Vaz, F.M.; Bohte, A.E.; Holleboom, A.G.; Benninga, M.A.; Koot, B.G. Lipidomics in Nonalcoholic Fatty Liver Disease: Exploring Serum Lipids as Biomarkers for Pediatric Nonalcoholic Fatty Liver Disease. J. Pediatr. Gastroenterol. Nutr. 2020, 71, 433–439. [Google Scholar] [CrossRef]
- Carr, R.M.; Ahima, R.S. Pathophysiology of lipid droplet proteins in liver diseases. Exp. Cell Res. 2016, 340, 187–192. [Google Scholar] [CrossRef] [PubMed] [Green Version]
- Natarajan, S.K.; Rasineni, K.; Ganesan, M.; Feng, D.; McVicker, B.L.; McNiven, M.A.; Osna, N.A.; Mott, J.L.; Casey, C.A.; Kharbanda, K.K. Structure, Function and Metabolism of Hepatic and Adipose Tissue Lipid Droplets: Implications in Alcoholic Liver Disease. Curr. Mol. Pharmacol. 2017, 10, 237–248. [Google Scholar] [CrossRef] [PubMed] [Green Version]
- Kharbanda, K.K.; Todero, S.L.; King, A.L.; Osna, N.A.; McVicker, B.L.; Tuma, D.J.; Wisecarver, J.L.; Bailey, S.M. Betaine Treatment Attenuates Chronic Ethanol-Induced Hepatic Steatosis and Alterations to the Mitochondrial Respiratory Chain Proteome. Int. J. Hepatol. 2012, 2012, 962183. [Google Scholar] [CrossRef] [Green Version]
- Kharbanda, K.K.; Mailliard, M.E.; Baldwin, C.R.; Beckenhauer, H.C.; Sorrell, M.F.; Tuma, D.J. Betaine attenuates alcoholic steatosis by restoring phosphatidylcholine generation via the phosphatidylethanolamine methyltransferase pathway. J. Hepatol. 2007, 46, 314–321. [Google Scholar] [CrossRef] [PubMed]
- Lieber, C.S.; DeCarli, L.M.; Sorrell, M.F. Experimental methods of ethanol administration. Hepatology 1989, 10, 501–510. [Google Scholar] [CrossRef]
- Ding, Y.; Zhang, S.; Yang, L.; Na, H.; Zhang, P.; Zhang, H.; Wang, Y.; Chen, Y.; Yu, J.; Huo, C.; et al. Isolating lipid droplets from multiple species. Nat. Protoc. 2013, 8, 43–51. [Google Scholar] [CrossRef]
- Zhang, S.; Wang, Y.; Cui, L.; Deng, Y.; Xu, S.; Yu, J.; Cichello, S.; Serrero, G.; Ying, Y.; Liu, P. Morphologically and Functionally Distinct Lipid Droplet Subpopulations. Sci. Rep. 2016, 6, 29539. [Google Scholar] [CrossRef] [Green Version]
- Folch, J.; Lees, M.; Sloane Stanley, G.H. A simple method for the isolation and purification of total lipides from animal tissues. J. Biol. Chem. 1957, 226, 497–509. [Google Scholar] [CrossRef]
- Arumugam, M.K.; Chava, S.; Rasineni, K.; Paal, M.C.; Donohue, T.M.; Osna, N.A.; Kharbanda, K.K. Elevated S-adenosylhomocysteine induces adipocyte dysfunction to promote alcohol-associated liver steatosis. Sci. Rep. 2021, 11, 14693. [Google Scholar] [CrossRef]
- Arumugam, M.K.; Talawar, S.; Listenberger, L.; Donohue, T.M., Jr.; Osna, N.A.; Kharbanda, K.K. Role of Elevated Intracellular S-Adenosylhomocysteine in the Pathogenesis of Alcohol-Related Liver Disease. Cells 2020, 9, 1526. [Google Scholar] [CrossRef] [PubMed]
- Devaiah, S.P.; Roth, M.R.; Baughman, E.; Li, M.; Tamura, P.; Jeannotte, R.; Welti, R.; Wang, X. Quantitative profiling of polar glycerolipid species from organs of wild-type Arabidopsis and a PHOSPHOLIPASE Dα1 knockout mutant. Phytochemistry 2006, 67, 1907–1924. [Google Scholar] [CrossRef]
- Bartz, R.; Li, W.-H.; Venables, B.; Zehmer, J.K.; Roth, M.R.; Welti, R.; Anderson, R.G.W.; Liu, P.; Chapman, K.D. Lipidomics reveals that adiposomes store ether lipids and mediate phospholipid traffic. J. Lipid Res. 2007, 48, 837–847. [Google Scholar] [CrossRef] [PubMed] [Green Version]
- Spangenburg, E.E.; Pratt, S.J.P.; Wohlers, L.M.; Lovering, R.M. Use of BODIPY (493/503) to Visualize Intramuscular Lipid Droplets in Skeletal Muscle. J. Biomed. Biotechnol. 2011, 2011, 598358. [Google Scholar] [CrossRef] [PubMed] [Green Version]
- Olzmann, J.A.; Carvalho, P. Dynamics and functions of lipid droplets. Nat. Rev. Mol. Cell Biol. 2019, 20, 137–155. [Google Scholar] [CrossRef]
- Meikle, P.J.; Wong, G.; Barlow, C.K.; Weir, J.M.; Greeve, M.A.; MacIntosh, G.L.; Almasy, L.; Comuzzie, A.G.; Mahaney, M.C.; Kowalczyk, A.; et al. Plasma Lipid Profiling Shows Similar Associations with Prediabetes and Type 2 Diabetes. PLoS ONE 2013, 8, e74341. [Google Scholar] [CrossRef] [Green Version]
- Meikle, P.J.; Mundra, P.A.; Wong, G.; Rahman, K.; Huynh, K.; Barlow, C.K.; Duly, A.M.P.; Haber, P.S.; Whitfield, J.B.; Seth, D. Circulating Lipids Are Associated with Alcoholic Liver Cirrhosis and Represent Potential Biomarkers for Risk Assessment. PLoS ONE 2015, 10, e0130346. [Google Scholar] [CrossRef] [Green Version]
- Schlemmer, H.-P.W.; Sawatzki, T.; Sammet, S.; Dornacher, I.; Bachert, P.; van Kaick, G.; Waldherr, R.; Seitz, H.K. Hepatic phospholipids in alcoholic liver disease assessed by proton-decoupled 31P magnetic resonance spectroscopy. J. Hepatol. 2005, 42, 752–759. [Google Scholar] [CrossRef]
- Iglesias, A.; Arranz, M.; Alvarez, J.J.; Perales, J.C.; Villar, J.; Herrera, E.; Lasunción, M.A. Cholesteryl ester transfer activity in liver disease and cholestasis, and its relation with fatty acid composition of lipoprotein lipids. Clin. Chim. Acta 1996, 248, 157–174. [Google Scholar] [CrossRef]
- Yang, L.; Jin, G.-H.; Zhou, J.-Y. The Role of Ceramide in the Pathogenesis of Alcoholic Liver Disease. Alcohol Alcohol. 2016, 51, 251–257. [Google Scholar] [CrossRef] [Green Version]
- Listenberger, L.; Townsend, E.; Rickertsen, C.; Hains, A.; Brown, E.; Inwards, E.G.; Stoeckman, A.K.; Matis, M.P.; Sampathkumar, R.S.; Osna, N.A.; et al. Decreasing Phosphatidylcholine on the Surface of the Lipid Droplet Correlates with Altered Protein Binding and Steatosis. Cells 2018, 7, 230. [Google Scholar] [CrossRef] [PubMed] [Green Version]
- Raps, S.; White, F.J. Female Social Dominance in Semi-Free-Ranging Ruffed Lemurs (Varecia variegata). Folia Primatol. 1995, 65, 163–168. [Google Scholar] [CrossRef] [PubMed]
- Kharbanda, K.K. Role of transmethylation reactions in alcoholic liver disease. World J. Gastroenterol. 2007, 13, 4947–4954. [Google Scholar] [CrossRef] [PubMed] [Green Version]
- Clugston, R.; Jiang, H.; Lee, M.X.; Piantedosi, R.; Yuen, J.J.; Ramakrishnan, R.; Lewis, M.J.; Gottesman, M.E.; Huang, L.-S.; Goldberg, I.J.; et al. Altered hepatic lipid metabolism in C57BL/6 mice fed alcohol: A targeted lipidomic and gene expression study. J. Lipid Res. 2011, 52, 2021–2031. [Google Scholar] [CrossRef] [PubMed] [Green Version]
- Israelsen, M.; Kim, M.; Suvitaival, T.; Madsen, B.S.; Hansen, C.D.; Torp, N.; Trost, K.; Thiele, M.; Hansen, T.; Legido-Quigley, C.; et al. Comprehensive lipidomics reveals phenotypic differences in hepatic lipid turnover in ALD and NAFLD during alcohol intoxication. JHEP Rep. 2021, 3, 100325. [Google Scholar] [CrossRef]
- Breslow, D.K.; Weissman, J.S. Membranes in Balance: Mechanisms of Sphingolipid Homeostasis. Mol. Cell 2010, 40, 267–279. [Google Scholar] [CrossRef] [Green Version]
- Marí, M.; Fernández-Checa, J.C. Sphingolipid signalling and liver diseases. Liver Int. 2007, 27, 440–450. [Google Scholar] [CrossRef] [Green Version]
- Chavez, J.A.; Summers, S.A. A Ceramide-Centric View of Insulin Resistance. Cell Metab. 2012, 15, 585–594. [Google Scholar] [CrossRef] [Green Version]
- Lee, W.-K.; Maaß, M.; Quach, A.; Poscic, N.; Prangley, H.; Pallott, E.-C.; Kim, J.L.; Pierce, J.S.; Ogretmen, B.; Futerman, A.H.; et al. Dependence of ABCB1 transporter expression and function on distinct sphingolipids generated by ceramide synthases-2 and -6 in chemoresistant renal cancer. J. Biol. Chem. 2022, 298, 101492. [Google Scholar] [CrossRef]
- Teichgräber, V.; Ulrich, M.; Endlich, N.; Riethmüller, J.; Wilker, B.; De Oliveira–Munding, C.C.; van Heeckeren, A.M.; Barr, M.L.; von Kürthy, G.; Schmid, K.W.; et al. Ceramide accumulation mediates inflammation, cell death and infection susceptibility in cystic fibrosis. Nat. Med. 2008, 14, 382–391. [Google Scholar] [CrossRef]
- Colombini, M. Ceramide channels and their role in mitochondria-mediated apoptosis. Biochim. Biophys. Acta BBA Bioenerg. 2010, 1797, 1239–1244. [Google Scholar] [CrossRef] [Green Version]
- Wang, Z.; Yao, T.; Pini, M.; Zhou, Z.; Fantuzzi, G.; Song, Z. Betaine improved adipose tissue function in mice fed a high-fat diet: A mechanism for hepatoprotective effect of betaine in nonalcoholic fatty liver disease. Am. J. Physiol. Gastrointest. Liver Physiol. 2010, 298, G634–G642. [Google Scholar] [CrossRef] [PubMed] [Green Version]
- Zhao, G.; He, F.; Wu, C.; Li, P.; Li, N.; Deng, J.; Zhu, G.; Ren, W.; Peng, Y. Betaine in Inflammation: Mechanistic Aspects and Applications. Front. Immunol. 2018, 9, 1070. [Google Scholar] [CrossRef] [Green Version]
- Kathirvel, E.; Morgan, K.; Nandgiri, G.; Sandoval, B.C.; Caudill, M.A.; Bottiglieri, T.; French, S.W.; Morgan, T.R. Betaine improves nonalcoholic fatty liver and associated hepatic insulin resistance: A potential mechanism for hepatoprotection by betaine. Am. J. Physiol.-Gastrointest. Liver Physiol. 2010, 299, G1068–G1077. [Google Scholar] [CrossRef] [Green Version]
- Kharbanda, K.K.; Rogers, D.D., 2nd; Mailliard, M.E.; Siford, G.L.; Barak, A.J.; Beckenhauer, H.C.; Sorrell, M.F.; Tuma, D.J. Role of elevated S-adenosylhomocysteine in rat hepatocyte apoptosis: Protection by betaine. Biochem. Pharmacol. 2005, 70, 1883–1890. [Google Scholar] [CrossRef] [PubMed] [Green Version]
- Clugston, R.D.; Gao, M.A.; Blaner, W.S. The Hepatic Lipidome: A Gateway to Understanding the Pathogenes is of Alcohol-Induced Fatty Liver. Curr. Mol. Pharmacol. 2017, 10, 195–206. [Google Scholar] [CrossRef] [Green Version]
- Fernando, H.; Kondraganti, S.; Bhopale, K.K.; Volk, D.E.; Neerathilingam, M.; Kaphalia, B.S.; Luxon, B.A.; Boor, P.J.; Shakeel Ansari, G.A. 1H and 31P NMR Lipidome of Ethanol-Induced Fatty Liver. Alcohol. Clin. Exp. Res. 2010, 34, 1937–1947. [Google Scholar] [CrossRef] [Green Version]
- Athenstaedt, K.; Daum, G. The life cycle of neutral lipids: Synthesis, storage and degradation. Cell. Mol. Life Sci. 2006, 63, 1355–1369. [Google Scholar] [CrossRef]
- Jeon, S.; Carr, R. Alcohol effects on hepatic lipid metabolism. J. Lipid Res. 2020, 61, 470–479. [Google Scholar] [CrossRef] [PubMed] [Green Version]
- Bradford, B.U.; O’Connell, T.M.; Han, J.; Kosyk, O.; Shymonyak, S.; Ross, P.K.; Winnike, J.; Kono, H.; Rusyn, I. Metabolomic profiling of a modified alcohol liquid diet model for liver injury in the mouse uncovers new markers of disease. Toxicol. Appl. Pharmacol. 2008, 232, 236–243. [Google Scholar] [CrossRef] [PubMed] [Green Version]
- Rasineni, K.; Casey, C.A. Molecular mechanism of alcoholic fatty liver. Indian J. Pharmacol. 2012, 44, 299–303. [Google Scholar] [CrossRef] [PubMed]
- Kharbanda, K.K.; Todero, S.L.; Ward, B.W.; Cannella, J.J., 3rd; Tuma, D.J. Betaine administration corrects ethanol-induced defective VLDL secretion. Mol. Cell. Biochem. 2009, 327, 75–78. [Google Scholar] [CrossRef] [PubMed]
- Gilham, D.; Ho, S.; Rasouli, M.; Martres, P.; Vance, D.E.; Lehner, R. Inhibitors of hepatic microsomal triacylglycerol hydrolase decrease very low density lipoprotein secretion. FASEB J. 2003, 17, 1685–1687. [Google Scholar] [CrossRef] [Green Version]
- Gibbons, G.F.; Brown, A.M.; Wiggins, D.; Pease, R. The roles of insulin and fatty acids in the regulation of hepatic very-low-density lipoprotein assembly. J. R. Soc. Med. 2002, 95, 23–32. [Google Scholar]
- Salter, A.M.; Wiggins, D.; Sessions, V.A.; Gibbons, G.F. The intracellular triacylglycerol/fatty acid cycle: A comparison of its activity in hepatocytes which secrete exclusively apolipoprotein (apo) B100 very-low-density lipoprotein (VLDL) and in those which secrete predominantly apoB48 VLDL. Biochem. J. 1998, 332, 667–672. [Google Scholar] [CrossRef] [PubMed] [Green Version]
- Wiggins, D.; Gibbons, G.F. The lipolysis/esterification cycle of hepatic triacylglycerol. Its role in the secretion of very-low-density lipoprotein and its response to hormones and sulphonylureas. Biochem. J. 1992, 284 Pt 2, 457–462. [Google Scholar] [CrossRef] [Green Version]
- Penno, A.; Hackenbroich, G.; Thiele, C. Phospholipids and lipid droplets. Biochim. Biophys. Acta (BBA)-Mol. Cell Biol. Lipids 2013, 1831, 589–594. [Google Scholar] [CrossRef]
- Krahmer, N.; Guo, Y.; Wilfling, F.; Hilger, M.; Lingrell, S.; Heger, K.; Newman, H.W.; Schmidt-Supprian, M.; Vance, D.E.; Mann, M.; et al. Phosphatidylcholine Synthesis for Lipid Droplet Expansion Is Mediated by Localized Activation of CTP:Phosphocholine Cytidylyltransferase. Cell Metab. 2011, 14, 504–515. [Google Scholar] [CrossRef] [PubMed] [Green Version]
- Watkins, S.M.; Zhu, X.; Zeisel, S.H. Phosphatidylethanolamine-N-methyltransferase Activity and Dietary Choline Regulate Liver-Plasma Lipid Flux and Essential Fatty Acid Metabolism in Mice. J. Nutr. 2003, 133, 3386–3391. [Google Scholar] [CrossRef] [Green Version]
- Li, Z.; Agellon, L.B.; Allen, T.M.; Umeda, M.; Jewell, L.; Mason, A.; Vance, D.E. The ratio of phosphatidylcholine to phospha-tidylethanolamine influences membrane integrity and steatohepatitis. Cell. Metab. 2006, 3, 321–331. [Google Scholar] [CrossRef] [Green Version]
- Kmieć, Z. Cooperation of Liver Cells in Health and Disease. Adv. Anat. Embryol. Cell Biol. 2001, 161, 1–151. [Google Scholar] [CrossRef]
- Chitraju, C.; Trötzmüller, M.; Hartler, J.; Wolinski, H.; Thallinger, G.G.; Lass, A.; Zechner, R.; Zimmermann, R.; Köfeler, H.C.; Spener, F. Lipidomic analysis of lipid droplets from murine hepatocytes reveals distinct signatures for nutritional stress. J. Lipid Res. 2012, 53, 2141–2152. [Google Scholar] [CrossRef] [PubMed] [Green Version]
- Guo, Y.; Walther, T.C.; Rao, M.; Stuurman, N.; Goshima, G.; Terayama, K.; Wong, J.S.; Vale, R.D.; Walter, P.; Farese, R.V. Functional genomic screen reveals genes involved in lipid-droplet formation and utilization. Nature 2008, 453, 657–661. [Google Scholar] [CrossRef] [PubMed] [Green Version]
- Fei, W.; Du, X.; Yang, H. Seipin, adipogenesis and lipid droplets. Trends Endocrinol. Metab. 2011, 22, 204–210. [Google Scholar] [CrossRef] [PubMed]
- van der Veen, J.N.; Kennelly, J.P.; Wan, S.; Vance, J.E.; Vance, D.E.; Jacobs, R.L. The critical role of phosphatidylcholine and phosphatidylethanolamine metabolism in health and disease. Biochim. Biophys. Acta BBA Biomembr. 2017, 1859, 1558–1572. [Google Scholar] [CrossRef] [PubMed]
- Listenberger, L.L.; Paetz, O.R.; Renier, T.J.; Long, A.B.; Vuong, S.H.; Chava, S.; Arumugam, M.; Paal, M.C.; Osna, N.A.; Kharbanda, K.K. Alcohol induced changes to phospholipids recruit anti-lipolytic proteins to lipid droplets. Hepatology 2021, 74, 199A. [Google Scholar]


Disclaimer/Publisher’s Note: The statements, opinions and data contained in all publications are solely those of the individual author(s) and contributor(s) and not of MDPI and/or the editor(s). MDPI and/or the editor(s) disclaim responsibility for any injury to people or property resulting from any ideas, methods, instructions or products referred to in the content. |
© 2023 by the authors. Licensee MDPI, Basel, Switzerland. This article is an open access article distributed under the terms and conditions of the Creative Commons Attribution (CC BY) license (https://creativecommons.org/licenses/by/4.0/).
Share and Cite
Arumugam, M.K.; Perumal, S.K.; Rasineni, K.; Donohue, T.M., Jr.; Osna, N.A.; Kharbanda, K.K. Lipidomic Analysis of Liver Lipid Droplets after Chronic Alcohol Consumption with and without Betaine Supplementation. Biology 2023, 12, 462. https://doi.org/10.3390/biology12030462
Arumugam MK, Perumal SK, Rasineni K, Donohue TM Jr., Osna NA, Kharbanda KK. Lipidomic Analysis of Liver Lipid Droplets after Chronic Alcohol Consumption with and without Betaine Supplementation. Biology. 2023; 12(3):462. https://doi.org/10.3390/biology12030462
Chicago/Turabian StyleArumugam, Madan Kumar, Sathish Kumar Perumal, Karuna Rasineni, Terrence M. Donohue, Jr., Natalia A. Osna, and Kusum K. Kharbanda. 2023. "Lipidomic Analysis of Liver Lipid Droplets after Chronic Alcohol Consumption with and without Betaine Supplementation" Biology 12, no. 3: 462. https://doi.org/10.3390/biology12030462