
Carbon Sequestration in Resin-Tapped Slash Pine (Pinus elliottii Engelm.) Subtropical Plantations
 , and
, and
Abstract
:Simple Summary
Abstract
1. Introduction
2. Materials and Methods
2.1. Trees, Sites, and Treatments
2.2. Resin Tapping
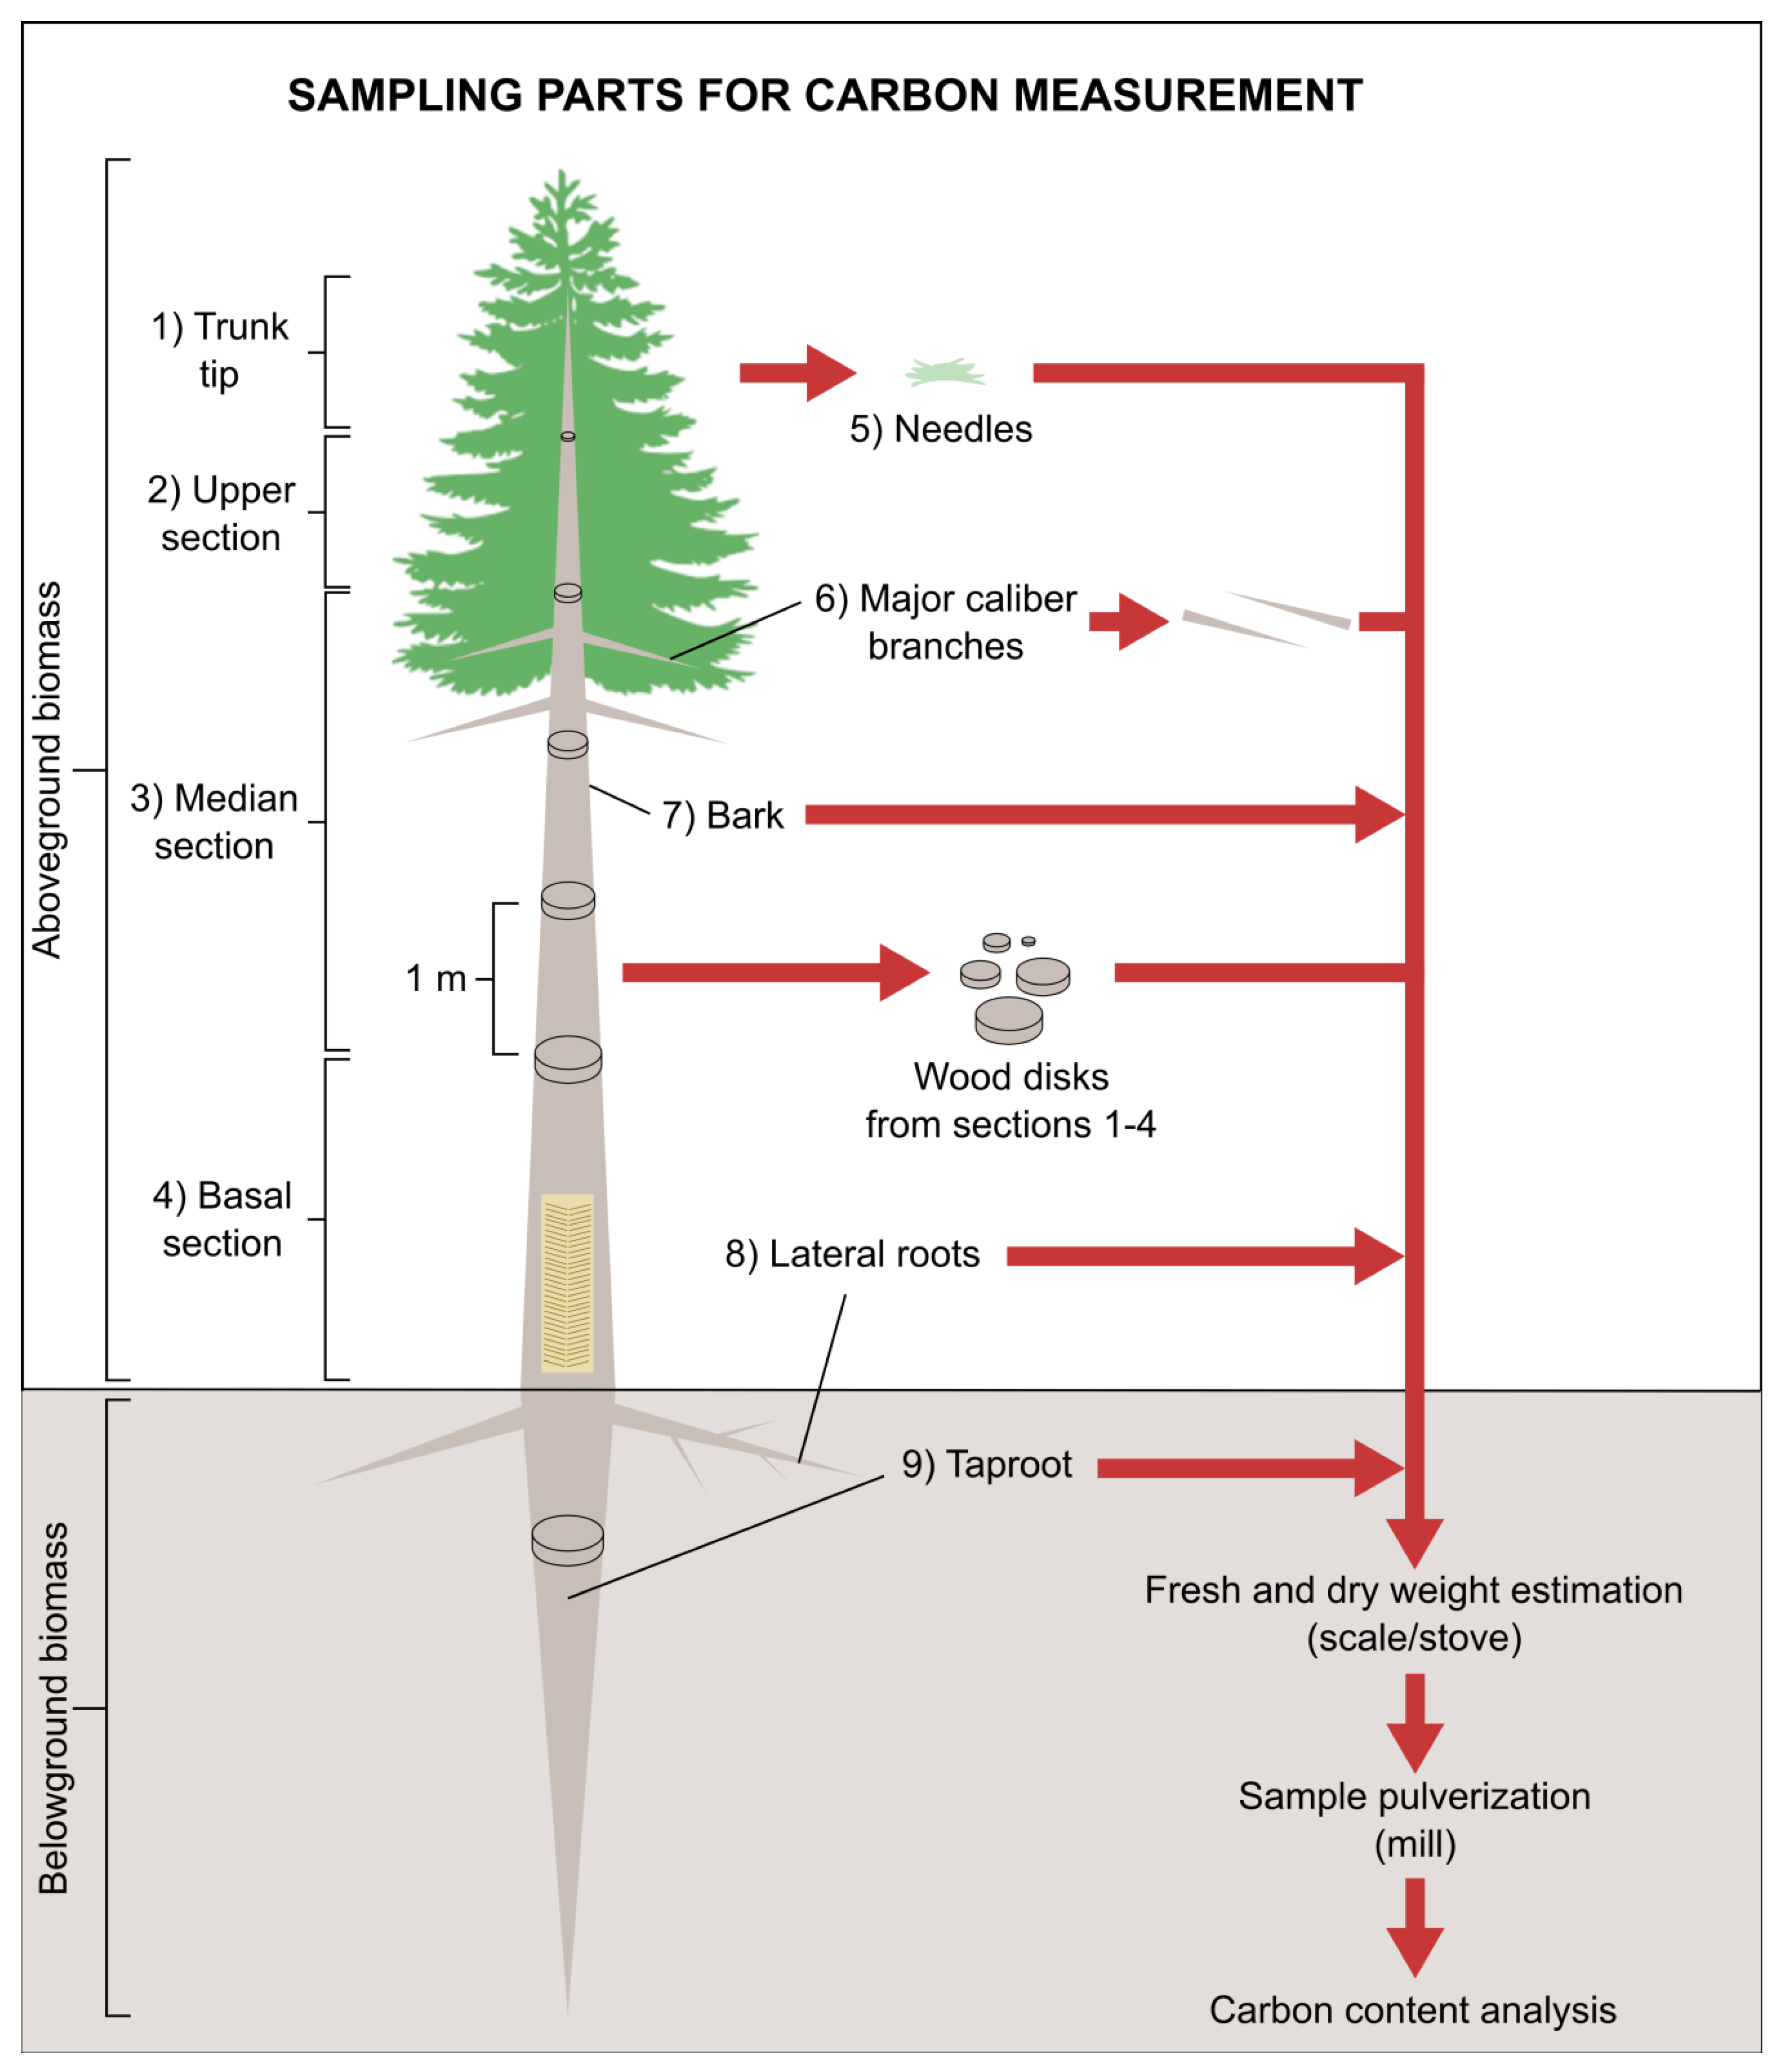
2.3. Destructive Analysis and Carbon Quantification
2.4. Physicochemical Characterization of Soil from Pine Stands
2.5. Lignin Quantification
2.6. Statistical Analyses
3. Results
3.1. Tree Evaluation Parameters
3.1.1. Tree Height
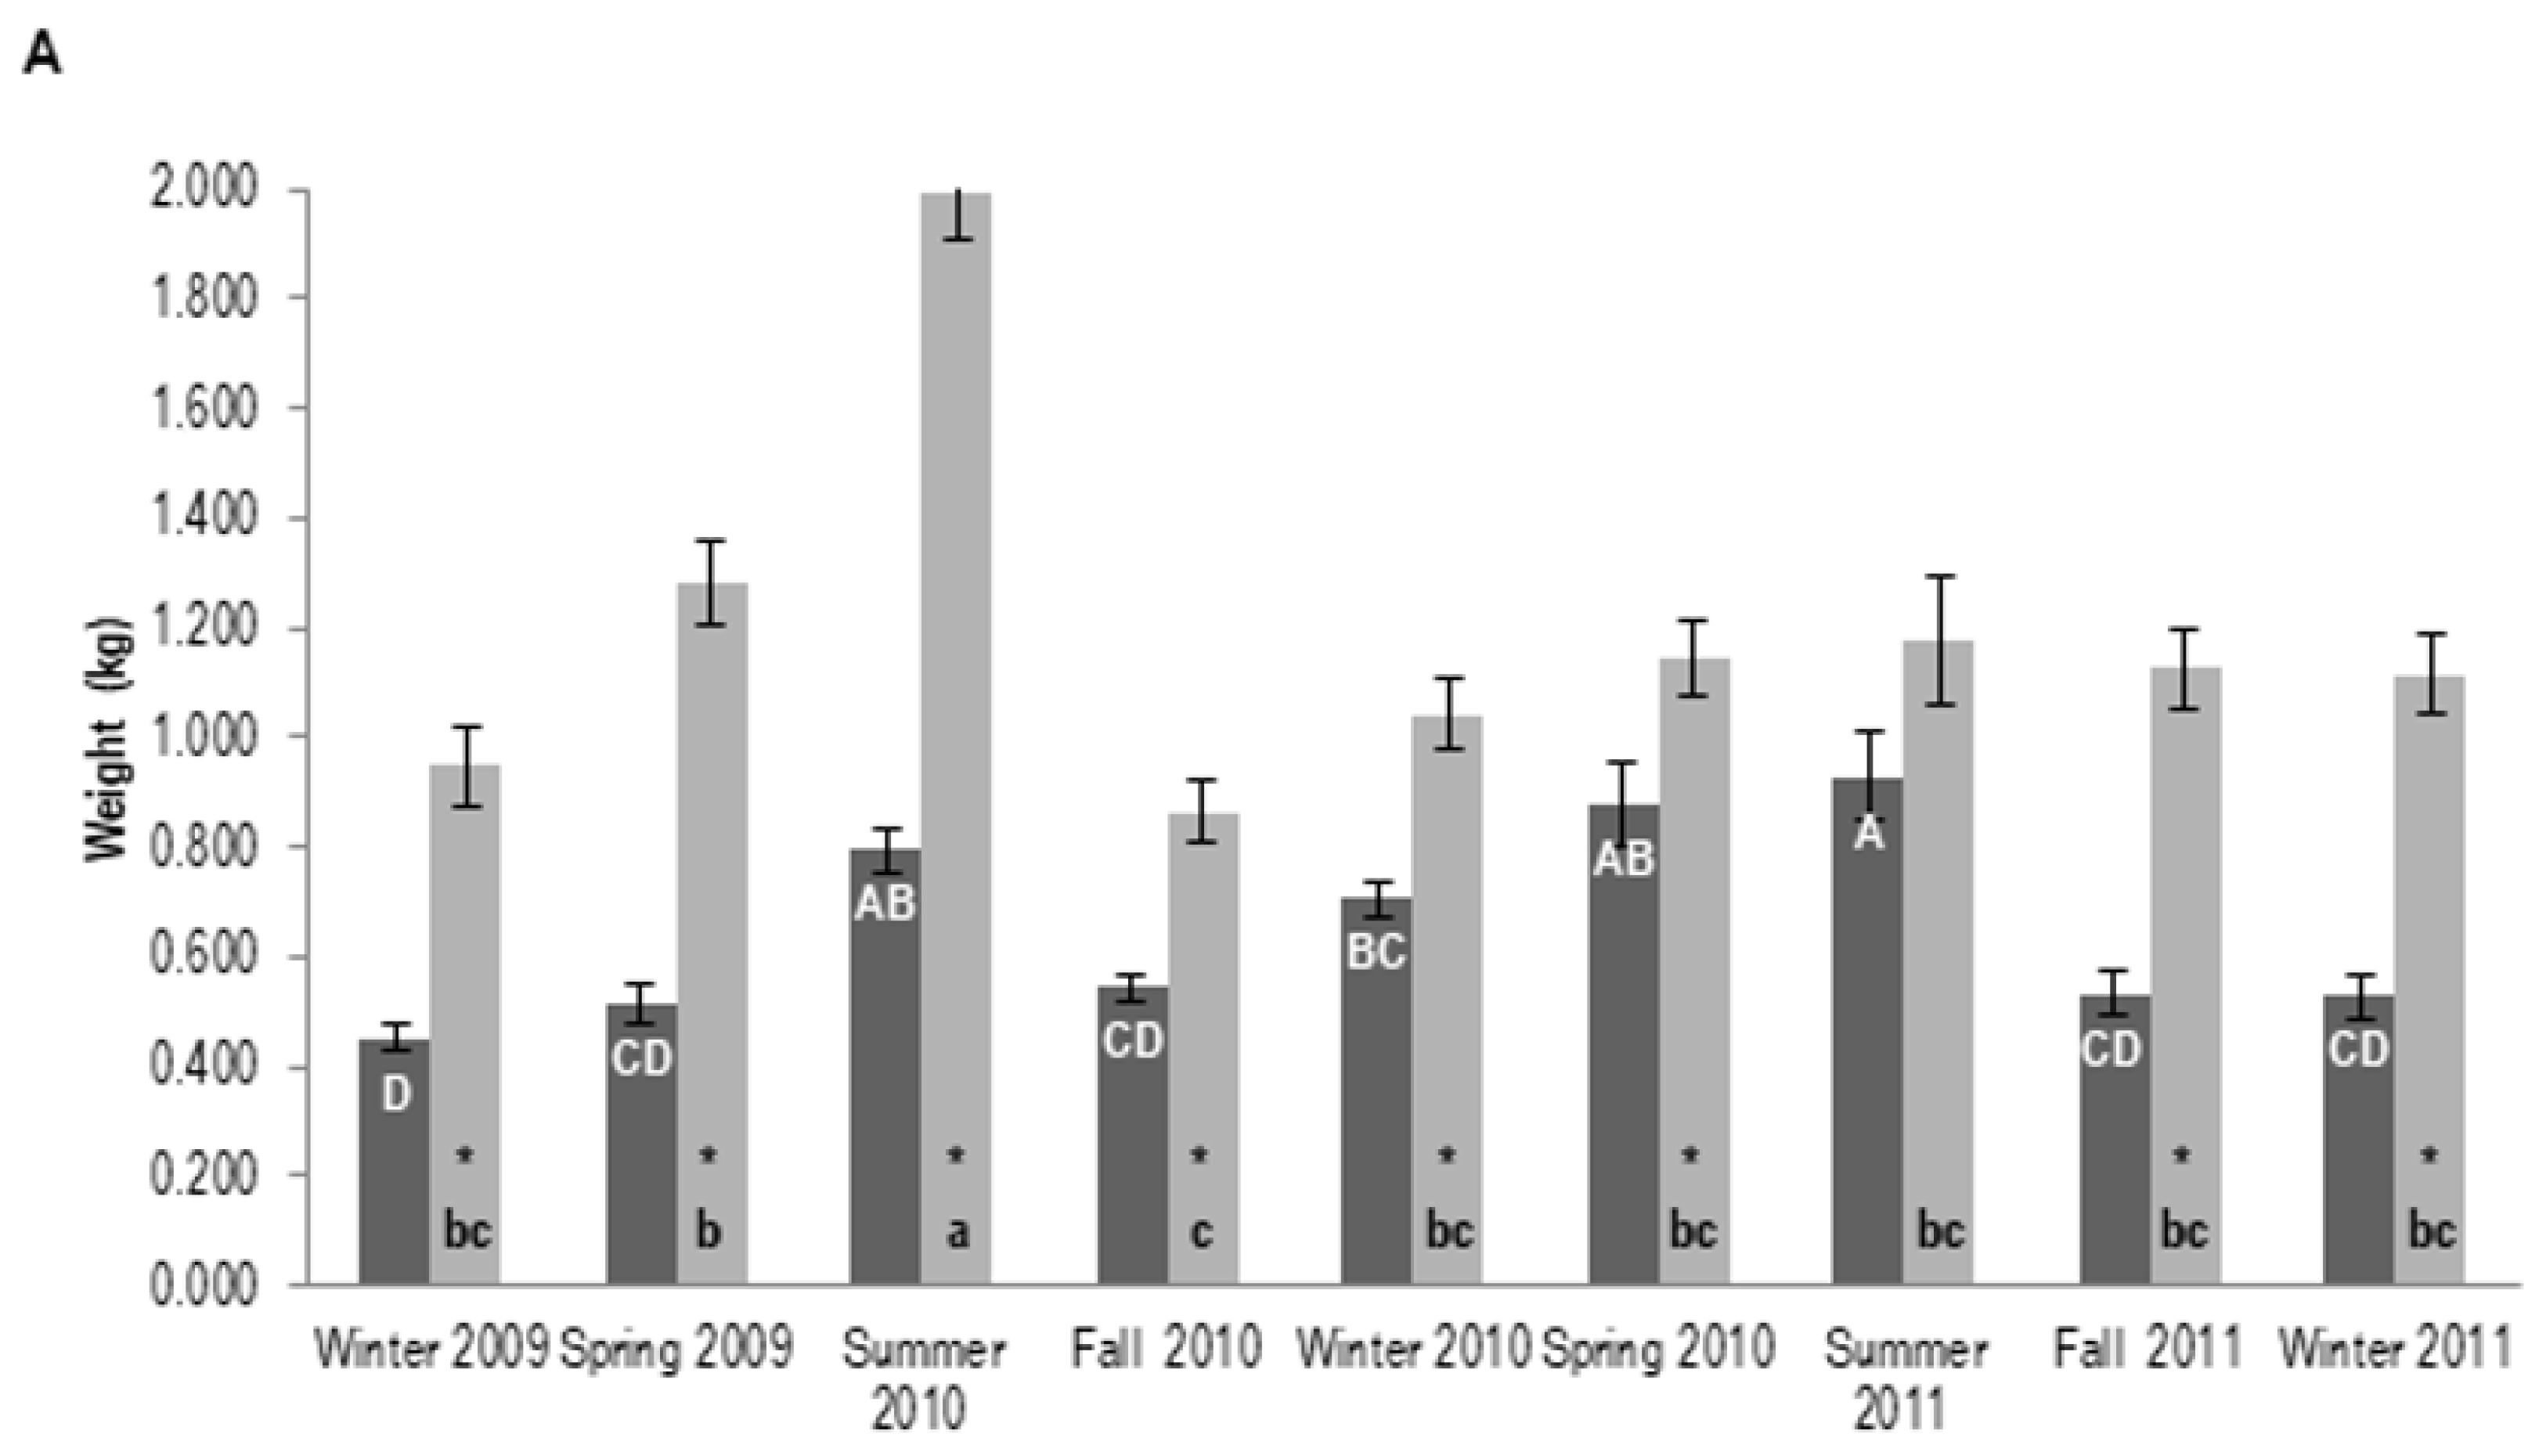
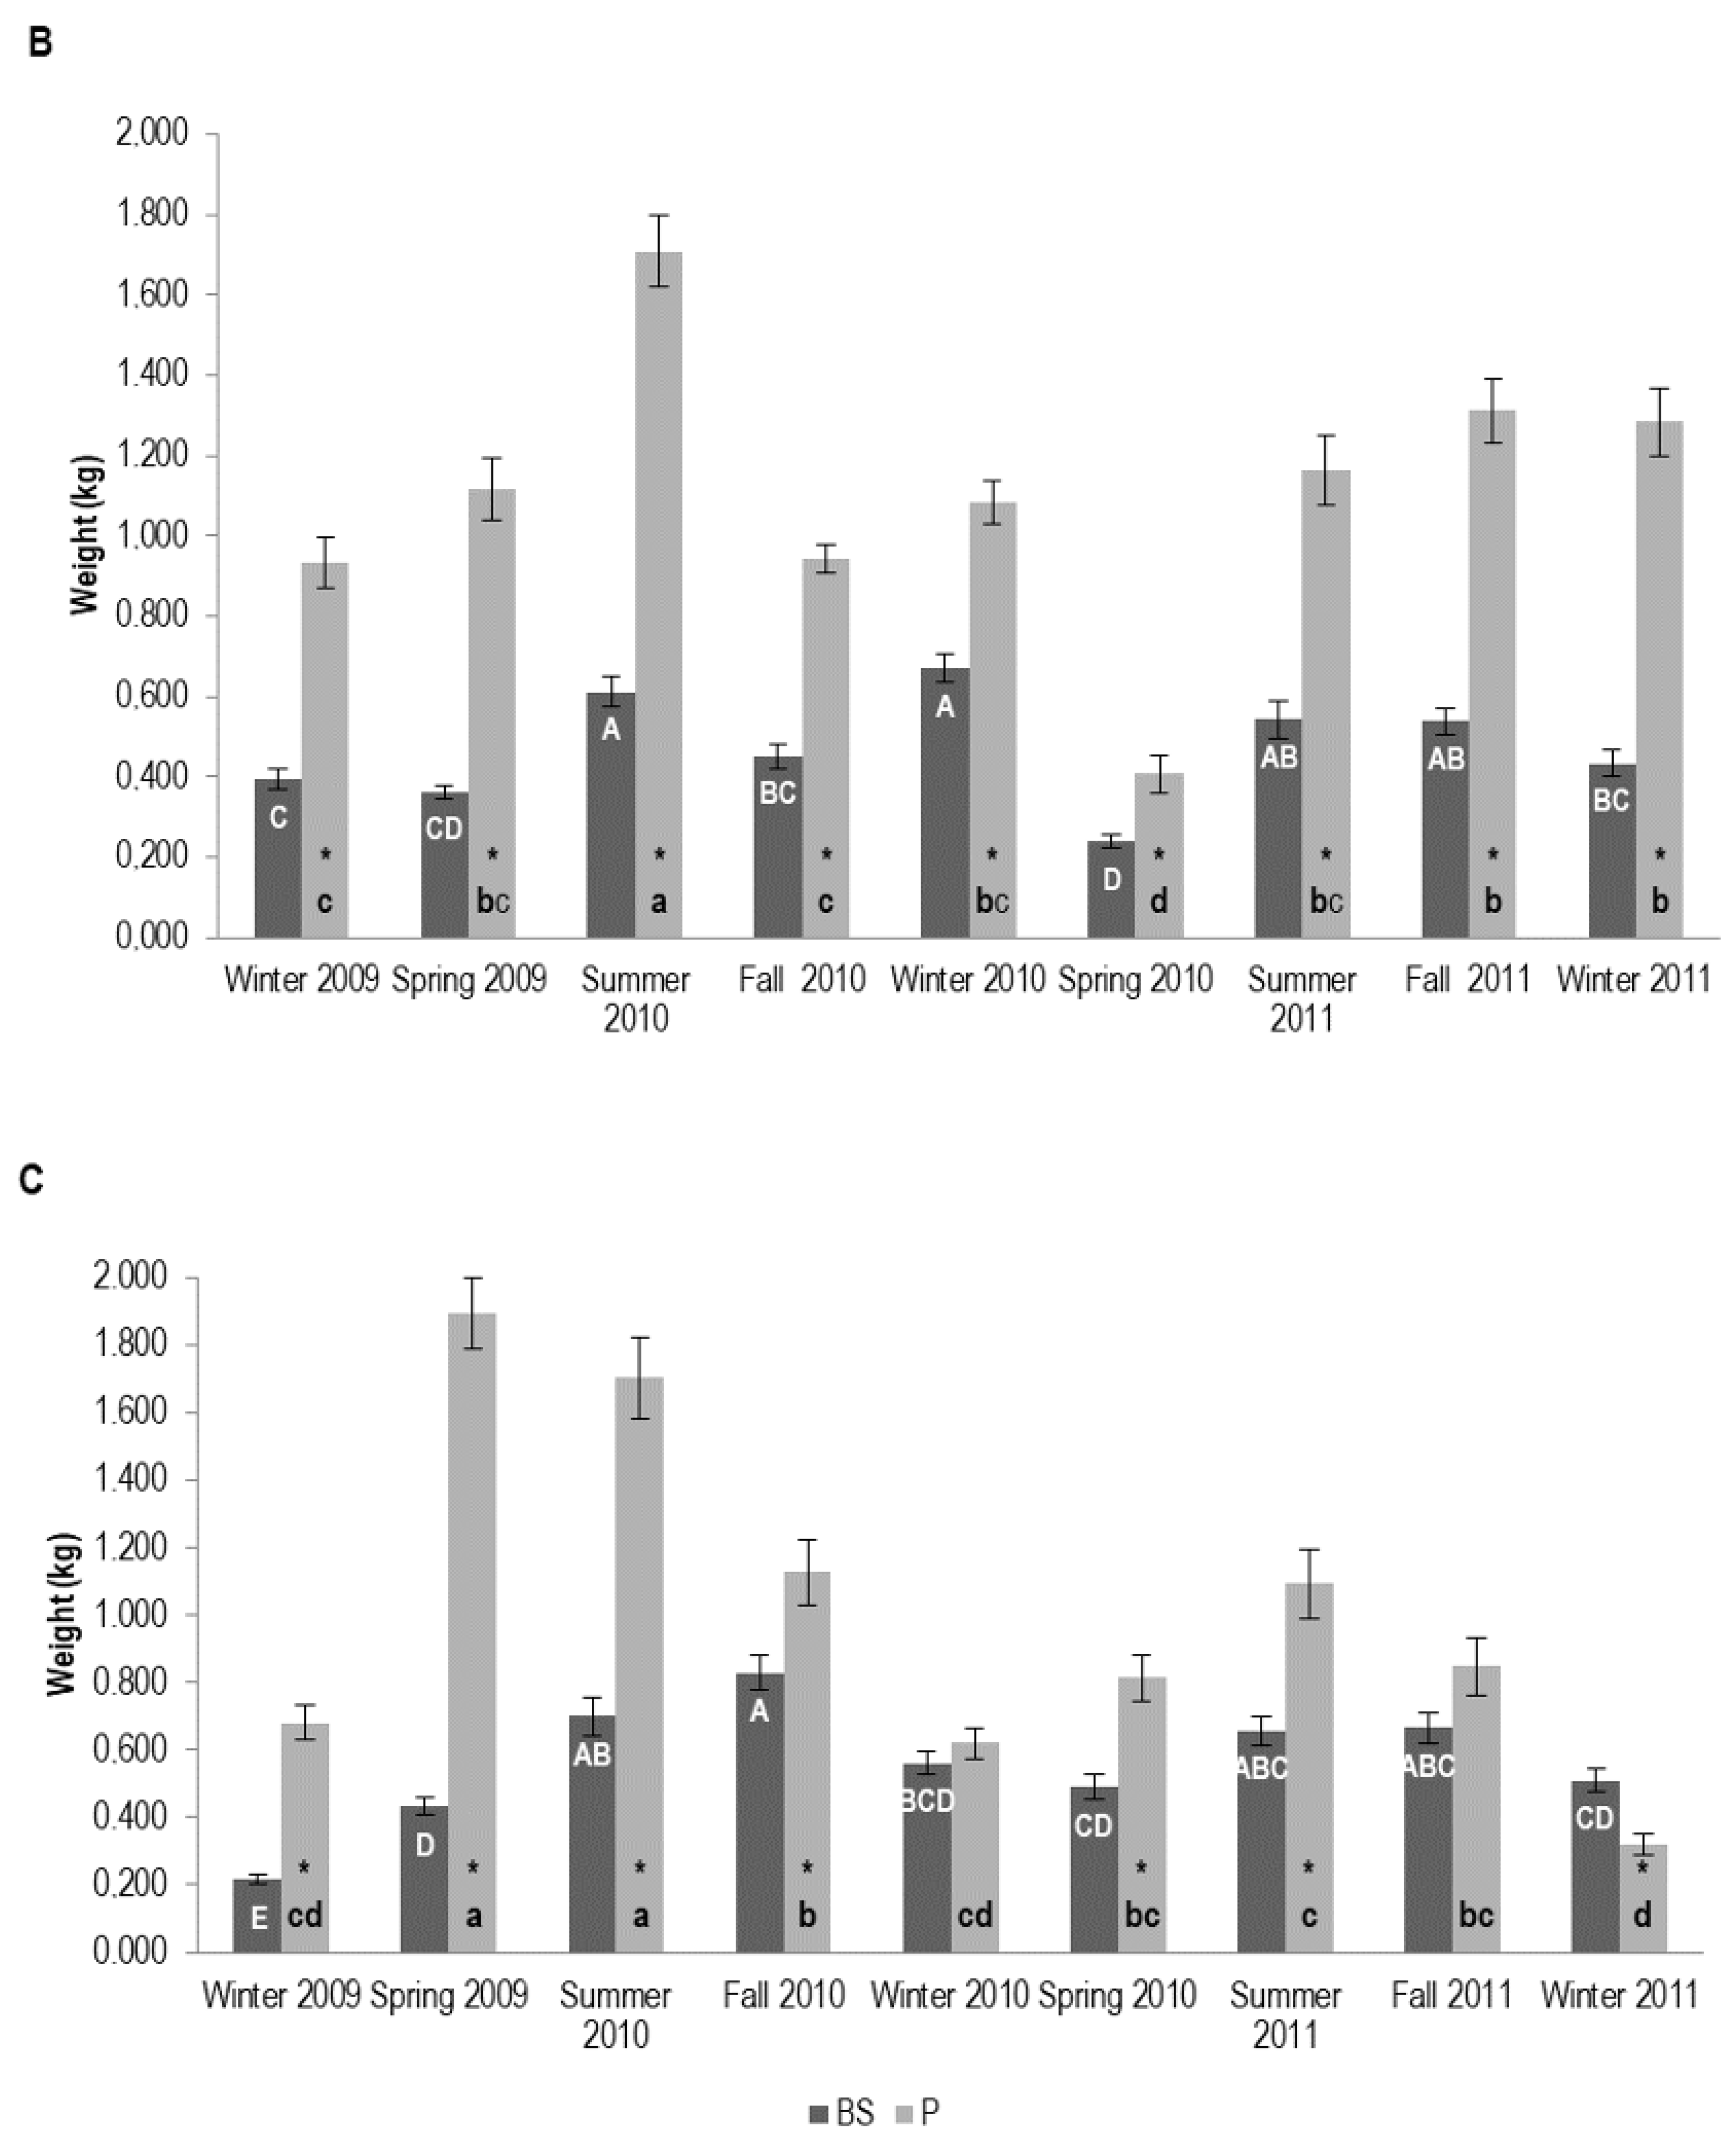
3.1.2. Tree Biomass
3.1.3. Tree Diameter at Breast Height
3.2. Resin Yield
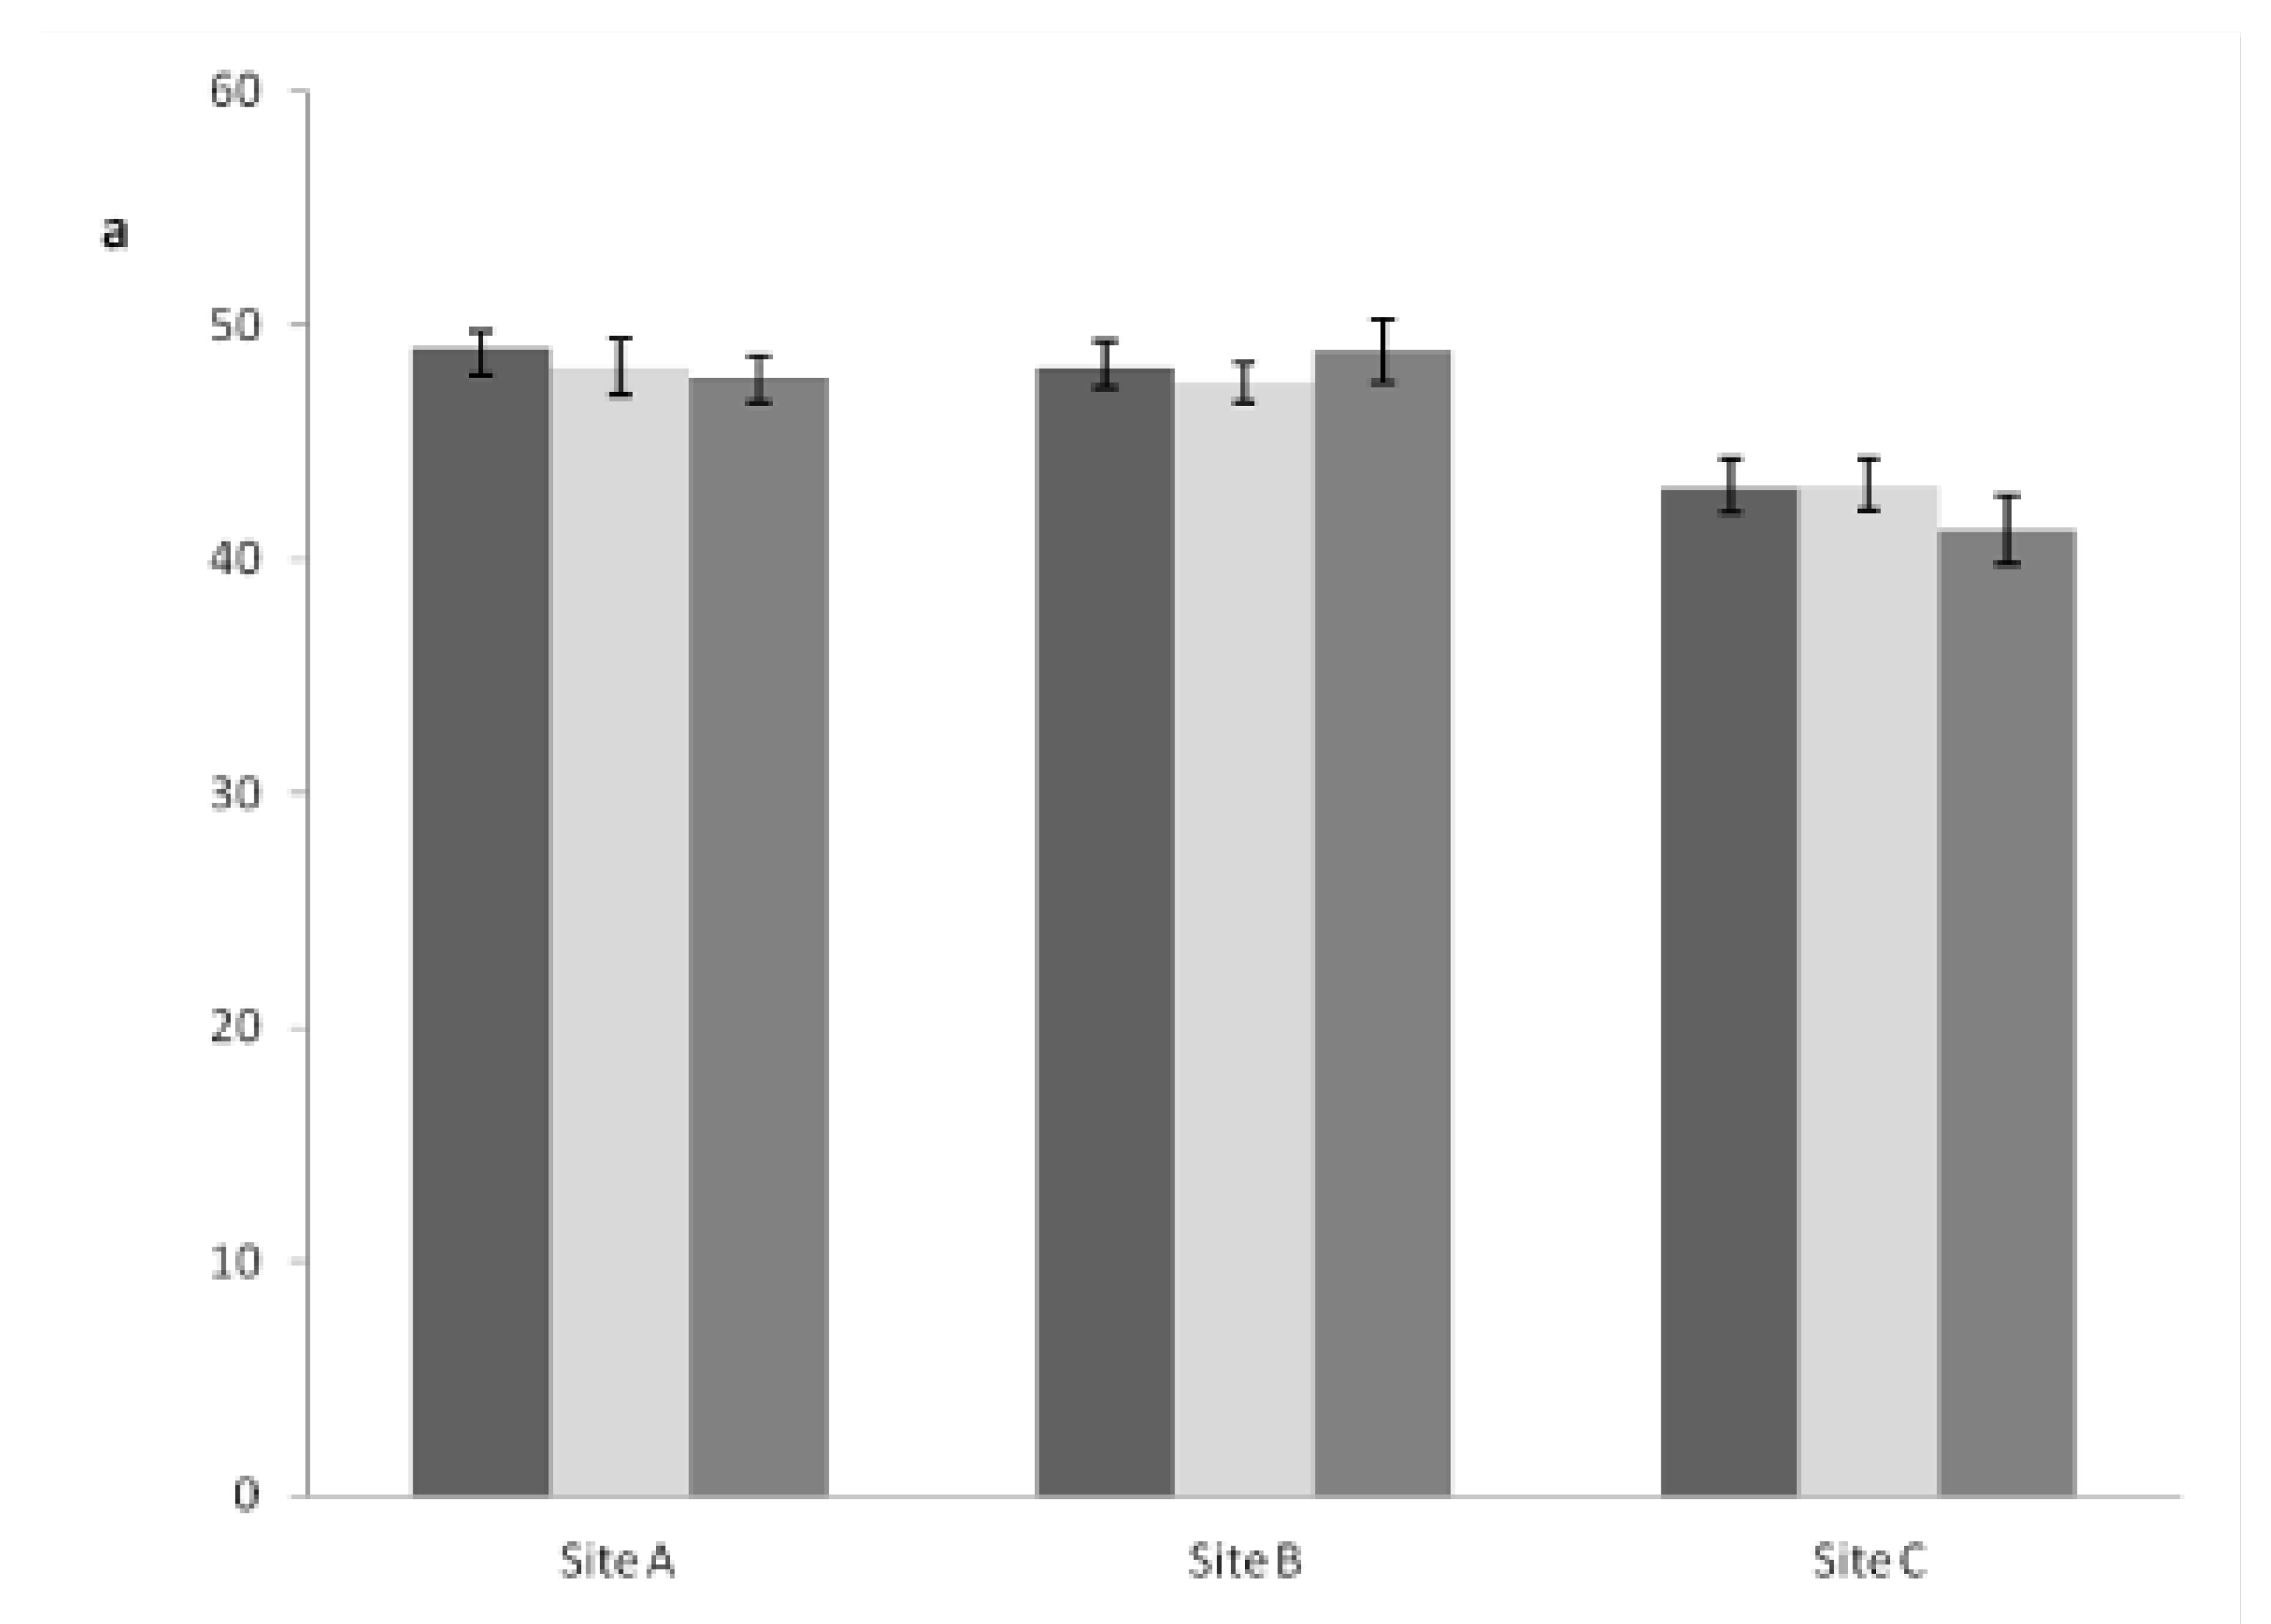
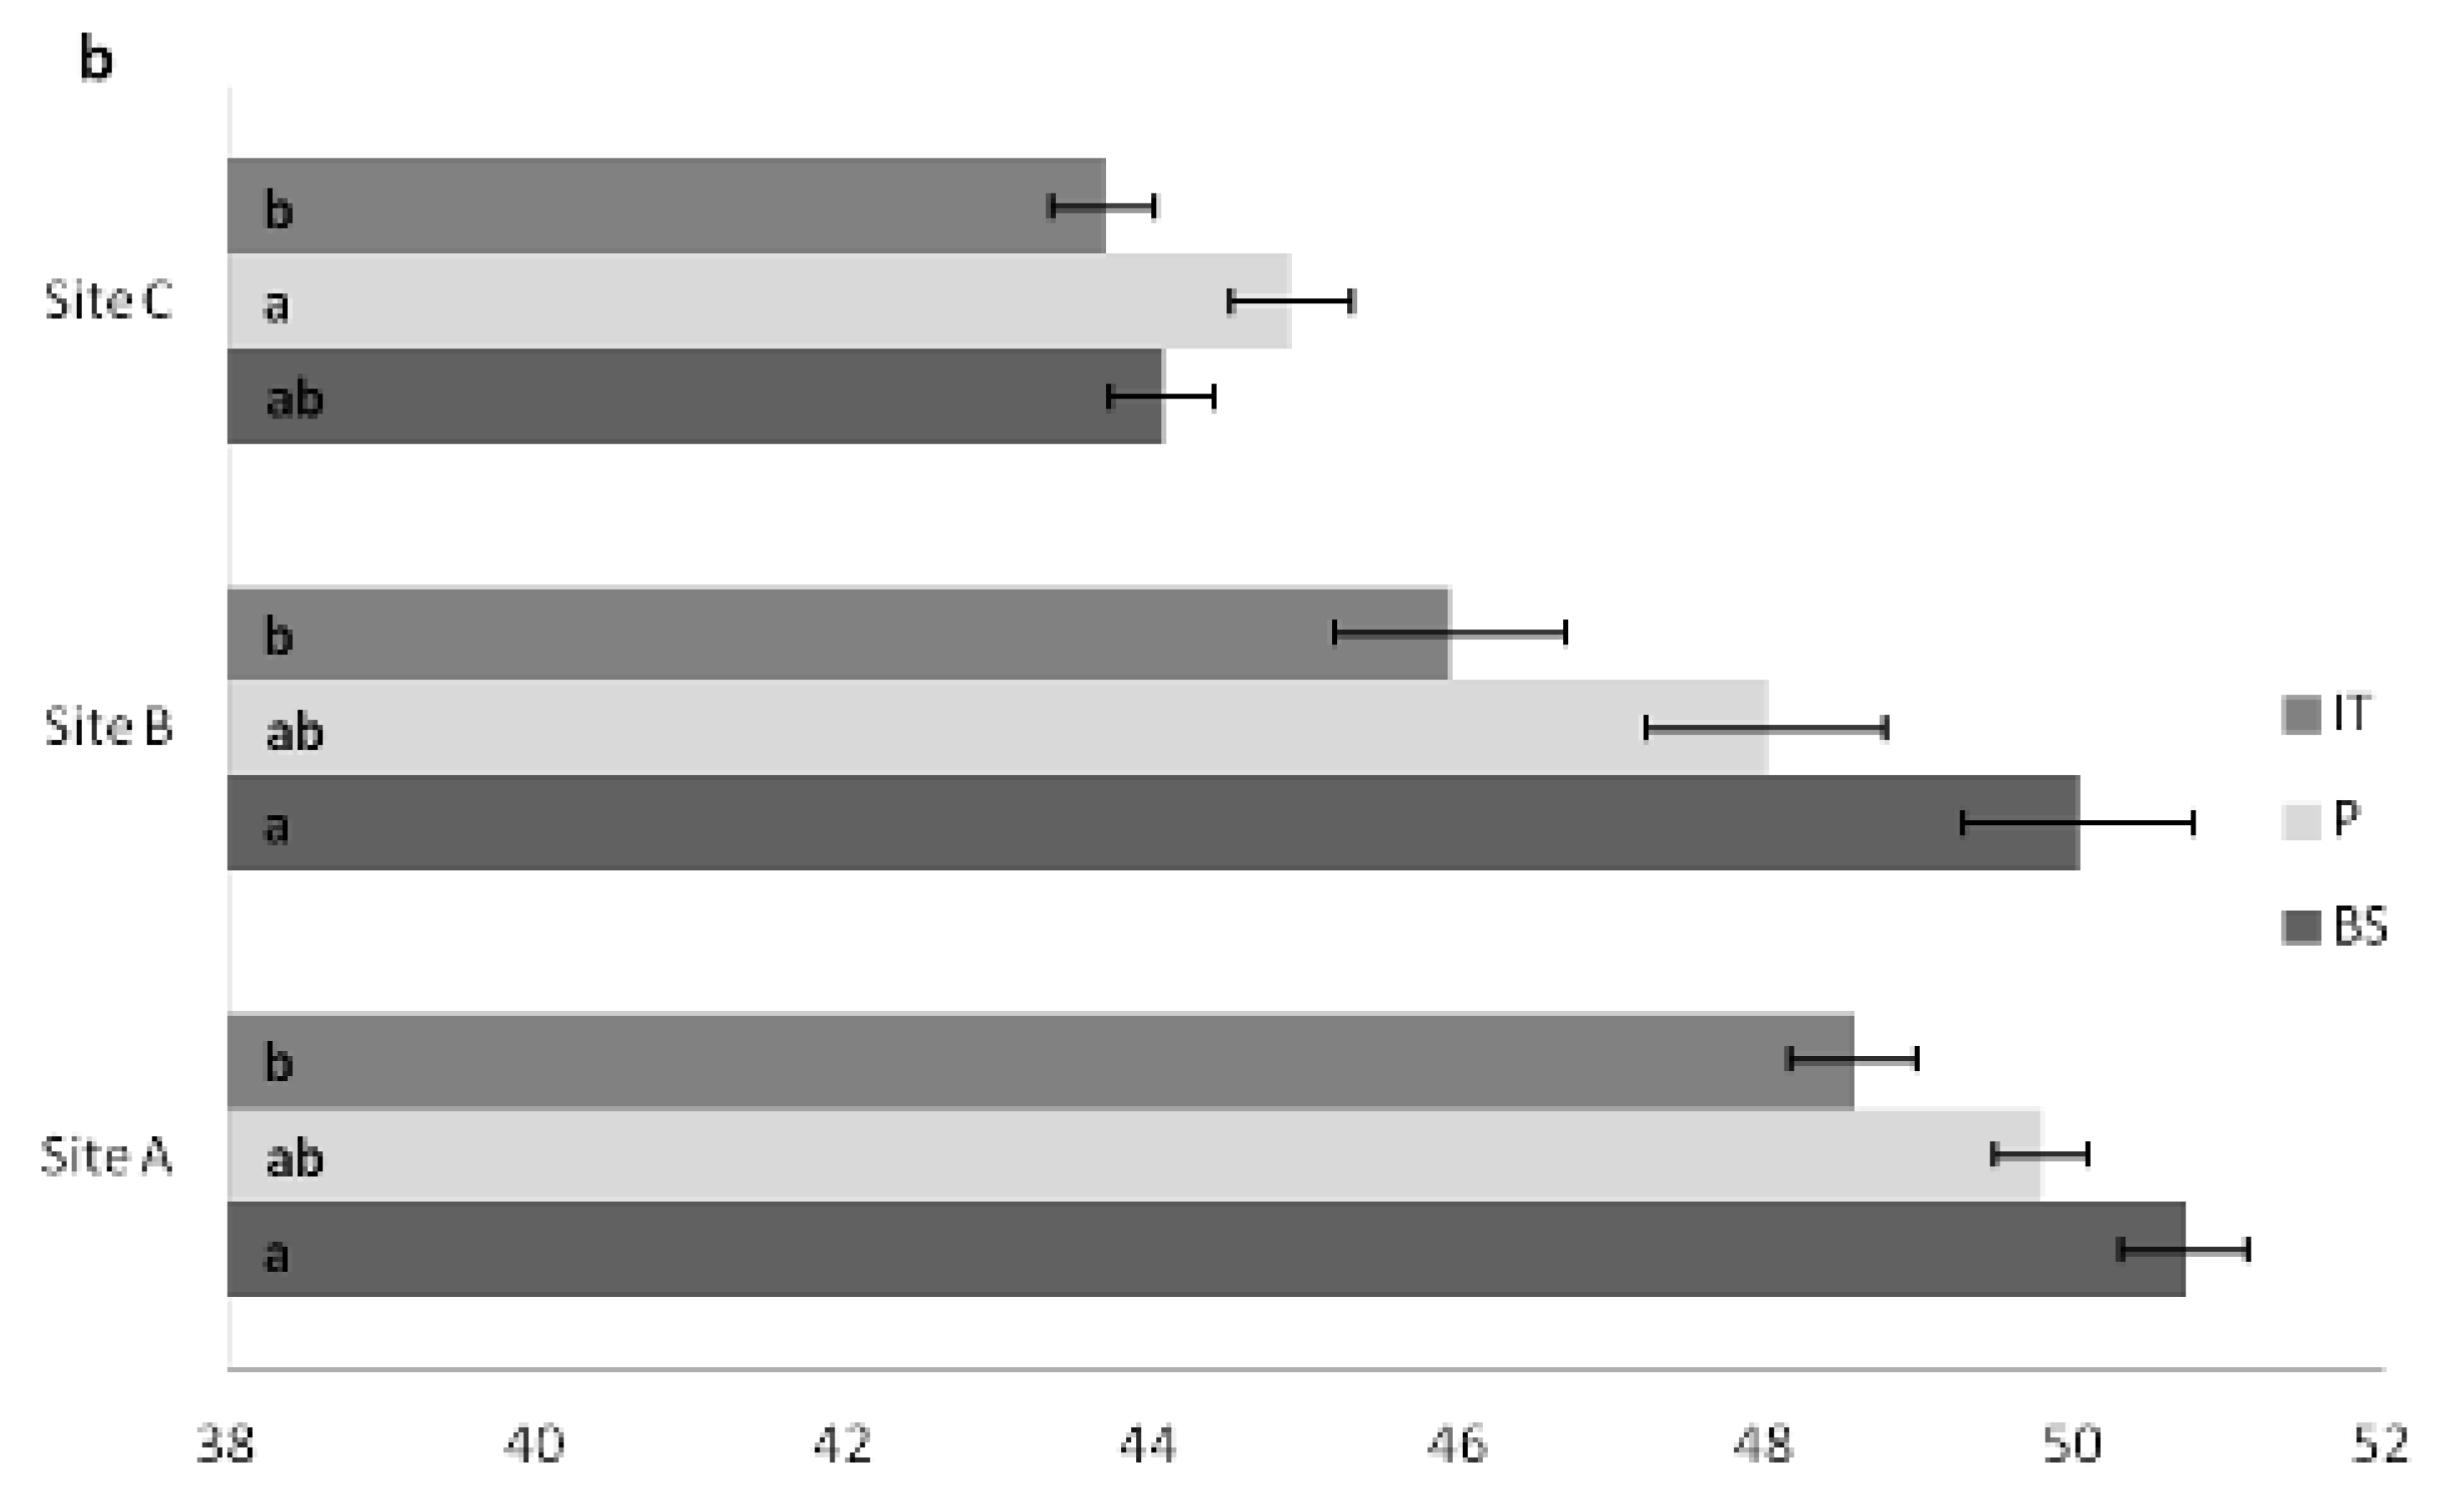
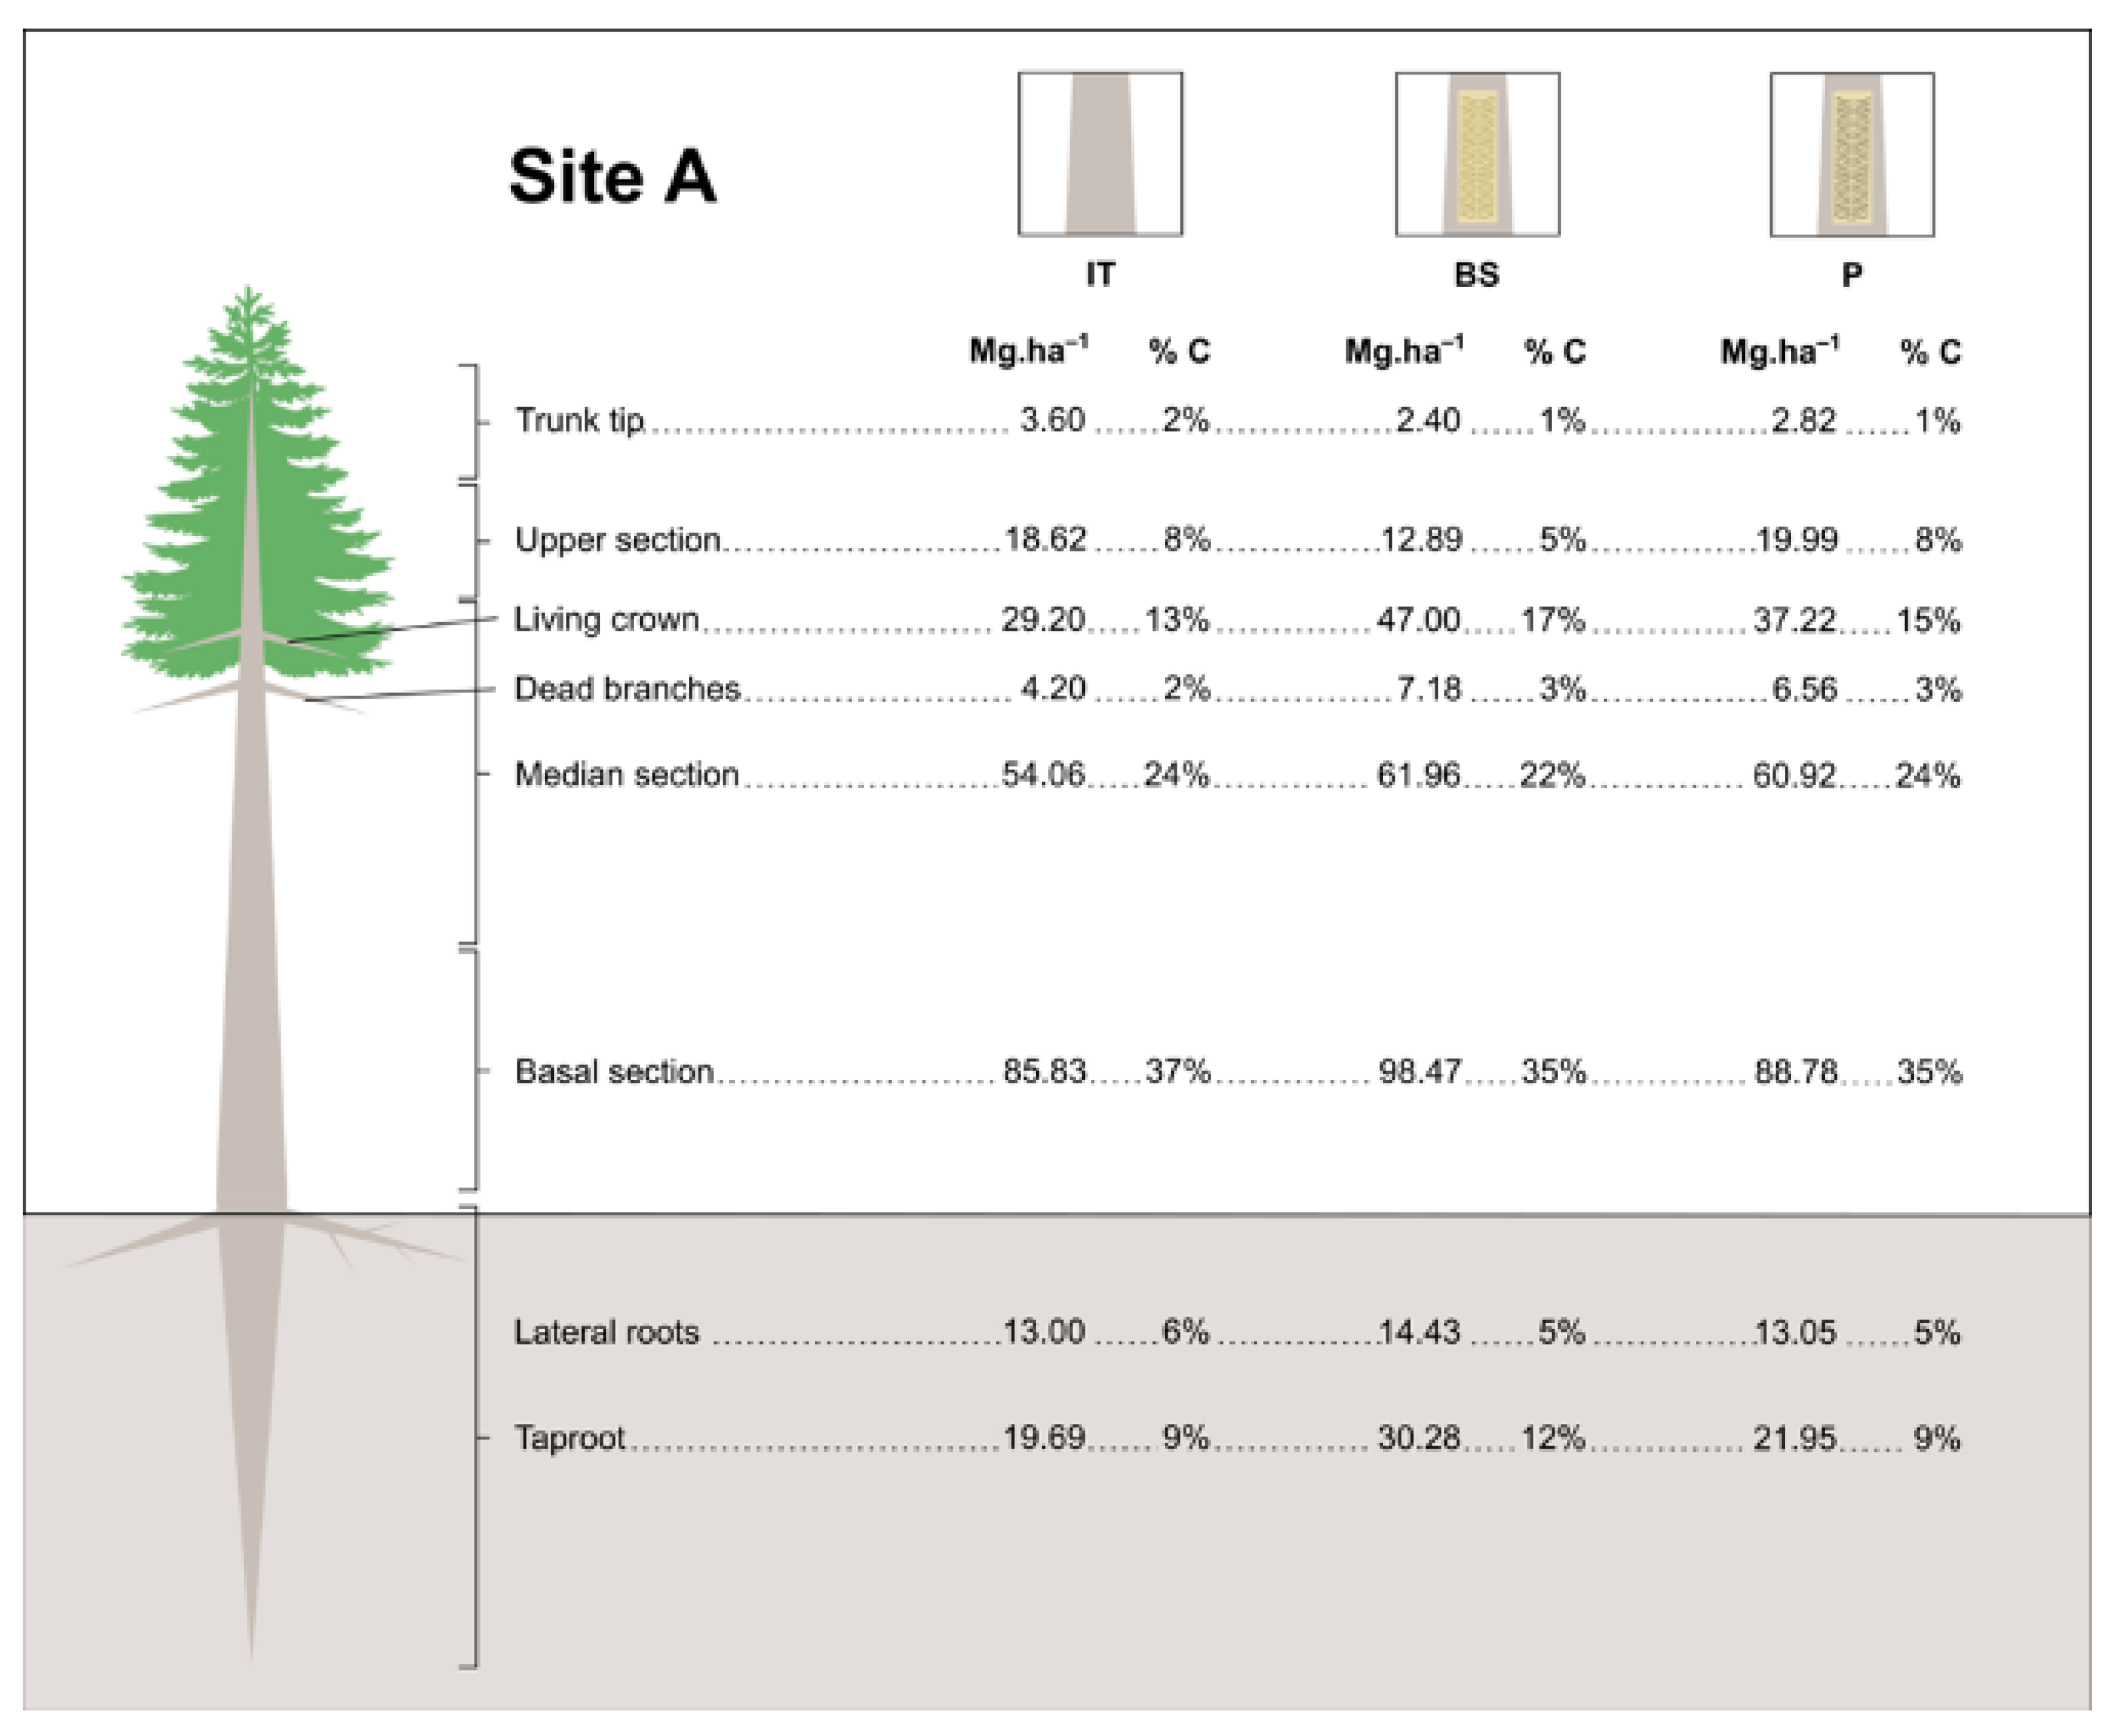
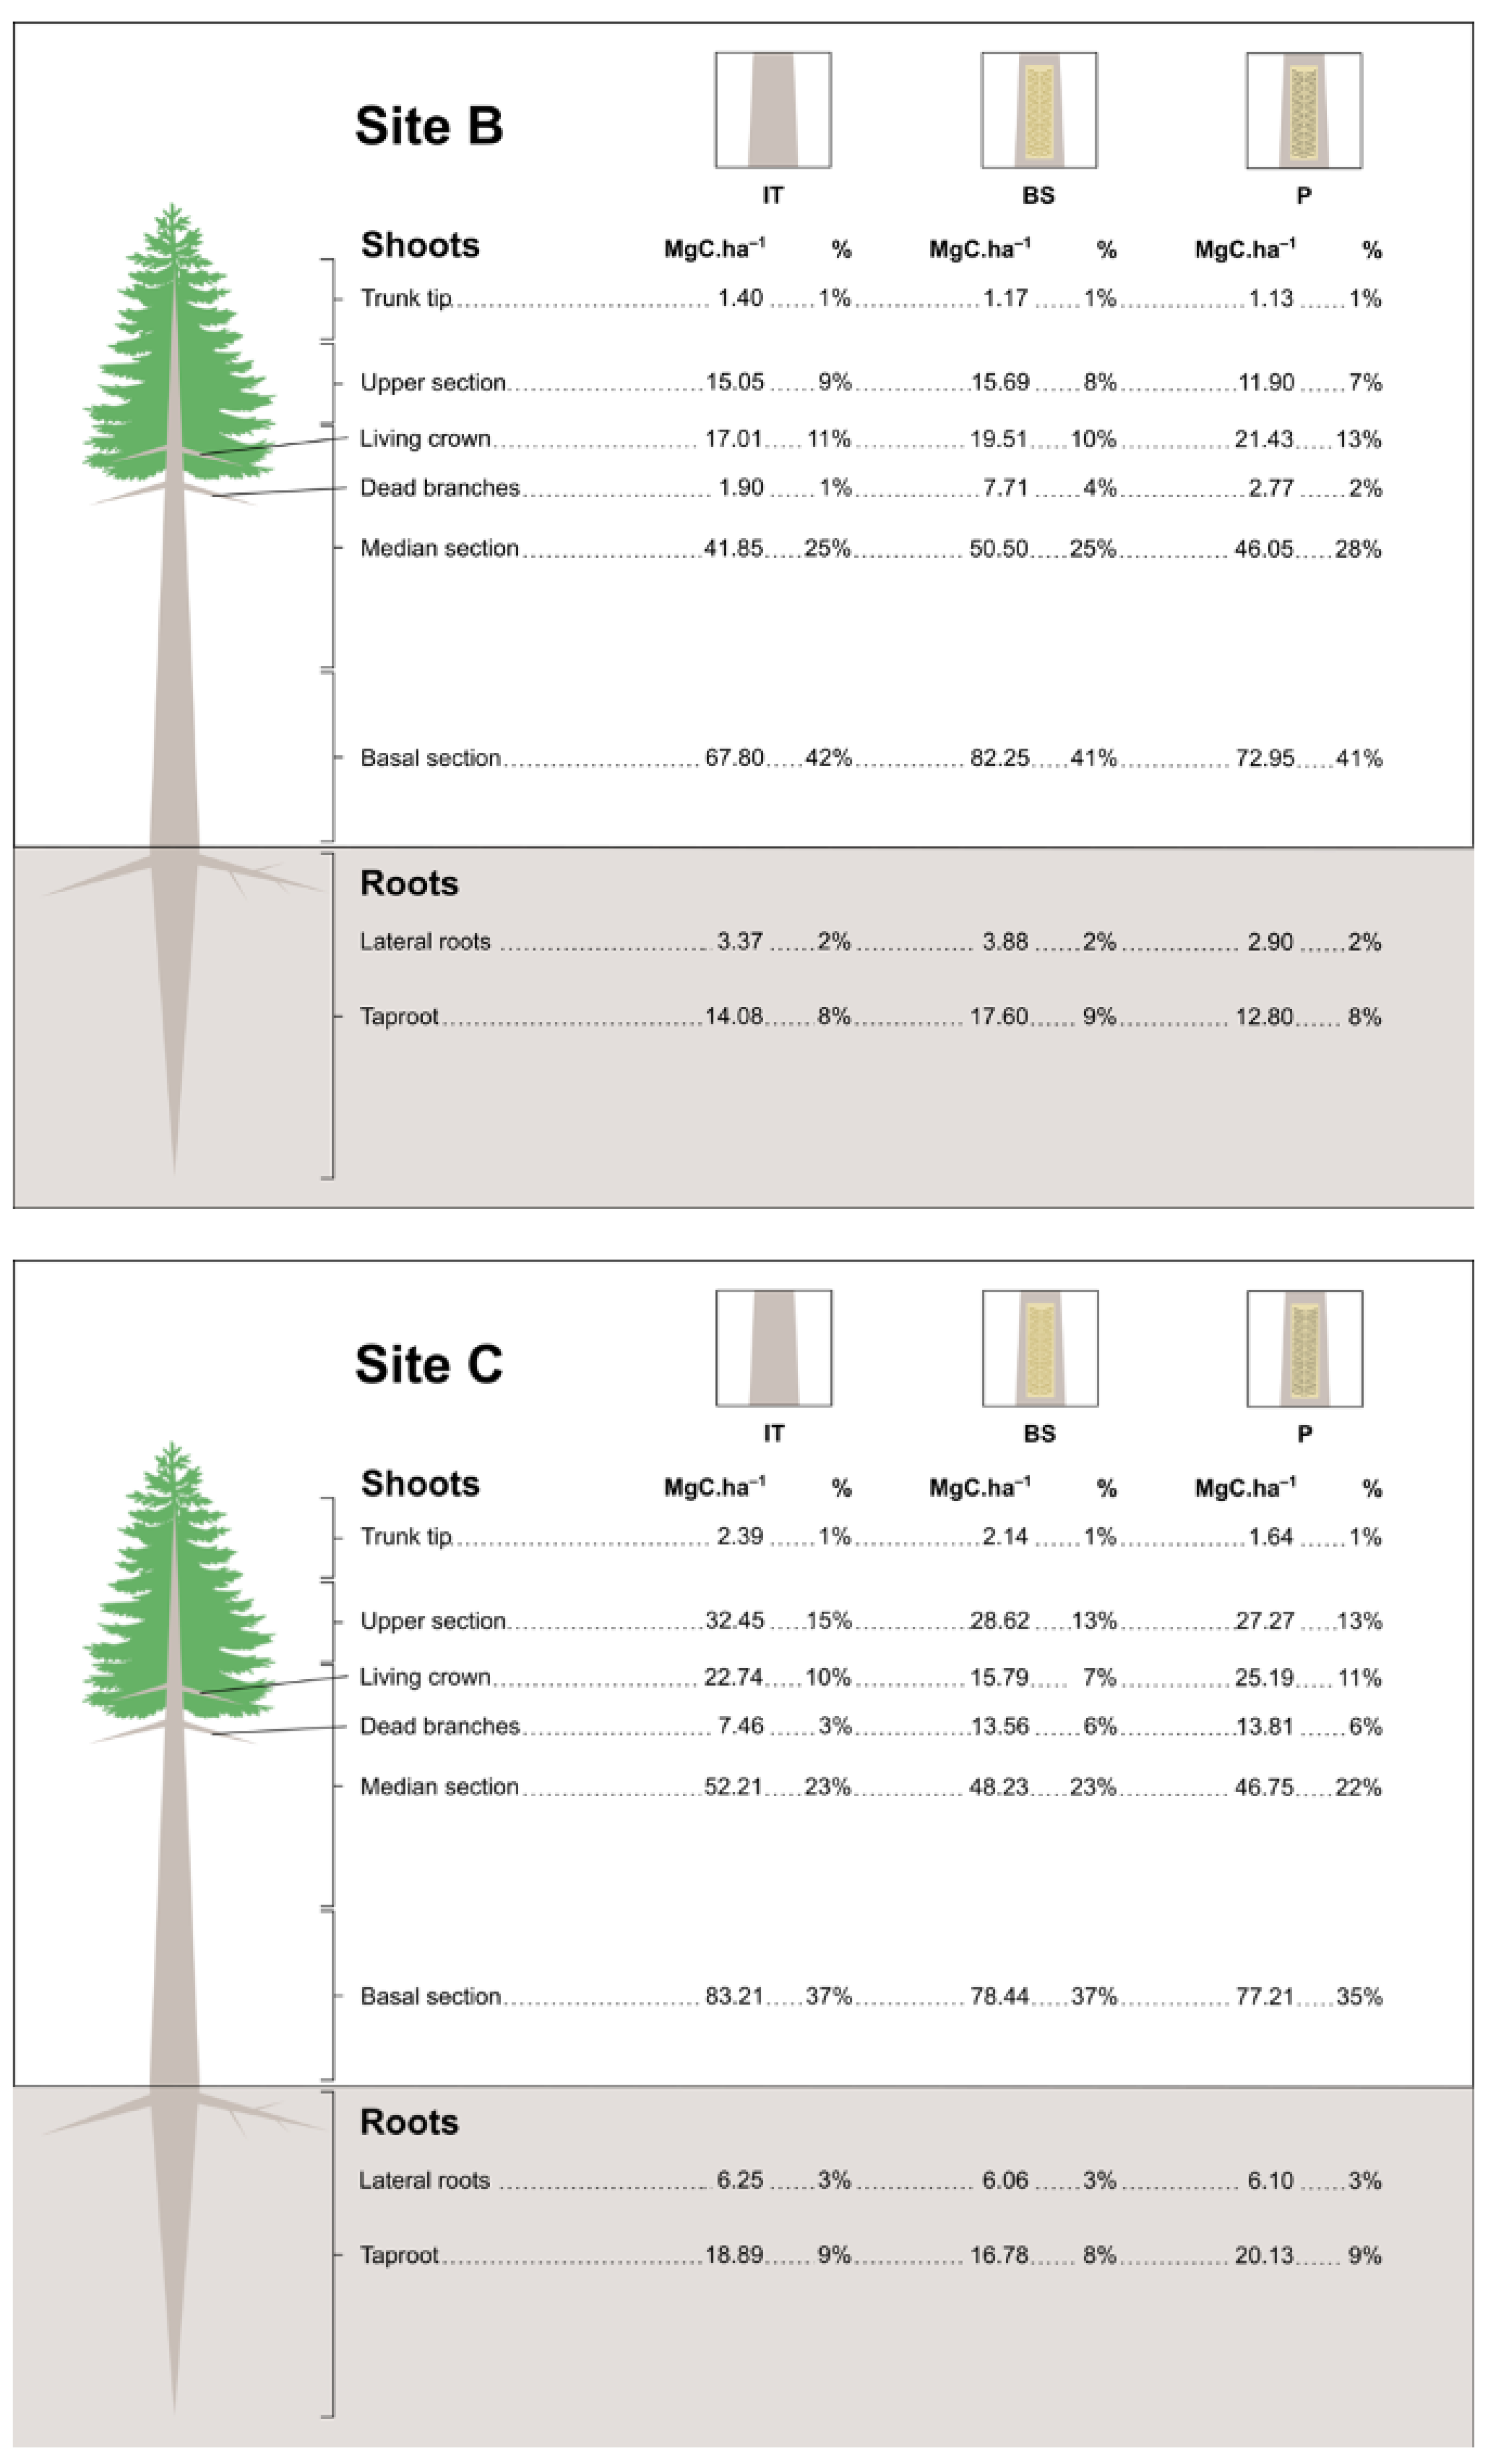
3.3. Carbon Content in Plant Tissues
3.4. Estimates of Carbon Stock in Resin Biomass
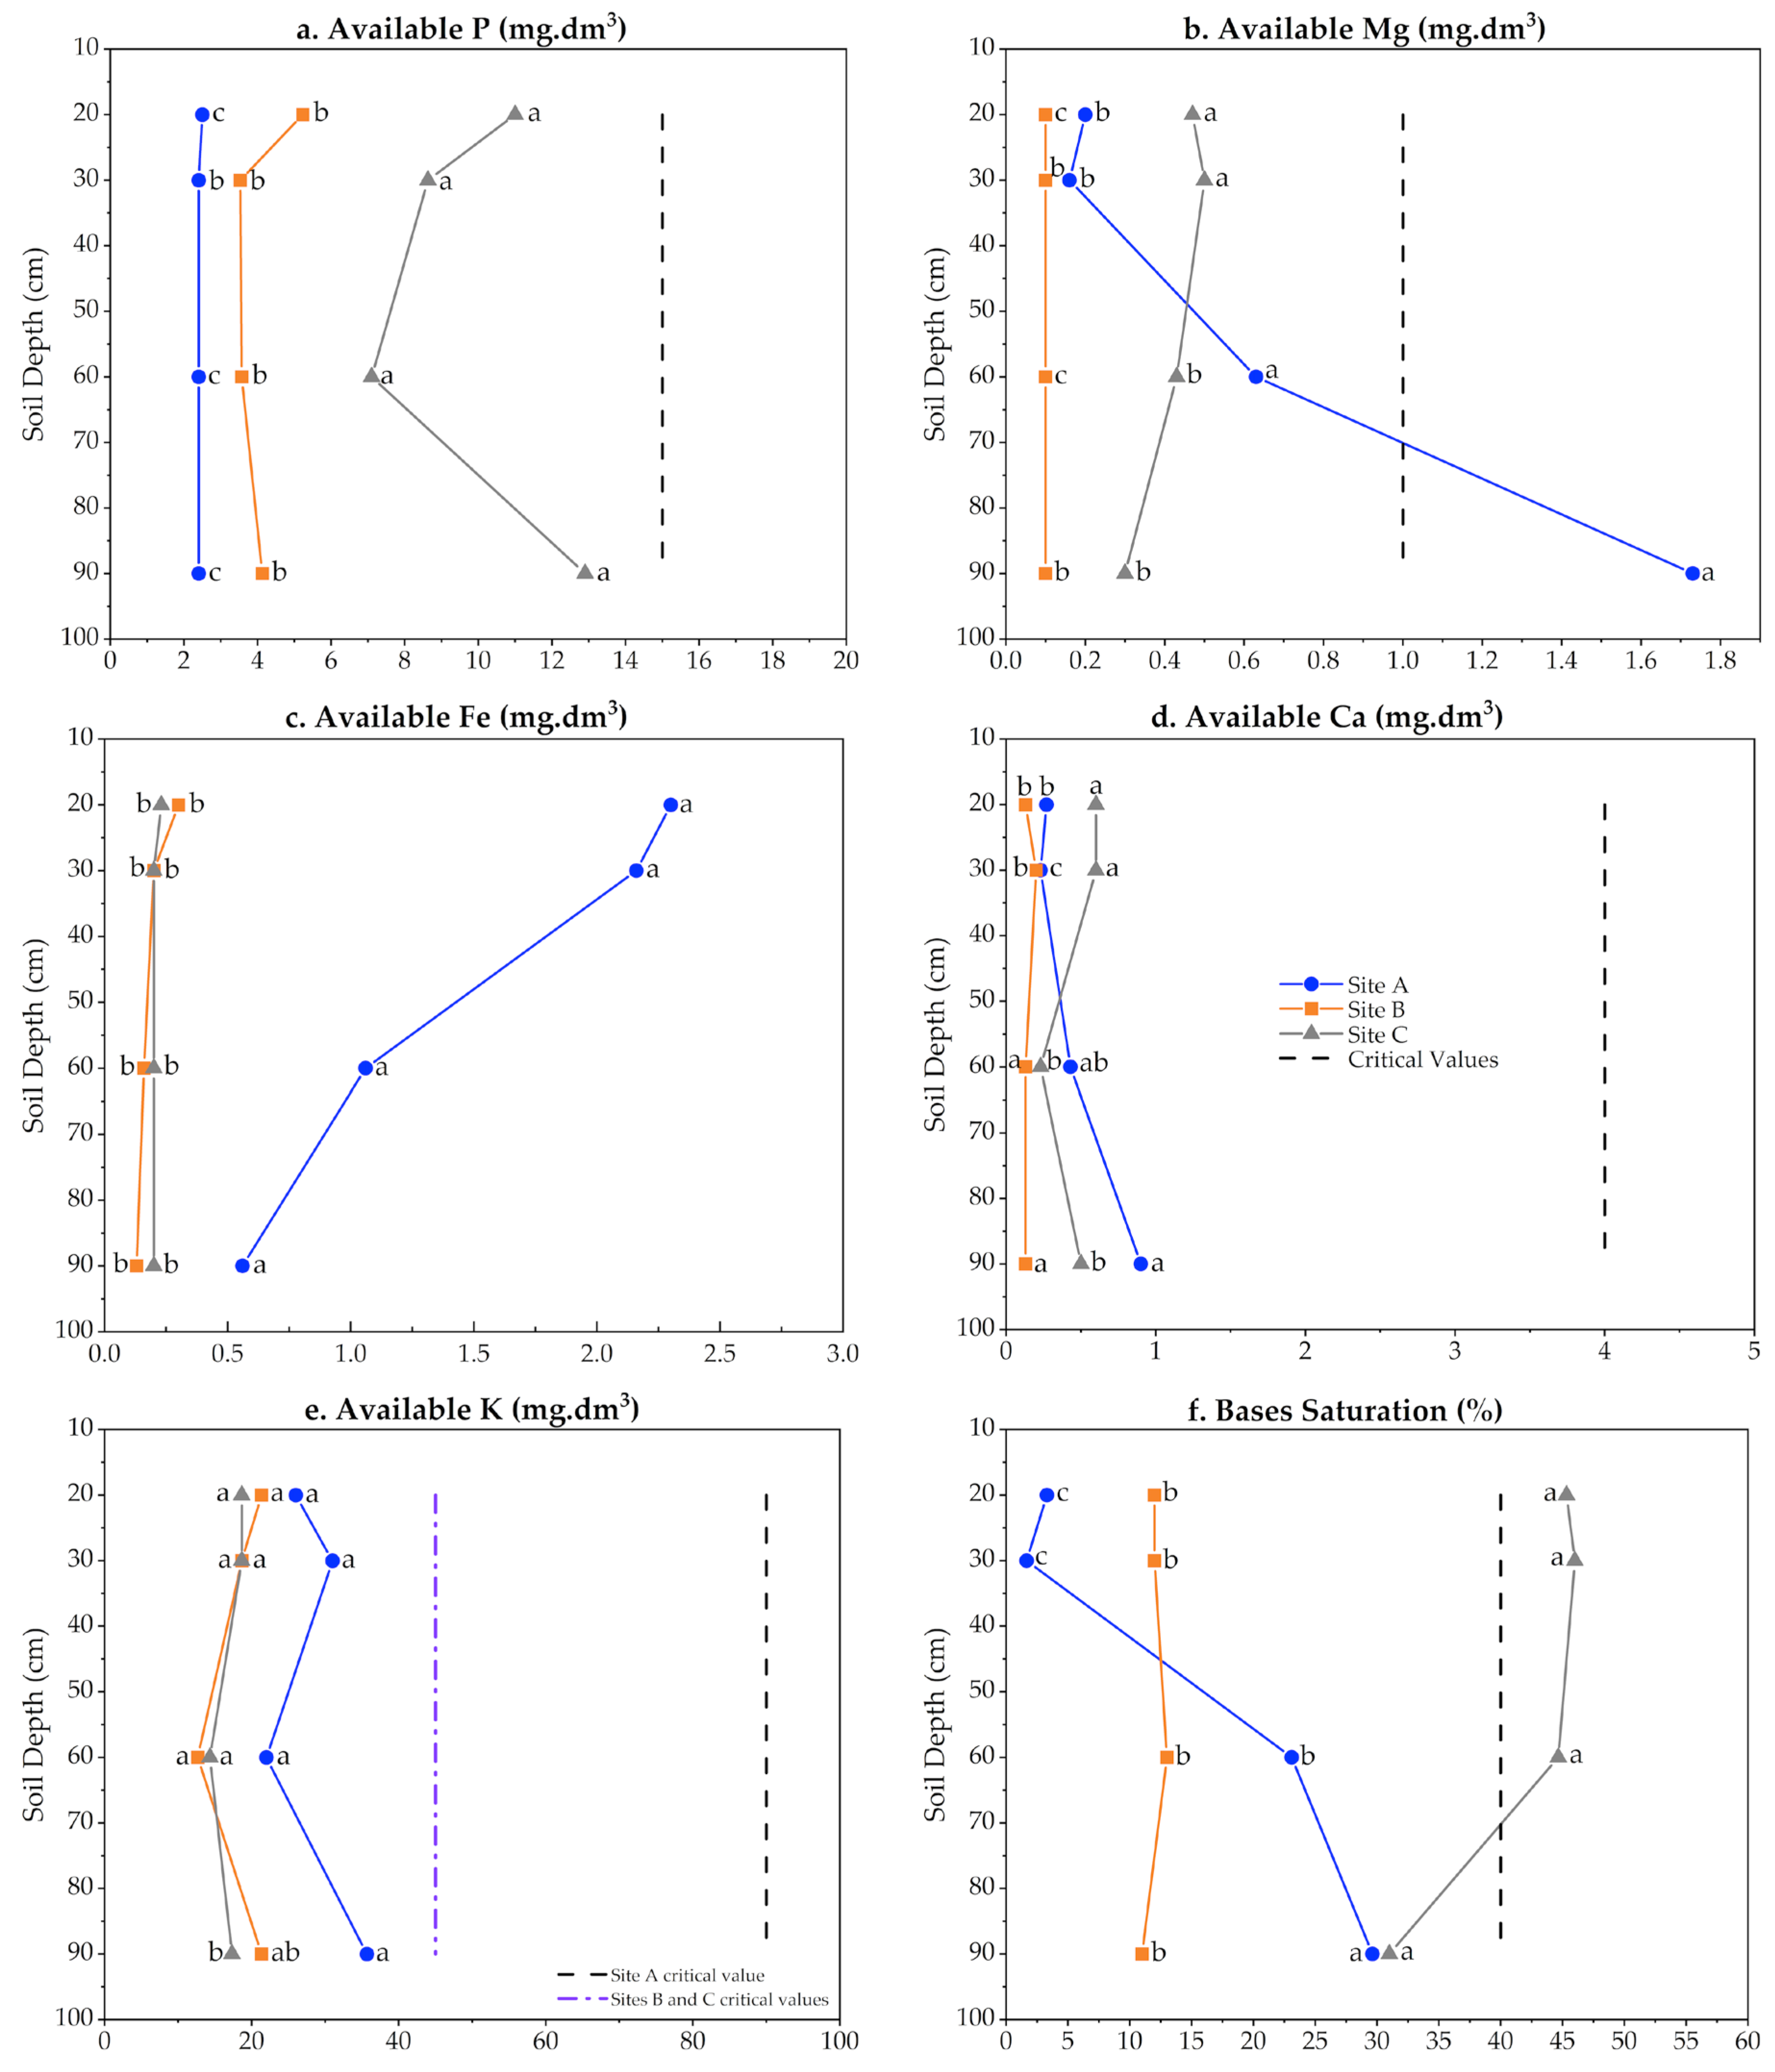
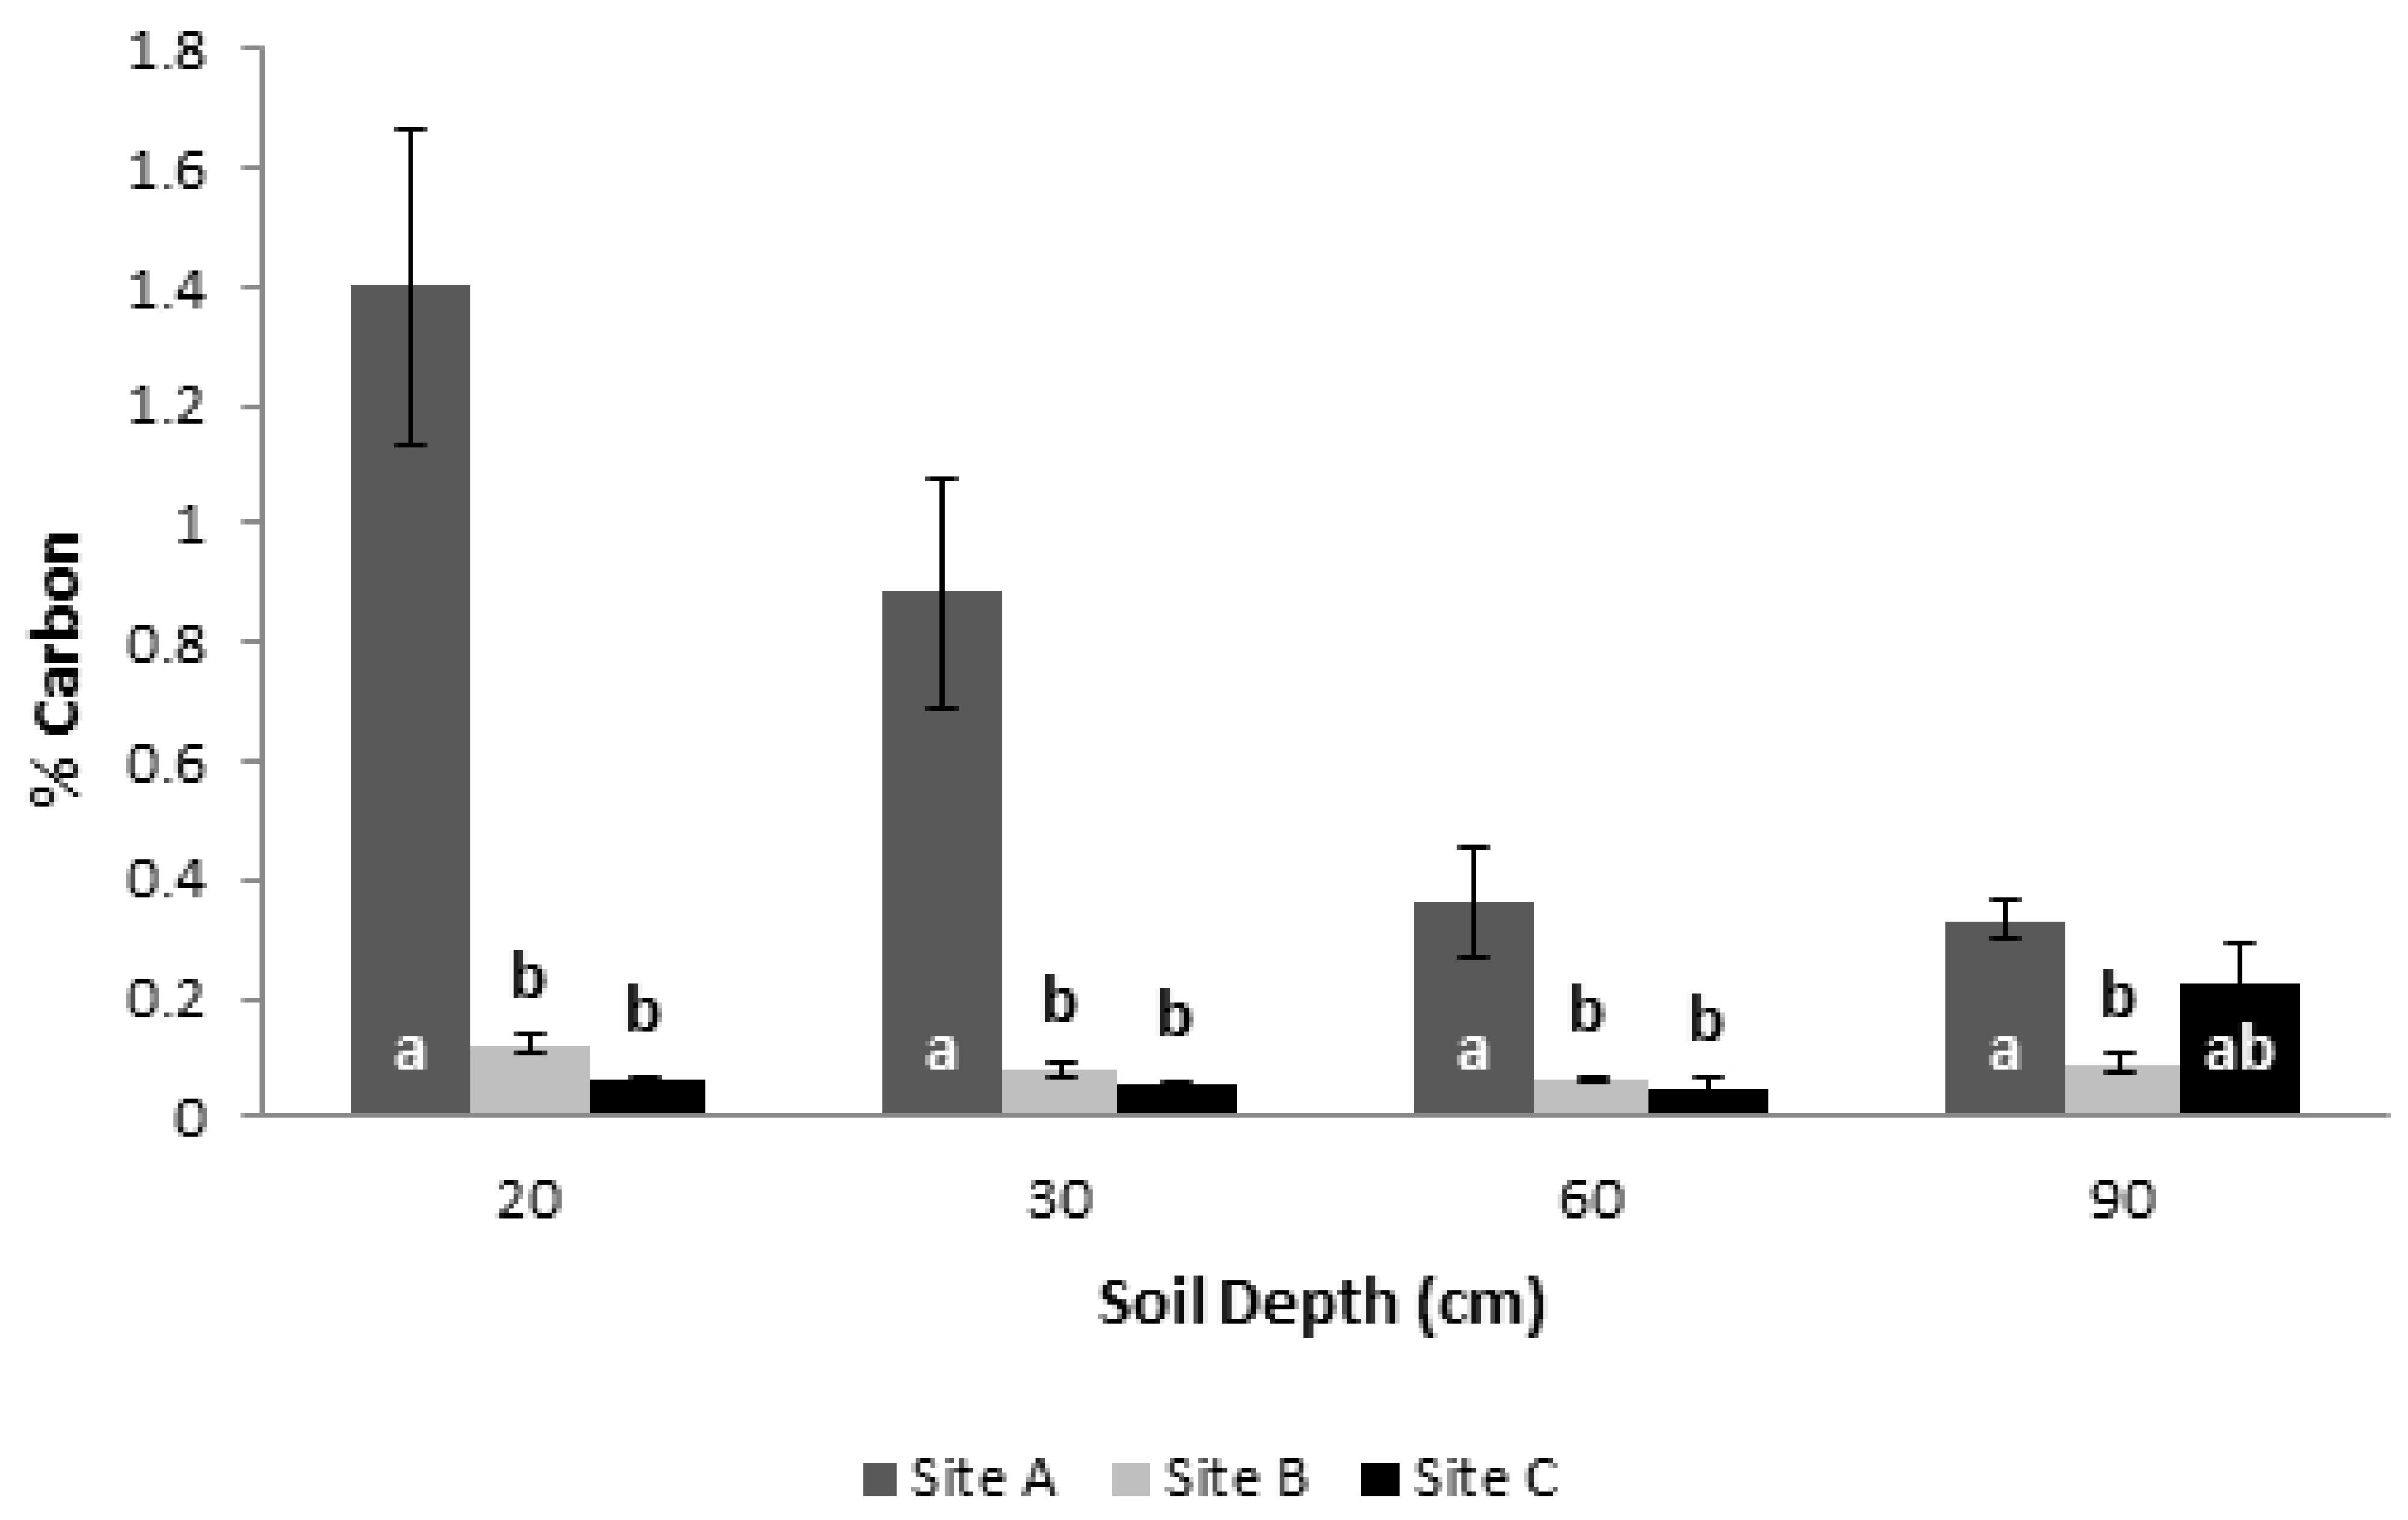
3.5. Soil Physicochemical Characterization and Its Carbon Content
4. Discussion
4.1. General Considerations
4.2. Biomass Aspects
4.3. Carbon Ratio
4.4. Water Availability
4.5. Edaphic Factors
4.6. Resin Yield
4.7. Tree Development
4.8. Silviculture, Landscape Management, and Policy
5. Conclusions
Supplementary Materials
Author Contributions
Funding
Institutional Review Board Statement
Informed Consent Statement
Data Availability Statement
Acknowledgments
Conflicts of Interest
References
- Shukla, P.R.; Skea, J.; Calvo Buendia, E.; Masson-Delmotte, V.; Pörtner, H.-O.; Roberts, D.C.; Zhai, P.; Slade, R.; Connors, S.; van Diemen, R.; et al. Climate Change and Land: An IPCC Special Report on Climate Change, Desertification, Land Degradation, Sustainable Land Management, Food Security, and Greenhouse Gas Fluxes in Terrestrial Ecosystems; IPCC: Geneva, Switzerland, 2019; 874p. [Google Scholar]
- Karjalainen, T. Dynamics and potentials of carbon sequestration in managed stands and wood products in Finland under changing climatic conditions. Forest Ecol. Manag. 1996, 80, 113–132. [Google Scholar] [CrossRef]
- Parajuli, R.; Chang, S.J. Carbon sequestration and uneven-aged management of loblolly pine stands in the southern USA: A joint optimization approach. Forest Policy Econ. 2012, 22, 65–71. [Google Scholar] [CrossRef] [Green Version]
- Karjalainen, T. The carbon sequestration potential of unmanaged forest stands in Finland under changing climatic conditions. Biomass Bioenergy 1996, 10, 313–329. [Google Scholar] [CrossRef]
- Powers, M.D.; Kolka, R.K.; Bradford, J.B.; Palik, B.J.; Fraver, S.; Jurgensen, M.F. Carbon stocks across a chronosequence of thinned and unmanaged red pine (Pinus resinosa) stands. Ecol. Appl. 2012, 22, 1297–1307. [Google Scholar] [CrossRef] [Green Version]
- Chen, Z.; Yu, G.; Wang, Q. Effects of climate and forest age on the ecosystem carbon exchange of afforestation. J. For. Res. 2020, 31, 365–374. [Google Scholar] [CrossRef] [Green Version]
- Rumney, R.H.M.; Preston, M.D.; Jones, T.; Basiliko, N.; Gunn, J. Soil amendment improves carbon sequestration by trees on severely damaged acid and metal impacted landscape, but total storage remains low. For. Ecol. Manag. 2021, 483, 118896. [Google Scholar] [CrossRef]
- Coyle, D.R.; Coleman, M.D.; Aubrey, D.P. Above- and below-ground biomass accumulation, production, and distribution of sweetgum and loblolly pine grown with irrigation and fertilization. Can. J. For. Res. 2008, 38, 1335–1348. [Google Scholar] [CrossRef] [Green Version]
- Rodrigues-Corrêa, K.C.S.; de Lima, J.C.; Fett-Neto, A.G. Pine resin: Tapping green chemicals, biofuels, food protection, and carbon sequestration from multipurpose trees. Food Energy Secur. 2012, 1, 81–93. [Google Scholar] [CrossRef]
- Ali, A.; Ashraf, M.I.; Gulzar, S.; Akmal, M.; Ahmad, B. Estimation of soil carbon pools in the forests of Khyber Pakhtunkhwa Province, Pakistan. J. For. Res. 2020, 31, 2313–2321. [Google Scholar] [CrossRef] [Green Version]
- Rodrigues-Corrêa, K.C.S.; Fett-Neto, A.G. Seasonality, and chemical elicitation of defense resin production in field-grown slash pine under subtropical climate. Theor. Exp. Plant Physiol. 2013, 25, 56–61. [Google Scholar] [CrossRef]
- Zas, R.; Quiroga, R.; Touza, R.; Vazquez-González, C.; Sampedro, L.; Lema, M. Resin tapping potential of Atlantic maritime pine forests depends on tree age and timing of tapping. Ind. Crops Prod. 2020, 157, 112940. [Google Scholar] [CrossRef]
- Demko, J.; Machava, J. Tree resin, a macroergic source of energy, a possible tool to lower the rise in atmospheric CO2 levels. Sustainability 2022, 14, 3506. [Google Scholar] [CrossRef]
- Rodrigues, K.C.S.; Azevedo, P.C.N.; Sobreiro, L.E.; Pelissari, P.; Fett-Neto, A.G. Resin yield of Pinus elliottii plantations in a subtropical climate: Effect of tree diameter, wound shape, and concentration of active adjuvants in resin stimulating paste. Ind. Crops Prod. 2008, 27, 322–327. [Google Scholar] [CrossRef]
- Rodrigues, K.C.S.; Fett-Neto, A.G. Resin yield of Pinus elliottii in a subtropical climate: Seasonal variation and effect of auxin and salicylic acid-based stimulant paste. Ind. Crops Prod. 2009, 30, 316–320. [Google Scholar] [CrossRef]
- Rodrigues, K.C.S.; Apel, M.A.; Henriques, A.T.; Fett-Neto, A.G. Efficient resin biomass production in pines using low-cost metal containing stimulant paste. Biomass Bioenergy 2011, 35, 4442–4448. [Google Scholar] [CrossRef]
- Rodríguez-García, A.; Martín, J.A.; López, R.; Sanz, A.; Gil, L. Effect of four tapping methods on anatomical traits and resin yield in Maritime pine (Pinus pinaster Ait.). Ind. Crops Prod. 2016, 86, 143–154. [Google Scholar] [CrossRef]
- Neis, F.A.; de Costa, F.; Füller, T.N.; de Lima, J.C.; Rodrigues-Corrêa, K.C.S.; Fett, J.P.; Fett-Neto, A.G. Biomass yield of resin in adult Pinus elliottii Engelm. trees is differentially regulated by environmental factors and biochemical effectors. Ind. Crops Prod. 2018, 118, 20–25. [Google Scholar] [CrossRef]
- Junkes, C.F.O.; Araújo Júnior, A.T.; de Lima, J.C.; de Costa, F.; Füller, T.; Almeida, M.R.A.; Neis, F.A.; Rodrigues-Corrêa, K.C.S.; Almeida; Fett, J.P.; et al. Resin tapping transcriptome in adult slash pine (Pinus elliottii var. elliottii). Ind. Crops Prod. 2019, 139, 111545. [Google Scholar] [CrossRef]
- Mirov, N.T. Composition of Gum Turpentines of Pines, Technical Bulletin No. 1239; United States Department of Agriculture: Washington, DC, USA, 1961; 158p. [Google Scholar]
- Langenheim, J.H. Plant Resins: Chemistry, Evolution, Ecology, and Ethnobotany; Timber Press: Portland, OR, USA, 2003; 612p. [Google Scholar]
- Ross, D.W.; Walstad, J.D. Estimating Aboveground Biomass of Shrubs and Young Ponderosa and Lodgepole Pines in Southcentral Oregon, Research Bulletin 57; Oregon State University: Corvallis, OR, USA, 1986; 12p. [Google Scholar]
- Brown, S.; Gillespie, A.J.R.; Lugo, A.E. Biomass estimation methods for tropical forests with applications to forest inventory data. Forest Sci. 1989, 35, 881–902. [Google Scholar] [CrossRef]
- Ter-Mikaelian, M.T.; Korzukhin, M.D. Biomass equations for sixty-five North American tree species. Forest Ecol. Manag. 1997, 97, 1–24. [Google Scholar] [CrossRef] [Green Version]
- Fang, J.-Y.; Wang, Z.M. Forest biomass estimation at regional and global levels, with special reference to China’s forest biomass. Ecol. Res. 2001, 16, 587–592. [Google Scholar] [CrossRef]
- Law, B.E.; Thornton, P.E.; Irvine, J.; Anthoni, P.M.; Tuyl, S.V. Carbon storage and fluxes in ponderosa pine forests at different developmental stages. Glob. Chang. Biol. 2001, 7, 755–777. [Google Scholar] [CrossRef]
- Shan, J.; Morris, L.A.; Hendrick, R.L. The effects of management on soil and plant carbon sequestration in slash pine plantations. J. Appl. Ecol. 2001, 38, 932–941. [Google Scholar] [CrossRef]
- Pussinen, A.; Karjalainen, T.; Mäkipää, R.; Valsta, L.; Kellomäki, S. Forest carbon sequestration and harvests in Scots pine stand under different climate and nitrogen deposition scenarios. For. Ecol. Manag. 2002, 158, 103–115. [Google Scholar] [CrossRef]
- Stainback, G.A.; Alavalapati, J.R.R. Economic analysis of slash pine forest carbon sequestration in the southern U.S. J. For. Econ. 2002, 8, 105–117. [Google Scholar] [CrossRef] [Green Version]
- Jenkins, J.C.; Chojnacky, D.C.; Heath, L.S.; Birdsey, R.A. National-scale biomass estimators for United States tree species. Forest Sci. 2003, 49, 12–35. [Google Scholar] [CrossRef]
- Masera, E.R.; Garza-Caligaris, J.F.; Kanninen, M.; Karjalainen, T.; Liski, J.; Nabuurs, G.J.; Pussinen, A.; de Jong, B.H.J.; Mohren, G.M.J. Modeling carbon sequestration in afforestation, agroforestry and forest management projects: The CO2FIX V.2 approach. Ecol. Modell. 2003, 164, 177–199. [Google Scholar] [CrossRef]
- Bert, D.; Danjon, F. Carbon concentration variations in the roots, stem and crown of mature Pinus pinaster (Ait.). For. Ecol. Manag. 2006, 222, 279–295. [Google Scholar] [CrossRef]
- Návar, J. Allometric equations for tree species and carbon stocks for forests of northwestern Mexico. For. Ecol. Manag. 2009, 257, 427–434. [Google Scholar] [CrossRef]
- Bi, H.; Long, Y.; Turner, J.; Lei, Y.; Snowdon, P.; Li, Y.; Harper, R.; Zerihun, A.; Ximenes, F. Additive prediction of aboveground biomass for Pinus radiata (D. Don) plantations. For. Ecol. Manag. 2010, 259, 2301–2314. [Google Scholar] [CrossRef]
- Cao, T.; Valst, L.; Mäkelä, A. A comparison of carbon assessment methods for optimizing timber production and carbon sequestration in Scots pine stands. For. Ecol. Manag. 2010, 260, 1726–1734. [Google Scholar] [CrossRef]
- Gonzalez-Benecke, C.A.; Samuelson, L.J.; Martin, T.A.; Cropper, W.P., Jr.; Johnsen, K.H.; Stokes, T.A.; Butnor, J.R.; Anderson, P.H. Modeling the effects of forest management on in situ and ex situ longleaf pine forest carbon stocks. For. Ecol. Manag. 2015, 355, 24–36. [Google Scholar] [CrossRef] [Green Version]
- Jagodziński, A.M.; Dyderski, M.K.; Gęsikiewicz, K.; Horodecki, P.; Cysewska, A.; Wierczyńska; Maciejczyk, K. How do tree stand parameters affect young Scots pine biomass?–Allometric equations and biomass conversion and expansion factors. For. Ecol. Manag. 2018, 409, 74–83. [Google Scholar] [CrossRef]
- Aubrey, D.P.; Blake, J.I.; Zarnoch, S.J. From farms to forests: Landscape carbon balance after 50 years of afforestation, harvesting, and prescribed fire. Forests 2019, 10, 760. [Google Scholar] [CrossRef] [Green Version]
- Kondo, M.; Patra, P.K.; Sitch, S.; Friedlingstein, P.; Poulter, B.; Chevallier, F.; Cias, P.; Canadell, J.G.; Bastos, A.; Lauerwald, R.; et al. State of the science in reconciling top-down and bottom-up approaches for terrestrial CO2 budget. Glob. Chang. Biol. 2019, 26, 1068–1084. [Google Scholar] [CrossRef]
- Lin, Y.; Jaakkola, A.; Hyyppä, J.; Kaartinen, H. From TLS to VLS: Biomass estimation at individual tree level. Remote Sens. 2010, 2, 1864–1879. [Google Scholar] [CrossRef] [Green Version]
- Navarrete-Poyatos, M.A.; Navarro-Cerrillo, R.M.; Lara-Gómez, M.A.L.; Duque-Lazo, J.; Varo, M.L.A.; Rodriguez, G.P. Assessment of the carbon stock in pine plantations in southern Spain through ALS data and K-nearest neighbor algorithm based. Geosciences 2019, 9, 442. [Google Scholar] [CrossRef] [Green Version]
- Peichl, M.; Arain, M.A. Allometry and partitioning of above- and belowground tree biomass in an age-sequence of white pine forests. For. Ecol. Manag. 2007, 253, 68–80. [Google Scholar] [CrossRef]
- Dube, T.; Mutanga, O. Quantifying the variability and allocation patterns of aboveground carbon stocks across plantation forest types, structural attributes and age in sub-tropical coastal region of KwaZulu Natal, South Africa using remote sensing. Appl. Geogr. 2015, 64, 55–65. [Google Scholar] [CrossRef]
- Park, A. Carbon storage and stand conversion in a pine-dominated boreal forest landscape. For. Ecol. Manag. 2015, 340, 70–81. [Google Scholar] [CrossRef]
- McElligott, K.M.; Seiler, J.R.; Strahm, B.D. Partitioning soil respiration across four age classes of loblolly pine (Pinus taeda L.) on the Virginia Piedmont. For. Ecol. Manag. 2016, 378, 173–180. [Google Scholar] [CrossRef] [Green Version]
- Zhang, X.; Zhang, X.; Han, H.; Shi, Z.; Yang, X. Biomass accumulation and carbon sequestration in an age-sequence of Mongolian pine plantations in Horqin Sandy Land, China. Forests 2019, 10, 197. [Google Scholar] [CrossRef] [Green Version]
- Aspinwall, M.J.; King, J.S.; McKeand, S.E.; Bullock, B.P. Genetic effects on stand-level uniformity and above- and belowground dry mass reduction in juvenile loblolly pine. For. Ecol. Manag. 2011, 262, 609–619. [Google Scholar] [CrossRef]
- Balboa-Murias, M.A.; Rodríguez-Soalleiro, R.; Merino, A.; Álvarez-González, J.G. Temporal variations and distribution of carbon stocks in aboveground biomass of radiata pine and maritime pine pure stands under different silvicultural alternatives. For. Ecol. Manag. 2006, 237, 29–38. [Google Scholar] [CrossRef]
- Noormets, A.; Epron, D.; Domec, J.C.; McNulty, S.G.; Fox, T.; Sun, G.; King, J.S. Effects of forest management on productivity and carbon sequestration: A review and hypothesis. For. Ecol. Manag. 2015, 355, 124–140. [Google Scholar] [CrossRef] [Green Version]
- Brown, S. Measuring carbon in forests: Current status and future challenges. Environ. Pollut. 2002, 116, 363–372. [Google Scholar] [CrossRef]
- Liu, N.; Nan, H. Carbon stocks of three secondary coniferous forests along an altitudinal gradient on Loess Plateau in inland China. PLoS ONE 2018, 13, e0196927. [Google Scholar] [CrossRef] [Green Version]
- Bauer, G.A.; Bazzaz, F.A.; Minocha, R.; Long, S.; Magill, A.; Aber, J.; Berntson, G.M. Effects of chronic N additions on tissue chemistry, photosynthetic capacity, and C sequestration potential of a red pine (Pinus resinosa Ait.) stand in the NE United States. For. Ecol. Manag. 2004, 196, 173–186. [Google Scholar] [CrossRef]
- Hernández, J.; del Pino, A.; Vance, E.D.; Califra, A.; Del Giorgio, F.; Martínez, L.; González-Barrios, P. Eucalyptus and Pinus stand density effects on soil carbon sequestration. For. Ecol. Manag. 2016, 368, 28–38. [Google Scholar] [CrossRef]
- Pietrzykowski, M.; Daniels, W.L. Estimation of carbon sequestration by pine (Pinus sylvestris L.) ecosystems developed on reforested post-mining sites in Poland on differing mine soil substrates. Ecol. Eng. 2014, 73, 209–218. [Google Scholar] [CrossRef]
- Sanquetta, C.R.; Corte, A.P.; Silva, F. Biomass expansion factor and root-to-shoot ratio for Pinus in Brazil. Carbon Balance Manag. 2011, 6, 6. [Google Scholar] [CrossRef] [Green Version]
- Clough, B.J.; Russell, M.B.; Domke, G.M.; Woodall, C.W. Quantifying allometric model uncertainty for plot-level live tree biomass stocks with a data-driven, hierarchical framework. For. Ecol. Manag. 2016, 372, 175–188. [Google Scholar] [CrossRef]
- Coppen, J.J.W.; Hone, G.A. Gum Naval Stores: Turpentine and Rosin from Pine Resin (Non-wood Forest Products); Food and Agriculture Organization of the United Nations: Rome, Italy, 1995; 62p. [Google Scholar]
- Tedesco, M.J.; Gianello, C.; Bissani, C.A.; Bohnen, H.; Volkweiss, S.J. Análises de Solos, Plantas e Outros Materiais (Soil, Plant, and Other Materials Analyses); Depto Solos, Faculdade de Agronomia, UFRGS: Porto Alegre, Brazil, 1995; 174p. [Google Scholar]
- Silva, T.C.; Araujo, E.C.G.; Sanquetta, C.R.; Coelho, J.B.M.; Neto, E.B.; Barreto, L.P. Comparison of methodologies for determining the carbon content in wood. Rev. Agronegócio e Meio Ambient. 2021, 14, e8400. [Google Scholar] [CrossRef]
- Moreira-Vilar, F.C.; Siqueira-Soares, R.C.; Finger-Teixeira, A.; Oliveira, D.M.; Ferro, A.P.; Da Rocha, G.J.; Ferrarese, M.L.L.; Dos Santos, W.D.; Ferrarese-Filho, O. The acetyl bromide method is faster, simpler and presents best recovery of lignin in different herbaceous tissues than Klason and thioglycolic acid methods. PLoS ONE 2014, 9, e110000. [Google Scholar] [CrossRef] [Green Version]
- Vogel, J.G.; He, D.; Jokela, E.J.; Hockaday, W.; Schuur, E.A.G. The effect of fertilization levels and genetic deployment on the isotopic signature, constituents, and chemistry of soil organic carbon in managed loblolly pine (Pinus taeda L.) forests. For. Ecol. Manag. 2015, 355, 91–100. [Google Scholar] [CrossRef]
- Sullivan, T.P.; Sullivan, D.S.; Lindgren, P.M.F.; Ransome, D.B.; Zabek, L. Twenty-five years after stand thinning and repeated fertilization in lodgepole pine forest: Implications for tree growth, stand structure, and carbon sequestration. Forests 2020, 11, 337. [Google Scholar] [CrossRef] [Green Version]
- Lieutier, F.; Garcia, J.; Romary, P.; Yart, A.; Jactel, H.; Sauvard, D. Inter-tree variability in the induced defense reaction of Scots pine to single inoculations by Ophiostoma brunneo ciliatum, a bark-beetle-associated fungus. For. Ecol. Manag. 1993, 59, 257–270. [Google Scholar] [CrossRef]
- Lorio, P.L., Jr.; Sommers, R.A. Evidence of competition for photosynthates between growth processes and resin synthesis in Pinus taeda L. Tree Physiol. 1986, 2, 301–306. [Google Scholar] [CrossRef]
- Ritson, P.; Sochacki, S. Measurement and prediction of biomass and carbon content of Pinus pinaster trees in farm forestry plantations, south-western Australia. For. Ecol. Manag. 2003, 175, 103–117. [Google Scholar] [CrossRef]
- Balbinot, R.; Valério, A.F.; Sanquetta, C.R.; Caldeira, M.V.W.; Silvestre, R. Estoque de carbono em plantação de Pinus spp. em diferentes idades no sul do estado do Paraná. [Carbon stock in Pinus spp. plantations in different ages at southern region of the state of Paraná.]. Floresta 2008, 38, 317–324. [Google Scholar] [CrossRef] [Green Version]
- Ma, Z.; Hartmann, H.; Wang, H.; Li, Q.; Wang, Y.; Li, S. Carbon dynamics and stability between native Masson pine and exotic slash pine plantations in subtropical China. Eur. J. For. Res. 2014, 133, 307–321. [Google Scholar] [CrossRef]
- Schumacher, M.V. Carbon stock in Pinus taeda L. and Acacia mearnsii De Wild plantations cultivated in the Rio Grande do Sul State-Brazil. In As Florestas e o Carbono; Sanquetta, C.R., Watzlawick, L.F., Balbinot, R., Ziliotto, M.A.B., Gomes, F.S., Eds.; Universidade Federal do Paraná: Curitiba, Brasil, 2002; pp. 141–152. [Google Scholar]
- Sette, C.R., Jr.; Nakajima, N.Y.; Geromini, M.P. Captura de carbono orgânico em povoamentos de Pinus taeda L. na regiãode Rio Negrinho, SC (Organic carbon capture in Pinus taeda L. stands in Rio Negrinho, SC. Revista Floresta 2006, 36, 33–44. [Google Scholar]
- Lombardero, M.J.; Ayres, M.P.; Lorio, P.L., Jr.; Ruel, J.J. Environmental effects on constitutive and inducible resin defences of Pinus taeda. Ecol. Lett. 2000, 3, 329–339. [Google Scholar] [CrossRef] [Green Version]
- Sancho-Knapik, D.; Sanz, M.A.; Peguero-Pina, J.J.; Niinemets, Ü.; Gil-Pelegrín, E. Changes of secondary metabolites in Pinus sylvestris L. needles under increasing soil water deficit. Ann. For. Sci. 2017, 74, 24. [Google Scholar] [CrossRef]
- Rigling, A.; Bruhlhart, H.; Braker, O.U.; Forster, T.; Schweingruber, F.H. Effects of irrigation on diameter growth and vertical resin duct production in Pinus sylvestris L. on dry sites in the central Alps, Switzerland. For. Ecol.Manag. 2003, 175, 285–296. [Google Scholar] [CrossRef]
- Lewinsohn, E.; Gijzen, M.; Muzika, R.M.; Barton, K.; Croteau, R. Resinosis in grand fir (Abies grandis) saplings and mature trees (modulation of this wound response by light and water stresses). Plant Physiol. 1993, 101, 1021–1028. [Google Scholar] [CrossRef] [Green Version]
- Ferreira, A.G.; Fior, C.S.; Gualtieri, S.C.J. Resin yield of Pinus elliottii Engelm. seedlings. Braz. J. Plant Physiol. 2011, 23, 313–316. [Google Scholar] [CrossRef] [Green Version]
- Geisler-Lee, J.; Caldwell, C.; Gallie, D.R. Expression of the ethylene biosynthetic machinery in maize roots is regulated in response to hypoxia. J. Exp. Bot. 2010, 61, 857–871. [Google Scholar] [CrossRef] [Green Version]
- Novick, K.A.; Katul, G.G.; McCarthy, H.R.; Oren, R. Increased resin flow in mature pine trees growing under elevated CO2 and moderate soil fertility. Tree Physiol. 2012, 32, 752–763. [Google Scholar] [CrossRef] [Green Version]
- Knebel, L.; Robison, D.J.; Wentworth, T.R.; Klepzig, K.D. Resin flow responses to fertilization, wounding, and fungal inoculation in loblolly pine (Pinus taeda) in North Carolina. Tree Physiol. 2008, 28, 847–853. [Google Scholar] [CrossRef] [Green Version]
- Turtola, S.; Manninen, A.M.; Holopainen, J.K.; Levula, T.; Raitio, H.; Kainulainen, P. Secondary metabolite concentrations and terpene emissions of Scots pine xylem after long-term forest fertilization. J. Environ. Qual. 2002, 31, 1694–1701. [Google Scholar] [CrossRef]
- Kytö, M.; Niemelã, P.; Annila, E. Effects of vitality fertilization on the resin flow and vigour of Scots pine in Finland. For. Ecol. Manag. 1998, 102, 121–130. [Google Scholar] [CrossRef]
- Warren, J.M.; Allen, H.L.; Booker, F.L. Mineral nutrition, resin flow and phloem phytochemistry in loblolly pine. Tree Physiol. 1999, 19, 655–663. [Google Scholar] [CrossRef] [Green Version]
- Garcia, K.; Zimmermann, S.D. The role of mycorrhizal associations in plant potassium nutrition. Front. Plant Sci. 2014, 5, 337. [Google Scholar] [CrossRef] [Green Version]
- Lamb, R.J.; Richards, B.N. Inoculation of pines with mycorrhizal fungi in natural soils–I.: Effects of density and time of application of inoculum and phosphorus amendment on mycorrhizal infection. Soil Biol. Biochem. 1974, 6, 167–171. [Google Scholar] [CrossRef]
- Teng, Y.; Timmer, V.R. Rhizosphere phosphorus depletion induced by heavy nitrogen fertilization in forest nursery soils. Soil Sci. Soc. Am. J. 1995, 59, 227–233. [Google Scholar] [CrossRef]
- Zhang, H.; Jiang, Z.; Qin, R.; Zhang, H.; Zou, J.; Jiang, W.; Liu, D. Accumulation and cellular toxicity of aluminum in seedling of Pinus massoniana. BMC Plant Biol. 2014, 14, 264. [Google Scholar] [CrossRef] [Green Version]
- Sampedro, L.; Moreira, X.; Llusia, J.; Peñuelas, J.; Zas, R. Genetics, phosphorus availability, and herbivore-derived induction as sources of phenotypic variation of leaf volatile terpenes in a pine species. J. Exp. Bot. 2010, 61, 4437–4447. [Google Scholar] [CrossRef] [Green Version]
- Wei, R.-P.; Yang, R.; Wei, Q. Effect of lime application to acidic soils on resin yield tapped from pine plantations in South China. Open J. For. 2014, 4, 390–397. [Google Scholar] [CrossRef] [Green Version]
- Balbinot, R.; Schumacher, M.V.; Watzlawick, L.F.; Sanquetta, C.R. Inventário do carbono orgânico em um plantio de Pinus taeda aos 5 anos de idade no Rio Grande do Sul. [Organic carbon inventory in a 5-year-old plantation of Pinus taeda in the Rio Grande do Sul State. Rev. Ciências Exatas Nat. 2003, 5, 59–68. [Google Scholar]
- Wang, Y.; Wang, H.; Xu, M.; Ma, Z.; Wang, Z.-L. Soil organic carbon stocks and CO2 effluxes of native and exotic pine plantations in subtropical China. Catena 2015, 128, 167–173. [Google Scholar] [CrossRef]
- Gruba, P.; Socha, J. Exploring the effects of dominant forest tree species, soil texture, altitude, and pHH2O on soil carbon stocks using generalized additive models. For. Ecol. Manag. 2019, 447, 105–114. [Google Scholar] [CrossRef]
- Cai, H.; Di, X.; Chang, S.X.; Wang, C.; Shi, B.; Geng, P.; Jin, G. Carbon storage, net primary production, and net ecosystem production in four major temperate forest types in northeastern China. Can. J. For. Res. 2016, 46, 1–9. [Google Scholar] [CrossRef]
- Schopmeyer, C.S.; Mergen, F.; Evans, T.C. Applicability of Poiseuille’s law to exudation of resin from wounds of slash pine. Plant Physiol. 1954, 29, 62–67. [Google Scholar] [CrossRef] [PubMed] [Green Version]
- Mergen, F.; Hoekstra, P.E.; Echols, R.M. Genetic control of resin yield and viscosity in slash pine. Forest Sci. 1955, 1, 19–30. [Google Scholar] [CrossRef]
- Hodges, J.D.; Elam, W.W.; Bluhm, D.R. Influence of Resin Duct Size and Number on Resin Flow in the Southern Pines, Research Note S0-266; United States Department of Agriculture: New Orleans, LA, USA, 1981; 3p. [Google Scholar] [CrossRef]
- Yi, M.; Jia, T.; Dong, L.; Zhang, L.; Leng, C.; Liu, S.; Lai, M. Resin yield in Pinus elliottii Engelm. is related to the resin flow rate, resin components and resin duct characteristics at three locations in southern China. Ind. Crop Prod. 2021, 160, 113141. [Google Scholar] [CrossRef]
- Song, Z.; Liang, Z.; Liu, X. Chemical characteristics of resins from Chinese pine species. Biochem. Syst. Ecol. 1995, 23, 517–522. [Google Scholar] [CrossRef]
- Rezzi, S.; Bighelli, A.; Castola, V.; Casanova, J. Composition and chemical variability of the resin of Pinus nigra spp. laricio from Corsica. Ind. Crops Prod. 2005, 21, 71–79. [Google Scholar] [CrossRef]
- Pio, C.A.; Valente, A.A. Atmospheric fluxes and concentrations of monoterpenes in resin-tapped pine forests. Atmos. Environ. 1998, 32, 683–691. [Google Scholar] [CrossRef]
- Coppen, J.J.W.; Gay, C.; James, D.J.; Robinson, J.M.; Supriana, N. Variability in xylem resin composition amongst natural populations of Indonesian Pinus merkusii. Phytochemistry 1993, 33, 129–136. [Google Scholar] [CrossRef]
- Duke, J.A. Pinus elliottii Engelm. In Handbook of Energy Crops. 1983. Available online: https://hort.purdue.edu/newcrop/duke_energy/Pinus_elliottii.html (accessed on 8 November 2022).
- Rodrigues-Corrêa, K.C.S.; Lima, J.C.; Fett-Neto, A.G. Resins from pine: Production and industrial uses. In Natural Products: Phytochemistry, Botany and Metabolism of Alkaloids, Phenolics and Terpenes; Ramawat, K.G., Merillon, J.M., Eds.; Springer: Berlin, Germany, 2013; pp. 4037–4060. [Google Scholar] [CrossRef]
- Profft, I.; Mund, M.; Weber, G.-E.; Weller, E.; Schulze, E.-D. Forest management and carbon sequestration in wood products. Eur. J. For. Res. 2009, 128, 399–413. [Google Scholar] [CrossRef] [Green Version]
- Zhao, D.; Kane, M.; Teskey, R.; Fox, T.R.; Albaugh, T.J.; Allen, H.L.; Rubilar, R. Maximum response of loblolly pine plantations to silvicultural management in the southern United States. For. Ecol. Manag. 2016, 375, 105–111. [Google Scholar] [CrossRef] [Green Version]
- Heras, J.D.L.; Moya, D.; López-Serrano, F.R.; Rubio, E. Carbon sequestration of naturally regenerated Aleppo pine stands in response to early thinning. New For. 2013, 44, 457–470. [Google Scholar] [CrossRef]
- Jiménez, E.; Veja, J.A.; Fernández, C.; Fonturbel, T. Is pre-commercial thinning compatible with carbon sequestration? A case study in a maritime pine stand in northwestern Spain. Forestry 2011, 84, 149–157. [Google Scholar] [CrossRef]


| Plantation Age (Years) | (Year I) Plant Shoot Height (m) | (Year II) Plant Shoot Height (m) | (Year I) Root DW (kg) | (Year II) Root DW (kg) | (Year I) Shoot DW (kg) | (Year II) Shoot DW (kg) | DBH i (cm) | DBH fA (cm) | DBH fB (cm) |
|---|---|---|---|---|---|---|---|---|---|
| A | 17.20 ± 0.24 c | 18.28 ± 0.25 c | 41.25 ± 2.98 a | 43.40 ± 3.14 a | 204.43 ± 9.85 b | 213.41 ± 10.43 b | 23.48 ± 0.12 a | 24.19 ± 0.39 a | 23.58 ± 0.49 a |
| B | 21.31 ± 0.24 b | 21.57 ± 0.11 b | 37.34 ± 1.77 a | 44.01 ± 6.70 a | 285.54 ± 8.84 a | 294.89 ± 11.56 a | 22.77 ± 0.09 b | 23.24 ± 0.29 ab | 23.84 ± 0.41 a |
| C | 22.38 ± 0.34 a | 22.91 ± 0.30 a | 45.96 ± 4.44 a | 44.62 ± 2.86 a | 304.03 ± 15.22 a | 283.20 ± 17.81 a | 22.54 ± 0.10 b | 22.51 ± 0.40 b | 23.37 ± 0.45 a |
| Sites | Crop I (Spring 2009 to Winter 2010) | Crop II (Spring 2010 to Winter 2011) | ||
|---|---|---|---|---|
| BS (kg) | P (kg) | BS (kg) | P (kg) | |
| Site A | 2.562 ± 0.01 a | 5.188 ± 0.24 a,* | 2.867 ± 0.14 a | 4.426 ± 0.21 a,* |
| Site B | 2.095 ± 0.10 b | 4.850 ± 0.22 a,* | 1.737 ± 0.10 c | 4.181 ± 0.25 a,* |
| Site C | 2.524 ± 0.13 a | 5.346 ± 0.34 a,* | 2.241 ± 0.13 b | 3.098 ± 0.26 b,* |
| a. SiteA | IT | BS | P |
|---|---|---|---|
| Trunk Tip | 48.15 ± 0.56 bA | 51.44 ± 0.88 aAB | 50.29 ± 0.38 abA |
| Upper Section | 49.15 ± 0.68 bA | 51.35 ± 0.66 aAB | 49.73 ± 0.29 abA |
| Median Section | 49.16 ± 0.83 bA | 51.34 ± 0.16 aAB | 51.03 ± 0.39 aA |
| Basal Section | 49.82 ± 0.76 aA | 51.56 ± 0.59 aAB | 50.70 ± 0.30 aA |
| Branches | 49.23 ± 0.74 bA | 51.05 ± 0.72 aAB | 50.47 ± 0.34 abA |
| Needles | 50.22 ± 0.88 aA | 52.23 ± 0.89 aA | 50.00 ± 1.24 aA |
| Taproot | 47.55 ± 1.81 aA | 48.76 ± 1.13 aAB | 47.15 ± 2.14 aA |
| Lateral Roots | 49.27 ± 1.16 aA | 49.95 ± 1.22 aAB | 51.03 ± 1.09 aA |
| Aboveground Bark | 44.95 ± 0.94 aA | 47.36 ± 1.18 aB | 47.22 ± 0.68 aA |
| b. Site B | IT | BS | P |
| Trunk Tip | 44.69 ± 1.46 aAB | 49.66 ± 2.08 aAB | 46.05 ± 0.49 aA |
| Upper Section | 46.45 ± 1.13 aAB | 51.12 ± 0.21 aAB | 48.05 ± 1.78 aA |
| Median Section | 49.75 ± 2.04 aA | 51.30 ± 0.43 aAB | 47.76 ± 1.75 aA |
| Basal Section | 46.58 ± 2.31 aAB | 51.44 ± 0.55 aAB | 51.19 ± 1.97 aA |
| Branches | 46.38 ± 1.31 aAB | 49.835 ± 1.98 aAB | 47.91 ± 2.56 aA |
| Needles | 41.81 ± 2.29 bB | 52.57 ± 0.41 aA | 49.58 ± 3.14abA |
| Taproot | 49.63 ± 1.0 aA | 48.04 ± 2.20 aAB | 48.26 ± 2.71 aA |
| Lateral Roots | 49.71 ± 1.55 aA | 49.80 ± 0.87 aAB | 48.31 ± 1.31 aA |
| Aboveground Bark | 45.77 ± 0.29 aAB | 46.18 ± 1.14 aB | 45.16 ± 0.52 aA |
| c. Site C | IT | BS | P |
| Trunk Tip | 43.21 ± 0.79 aAB | 44.25 ± 0.85 aA | 43.59 ± 0.35 aA |
| Upper Section | 42.13 ± 0.82 aAB | 44.43 ± 1.00 aA | 44.59 ± 0.47 aA |
| Median Section | 44.92 ± 0.32 aA | 43.37 ± 1.16 aA | 45.09 ± 1.07 aA |
| Basal Section | 44.27 ± 0.58 aA | 43.65 ± 0.65aB | 46.15 ± 0.72 aA |
| Branches | 44.12 ± 0.80 aA | 44.21 ± 0.67 aA | 45.54 ± 0.85 aA |
| Needles | 43.52 ± 1.32 aAB | 43.77 ± 1.13 aA | 44.94 ± 1.53 aA |
| Taproot | 42.83 ± 1.28 aAB | 41.14 ± 0.87 aA | 44.53 ± 1.38 aA |
| Lateral Roots | 42.55 ± 0.27 aAB | 44.93 ± 1.81 aA | 41.84 ± 0.44 aA |
| Aboveground Bark | 44.00 ± 1.76 aA | 44.64 ± 0.18 aA | 43.54 ± 1.58 aA |
| d. Site | Age (years) | Total Carbon % | |
| A | 14 | 49.63 ± 0.32 A | |
| B | 24 | 48.26 ± 0.47 B | |
| C | 26 | 43.92 ± 0.22 C | |
| Site Age (Years) | Site Tree Density (Trees Per ha) | Treatment | Shoots | Roots | Total Carbon stock (MgC.ha−1) | |
|---|---|---|---|---|---|---|
| Year I | 14 | 900 | BS | 115.601 ± 5.76 aABC | 24.348 ± 3.14 aA | 139.949 ± 7.20 aAB |
| P | 91.304 ± 7.66 aC | 16.799 ± 1.66 aA | 108.103 ± 9.19 aB | |||
| IT | 102.821 ± 9.97 aBC | 19.145 ± 1.05 aA | 121.966 ± 10.44 aAB | |||
| 24 | 600 | BS | 145.795 ± 8.36 aA | 19.863 ± 1.27 aA | 165.658 ± 8.85 aA | |
| P | 126.597 ± 8.43 aABC | 17.549 ± 2.61 aA | 144.146 ± 8.20 aAB | |||
| IT | 119.821 ± 2.39 aABC | 16.530 ± 2.16 aA | 136.351 ± 3.19 aAB | |||
| 26 | 900 | BS | 138.277 ± 16.18 aAB | 18.170 ± 2.99 aA | 156.447 ± 21.0 aA | |
| P | 129.644 ± 7.85 aABC | 19.582 ± 5.70 aA | 149.226 ± 9.79 aAB | |||
| IT | 136.357 ± 8.76 aAB | 20.900 ± 3.46 aA | 157.257 ± 9.11 aA | |||
| Year II | 14 | 885 | BS | 100.804 ± 7.61 aC | 21.183 ± 3.78 aA | 121.987 ± 9.22 aB |
| P | 105.193 ± 6.53 aBC | 19.344 ± 2.26 aA | 124.537 ± 8.73 aAB | |||
| IT | 117.271 ± 11.27 aABC | 22.630 ± 2.11 aA | 139.901 ± 12.37 aAB | |||
| 24 | 585 | BS | 151.588 ± 11.88 aA | 21.189 ± 6.85 aA | 172.777 ± 9.30 aA | |
| P | 139.260 ± 3.22 aABC | 16.587 ± 6.51 aA | 155.847 ± 8.58 aAB | |||
| IT | 146.323 ± 12.77 aAB | 26.816 ± 3.78 aA | 173.139 ± 12.97 aA | |||
| 26 | 885 | BS | 136.277 ± 6.73 aABC | 19.566 ± 0.97 aA | 155.843 ± 7.48 abAB | |
| P | 100.744 ± 10.31 bC | 17.858 ± 2.71 aA | 118.602 ± 12.84 bB | |||
| IT | 140.466 ± 3.99 aABC | 19.874 ± 2.81 aA | 160.340 ± 4.7 aAB |
| Site | Site Tree Density (Trees Per ha) | Chemically Induced Slash Pine Oleoresin (MgC.ha−1) | Nonchemically Induced Slash Pine Oleoresin (MgC.ha−1) | |
|---|---|---|---|---|
| Year I | A | 900 | 3.362 ± 0.16 a | 1.660 ± 0.06 a |
| B | 600 | 2.095 ± 0.09 b | 0.905 ± 0.04 b | |
| C | 900 | 3.464 ± 0.22 a | 1.636 ± 0.08 a | |
| Year II | A | 885 | 2.820 ± 0.13 a | 1.827 ± 0.09 a |
| B | 585 | 1.757 ± 0.10 b | 0.731 ± 0.04 c | |
| C | 885 | 1.974 ± 0.17 b | 1.428 ± 0.08 b |
Disclaimer/Publisher’s Note: The statements, opinions and data contained in all publications are solely those of the individual author(s) and contributor(s) and not of MDPI and/or the editor(s). MDPI and/or the editor(s) disclaim responsibility for any injury to people or property resulting from any ideas, methods, instructions or products referred to in the content. |
© 2023 by the authors. Licensee MDPI, Basel, Switzerland. This article is an open access article distributed under the terms and conditions of the Creative Commons Attribution (CC BY) license (https://creativecommons.org/licenses/by/4.0/).
Share and Cite
Rodrigues-Honda, K.C.d.S.; Junkes, C.F.d.O.; Lima, J.C.d.; Waldow, V.d.A.; Rocha, F.S.; Sausen, T.L.; Bayer, C.; Talamini, E.; Fett-Neto, A.G. Carbon Sequestration in Resin-Tapped Slash Pine (Pinus elliottii Engelm.) Subtropical Plantations. Biology 2023, 12, 324. https://doi.org/10.3390/biology12020324
Rodrigues-Honda KCdS, Junkes CFdO, Lima JCd, Waldow VdA, Rocha FS, Sausen TL, Bayer C, Talamini E, Fett-Neto AG. Carbon Sequestration in Resin-Tapped Slash Pine (Pinus elliottii Engelm.) Subtropical Plantations. Biology. 2023; 12(2):324. https://doi.org/10.3390/biology12020324
Chicago/Turabian StyleRodrigues-Honda, Kelly Cristine da Silva, Camila Fernanda de Oliveira Junkes, Júlio César de Lima, Vinicius de Abreu Waldow, Fernando Souza Rocha, Tanise Luisa Sausen, Cimélio Bayer, Edson Talamini, and Arthur Germano Fett-Neto. 2023. "Carbon Sequestration in Resin-Tapped Slash Pine (Pinus elliottii Engelm.) Subtropical Plantations" Biology 12, no. 2: 324. https://doi.org/10.3390/biology12020324