Effect of Zbed6 Single-Allele Knockout on the Growth and Development of Skeletal Muscle in Mice

 , and
, and 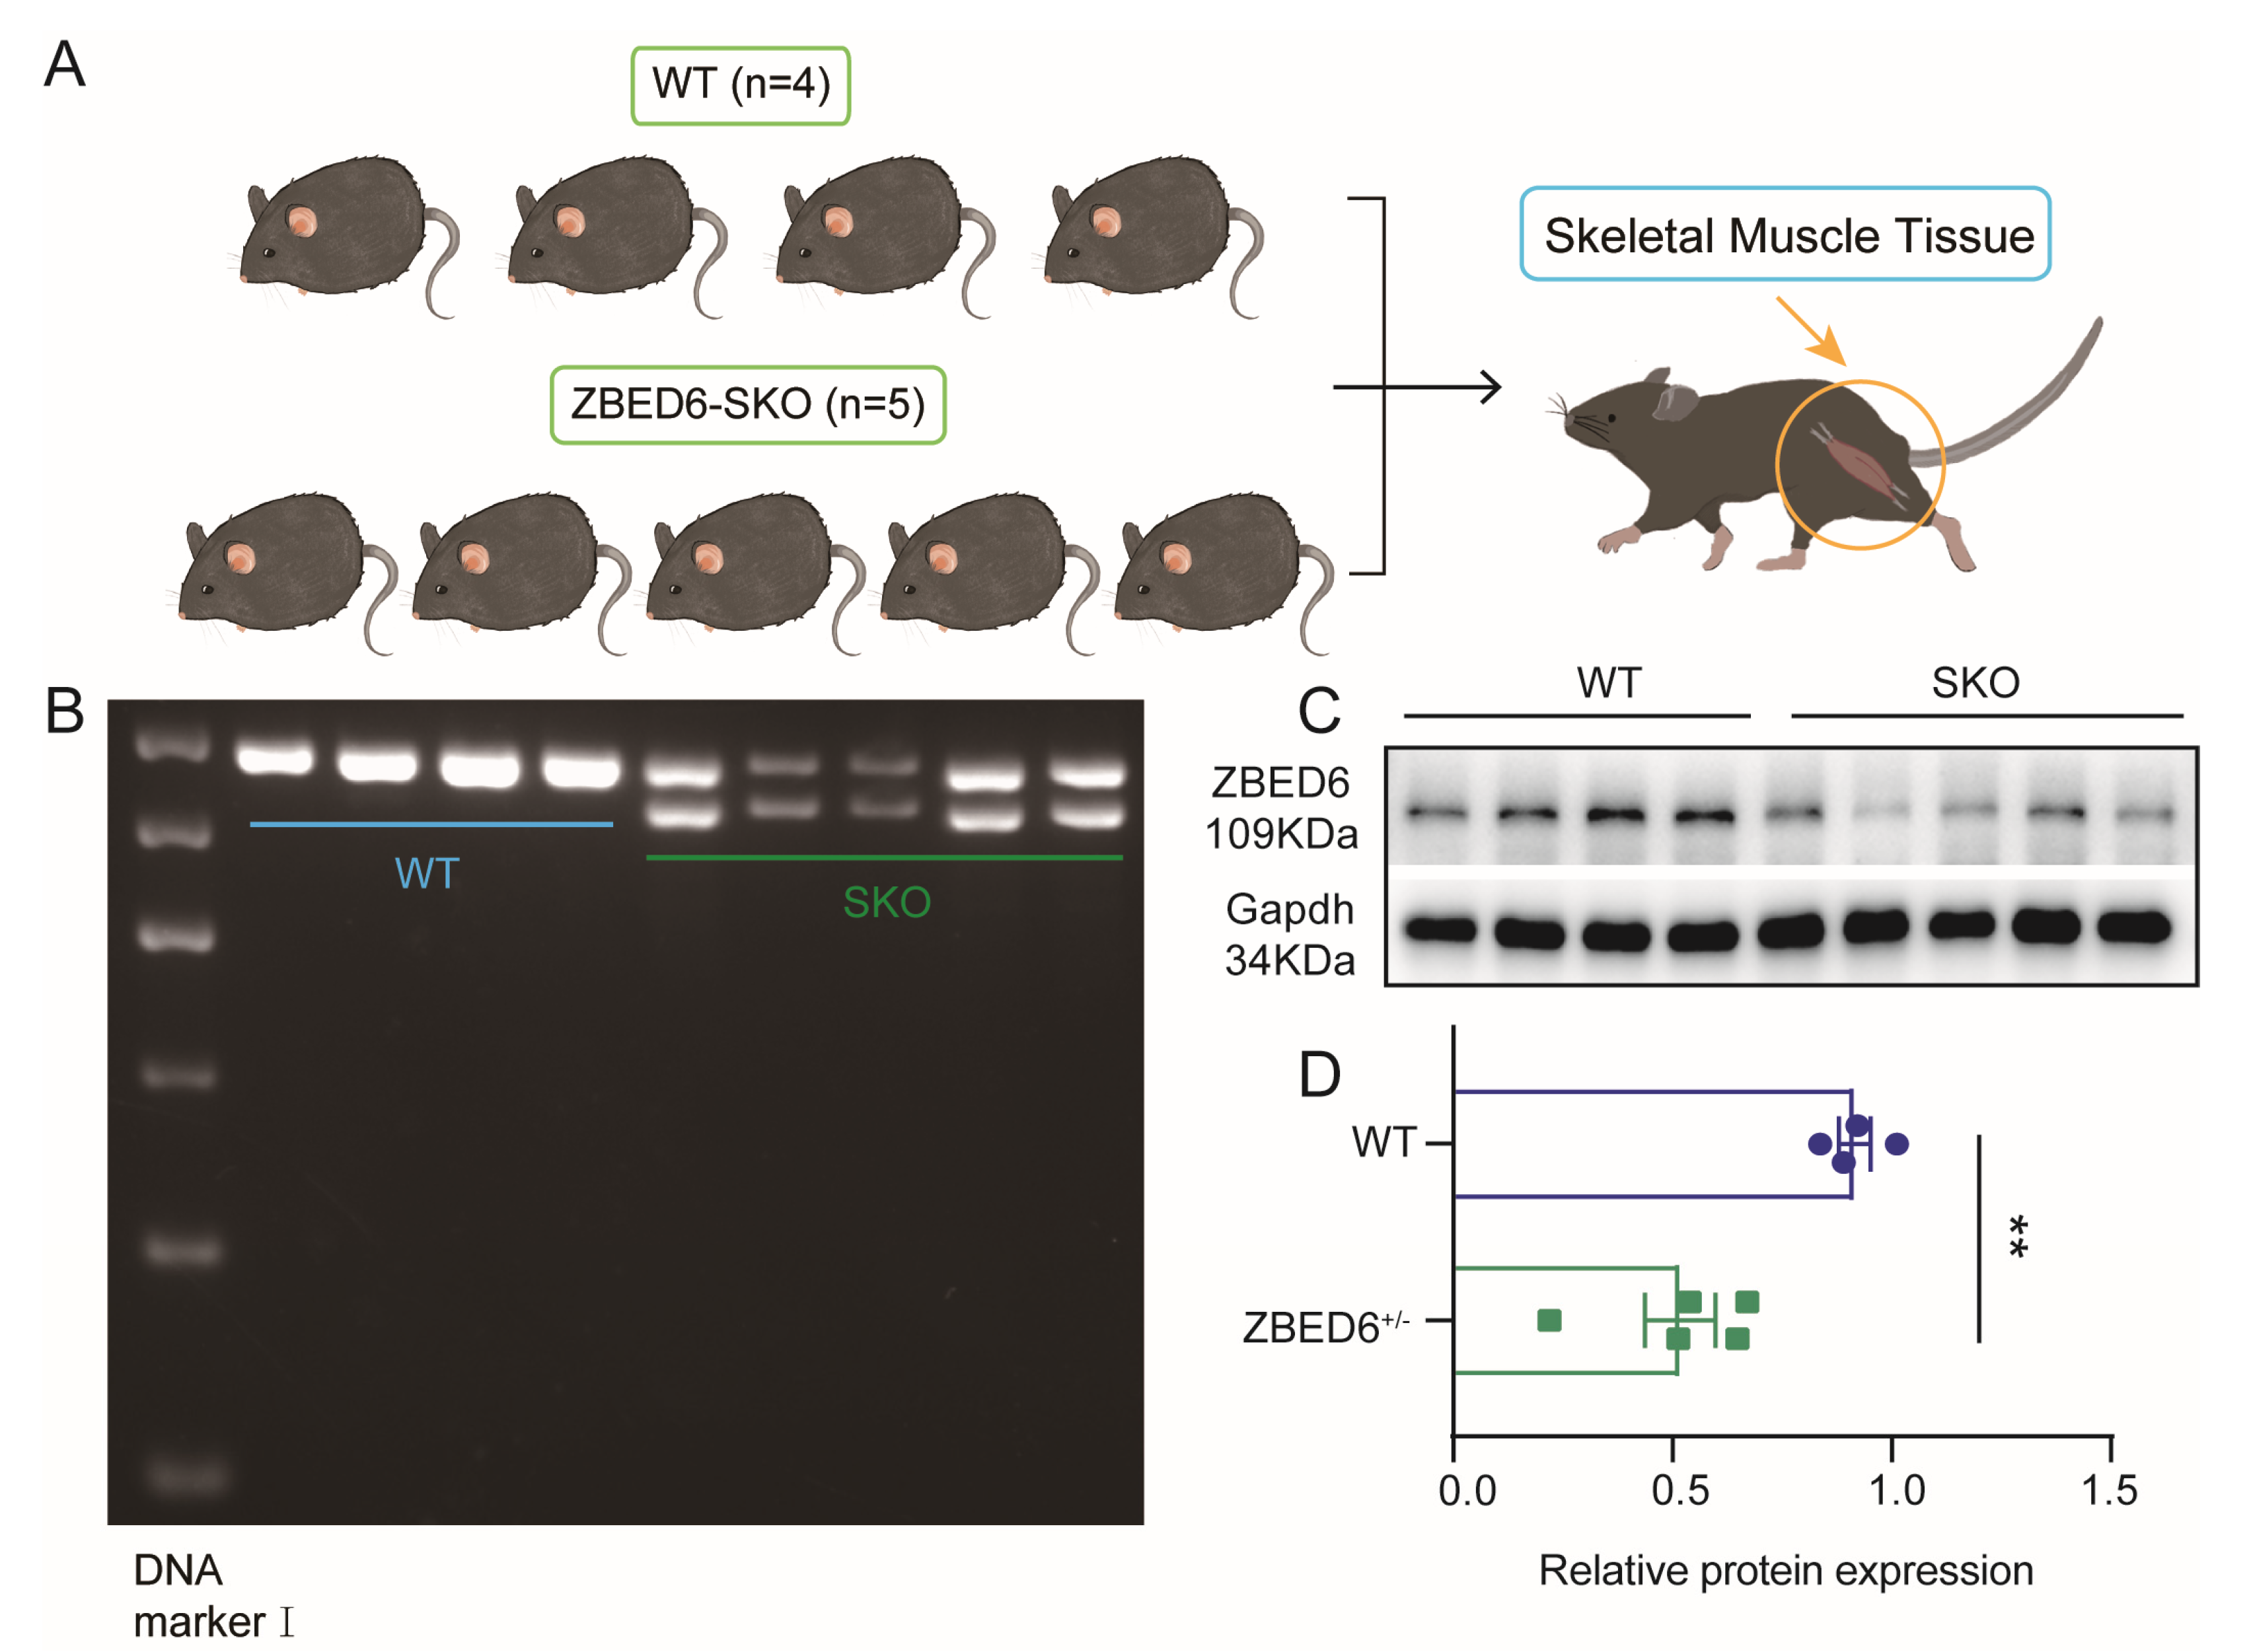
Abstract
:Simple Summary
Abstract
1. Introduction
2. Materials and Methods
2.1. Animal Models
2.2. Mice Genotyping
2.3. Animal Slaughter
2.4. Western Blot Analysis
2.5. Histochemistry and Analysis of Myofiber
2.6. RNA Isolation and Library Preparation
2.7. Primer Design and Quantitative Real-Time PCR
2.8. RNA-Seq Analysis
2.9. Enrichment Analysis
2.10. Candidate Gene Selection
2.11. Statistical Analysis
3. Results
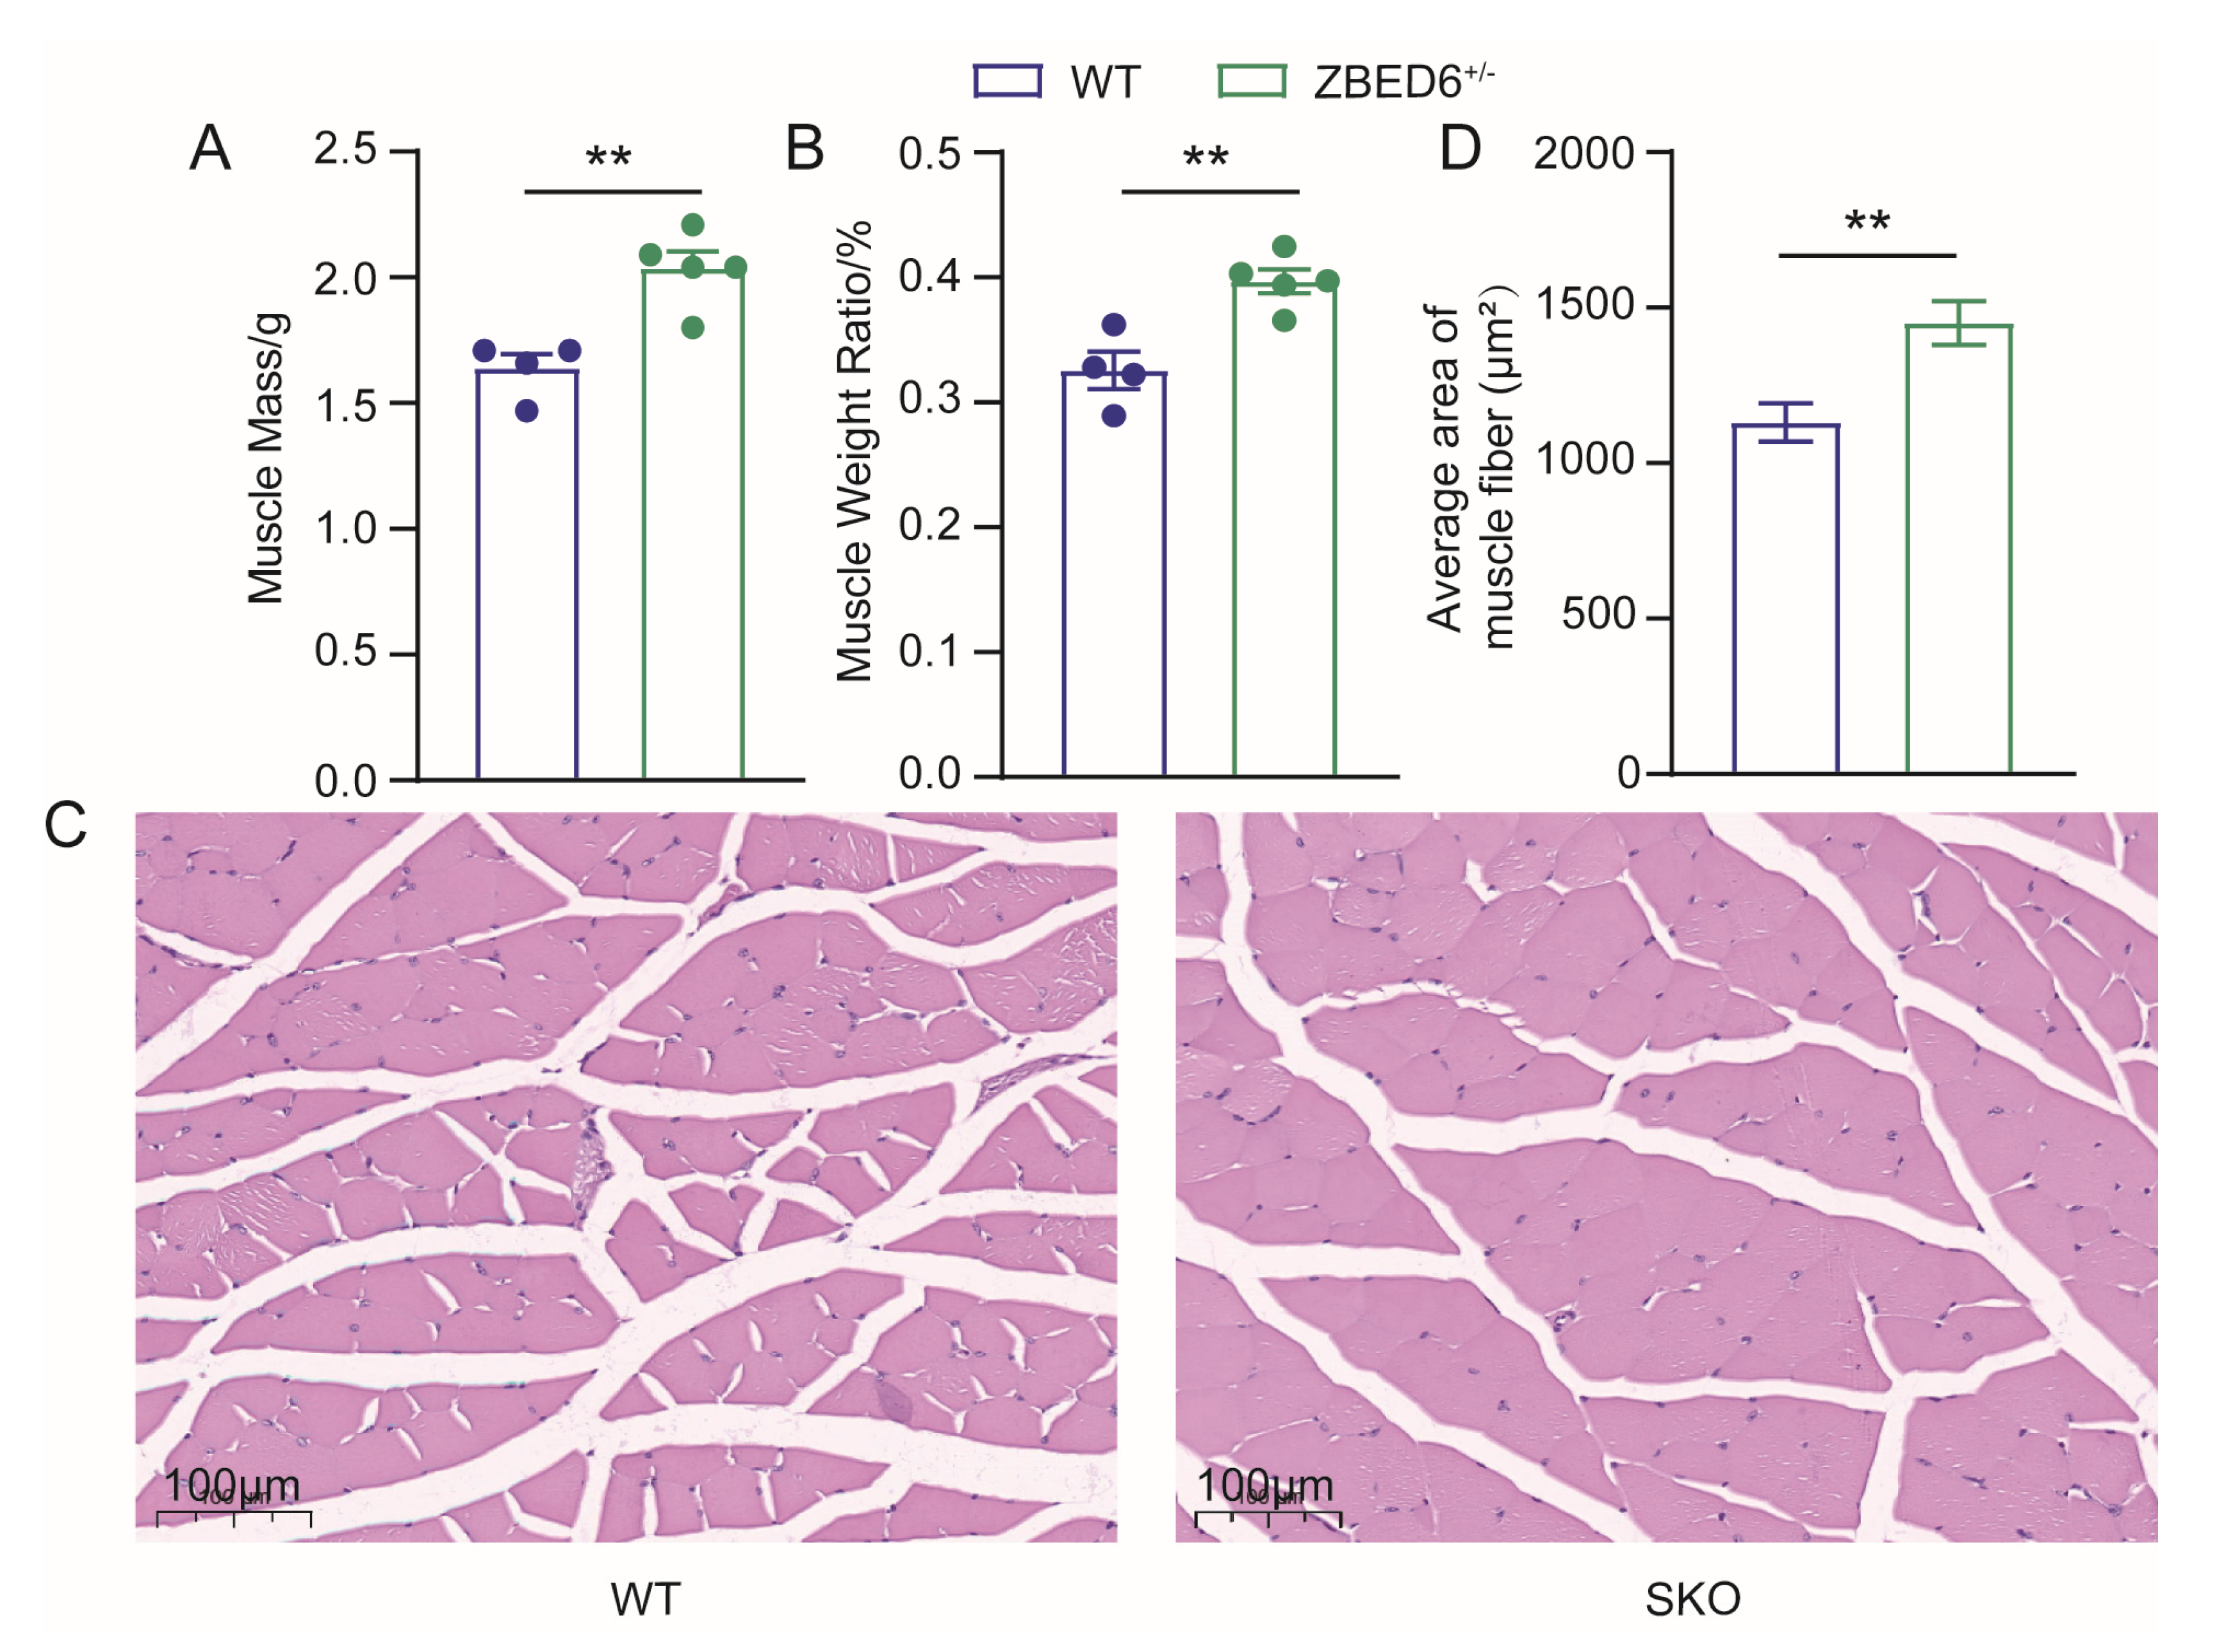
3.1. Zbed6 Single-Allele Knockout Promotes the Growth of Skeletal Muscle
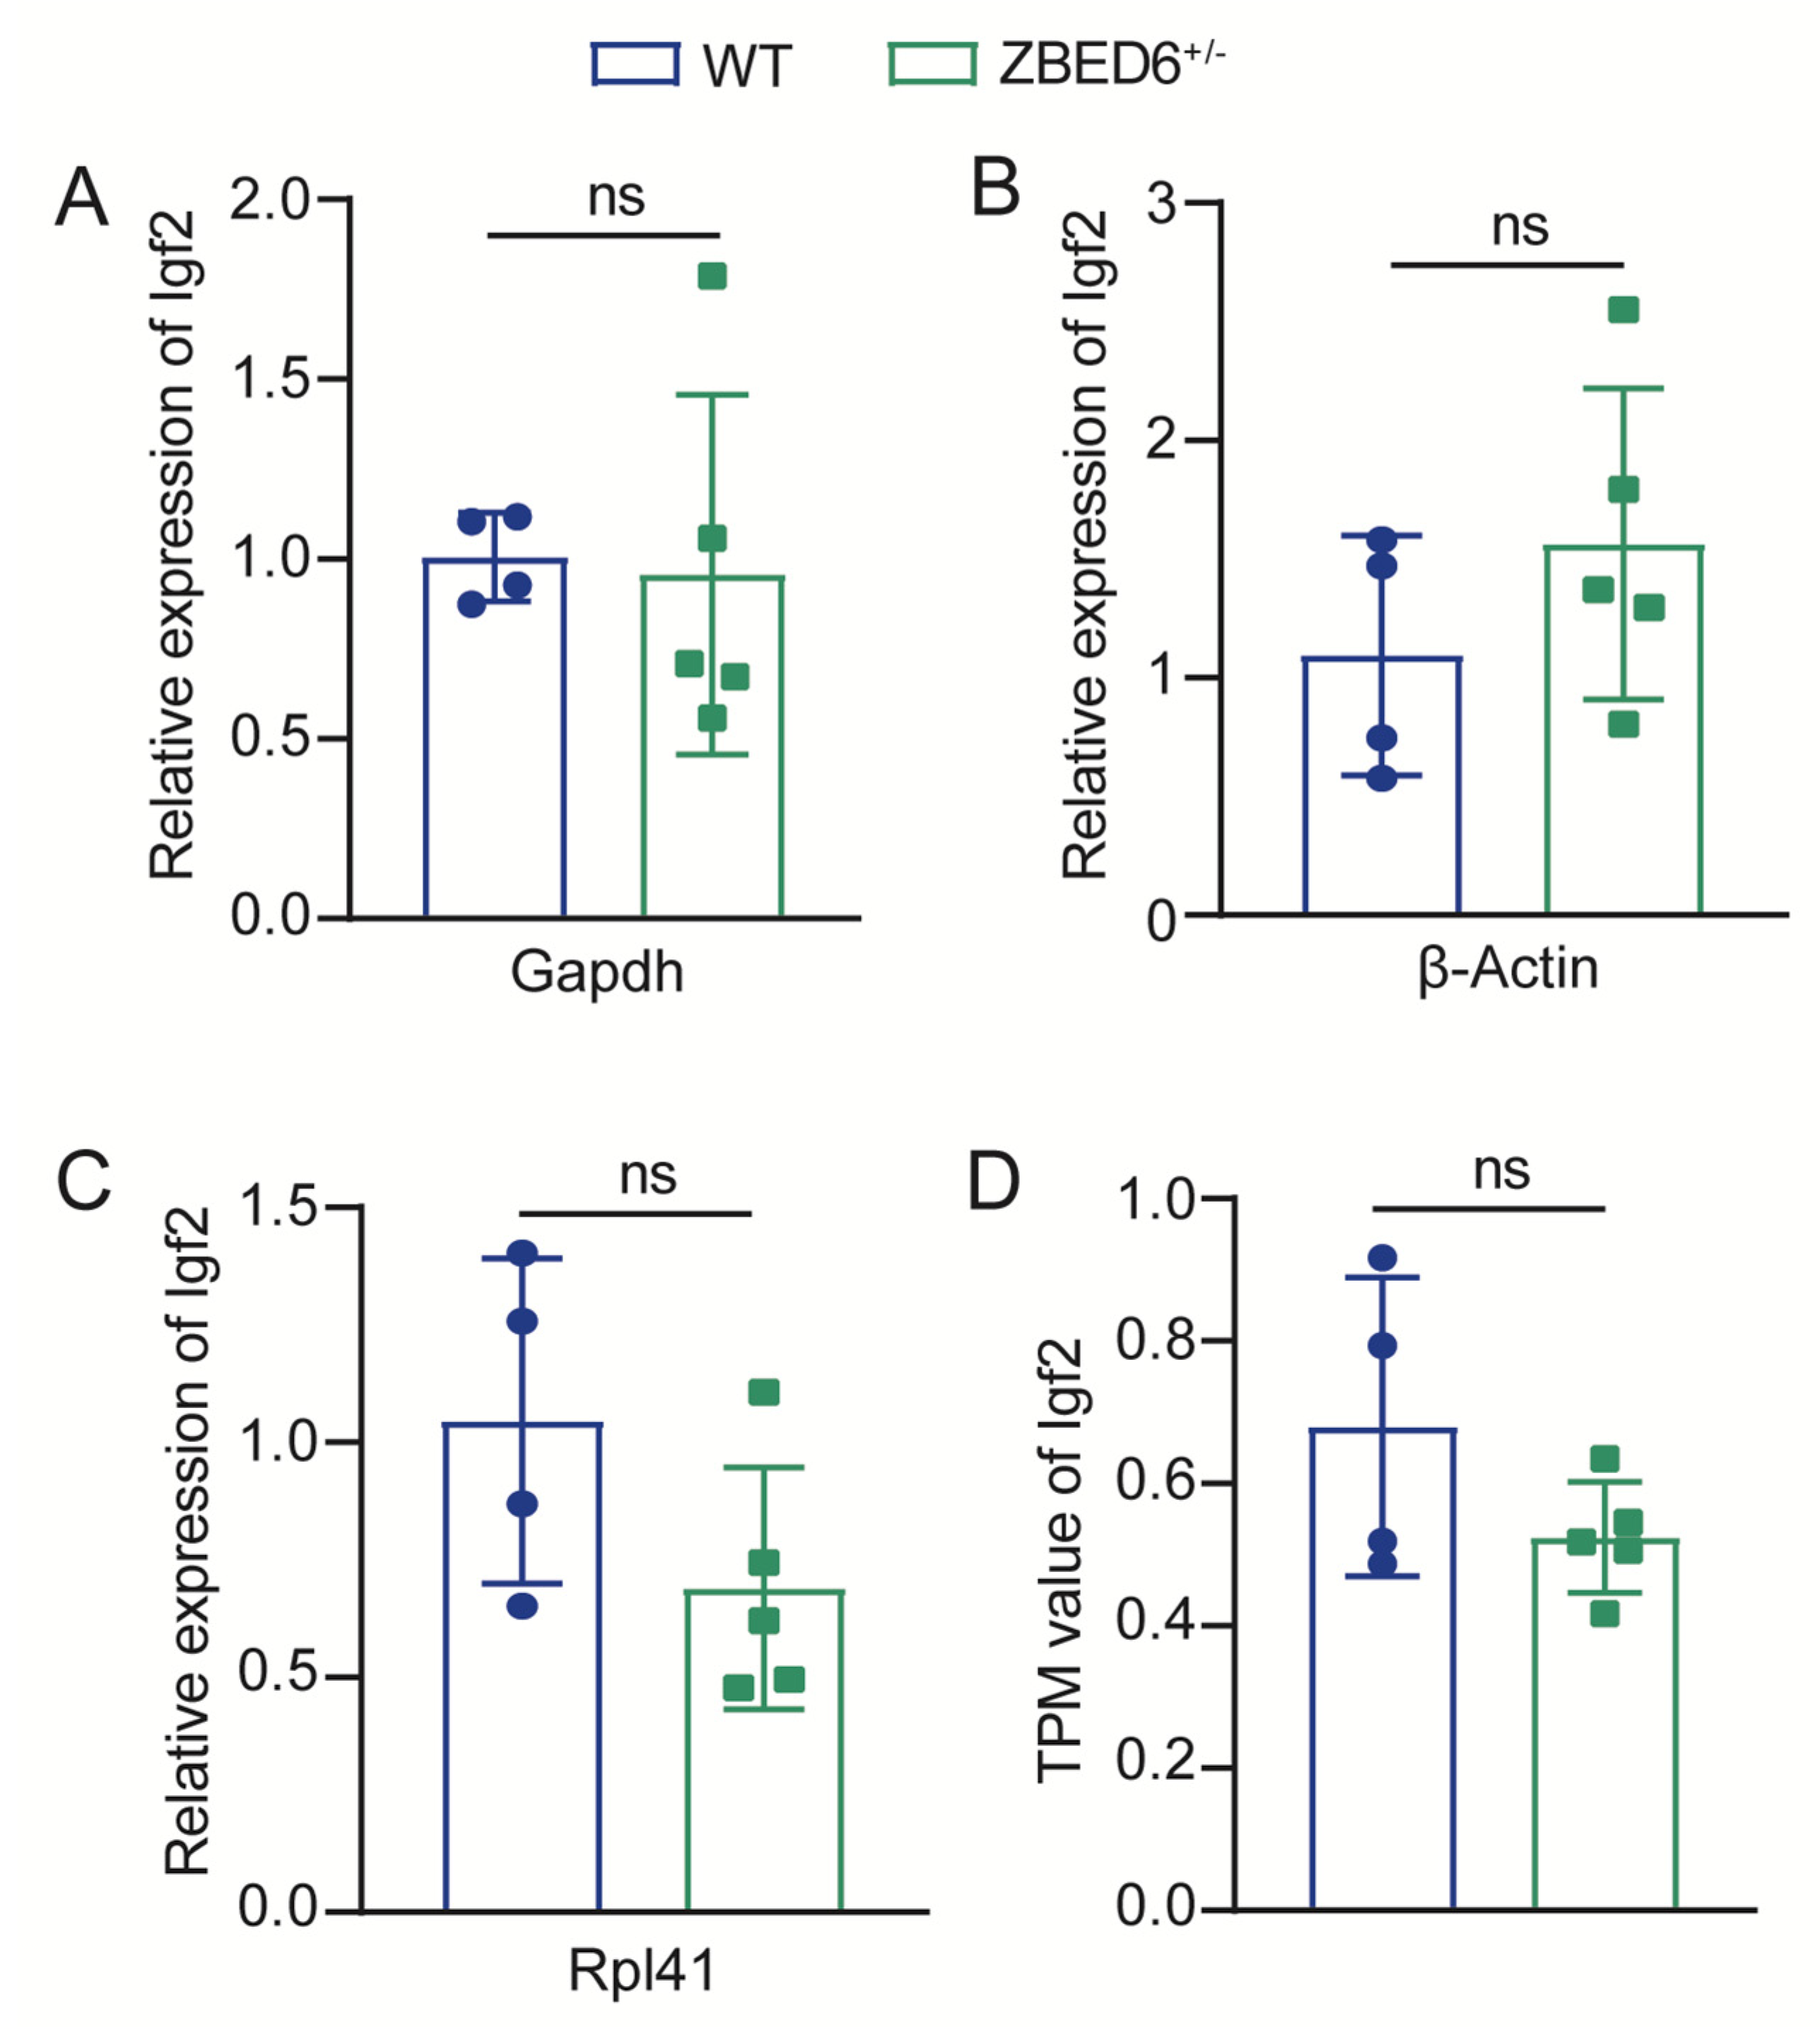
3.2. Zbed6 Single-Allele Knockout Did Not Increase Igf2 mRNA Expression in Mice Muscle
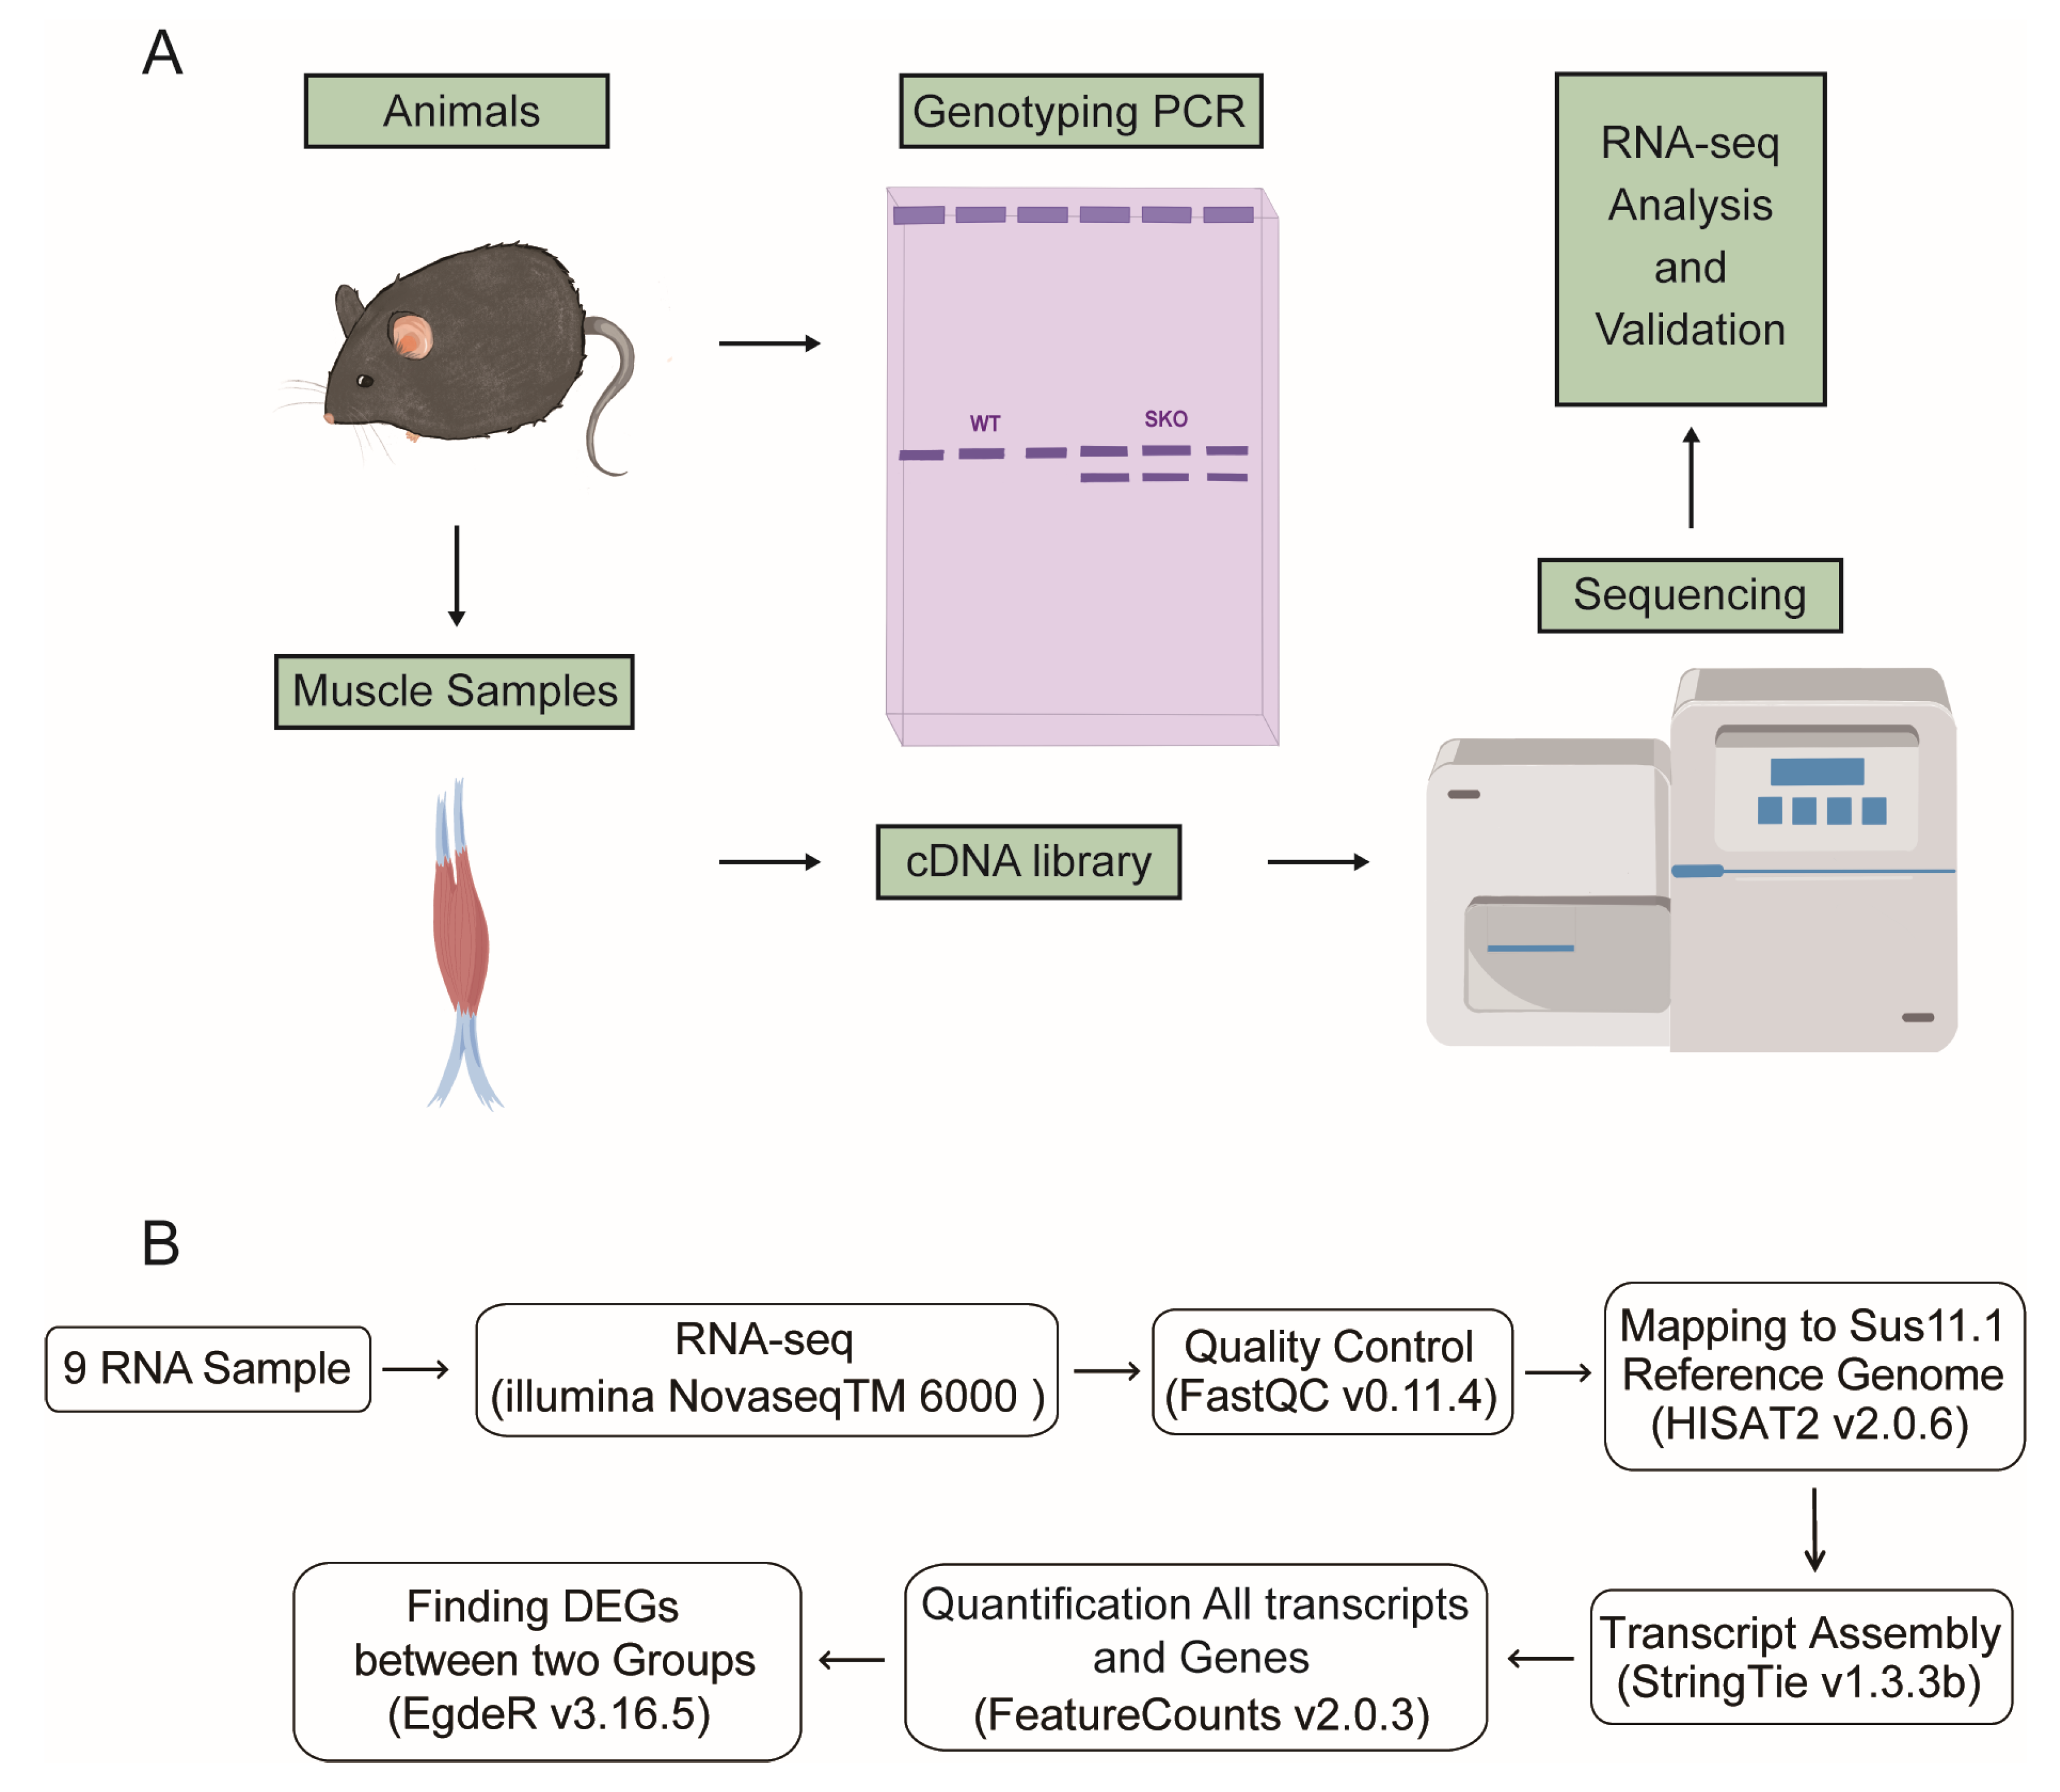
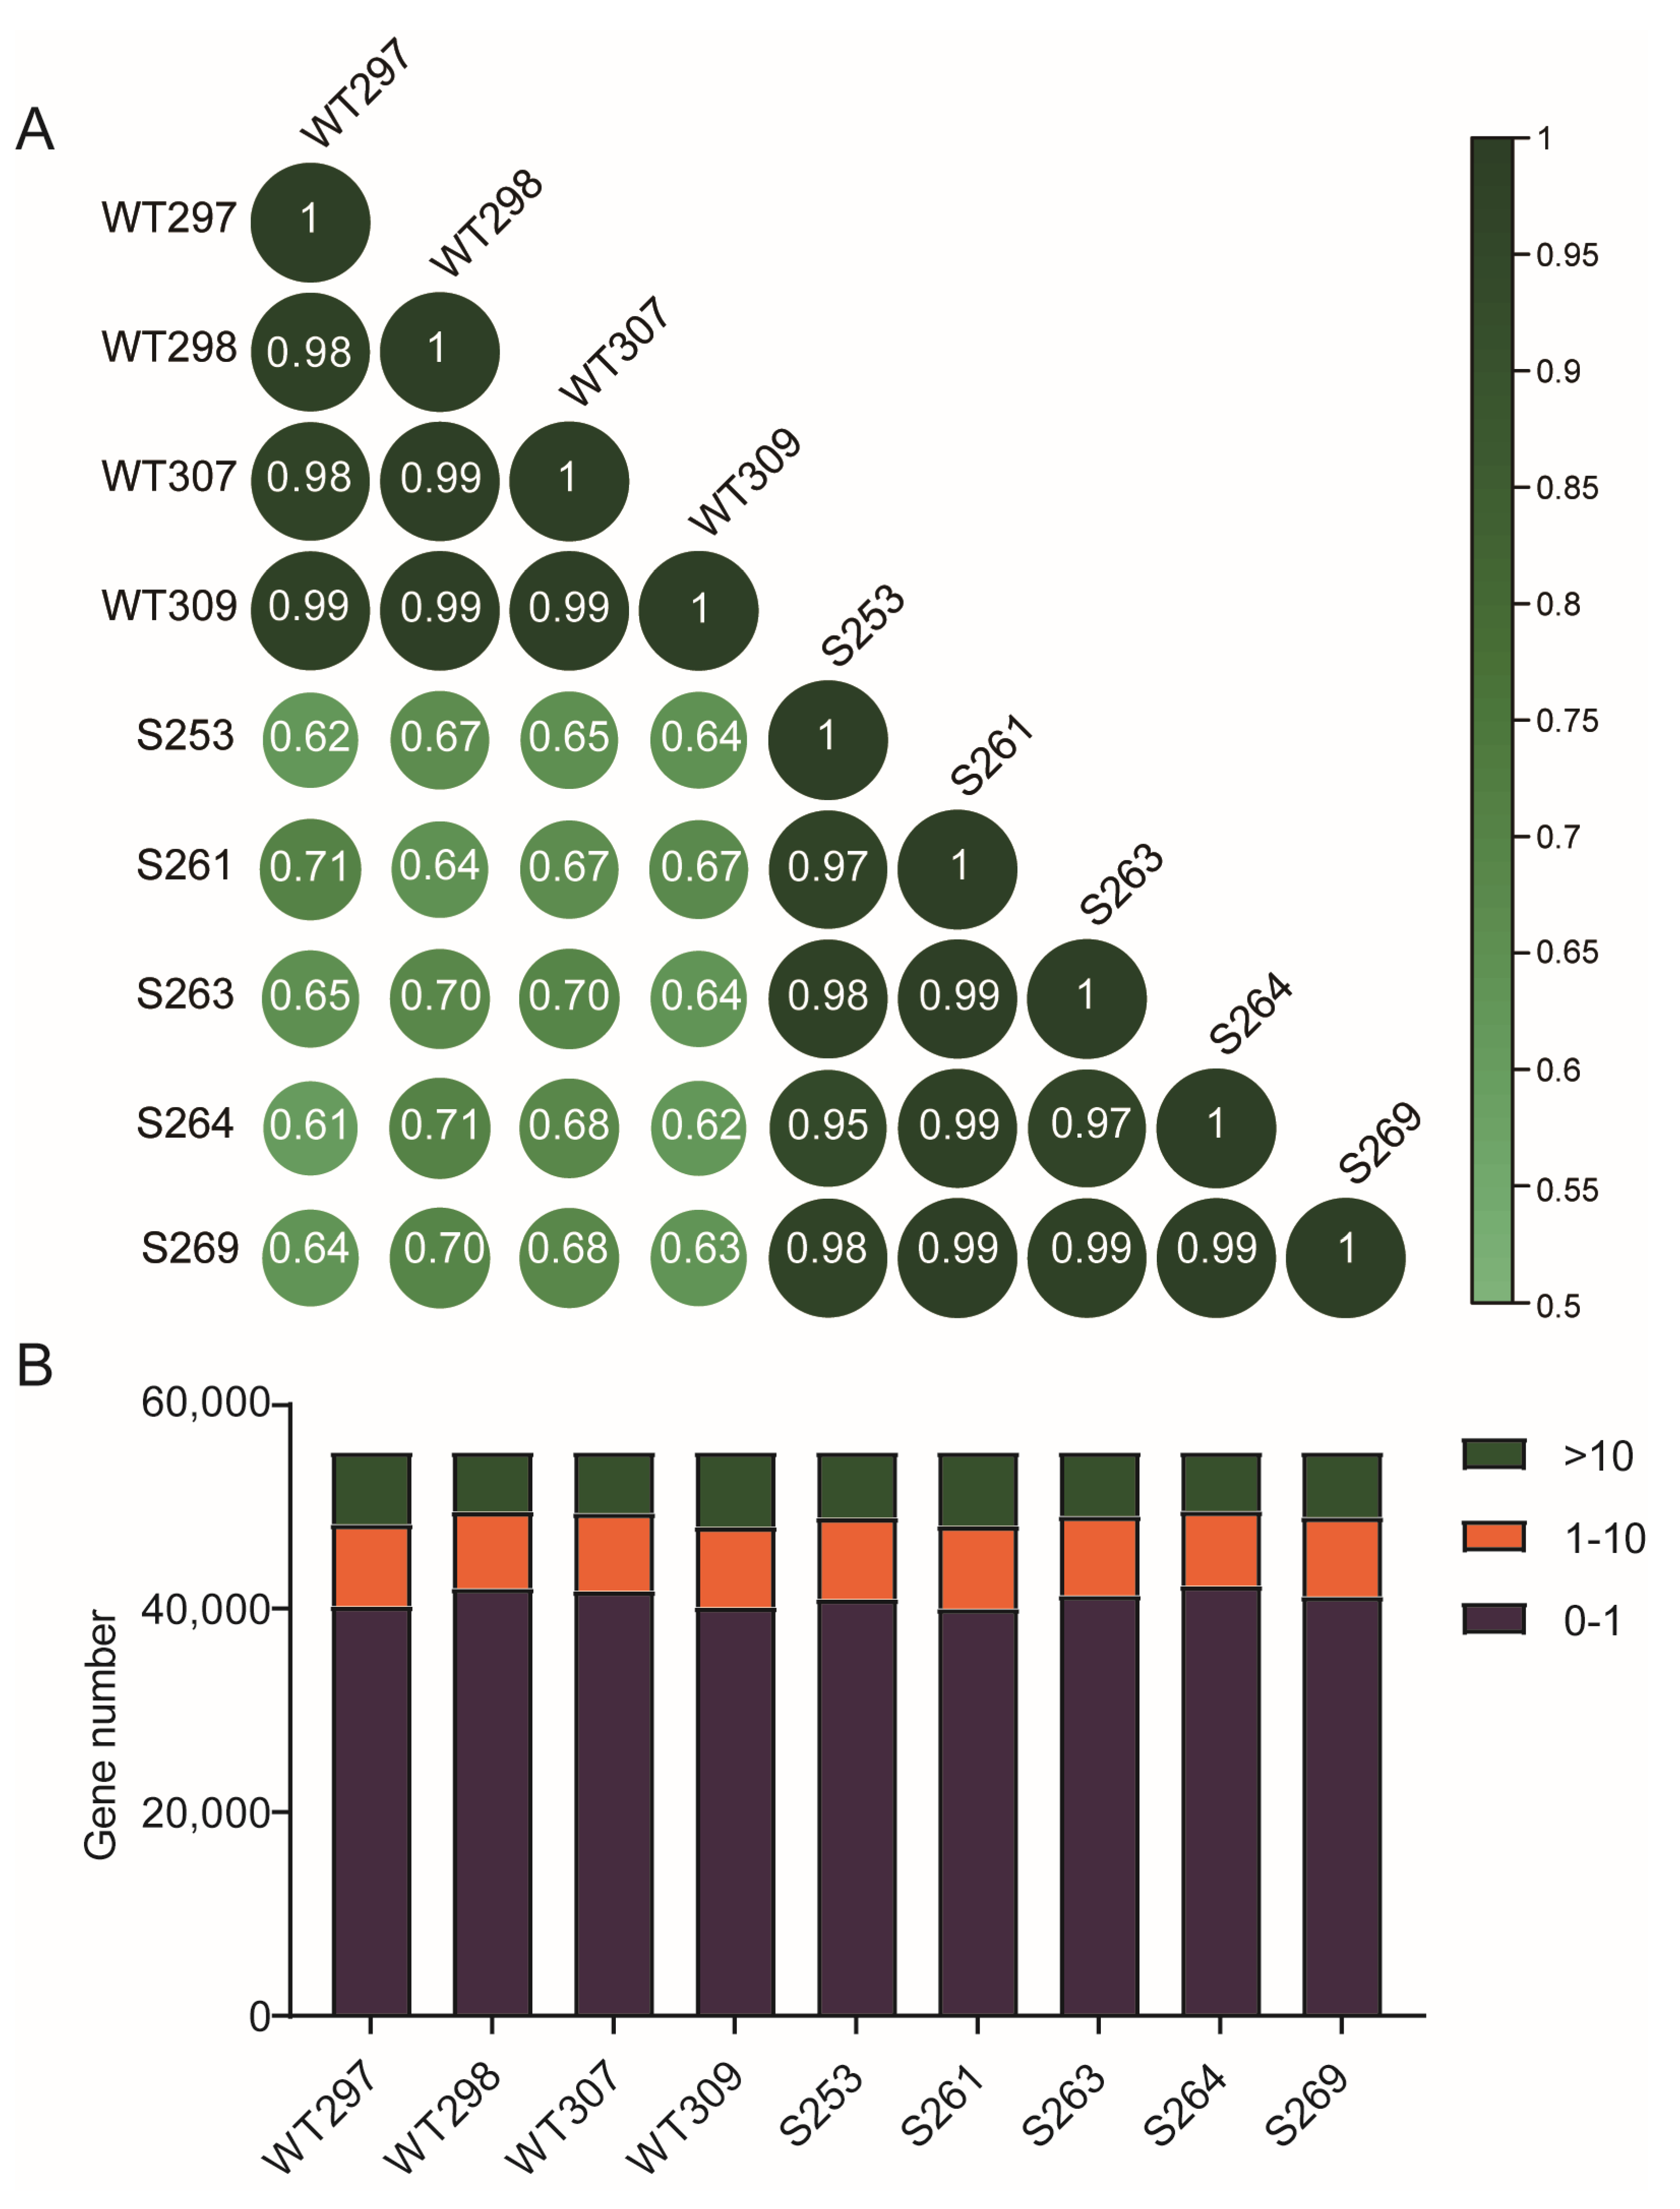
3.3. RNA-Seq of WT and Zbed6+/− Mice
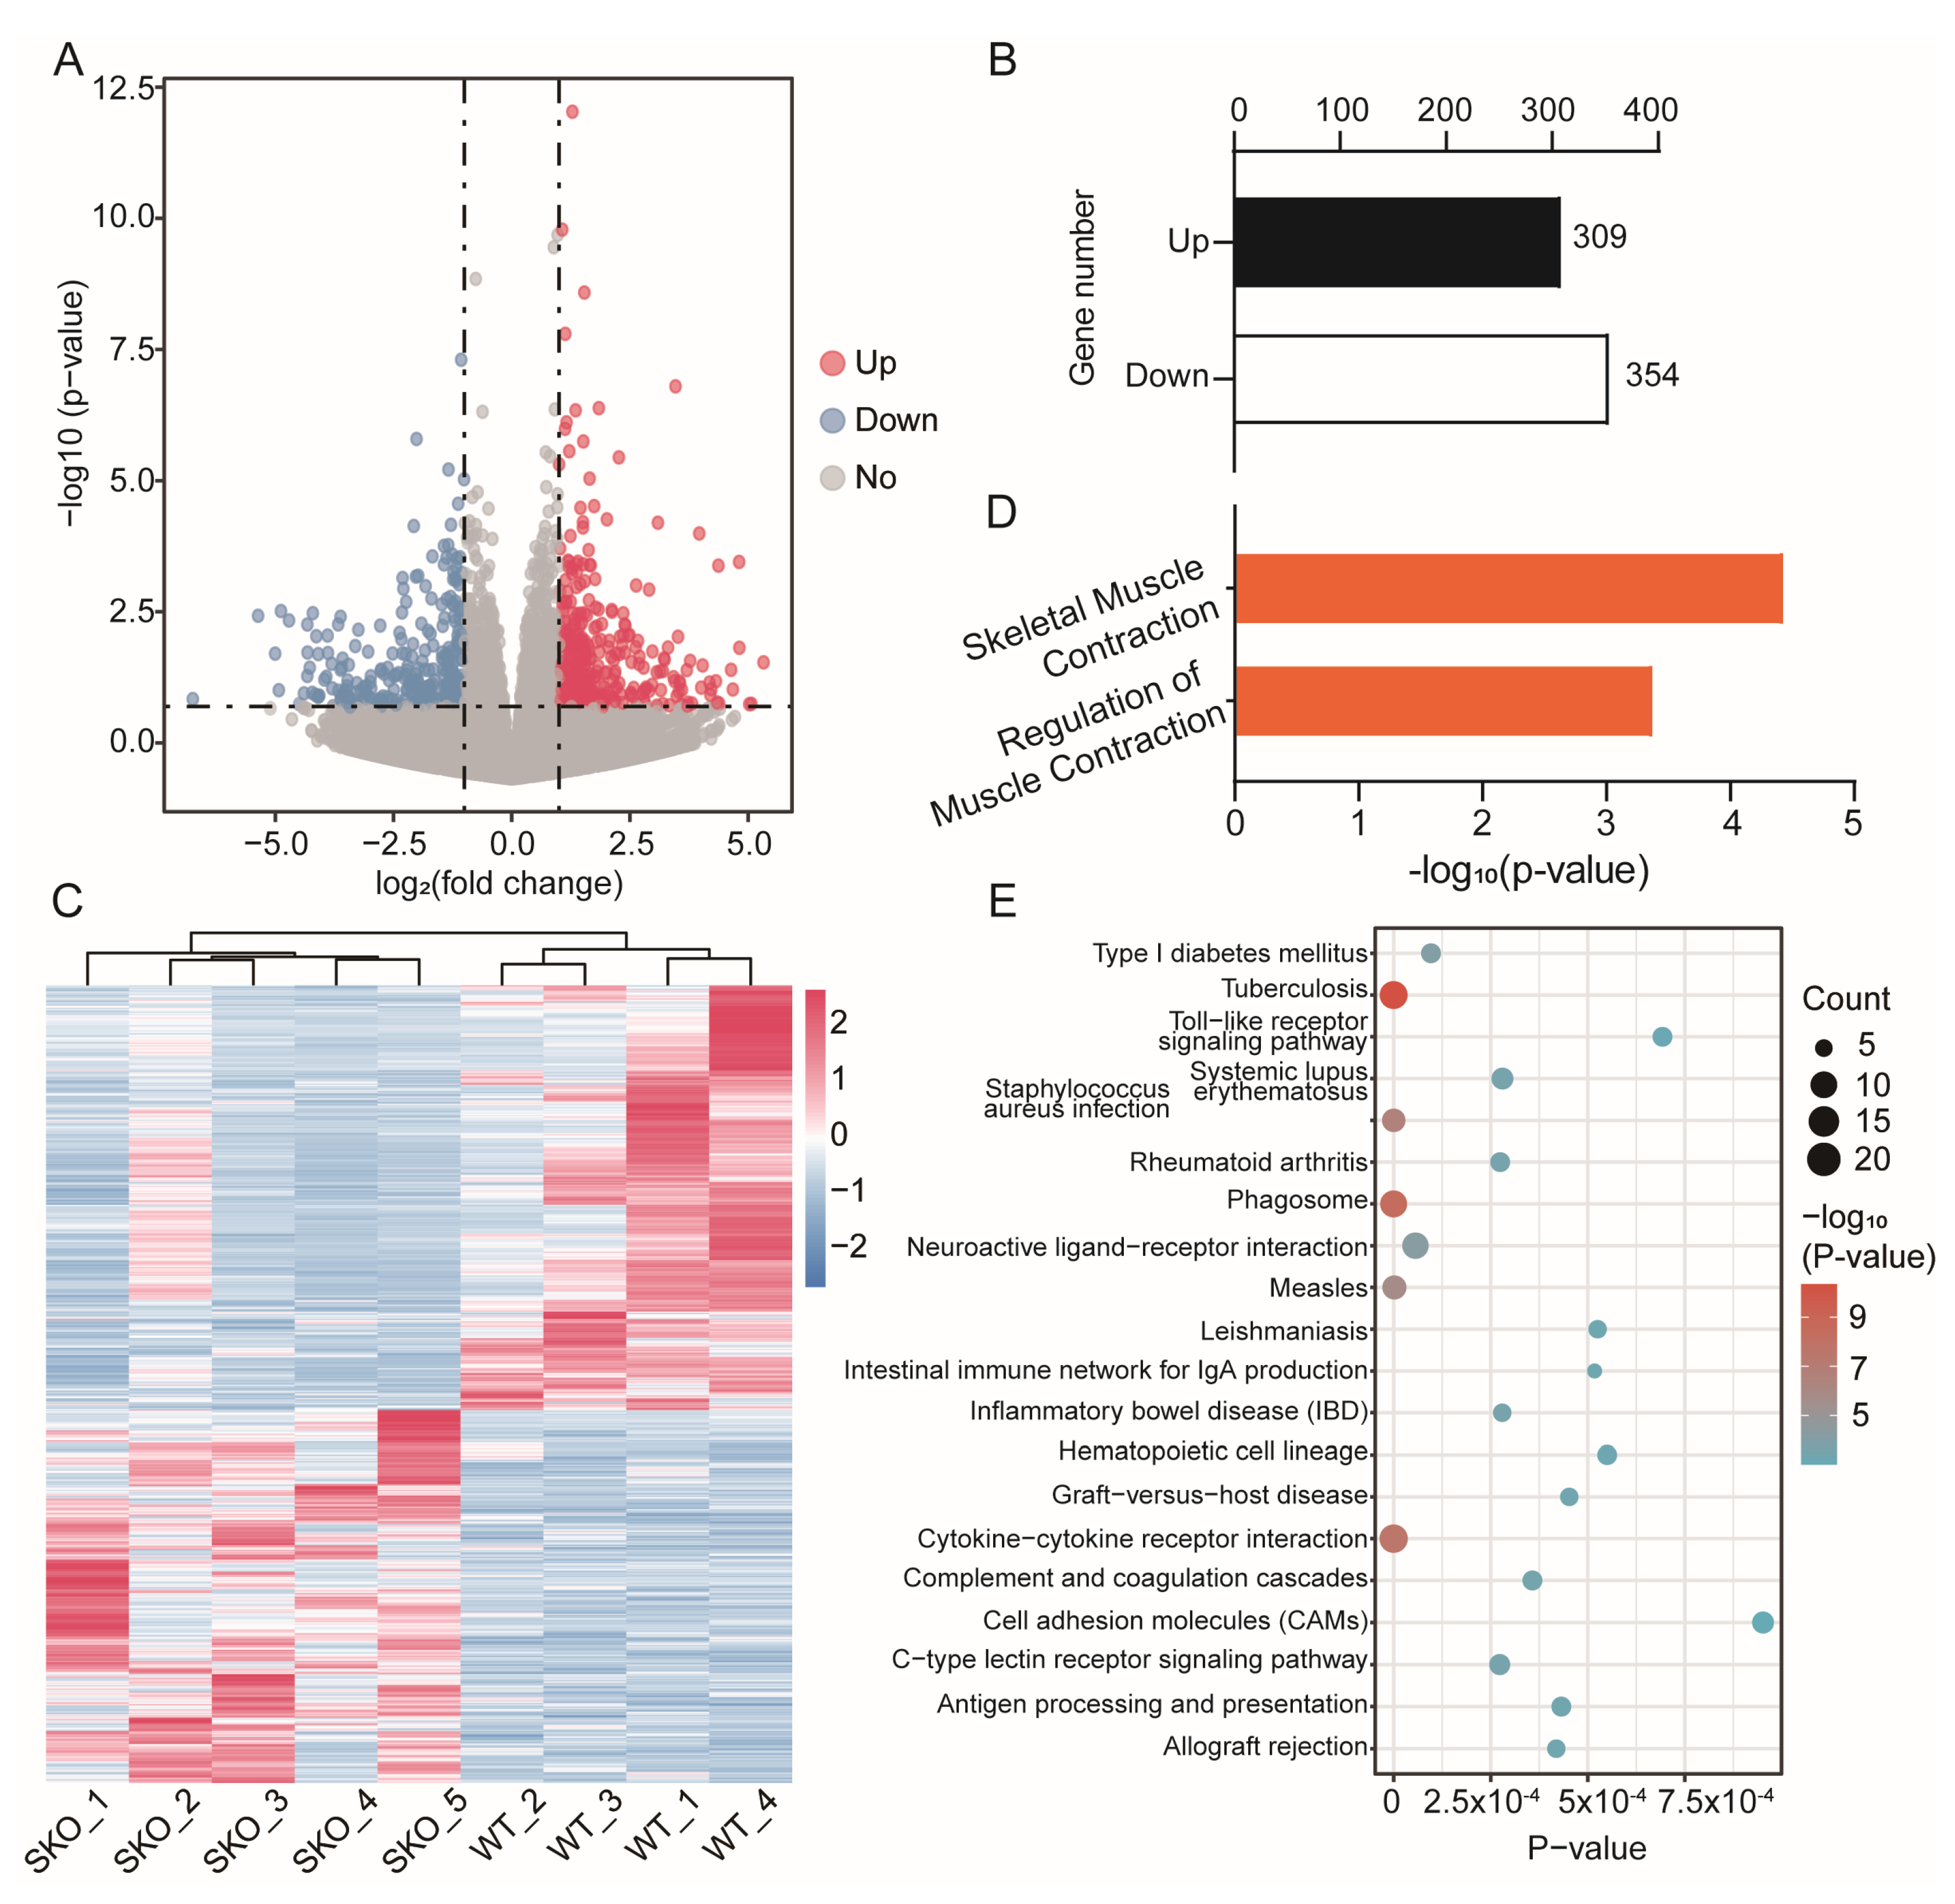
3.4. Enrichment Analysis of DEGs between ZBED6+/− and WT Mice Muscle
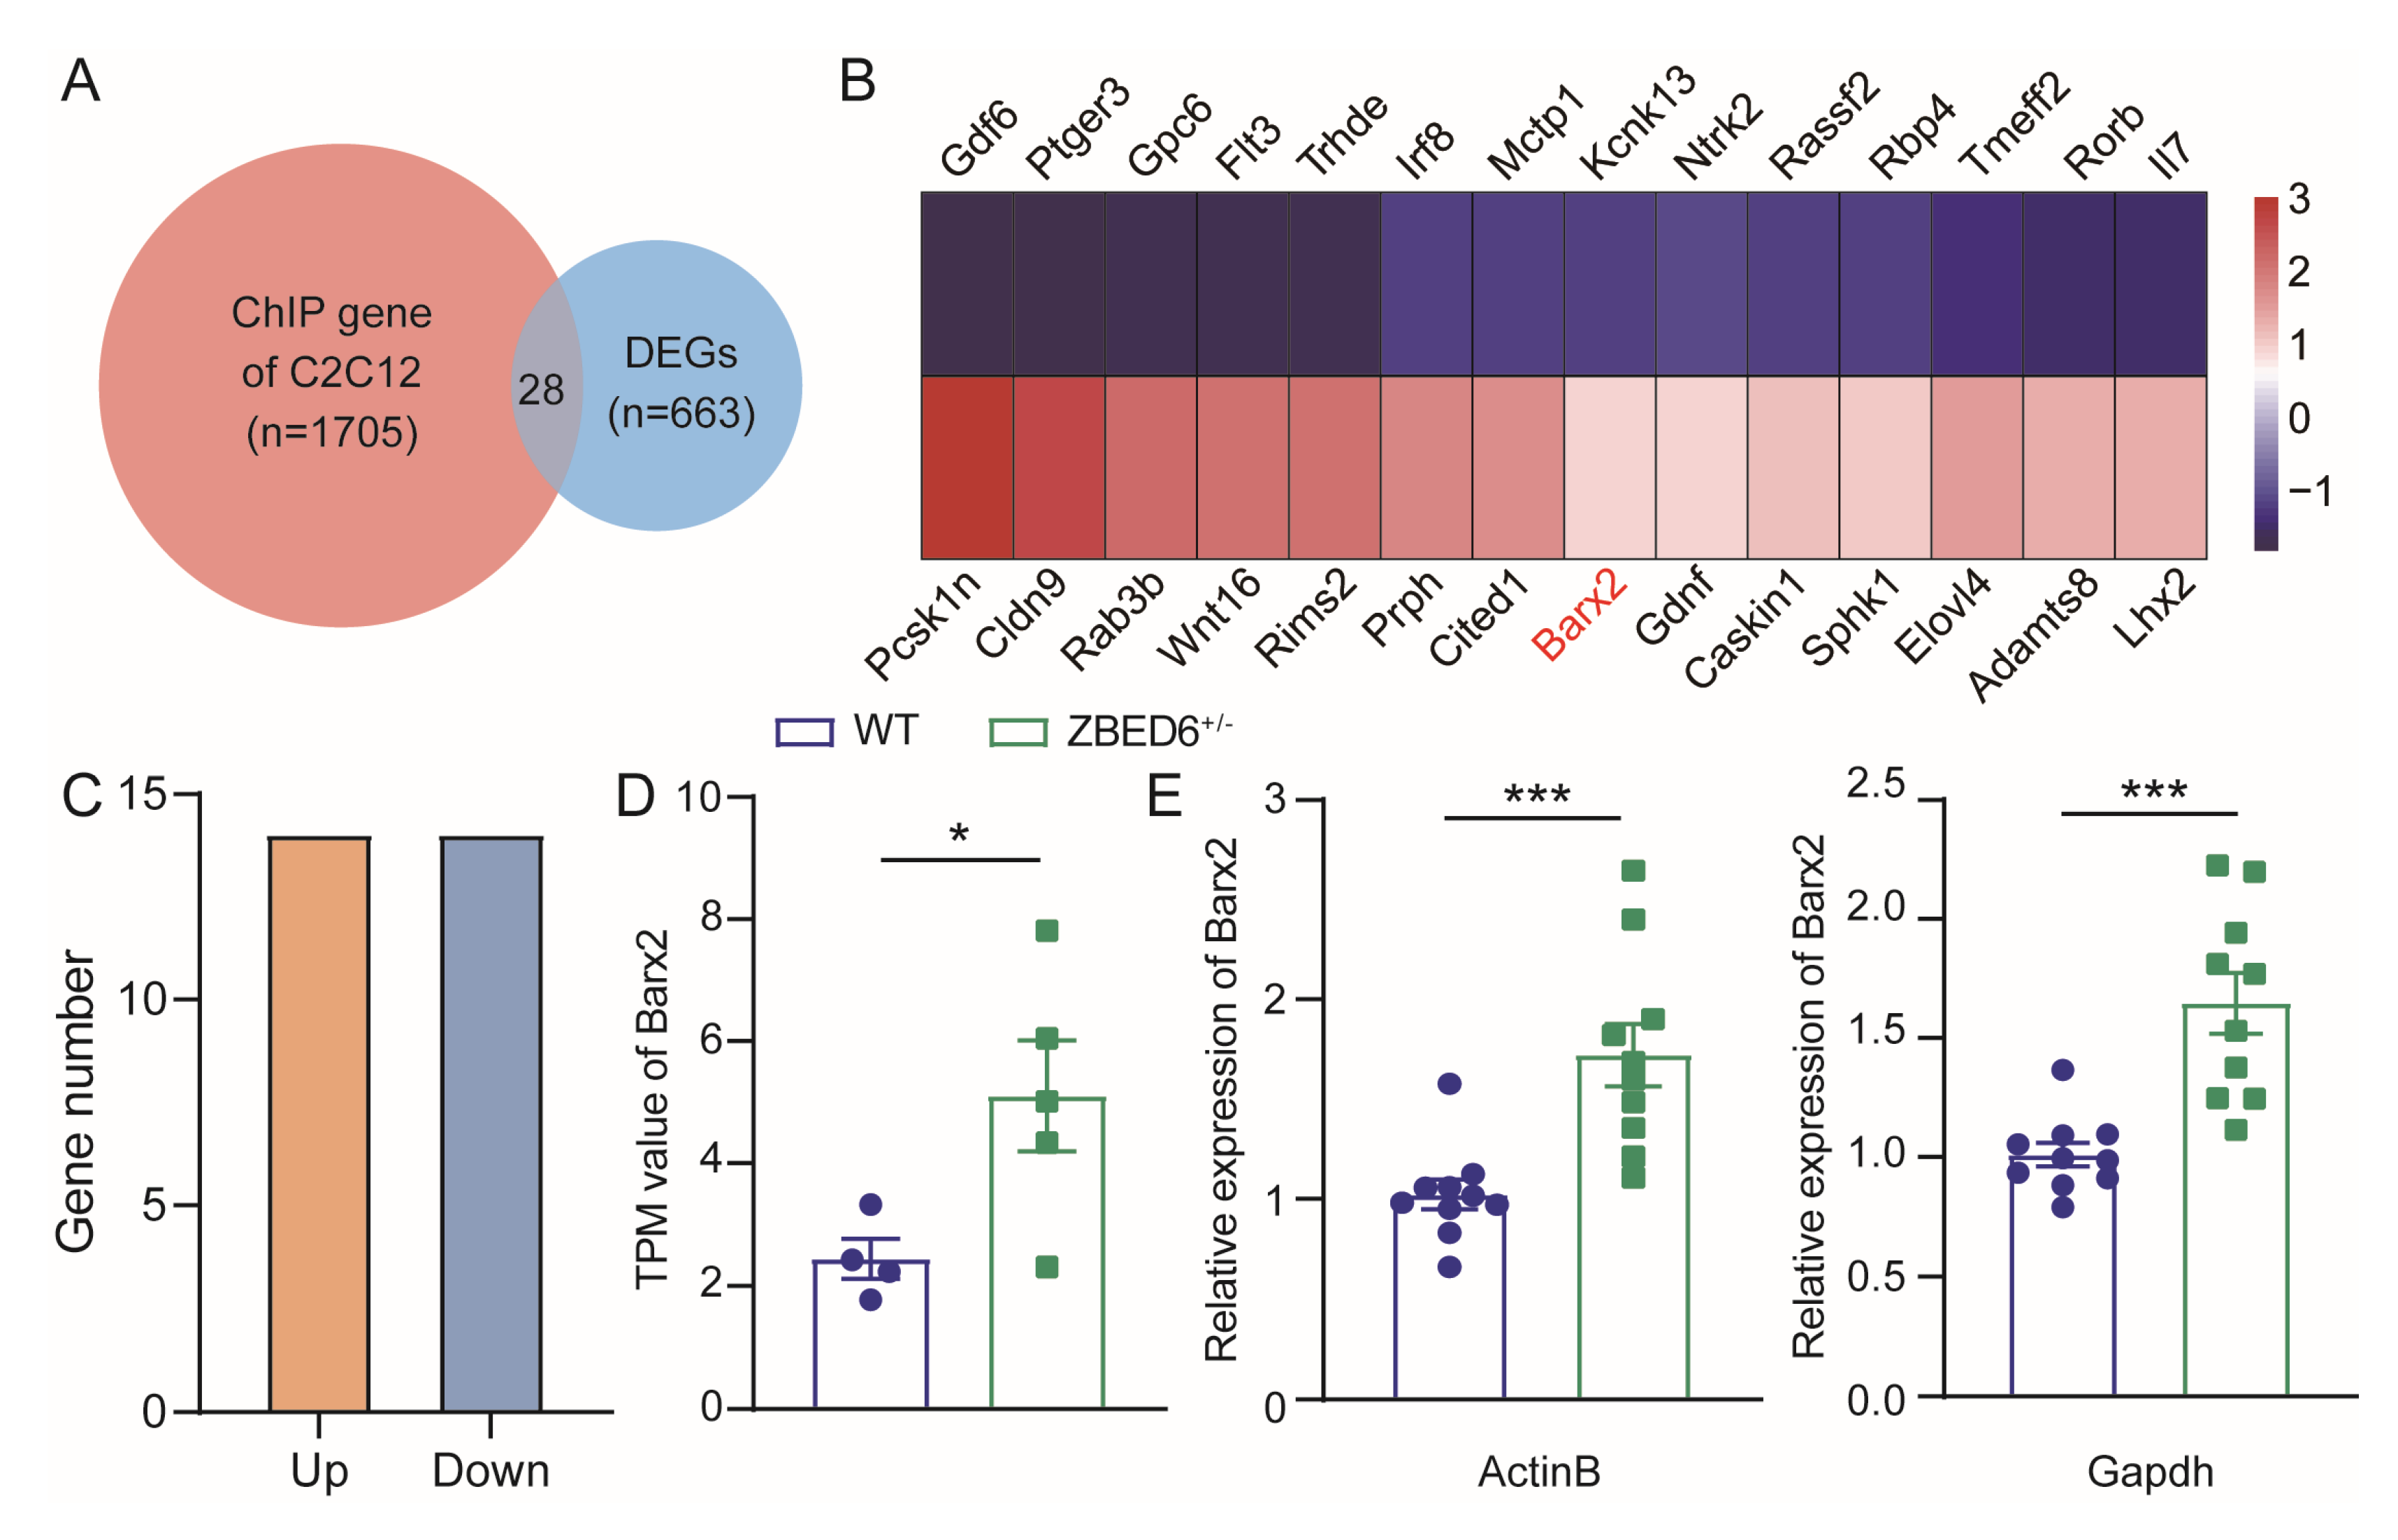
3.5. Zbed6+/− May Increase the Muscle Growth of Mice via Upregulation of Barx2
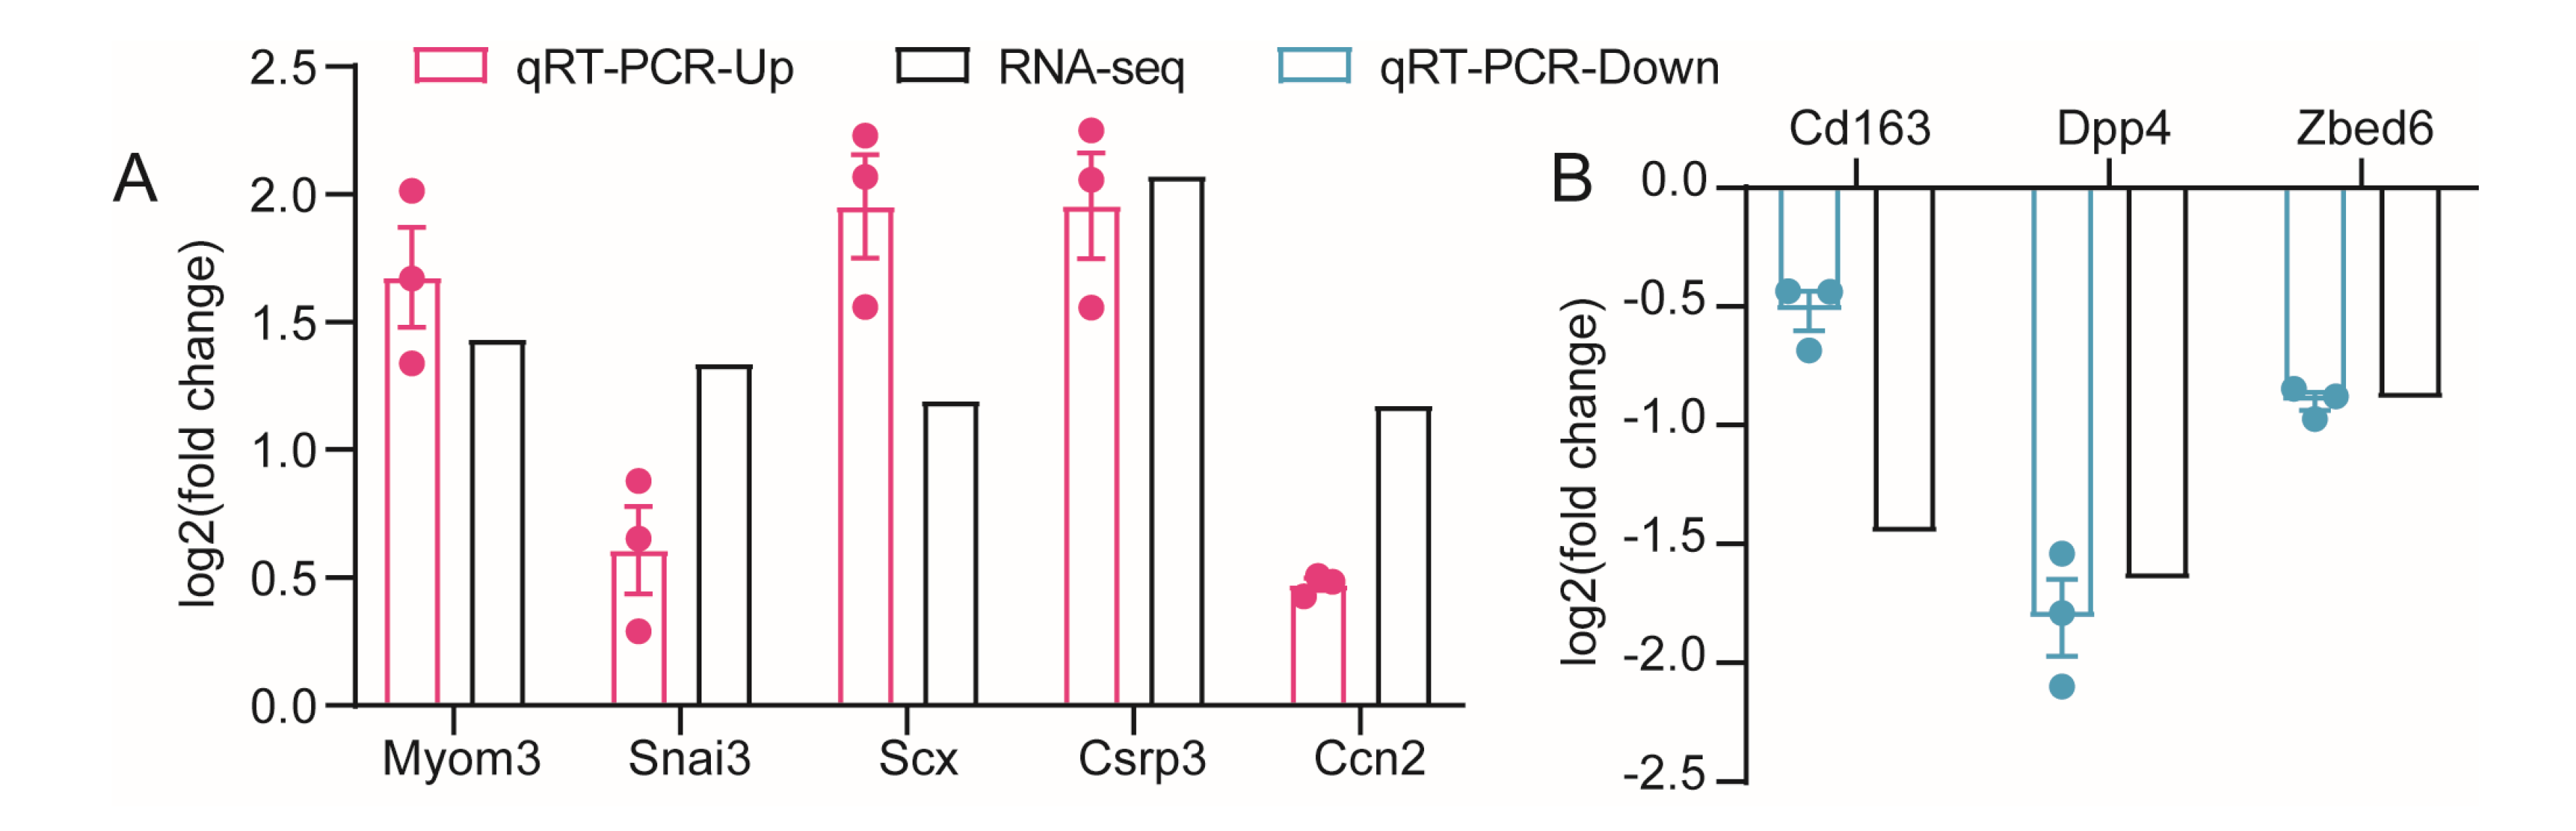
3.6. Verification of Gene Expression Profiles
4. Discussion
5. Conclusions
Supplementary Materials
Author Contributions
Funding
Institutional Review Board Statement
Informed Consent Statement
Data Availability Statement
Acknowledgments
Conflicts of Interest
References
- Markljung, E.; Jiang, L.; Jaffe, J.D.; Mikkelsen, T.S.; Wallerman, O.; Larhammar, M.; Zhang, X.; Wang, L.; Saenz-Vash, V.; Gnirke, A.; et al. ZBED6, a Novel Transcription Factor Derived from a Domesticated DNA Transposon Regulates IGF2 Expression and Muscle Growth. PLoS Biol. 2009, 7, e1000256. [Google Scholar] [CrossRef] [PubMed]
- Younis, S.; Schönke, M.; Massart, J.; Hjortebjerg, R.; Sundström, E.; Gustafson, U.; Björnholm, M.; Krook, A.; Frystyk, J.; Zierath, J.R.; et al. The ZBED6–IGF2 axis has a major effect on growth of skeletal muscle and internal organs in placental mammals. Proc. Natl. Acad. Sci. USA 2018, 115, E2048–E2057. [Google Scholar] [CrossRef] [PubMed] [Green Version]
- Andersson, L.; Andersson, G.; Hjälm, G.; Jiang, L.; Lindblad-Toh, K.; Lindroth, A.M.; Markljung, E.; Nyström, A.-M.; Rubin, C.-J.; Sundström, E. ZBED6: The birth of a new. Transcription factor in the common ancestor of pla-cental mammals. Transcription 2010, 1, 144–148. [Google Scholar] [CrossRef] [PubMed] [Green Version]
- Jeon, J.-T.; Carlborg, Ö.; Törnsten, A.; Giuffra, E.; Amarger, V.; Chardon, P.; Andersson-Eklund, L.; Andersson, K.; Hansson, I.; Lundström, K.; et al. A paternally expressed QTL affecting skeletal and cardiac muscle mass in pigs maps to the IGF2 locus. Nat. Genet. 1999, 21, 157–158. [Google Scholar] [CrossRef]
- Nezer, C.; Moreau, L.; Brouwers, B.; Coppieters, W.; Detilleux, J.; Hanset, R.; Karim, L.; Kvasz, A.; Leroy, P.; Georges, M. An imprinted QTL with major effect on muscle mass and fat deposition maps to the IGF2 locus in pigs. Nat. Genet. 1999, 21, 155–156. [Google Scholar] [CrossRef]
- Van Laere, A.-S.; Nguyen, M.; Braunschweig, M.; Nezer, C.; Collette, C.; Moreau, L.; Archibald, A.L.; Haley, C.S.; Buys, N.; Tally, M.; et al. A regulatory mutation in IGF2 causes a major QTL effect on muscle growth in the pig. Nature 2003, 425, 832–836. [Google Scholar] [CrossRef]
- Huang, Y.-Z.; He, H.; Zhan, Z.-Y.; Sun, Y.-J.; Li, M.-X.; Lan, X.-Y.; Lei, C.-Z.; Zhang, C.-L.; Chen, H. Relationship of polymorphisms within ZBED6 gene and growth traits in beef cattle. Gene 2013, 526, 107–111. [Google Scholar] [CrossRef]
- Huang, Y.-Z.; Zhan, Z.-Y.; Sun, Y.-J.; Wang, J.; Li, M.-X.; Lan, X.-Y.; Lei, C.-Z.; Zhang, C.-L.; Chen, H. Comparative analysis of the IGF2 and ZBED6 gene variants and haplotypes reveals significant effect of growth traits in cattle. Genome 2013, 56, 327–334. [Google Scholar] [CrossRef]
- Xiang, G.H.; Ren, J.L.; Hai, T.; Fu, R.; Yu, D.W.; Wang, J.; Li, W.; Wang, H.Y.; Zhou, Q. Editing porcine IGF2 regulatory element improved meat production in Chinese Bama pigs. Cell. Mol. Life Sci. 2018, 75, 4619–4628. [Google Scholar] [CrossRef]
- Wang, D.; Pan, D.; Xie, B.; Wang, S.; Xing, X.; Liu, X.; Ma, Y.; Andersson, L.; Wu, J.; Jiang, L. Porcine ZBED6 regulates growth of skeletal muscle and internal organs via multiple targets. PLoS Genet. 2021, 17, e1009862. [Google Scholar] [CrossRef]
- Wang, S.; Tian, W.; Pan, D.; Liu, L.; Xu, C.; Ma, Y.; Wang, D.; Jiang, L. A Comprehensive Analysis of the Myocardial Transcriptome in ZBED6-Knockout Bama Xiang Pigs. Genes 2022, 13, 1382. [Google Scholar] [CrossRef]
- Liu, X.F.; Liu, H.B.; Wang, M.; Li, R.Q.; Zeng, J.H.; Mo, D.; Cong, P.Q.; Liu, X.H.; Chen, Y.S.; He, Z.Y. Disruption of the ZBED6 binding site in intron 3 of IGF2 by CRISPR/Cas9 leads to enhanced muscle development in Liang Guang Small Spotted pigs. Transgenic Res. 2018, 28, 141–150. [Google Scholar] [CrossRef] [PubMed]
- Jiang, L.; Wallerman, O.; Younis, S.; Rubin, C.-J.; Gilbert, E.R.; Sundström, E.; Ghazal, A.; Zhang, X.; Wang, L.; Mikkelsen, T.S.; et al. ZBED6 Modulates the Transcription of Myogenic Genes in Mouse Myoblast Cells. PLoS ONE 2014, 9, e94187. [Google Scholar] [CrossRef] [PubMed] [Green Version]
- Younis, S.; Naboulsi, R.; Wang, X.; Cao, X.; Larsson, M.; Sargsyan, E.; Bergsten, P.; Welsh, N.; Andersson, L. The importance of the ZBED6-IGF2 axis for metabolic regulation in mouse myoblast cells. FASEB J. 2020, 34, 10250–10266. [Google Scholar] [CrossRef] [PubMed]
- Wang, X.; Jiang, L.; Wallerman, O.; Younis, S.; Yu, Q.; Klaesson, A.; Tengholm, A.; Welsh, N.; Andersson, L. ZBED6 negatively regulates insulin production, neuronal differentiation, and cell aggregation in MIN6 cells. FASEB J. 2019, 33, 88–100. [Google Scholar] [CrossRef] [PubMed] [Green Version]
- Wang, X.; Jiang, L.; Wallerman, O.; Engström, U.; Ameur, A.; Gupta, R.K.; Qi, Y.; Andersson, L.; Welsh, N. Transcription factor ZBED6 affects gene expression, proliferation, and cell death in pancreatic beta cells. Proc. Natl. Acad. Sci. USA 2013, 110, 15997–16002. [Google Scholar] [CrossRef] [PubMed] [Green Version]
- Zhang, W.; Cline, M.A.; Liu, D.; Gilbert, E.R. Knockdown ofZBED6is not associated with changes in murine preadipocyte proliferation or differentiation. Adipocyte 2013, 2, 251–255. [Google Scholar] [CrossRef] [Green Version]
- Ali, M.A.; Younis, S.; Wallerman, O.; Gupta, R.; Andersson, L.; Sjöblom, T. Transcriptional modulator ZBED6 affects cell cycle and growth of human colorectal cancer cells. Proc. Natl. Acad. Sci. USA 2015, 112, 7743–7748. [Google Scholar] [CrossRef] [Green Version]
- Zhao, H.; Wu, M.; Liu, S.; Tang, X.; Yi, X.; Li, Q.; Wang, S.; Sun, X. Liver Expression of IGF2 and Related Proteins in ZBED6 Gene-edited Pig by RNA-seq. Animals 2020, 10, 2184. [Google Scholar] [CrossRef]
- Naboulsi, R.; Larsson, M.; Andersson, L.; Younis, S. ZBED6 regulates Igf2 expression partially through its regulation of miR483 expression. Sci. Rep. 2021, 11, 1–12. [Google Scholar] [CrossRef]
- Zou, H.; Yu, D.; Yao, S.; Ding, F.; Li, J.; Li, L.; Li, X.; Zhao, S.; Pang, Y.; Hao, H.; et al. Efficient Editing of the ZBED6-Binding Site in Intron 3 of IGF2 in a Bovine Model Using the CRISPR/Cas9 System. Genes 2022, 13, 1132. [Google Scholar] [CrossRef] [PubMed]
- Jones, F.S.; Kioussi, C.; Copertino, D.W.; Kallunki, P.; Holst, B.D.; Edelman, G.M. Barx2, a new homeobox gene of the Bar class, is expressed in neural and craniofacial structures during development. Proc. Natl. Acad. Sci. USA 1997, 94, 2632–2637. [Google Scholar] [CrossRef] [Green Version]
- Qiao, Z.; Zhang, S.; Hu, T.; Lan, F.; Yu, D.; Ge, G.; Li, C.; Fang, S.; Chen, Q. Tet2 regulates Barx2 expression in undifferentiated and early differentiated mouse embryonic stem cells. Biochem. Biophys. Res. Commun. 2020, 533, 1212–1218. [Google Scholar] [CrossRef] [PubMed]
- Hulin, J.-A.; Nguyen, T.D.T.; Cui, S.; Marri, S.; Yu, R.T.; Downes, M.; Evans, R.M.; Makarenkova, H.; Meech, R. Barx2 and Pax7 Regulate Axin2 Expression in Myoblasts by Interaction with β-Catenin and Chromatin Remodelling. Stem Cells 2016, 34, 2169–2182. [Google Scholar] [CrossRef] [Green Version]
- Herring, B.P.; Kriegel, A.M.; Hoggatt, A.M. Identification of Barx2B, a Serum Response Factor-associated Homeodomain Protein. J. Biol. Chem. 2001, 276, 14482–14489. [Google Scholar] [CrossRef] [PubMed] [Green Version]
- Meech, R.; Makarenkova, H.; Edelman, D.B.; Jones, F.S. The Homeodomain Protein Barx2 Promotes Myogenic Differentiation and Is Regulated by Myogenic Regulatory Factors. J. Biol. Chem. 2003, 278, 8269–8278. [Google Scholar] [CrossRef] [PubMed] [Green Version]
- Meech, R.; Gonzalez, K.N.; Barro, M.; Gromova, A.; Zhuang, L.; Hulin, J.-A.; Makarenkova, H.P. Barx2 Is Expressed in Satellite Cells and Is Required for Normal Muscle Growth and Regeneration. Stem Cells 2012, 30, 253–265. [Google Scholar] [CrossRef] [Green Version]


Disclaimer/Publisher’s Note: The statements, opinions and data contained in all publications are solely those of the individual author(s) and contributor(s) and not of MDPI and/or the editor(s). MDPI and/or the editor(s) disclaim responsibility for any injury to people or property resulting from any ideas, methods, instructions or products referred to in the content. |
© 2023 by the authors. Licensee MDPI, Basel, Switzerland. This article is an open access article distributed under the terms and conditions of the Creative Commons Attribution (CC BY) license (https://creativecommons.org/licenses/by/4.0/).
Share and Cite
Liu, L.; Wang, S.; Tian, W.; Xu, C.; Wei, C.; Cui, K.; Jiang, L.; Wang, D. Effect of Zbed6 Single-Allele Knockout on the Growth and Development of Skeletal Muscle in Mice. Biology 2023, 12, 325. https://doi.org/10.3390/biology12020325
Liu L, Wang S, Tian W, Xu C, Wei C, Cui K, Jiang L, Wang D. Effect of Zbed6 Single-Allele Knockout on the Growth and Development of Skeletal Muscle in Mice. Biology. 2023; 12(2):325. https://doi.org/10.3390/biology12020325
Chicago/Turabian StyleLiu, Ling, Shengnan Wang, Wenjie Tian, Cheng Xu, Chengjie Wei, Kai Cui, Lin Jiang, and Dandan Wang. 2023. "Effect of Zbed6 Single-Allele Knockout on the Growth and Development of Skeletal Muscle in Mice" Biology 12, no. 2: 325. https://doi.org/10.3390/biology12020325