
Identification of Wnt/β-Catenin- and Autophagy-Related lncRNA Signature for Predicting Immune Efficacy in Pancreatic Adenocarcinoma
 and
and 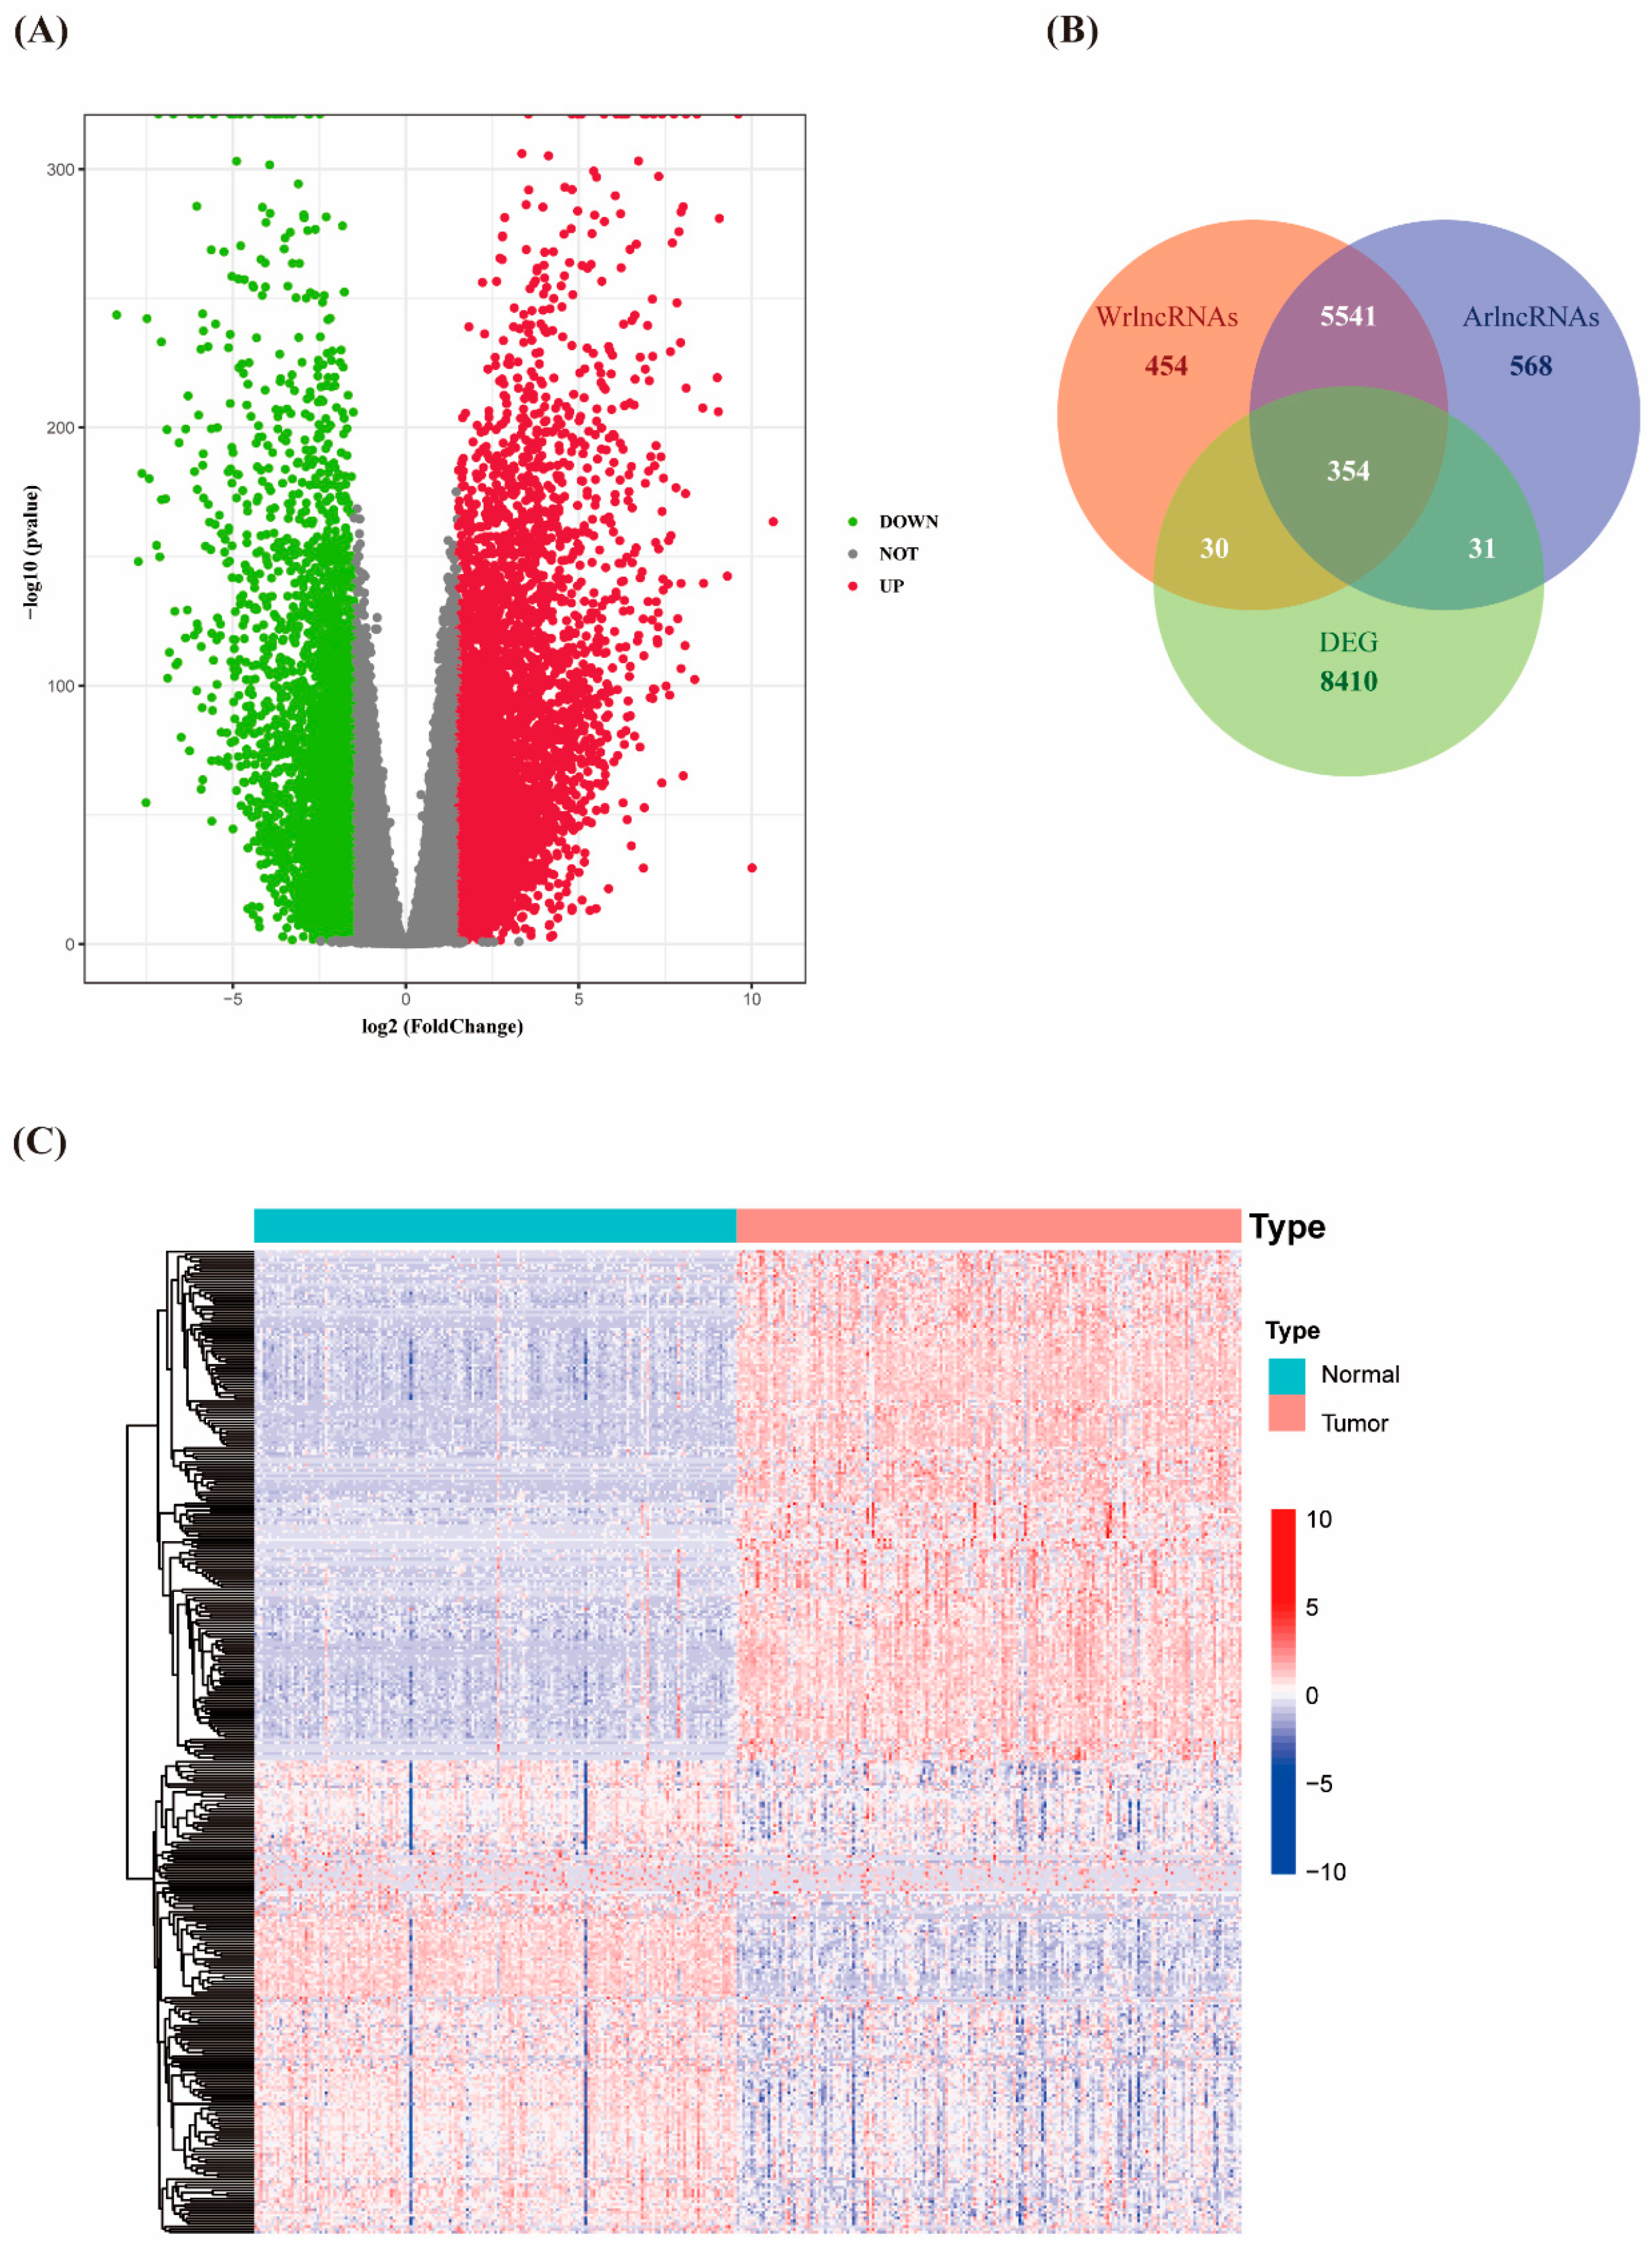
Abstract
:Simple Summary
Abstract
1. Introduction
2. Materials and Methods
2.1. Datasets and Sample Extraction
2.2. Identification and Screening of Differentially Expressed arlncRNAs and wrlncRNAs
2.3. Construction and Validation of the warlncRNAs Prognostic Signature
2.4. Immune Infiltration Analysis and Efficacy Prediction
2.5. Statistical Analysis
3. Results
3.1. Identification of Differentially Expressed Autophagy- and Wnt/β-Catenin- Related lncRNAs in PAAD
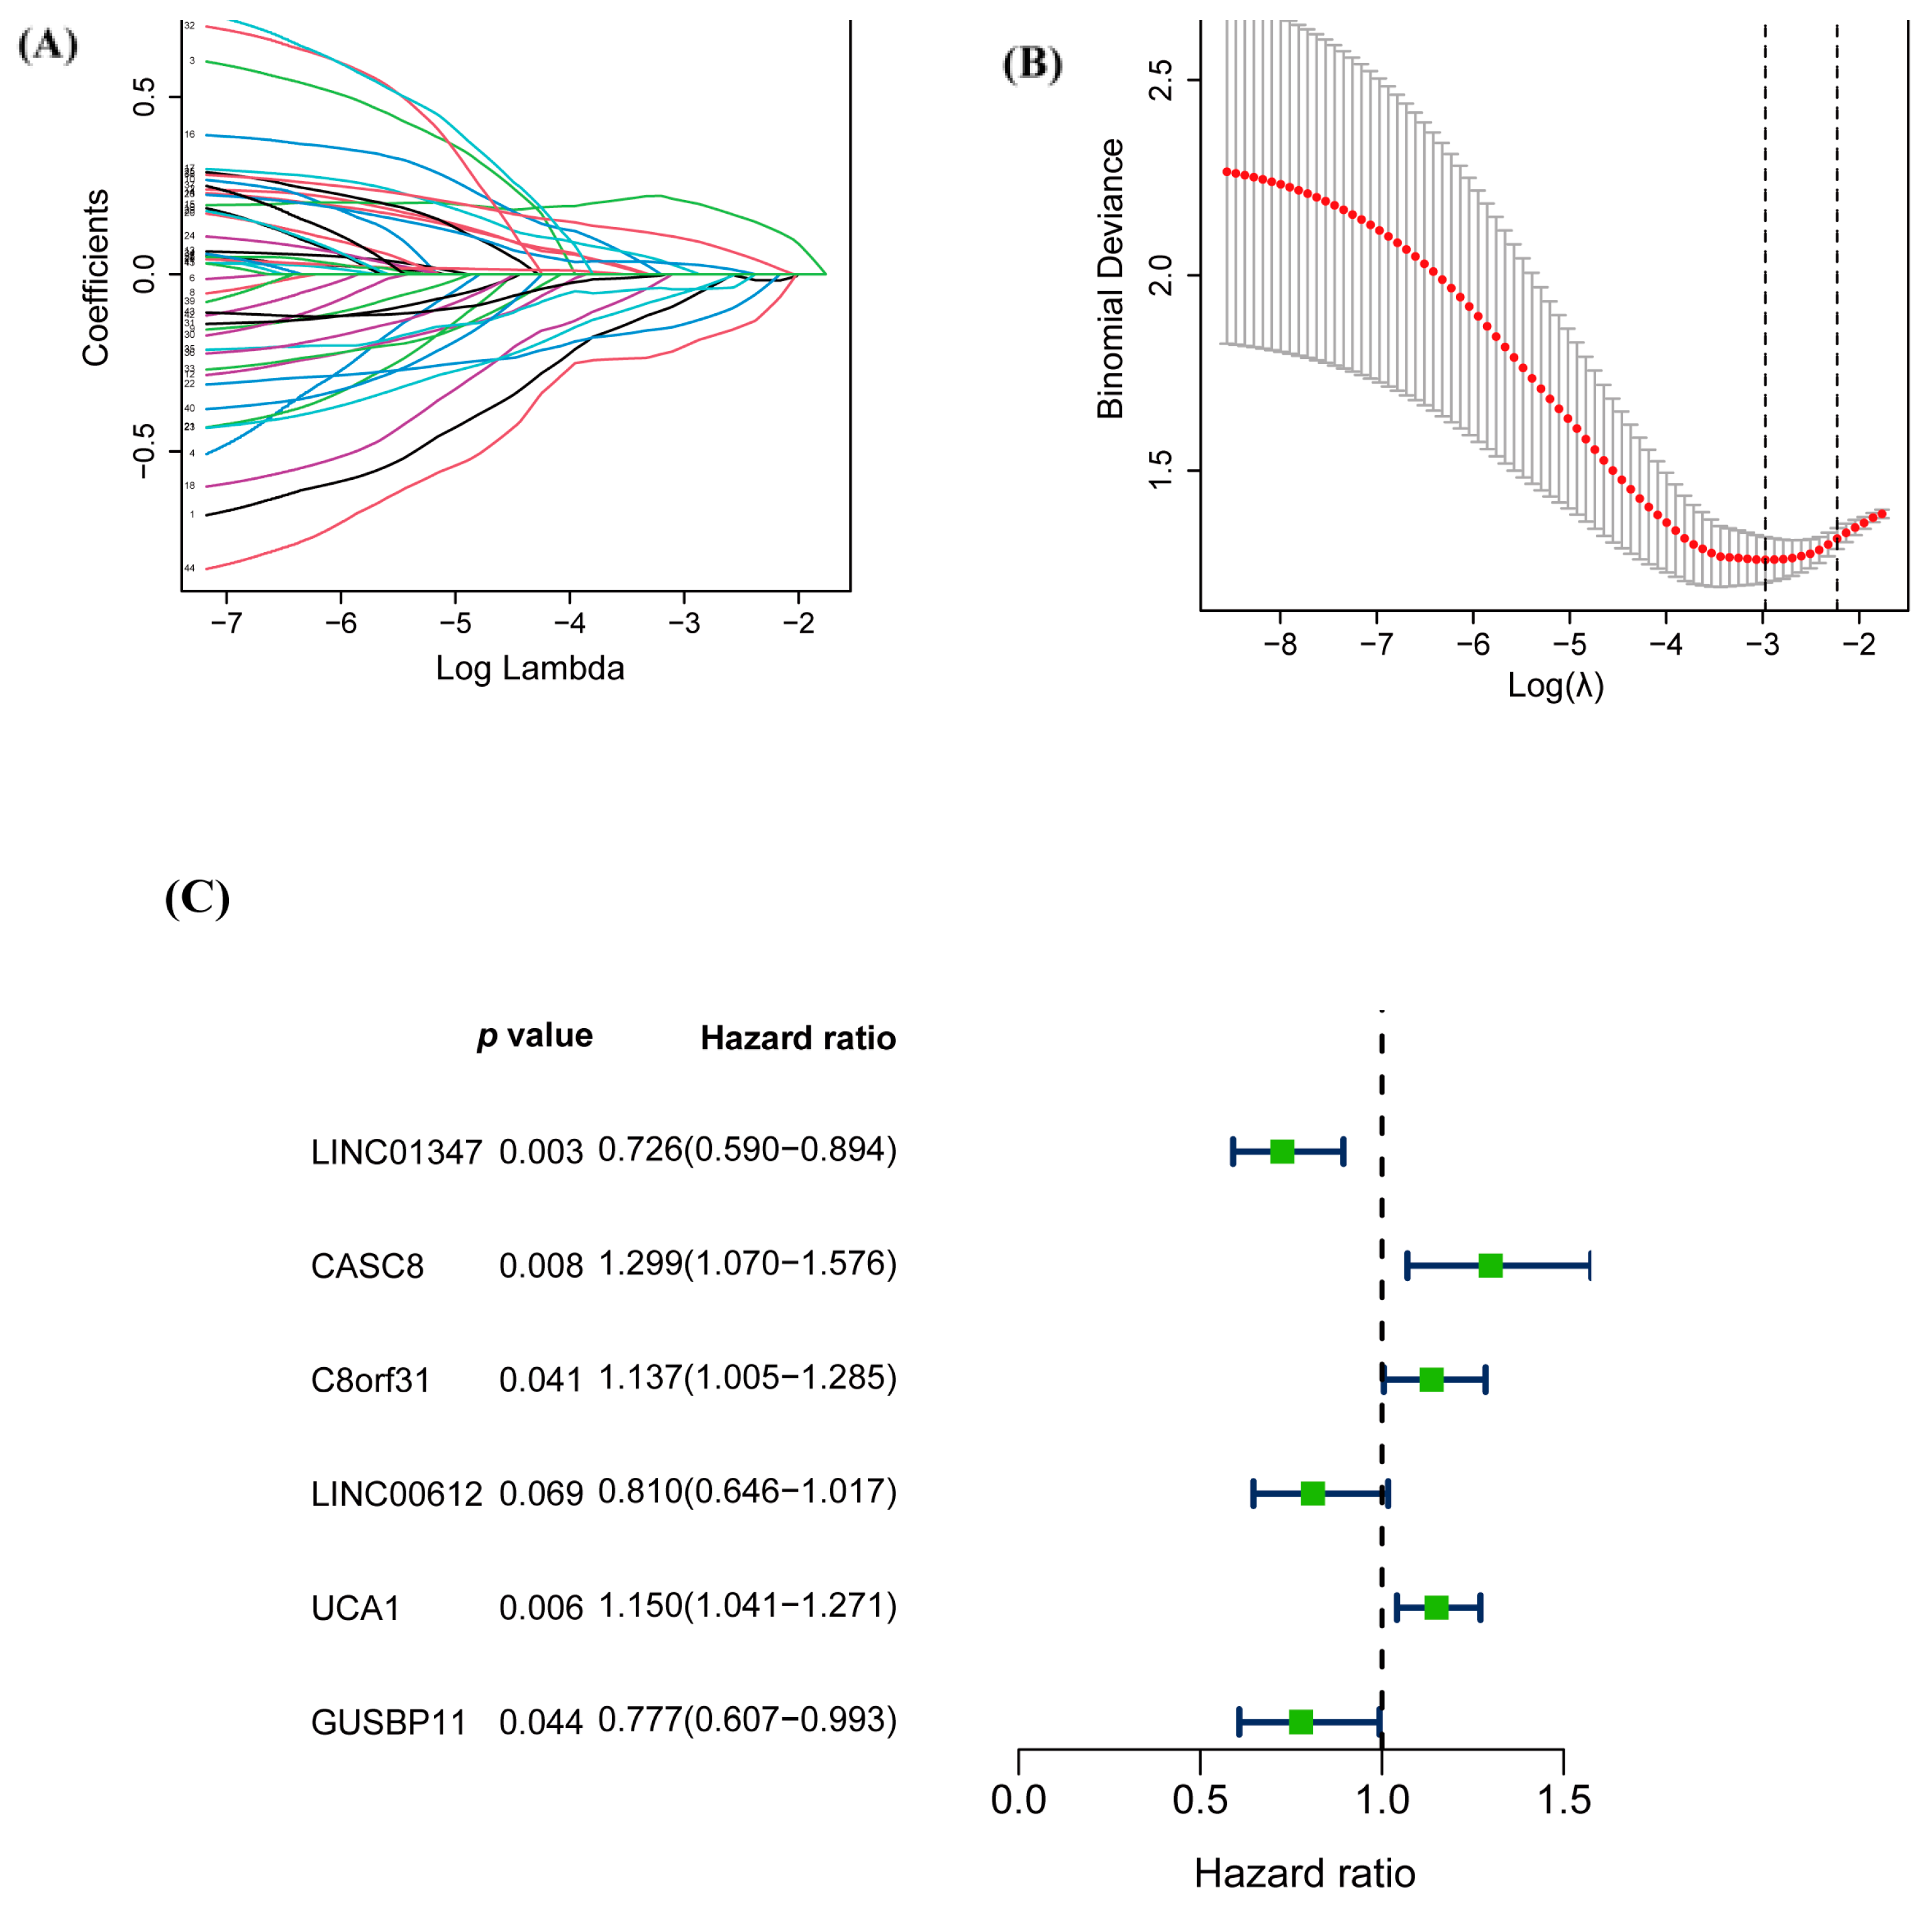
3.2. Construction of the Prognostic Risk Score Model of warlncRNAs
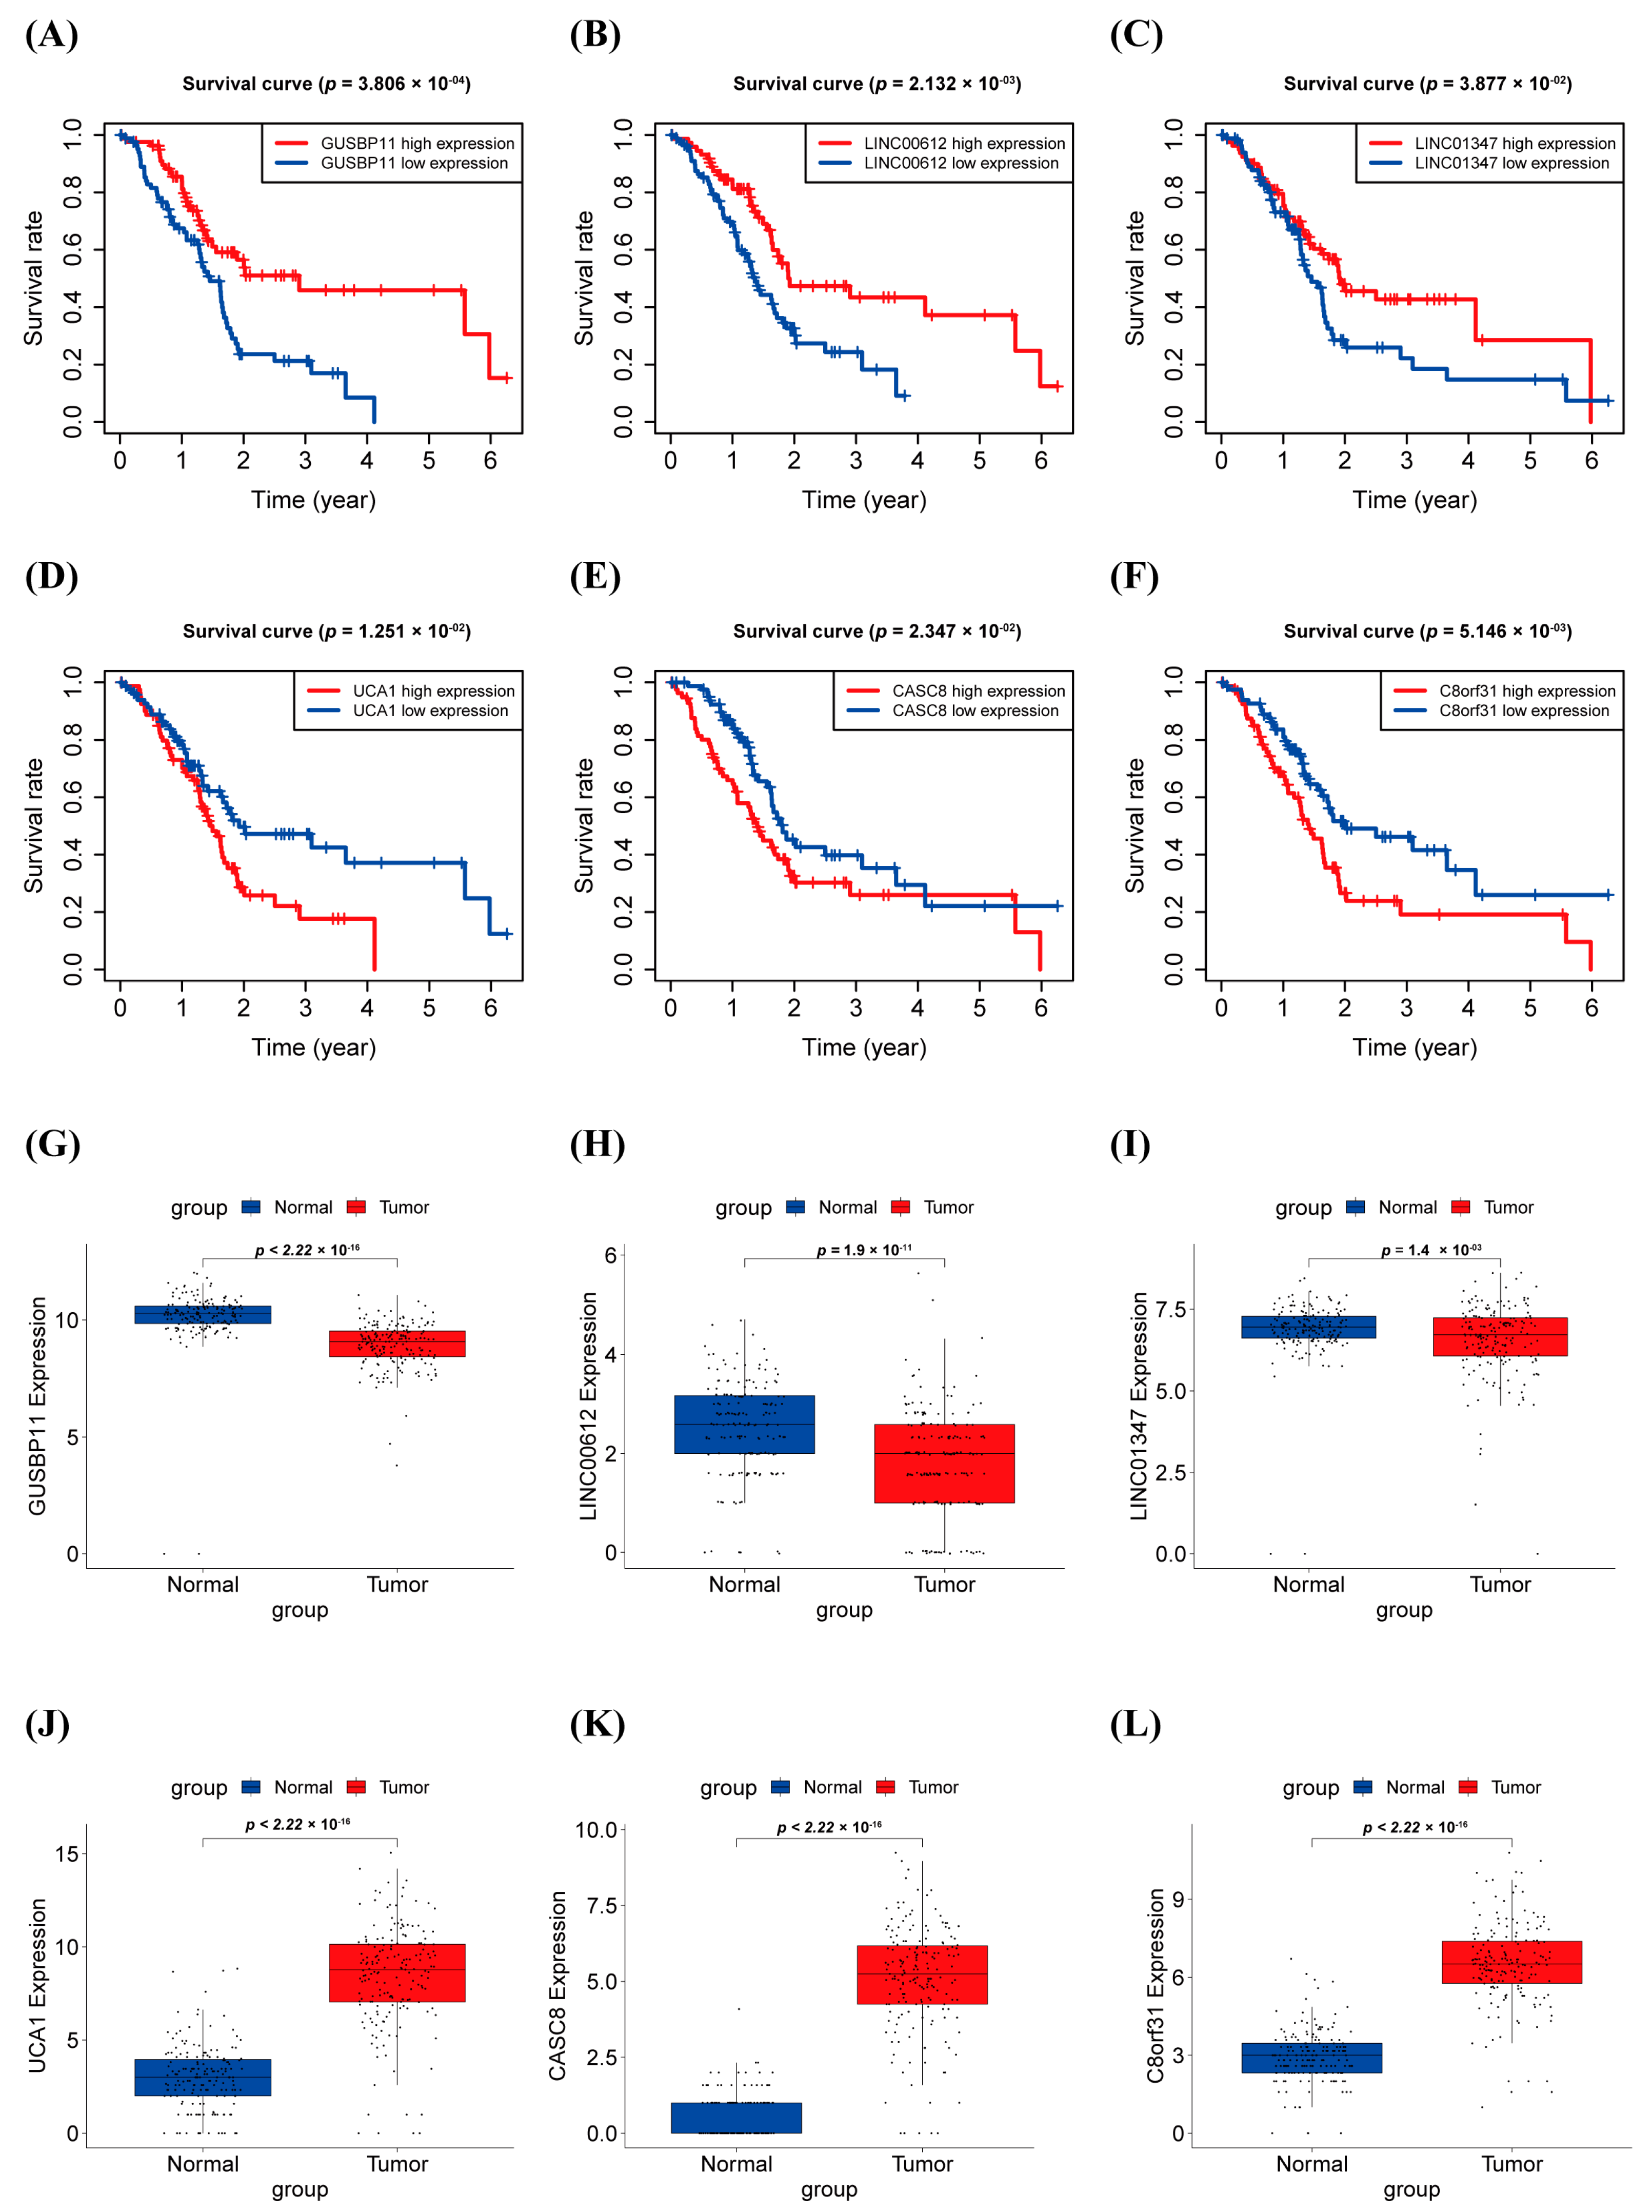
3.3. Survival Analysis and Expression Level in PAAD of warlncRNAs
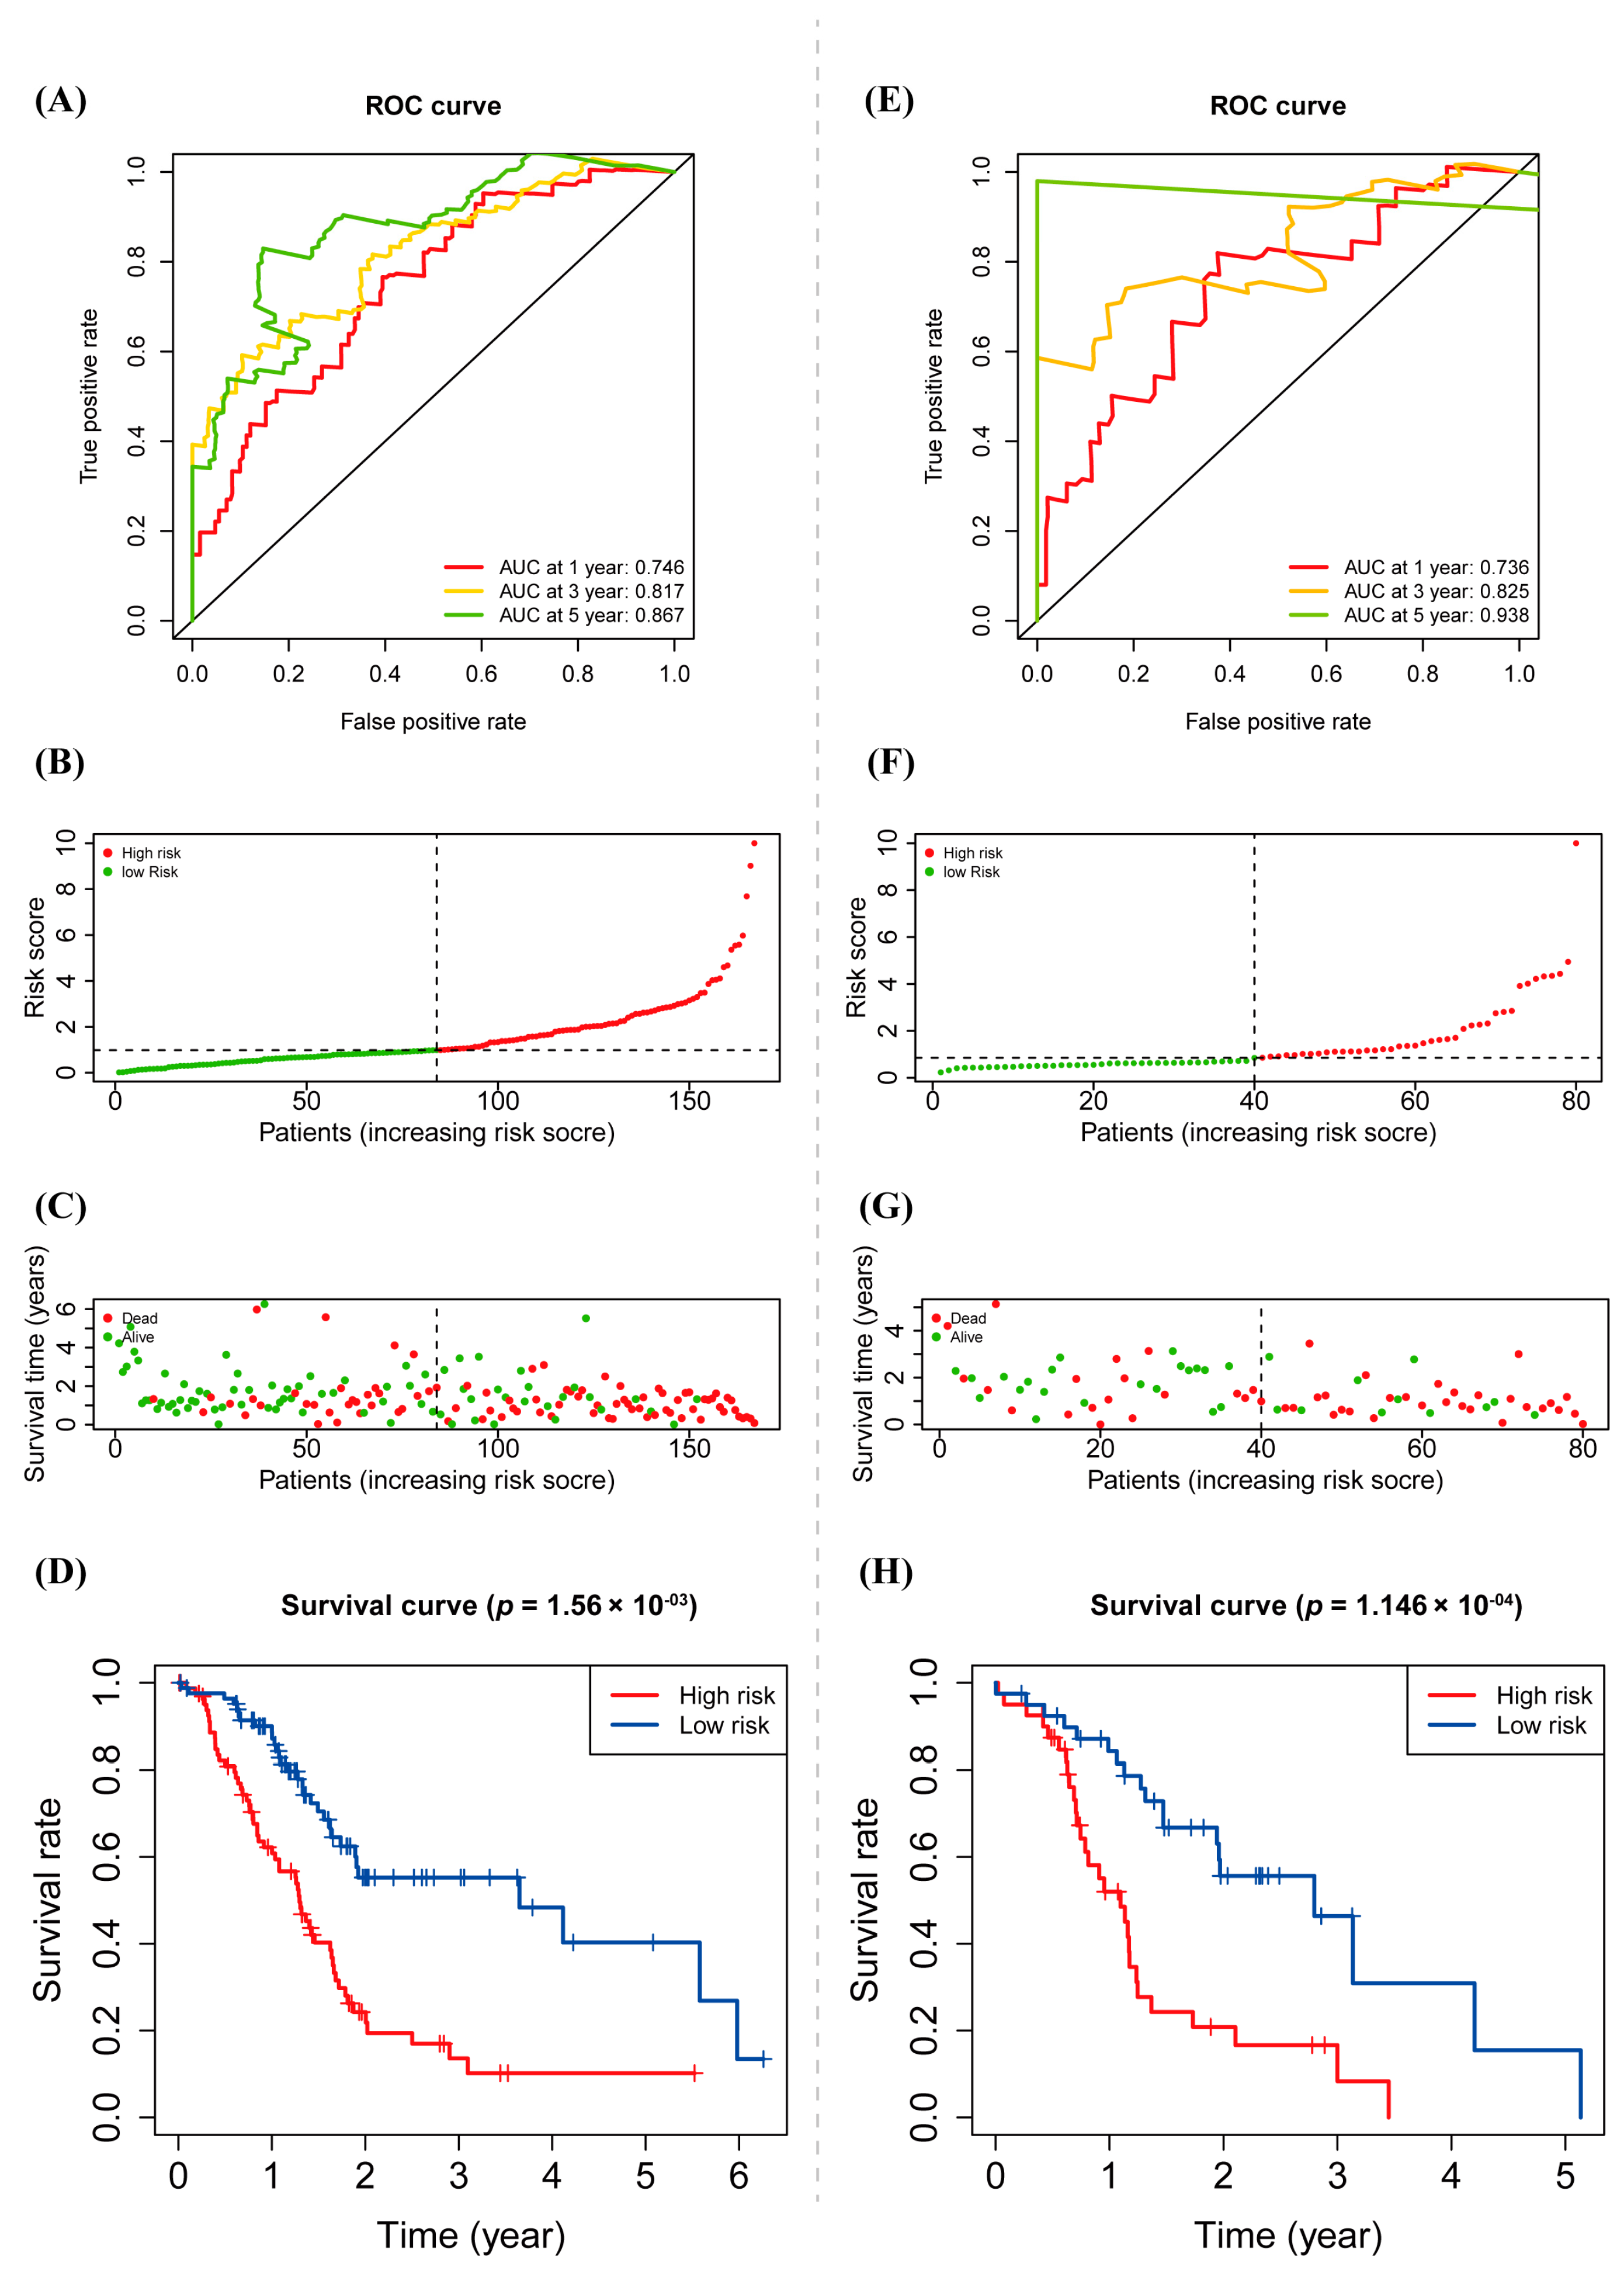
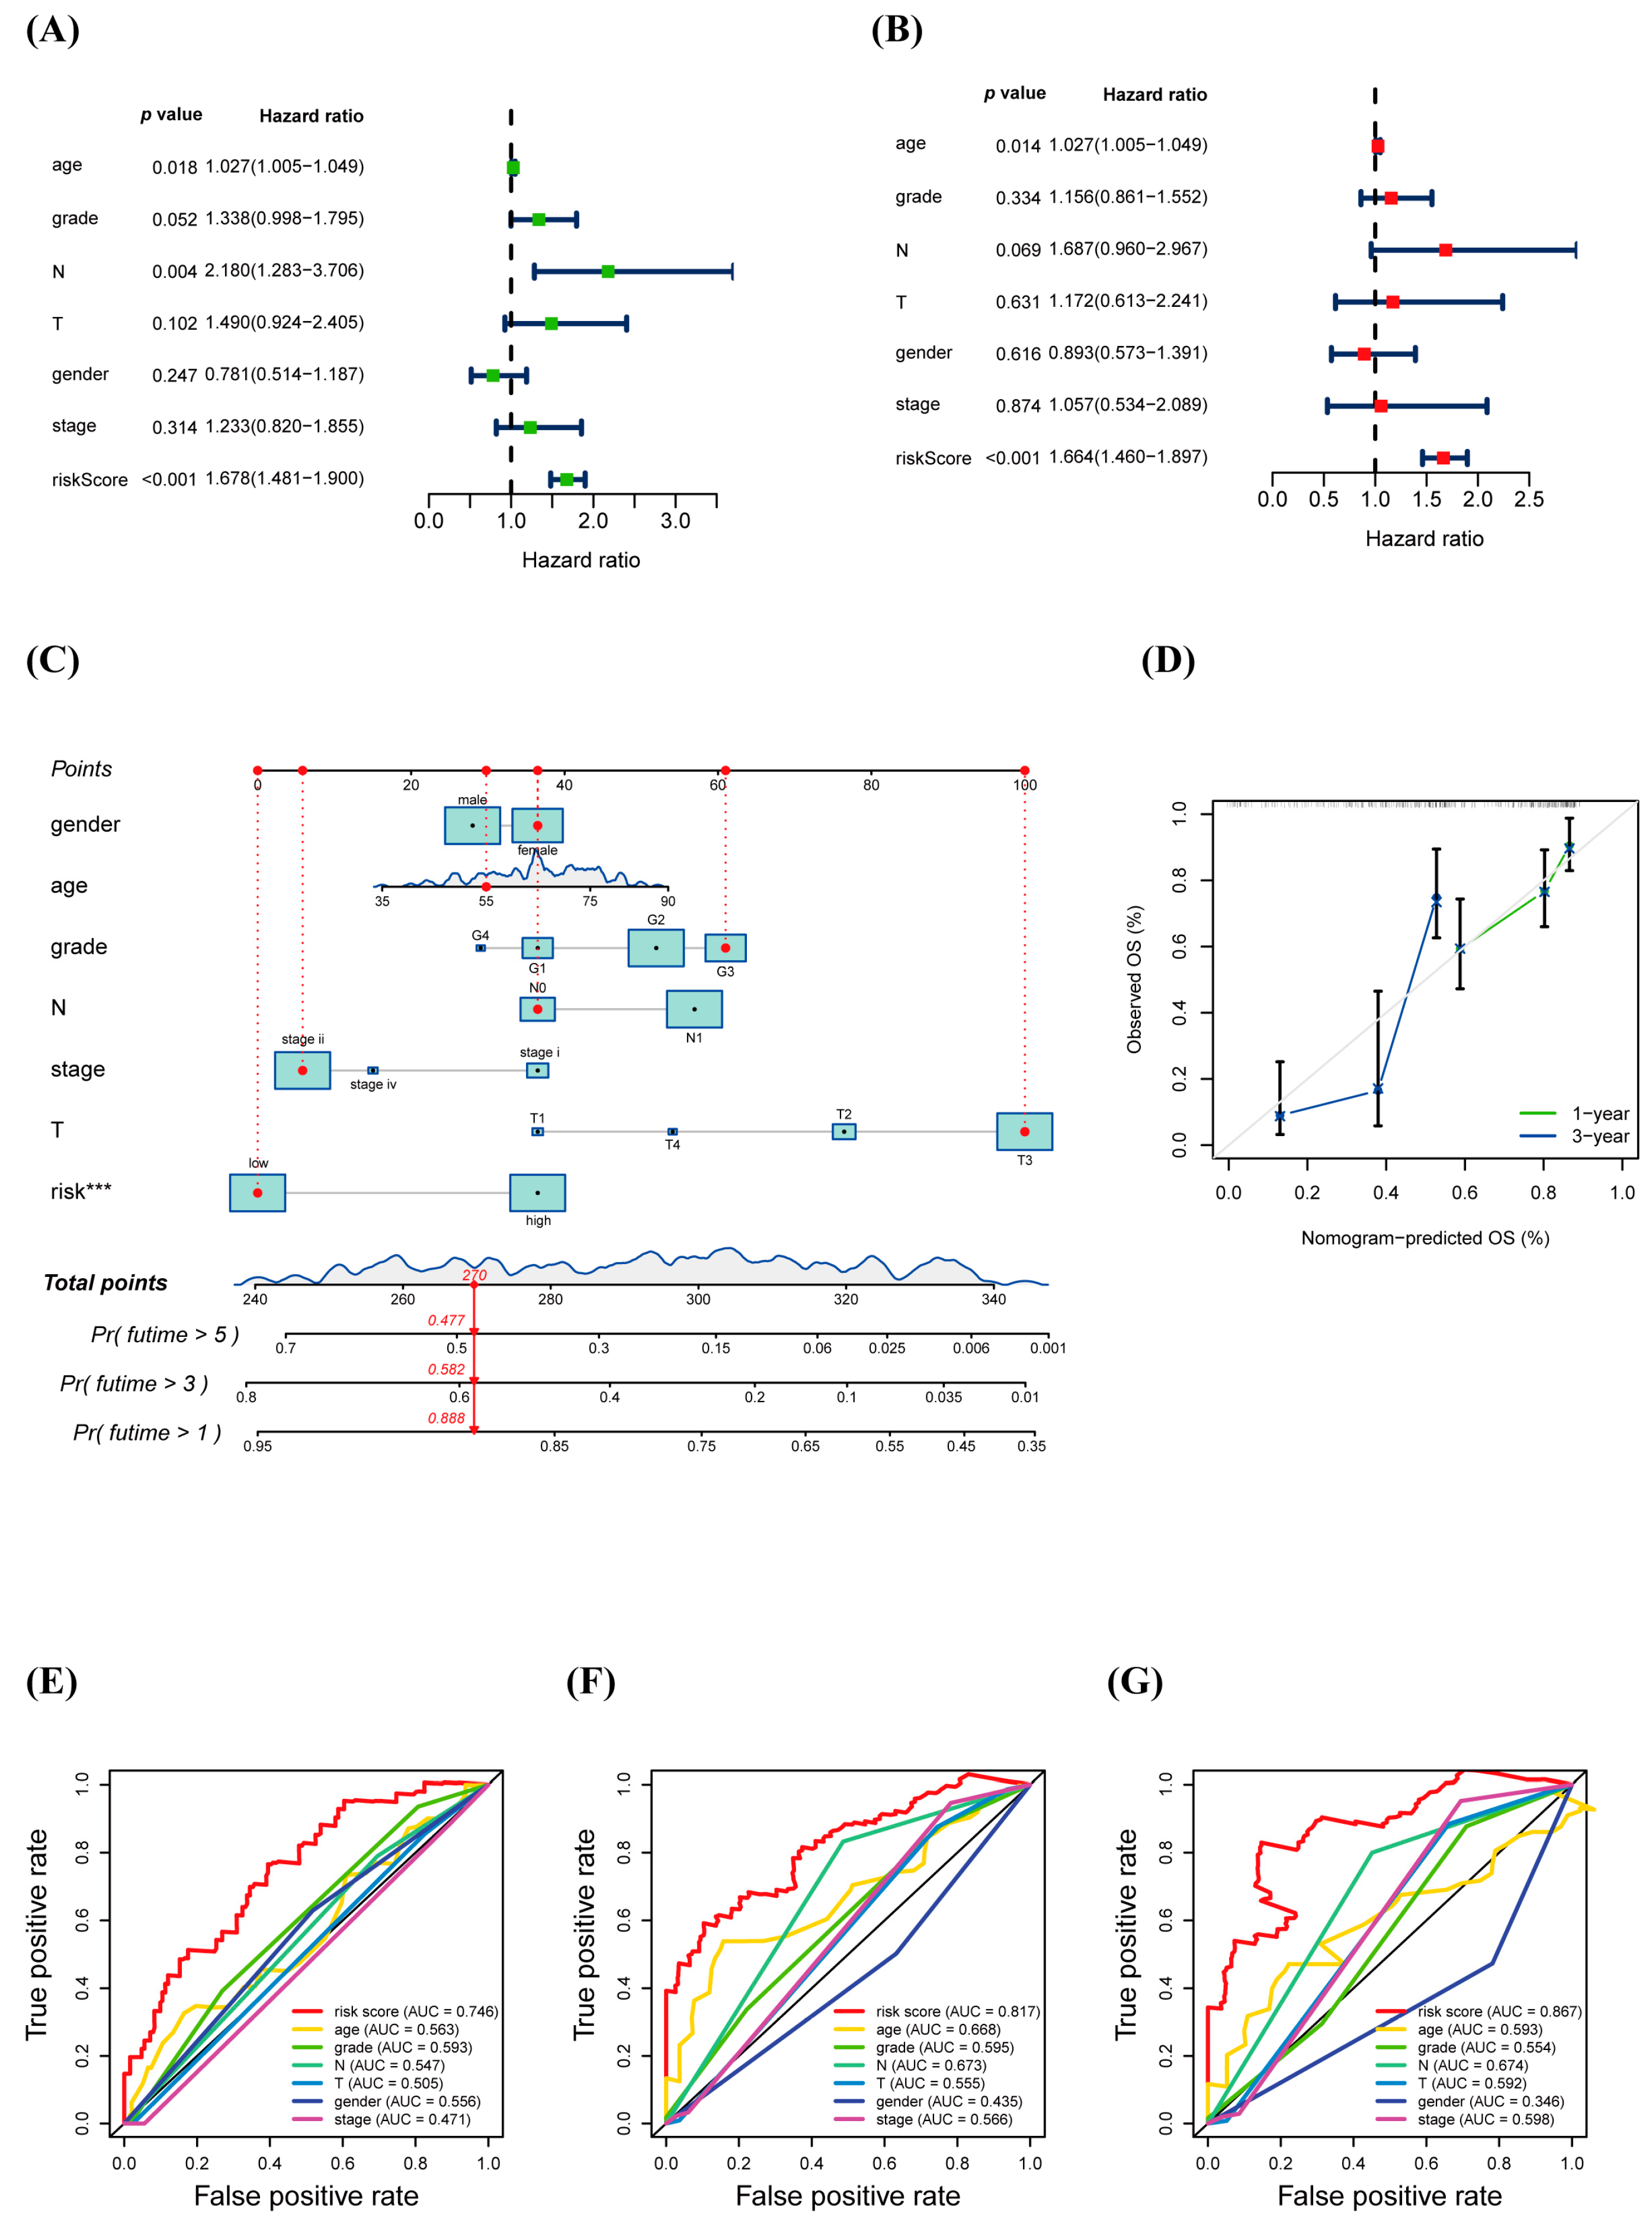
3.4. Prognostic Value of warlncRNAs Signature
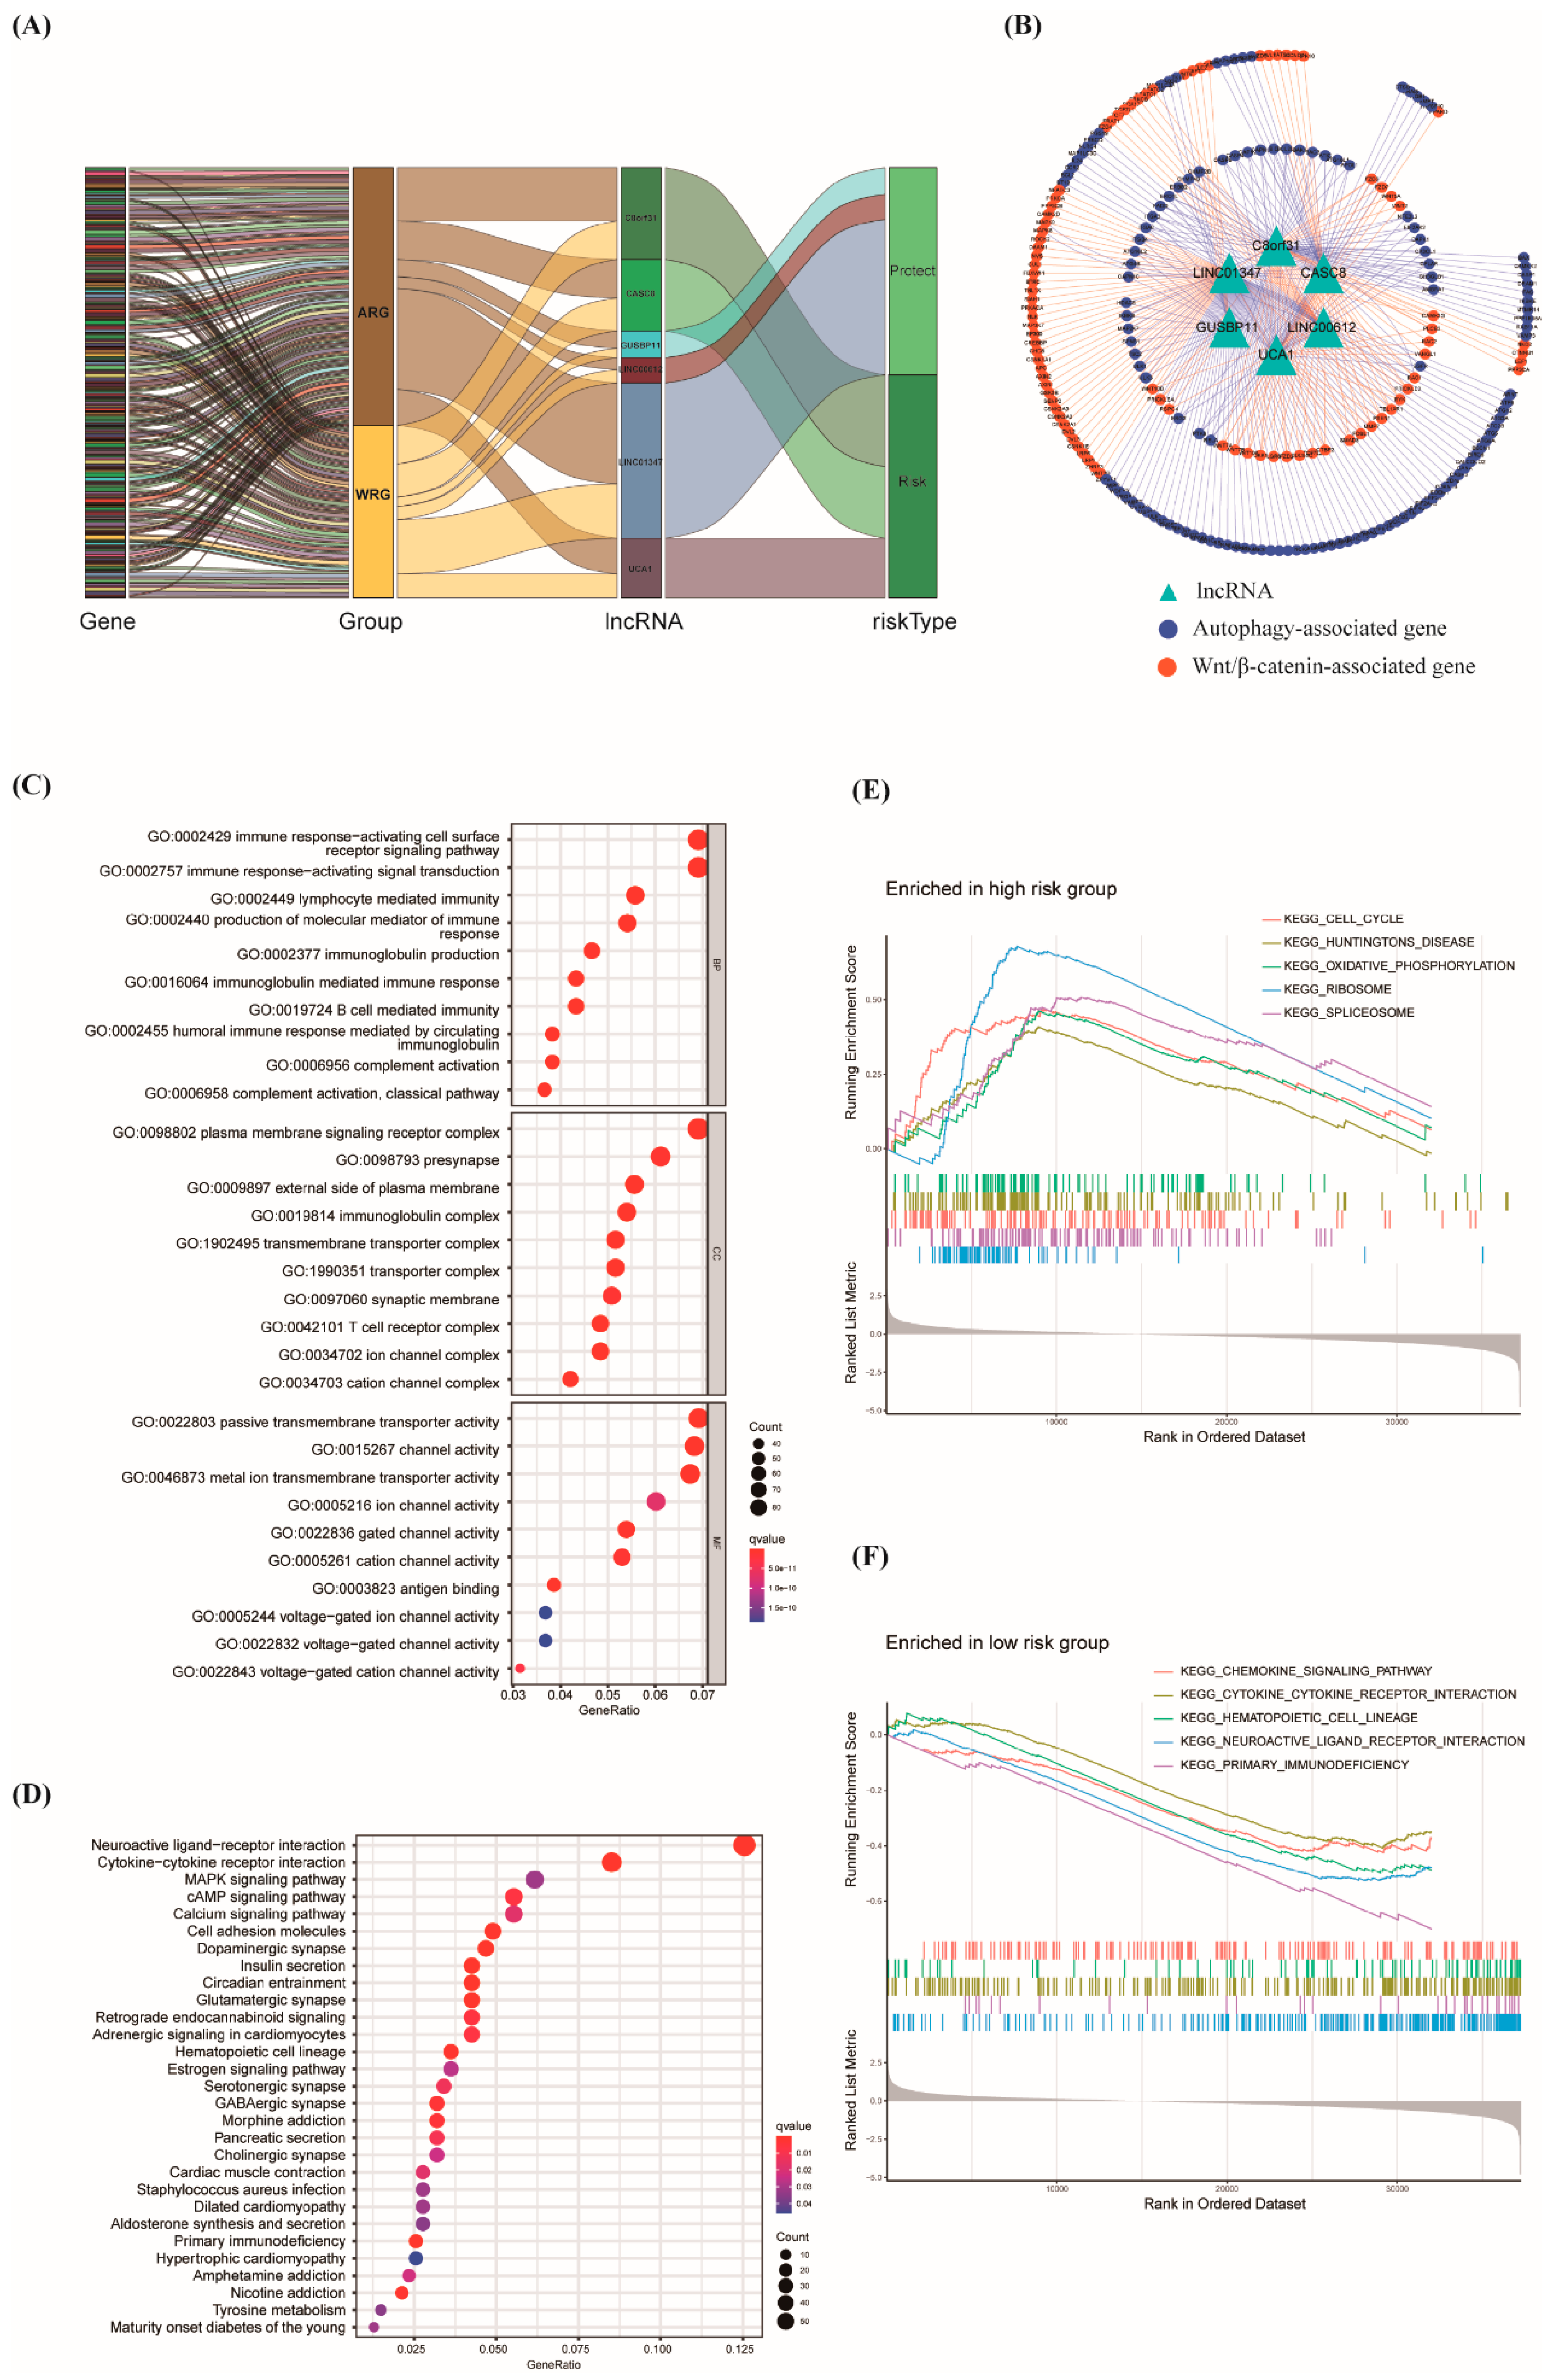
3.5. Construction of lncRNA–mRNA Network and Function Enrichment Analysis
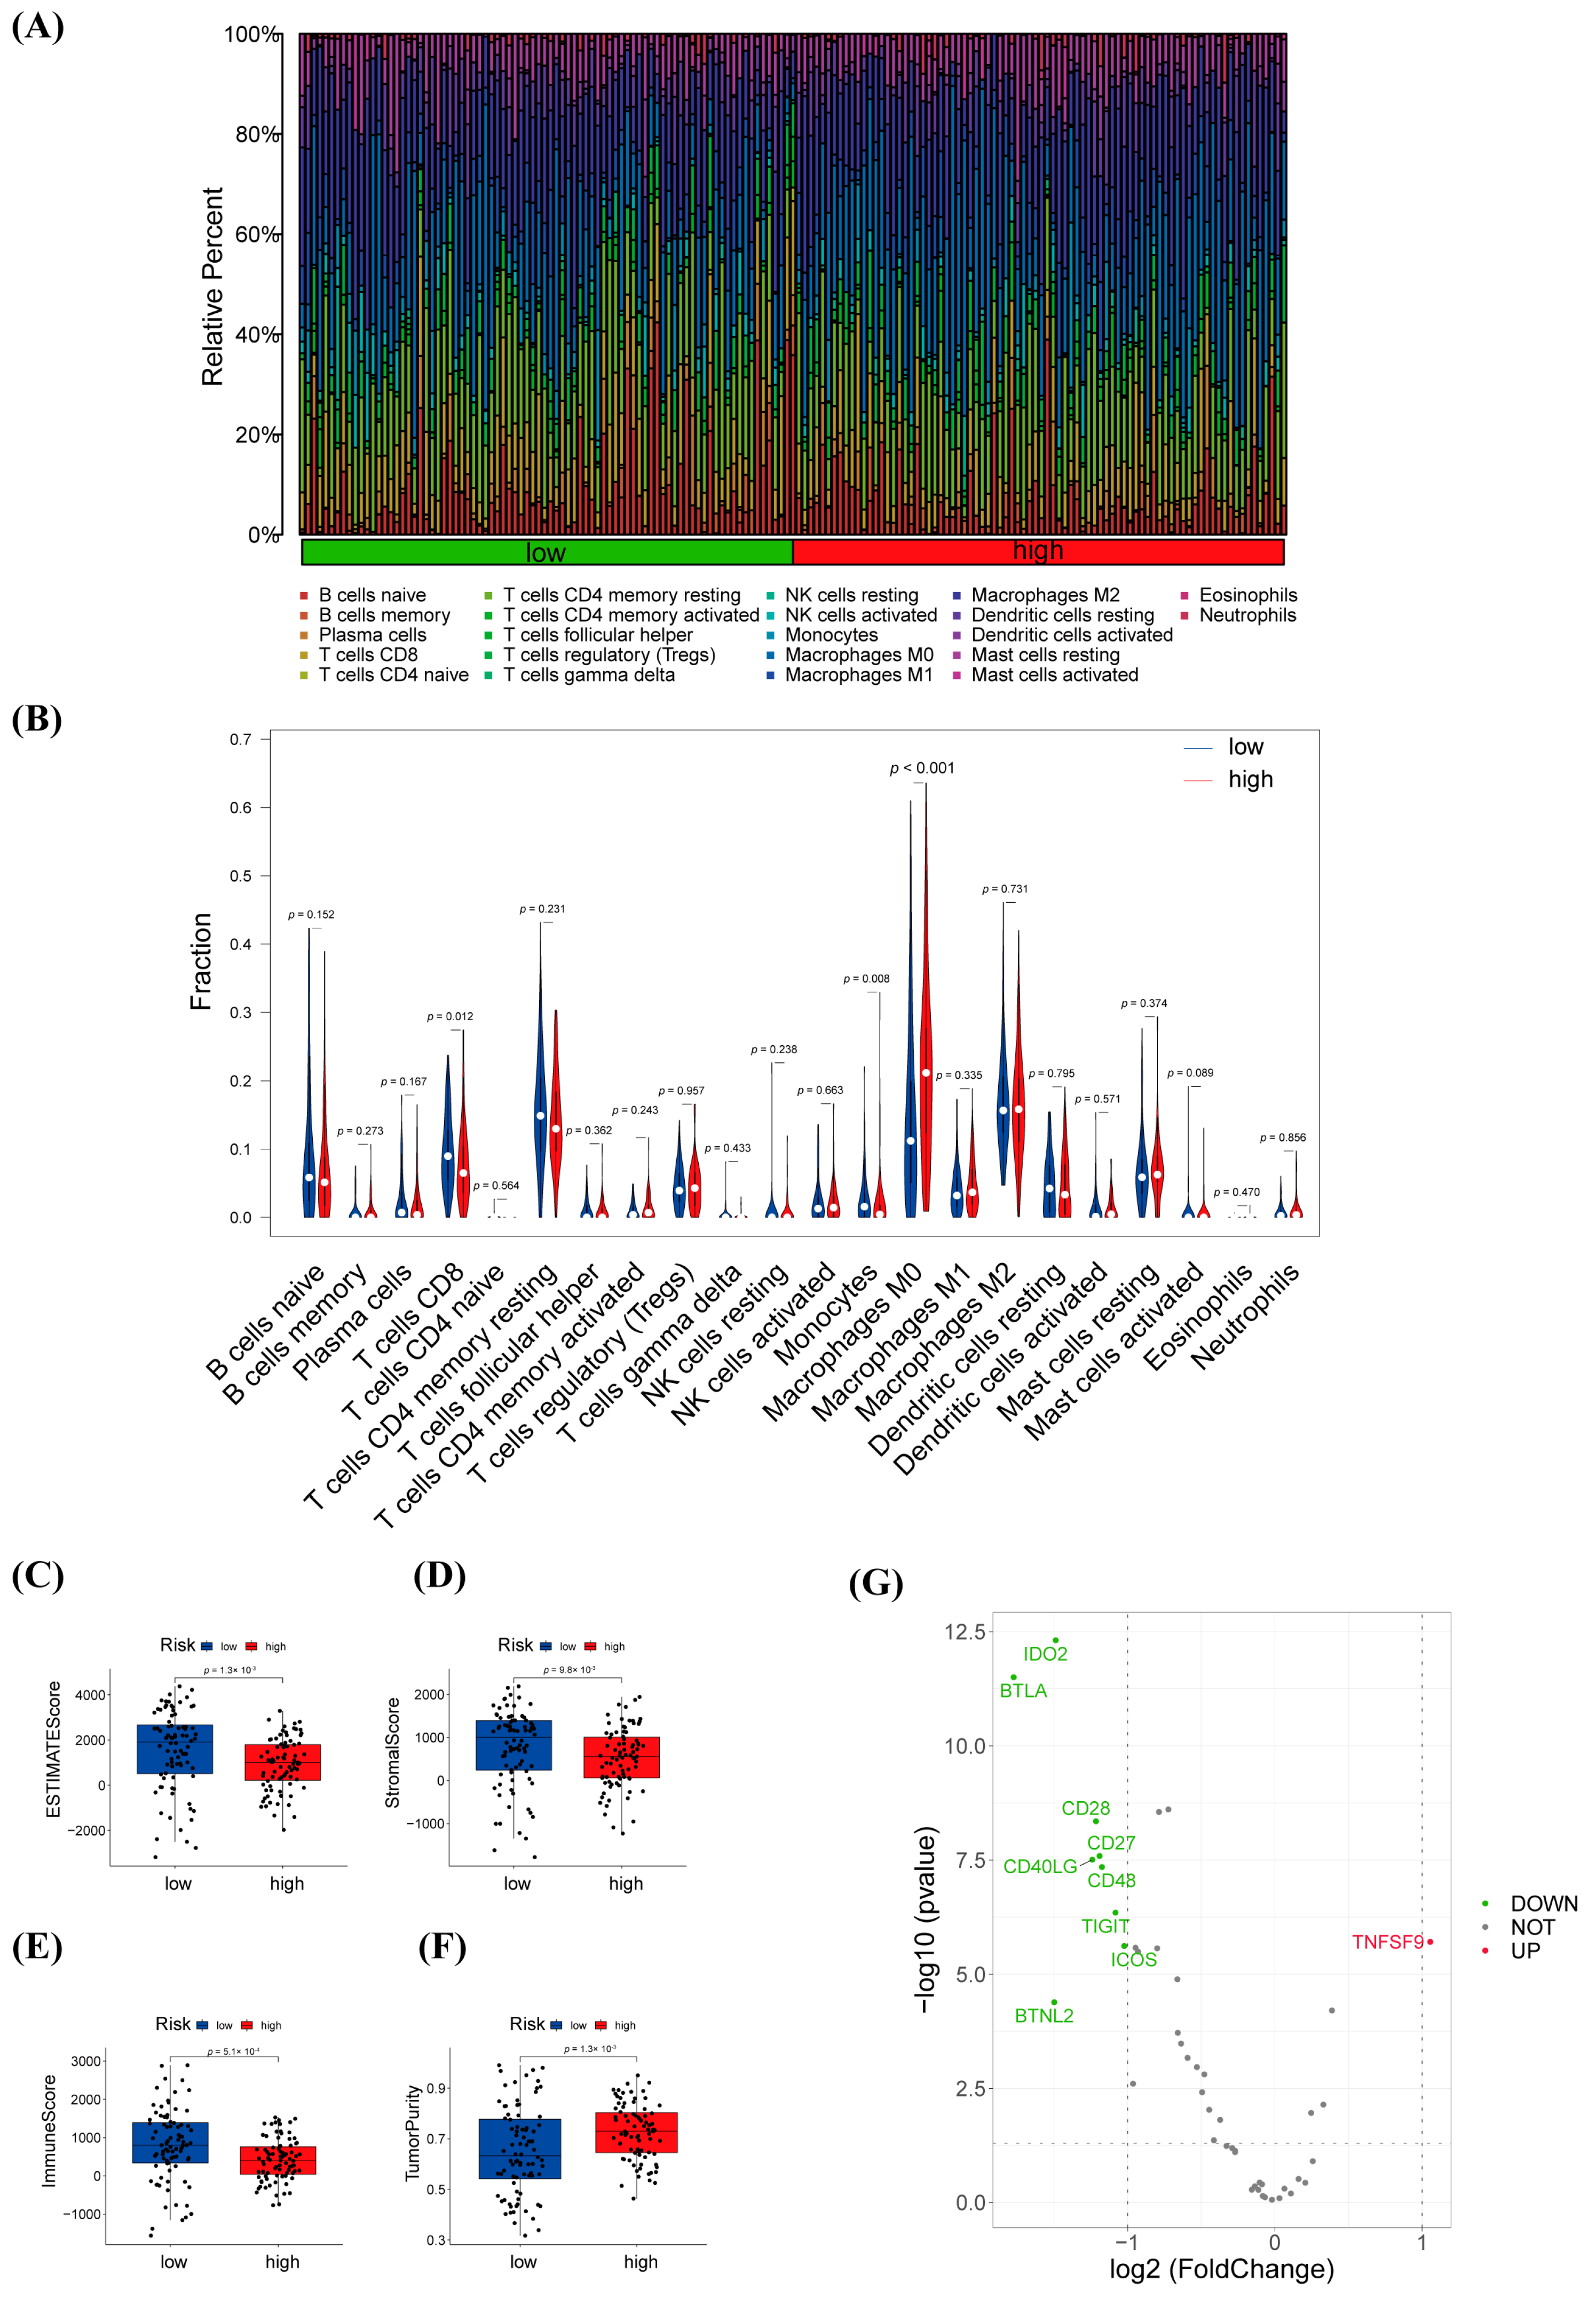
3.6. Immune Infiltration Analysis and Efficacy Prediction of warlncRNAs Signature
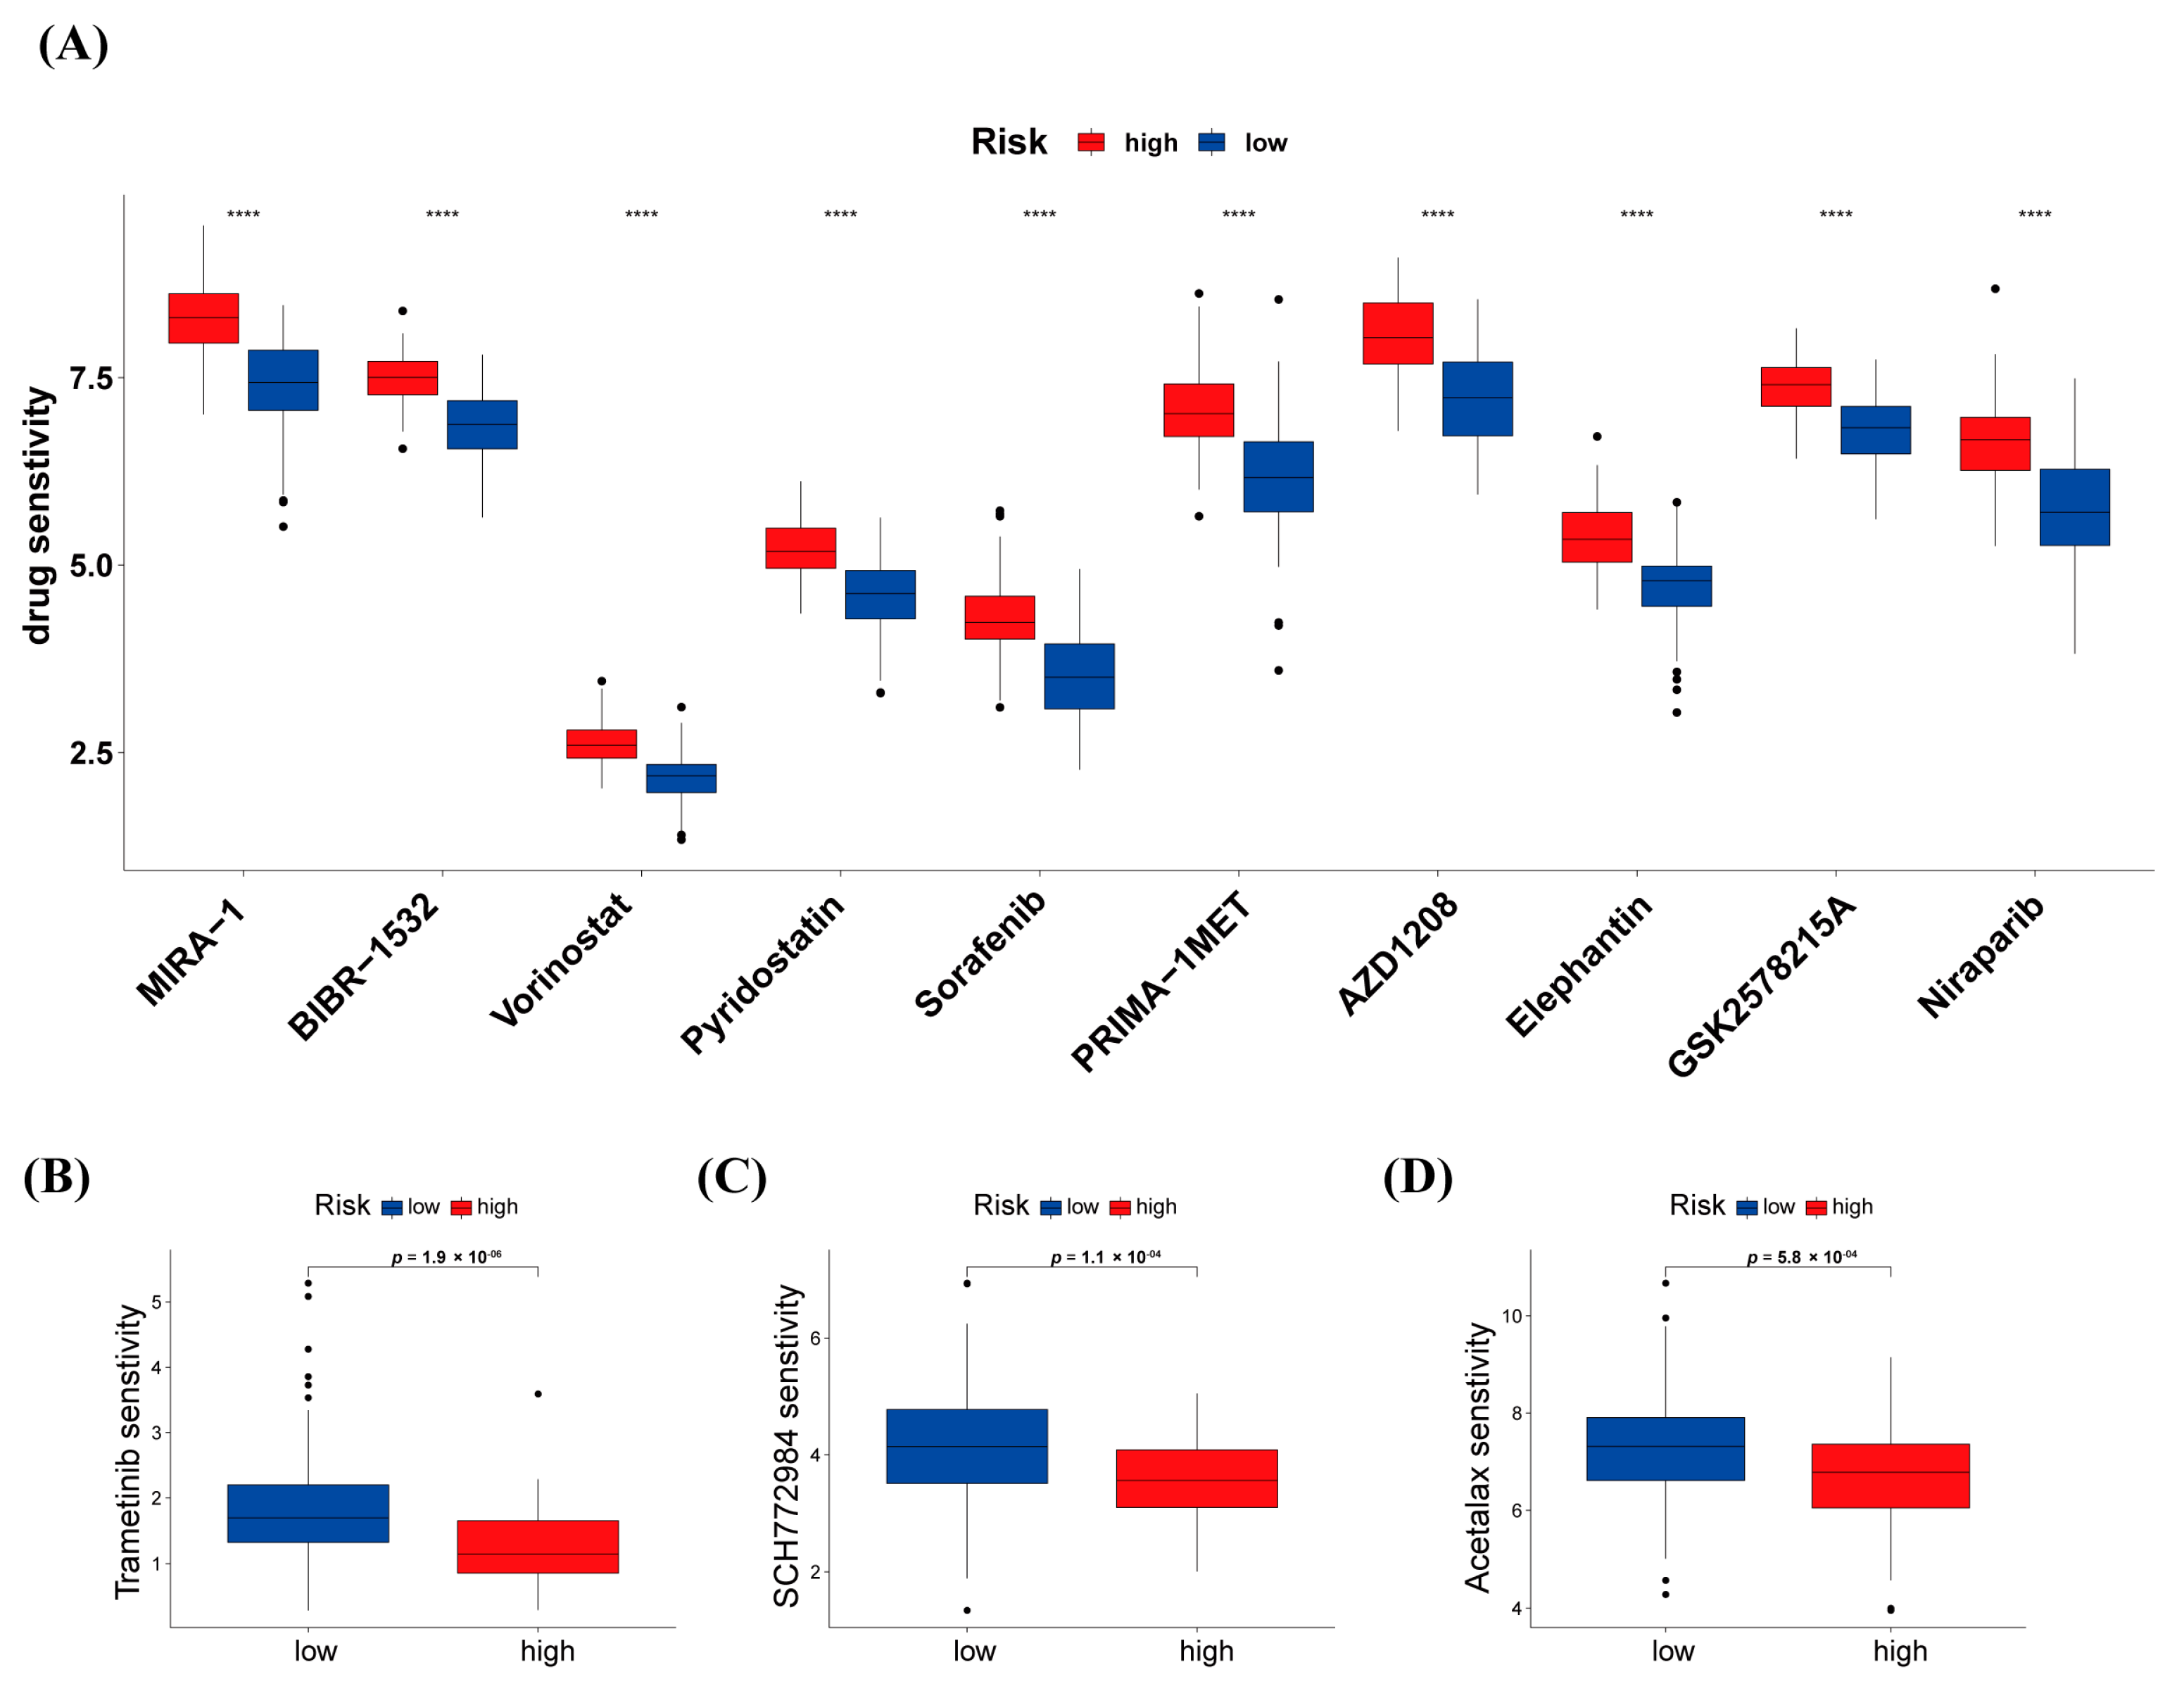
3.7. Differences in Response to Chemotherapy between High-Risk and Low-Risk Groups
4. Discussion
5. Conclusions
Supplementary Materials
Author Contributions
Funding
Institutional Review Board Statement
Informed Consent Statement
Data Availability Statement
Conflicts of Interest
References
- Chen, W.; Zheng, R.; Baade, P.D.; Zhang, S.; Zeng, H.; Bray, F.; Jemal, A.; Yu, X.Q.; He, J. Cancer statistics in China, 2015. CA Cancer J. Clin. 2016, 66, 115–132. [Google Scholar] [CrossRef] [PubMed] [Green Version]
- Siegel, R.L.; Miller, K.D.; Jemal, A. Cancer statistics, 2020. CA Cancer J. Clin. 2020, 70, 7–30. [Google Scholar] [CrossRef] [PubMed]
- Mizrahi, J.D.; Surana, R.; Valle, J.W.; Shroff, R.T. Pancreatic cancer. Lancet 2020, 395, 2008–2020. [Google Scholar] [CrossRef] [PubMed]
- Zhou, C.; Liang, Y.; Zhou, L.; Yan, Y.; Liu, N.; Zhang, R.; Huang, Y.; Wang, M.; Tang, Y.; Ali, D.W.; et al. TSPAN1 promotes autophagy flux and mediates cooperation between WNT-CTNNB1 signaling and autophagy via the MIR454-FAM83A-TSPAN1 axis in pancreatic cancer. Autophagy 2021, 17, 3175–3195. [Google Scholar] [CrossRef] [PubMed]
- Li, J.; Chen, X.; Kang, R.; Zeh, H.; Klionsky, D.J.; Tang, D. Regulation and function of autophagy in pancreatic cancer. Autophagy 2021, 17, 3275–3296. [Google Scholar] [CrossRef]
- Yang, S.; Wang, X.; Contino, G.; Liesa, M.; Sahin, E.; Ying, H.; Bause, A.; Li, Y.; Stommel, J.M.; Dell’Antonio, G.; et al. Pancreatic cancers require autophagy for tumor growth. Genes Dev. 2011, 25, 717–729. [Google Scholar] [CrossRef] [Green Version]
- Rosenfeldt, M.T.; O’Prey, J.; Morton, J.P.; Nixon, C.; MacKay, G.; Mrowinska, A.; Au, A.; Rai, T.S.; Zheng, L.; Ridgway, R.; et al. p53 status determines the role of autophagy in pancreatic tumour development. Nature 2013, 504, 296–300. [Google Scholar] [CrossRef]
- Yang, A.; Rajeshkumar, N.V.; Wang, X.; Yabuuchi, S.; Alexander, B.M.; Chu, G.C.; Von Hoff, D.D.; Maitra, A.; Kimmelman, A.C. Autophagy Is Critical for Pancreatic Tumor Growth and Progression in Tumors with p53 Alterations. Cancer Discov. 2014, 4, 905–913. [Google Scholar] [CrossRef] [Green Version]
- Clevers, H.; Nusse, R. Wnt/beta-catenin signaling and disease. Cell 2012, 149, 1192–1205. [Google Scholar] [CrossRef] [Green Version]
- Nusse, R.; Clevers, H. Wnt/β-Catenin Signaling, Disease, and Emerging Therapeutic Modalities. Cell 2017, 169, 985–999. [Google Scholar] [CrossRef] [Green Version]
- Pasca di Magliano, M.; Biankin, A.V.; Heiser, P.W.; Cano, D.A.; Gutierrez, P.J.; Deramaudt, T.; Segara, D.; Dawson, A.C.; Kench, J.G.; Henshall, S.M.; et al. Common activation of canonical Wnt signaling in pancreatic adenocarcinoma. PLoS ONE 2007, 2, e1155. [Google Scholar] [CrossRef]
- Zhou, C.; Yi, C.; Yi, Y.; Qin, W.; Yan, Y.; Dong, X.; Zhang, X.; Huang, Y.; Zhang, R.; Wei, J.; et al. LncRNA PVT1 promotes gemcitabine resistance of pancreatic cancer via activating Wnt/beta-catenin and autophagy pathway through modulating the miR-619-5p/Pygo2 and miR-619-5p/ATG14 axes. Mol. Cancer 2020, 19, 118. [Google Scholar] [CrossRef]
- Peng, W.X.; Koirala, P.; Mo, Y.Y. LncRNA-mediated regulation of cell signaling in cancer. Oncogene 2017, 36, 5661–5667. [Google Scholar] [CrossRef] [PubMed]
- Statello, L.; Guo, C.-J.; Chen, L.-L.; Huarte, M. Gene regulation by long non-coding RNAs and its biological functions. Nat. Rev. Mol. Cell Biol. 2021, 22, 96–118. [Google Scholar] [CrossRef] [PubMed]
- Hui, B.; Ji, H.; Xu, Y.; Wang, J.; Ma, Z.; Zhang, C.; Wang, K.; Zhou, Y. RREB1-induced upregulation of the lncRNA AGAP2-AS1 regulates the proliferation and migration of pancreatic cancer partly through suppressing ANKRD1 and ANGPTL4. Cell Death Dis. 2019, 10, 207. [Google Scholar] [CrossRef] [PubMed] [Green Version]
- Fu, Z.; Chen, C.; Zhou, Q.; Wang, Y.; Zhao, Y.; Zhao, X.; Li, W.; Zheng, S.; Ye, H.; Wang, L.; et al. LncRNA HOTTIP modulates cancer stem cell properties in human pancreatic cancer by regulating HOXA9. Cancer Lett. 2017, 410, 68–81. [Google Scholar] [CrossRef]
- Lei, S.; He, Z.; Chen, T.; Guo, X.; Zeng, Z.; Shen, Y.; Jiang, J. Long non-coding RNA 00976 promotes pancreatic cancer progression through OTUD7B by sponging miR-137 involving EGFR/MAPK pathway. J. Exp. Clin. Cancer Res. 2019, 38, 470. [Google Scholar] [CrossRef] [PubMed] [Green Version]
- Zhang, M.; Weng, W.; Zhang, Q.; Wu, Y.; Ni, S.; Tan, C.; Xu, M.; Sun, H.; Liu, C.; Wei, P.; et al. The lncRNA NEAT1 activates Wnt/beta-catenin signaling and promotes colorectal cancer progression via interacting with DDX5. J. Hematol. Oncol. 2018, 11, 113. [Google Scholar] [CrossRef] [PubMed] [Green Version]
- Yang, L.; Wang, H.; Shen, Q.; Feng, L.; Jin, H. Long non-coding RNAs involved in autophagy regulation. Cell Death Dis. 2017, 8, e3073. [Google Scholar] [CrossRef] [Green Version]
- Wang, Y.; He, L.; Du, Y.; Zhu, P.; Huang, G.; Luo, J.; Yan, X.; Ye, B.; Li, C.; Xia, P.; et al. The long non-coding RNA lncTCF7 promotes self-renewal of human liver cancer stem cells through activation of Wnt signaling. Cell Stem Cell. 2015, 16, 413–425. [Google Scholar] [CrossRef] [Green Version]
- Love, M.I.; Huber, W.; Anders, S. Moderated estimation of fold change and dispersion for RNA-seq data with DESeq2. Genome Biol. 2014, 15, 550. [Google Scholar] [CrossRef] [PubMed] [Green Version]
- He, Y.; Jiang, Z.; Chen, C.; Wang, X. Classification of triple-negative breast cancers based on Immunogenomic profiling. J. Exp. Clin. Cancer Res. 2018, 37, 327. [Google Scholar] [CrossRef] [PubMed]
- Heagerty, P.J.; Lumley, T.; Pepe, M.S. Time-Dependent ROC Curves for Censored Survival Data and a Diagnostic Marker. Biometrics 2000, 56, 337–344. [Google Scholar] [CrossRef] [PubMed]
- Yu, G.; Wang, L.-G.; Han, Y.; He, Q.-Y. clusterProfiler: An R Package for Comparing Biological Themes Among Gene Clusters. OMICS J. Integr. Biol. 2012, 16, 284–287. [Google Scholar] [CrossRef] [PubMed]
- Engle, D.D.; Tiriac, H.; Rivera, K.D.; Pommier, A.; Whalen, S.; Oni, T.E.; Alagesan, B.; Lee, E.J.; Yao, M.A.; Lucito, M.S.; et al. The glycan CA19-9 promotes pancreatitis and pancreatic cancer in mice. Science 2019, 364, 1156–1162. [Google Scholar] [CrossRef]
- Li, X.; He, S.; Ma, B. Autophagy and autophagy-related proteins in cancer. Mol. Cancer 2020, 19, 12. [Google Scholar] [CrossRef]
- Wang, K.; Klionsky, D.J. Mitochondria removal by autophagy. Autophagy 2011, 7, 297–300. [Google Scholar] [CrossRef] [Green Version]
- Anding, A.L.; Baehrecke, E.H. Cleaning House: Selective Autophagy of Organelles. Dev. Cell 2017, 41, 10–22. [Google Scholar] [CrossRef] [Green Version]
- Liang, X.H.; Jackson, S.; Seaman, M.; Brown, K.; Kempkes, B.; Hibshoosh, H.; Levine, B. Induction of autophagy and inhibition of tumorigenesis by beclin 1. Nature 1999, 402, 672–676. [Google Scholar] [CrossRef]
- Yue, Z.; Jin, S.; Yang, C.; Levine, A.J.; Heintz, N. Beclin 1, an autophagy gene essential for early embryonic development, is a haploinsufficient tumor suppressor. Proc. Natl. Acad. Sci. USA 2003, 100, 15077–15082. [Google Scholar] [CrossRef] [Green Version]
- Inami, Y.; Waguri, S.; Sakamoto, A.; Kouno, T.; Nakada, K.; Hino, O.; Watanabe, S.; Ando, J.; Iwadate, M.; Yamamoto, M.; et al. Persistent activation of Nrf2 through p62 in hepatocellular carcinoma cells. J. Cell Biol. 2011, 193, 275–284. [Google Scholar] [CrossRef] [Green Version]
- Parkhitko, A.; Myachina, F.; Morrison, T.A.; Hindi, K.M.; Auricchio, N.; Karbowniczek, M.; Wu, J.J.; Finkel, T.; Kwiatkowski, D.J.; Yu, J.J.; et al. Tumorigenesis in tuberous sclerosis complex is autophagy and p62/sequestosome 1 (SQSTM1)-dependent. Proc. Natl. Acad. Sci. USA 2011, 108, 12455–12460. [Google Scholar] [CrossRef] [Green Version]
- Wei, H.; Wei, S.; Gan, B.; Peng, X.; Zou, W.; Guan, J.-L. Suppression of autophagy by FIP200 deletion inhibits mammary tumorigenesis. Genes Dev. 2011, 25, 1510–1527. [Google Scholar] [CrossRef] [Green Version]
- Zhan, T.; Rindtorff, N.; Boutros, M. Wnt signaling in cancer. Oncogene 2017, 36, 1461–1473. [Google Scholar] [CrossRef]
- Zhang, T.; Zhang, G.; Yang, W.; Chen, H.; Hu, J.; Zhao, Z.; Cheng, C.; Li, G.; Xie, Y.; Li, Y.; et al. Lnc-PFAR facilitates autophagy and exacerbates pancreatic fibrosis by reducing pre-miR-141 maturation in chronic pancreatitis. Cell Death Dis. 2021, 12, 996. [Google Scholar] [CrossRef]
- Huang, F.; Chen, W.; Peng, J.; Li, Y.; Zhuang, Y.; Zhu, Z.; Shao, C.; Yang, W.; Yao, H.; Zhang, S. RETRACTED ARTICLE: LncRNA PVT1 triggers Cyto-protective autophagy and promotes pancreatic ductal adenocarcinoma development via the miR-20a-5p/ULK1 Axis. Mol. Cancer 2018, 17, 98. [Google Scholar] [CrossRef] [Green Version]
- Zheng, G.L.; Liu, Y.L.; Yan, Z.X.; Xie, X.Y.; Xiang, Z.; Yin, L.; Wang, Q.Q.; Chong, D.C.; Xue, G.L.; Xu, L.L.; et al. Elevated LOXL2 expression by LINC01347/miR-328-5p axis contributes to 5-FU chemotherapy resistance of colorectal cancer. Am. J. Cancer Res. 2021, 11, 1572–1585. [Google Scholar]
- Zhang, X.; Yan, J.; Dai, Z.; Long, X.; Jin, J.; Yang, Q.; Lin, C.; Yang, Y.; Chen, Y.; Zhu, J. Long non-coding RNA LINC01347 suppresses trophoblast cell migration, invasion and EMT by regulating miR-101–3p/PTEN/AKT axis. Reprod. Biol. 2022, 22, 100670. [Google Scholar] [CrossRef] [PubMed]
- Zhou, Y.; Li, X.; Yang, H. LINC00612 functions as a ceRNA for miR-214–5p to promote the proliferation and invasion of osteosarcoma in vitro and in vivo. Exp. Cell Res. 2020, 392, 112012. [Google Scholar] [CrossRef] [PubMed]
- Miao, L.; Liu, H.Y.; Zhou, C.; He, X. LINC00612 enhances the proliferation and invasion ability of bladder cancer cells as ceRNA by sponging miR-590 to elevate expression of PHF14. J. Exp. Clin. Cancer Res. 2019, 38, 143. [Google Scholar] [CrossRef] [PubMed]
- Wu, G.; Sun, P.; Qin, C. GUSBP11 Inhibited The Progression of Triple Negative Breast Cancer via Targeting The miR-579-3p/SPNS2 Axis. Cell J. 2022, 24, 230–238. [Google Scholar]
- Zhang, X.; Liu, J.; Ji, M.; Qi, G.; Qiao, R. Long Noncoding RNA GUSBP11 Knockdown Alleviates Nasopharyngeal Carcinoma via Regulating miR-1226-3p/TM9SF4 Axis. Cancer Biother. Radiopharm. 2022. [Google Scholar] [CrossRef]
- Flower, K.J.; Shenker, N.S.; El-Bahrawy, M.; Goldgar, D.E.; Parsons, M.T.; Spurdle, A.B.; Morris, J.R.; Brown, R.; Flanagan, J.M.; k Con KConFab Investigators; et al. DNA methylation profiling to assess pathogenicity of BRCA1 unclassified variants in breast cancer. Epigenetics 2015, 10, 1121–1132. [Google Scholar] [CrossRef] [Green Version]
- Wang, W.; Hu, W.; Wang, Y.; An, Y.; Song, L.; Shang, P.; Yue, Z. Long non-coding RNA UCA1 promotes malignant phenotypes of renal cancer cells by modulating the miR-182-5p/DLL4 axis as a ceRNA. Mol. Cancer 2020, 19, 18. [Google Scholar] [CrossRef]
- Wang, C.J.; Zhu, C.C.; Xu, J.; Wang, M.; Zhao, W.Y.; Liu, Q.; Zhao, G.; Zhang, Z.Z. The lncRNA UCA1 promotes proliferation, migration, immune escape and inhibits apoptosis in gastric cancer by sponging anti-tumor miRNAs. Mol. Cancer 2019, 18, 115. [Google Scholar] [CrossRef] [Green Version]
- Sun, L.; Zhu, W.; Zhao, P.; Wang, Q.; Fan, B.; Zhu, Y.; Lu, Y.; Chen, Q.; Zhang, J.; Zhang, F. Long non-coding RNA UCA1 from hypoxia-conditioned hMSC-derived exosomes: A novel molecular target for cardioprotection through miR-873-5p/XIAP axis. Cell Death Dis. 2020, 11, 696. [Google Scholar] [CrossRef]
- Pei, S.; Chen, J.; Lu, J.; Hu, S.; Jiang, L.; Lei, L.; Ouyang, Y.; Fu, C.; Ding, Y.; Li, S.; et al. The Long Non-coding RNA UCA1 Negatively Regulates Melanogenesis in Melanocytes. J. Investig. Dermatol. 2020, 140, 152–163.e155. [Google Scholar] [CrossRef] [Green Version]
- Dong, Z.; Gao, M.; Li, C.; Xu, M.; Liu, S. LncRNA UCA1 Antagonizes Arsenic-Induced Cell Cycle Arrest through Destabilizing EZH2 and Facilitating NFATc2 Expression. Adv. Sci. 2020, 7, 1903630. [Google Scholar] [CrossRef] [Green Version]
- Yang, B.; Gu, B.; Zhang, J.; Xu, L.; Sun, Y. CASC8 lncRNA Promotes the Proliferation of Retinoblastoma Cells Through Downregulating miR34a Methylation. Cancer Manag. Res. 2020, 12, 13461–13467. [Google Scholar] [CrossRef]
- Jiang, X.; Guan, J.; Xu, Y.; Ren, H.; Jiang, J.; Wudu, M.; Wang, Q.; Su, H.; Zhang, Y.; Zhang, B.; et al. Silencing of CASC8 inhibits non-small cell lung cancer cells function and promotes sensitivity to osimertinib via FOXM1. J. Cancer 2021, 12, 387–396. [Google Scholar] [CrossRef]
- Wu, Q.; Zhang, H.; Yang, D.; Min, Q.; Wang, Y.; Zhang, W.; Zhan, Q. The m6A-induced lncRNA CASC8 promotes proliferation and chemoresistance via upregulation of hnRNPL in esophageal squamous cell carcinoma. Int. J. Biol. Sci. 2022, 18, 4824–4836. [Google Scholar] [CrossRef] [PubMed]
- Chen, G.; Yang, G.; Long, J.; Yang, J.; Qin, C.; Luo, W.; Qiu, J.; Zhao, F.; You, L.; Zhang, T.; et al. Comprehensive Analysis of Autophagy-Associated lncRNAs Reveal Potential Prognostic Prediction in Pancreatic Cancer. Front. Oncol. 2021, 11, 596573. [Google Scholar] [CrossRef] [PubMed]


Disclaimer/Publisher’s Note: The statements, opinions and data contained in all publications are solely those of the individual author(s) and contributor(s) and not of MDPI and/or the editor(s). MDPI and/or the editor(s) disclaim responsibility for any injury to people or property resulting from any ideas, methods, instructions or products referred to in the content. |
© 2023 by the authors. Licensee MDPI, Basel, Switzerland. This article is an open access article distributed under the terms and conditions of the Creative Commons Attribution (CC BY) license (https://creativecommons.org/licenses/by/4.0/).
Share and Cite
Lyu, H.; Zhang, J.; Wei, Q.; Huang, Y.; Zhang, R.; Xiao, S.; Guo, D.; Chen, X.-Z.; Zhou, C.; Tang, J. Identification of Wnt/β-Catenin- and Autophagy-Related lncRNA Signature for Predicting Immune Efficacy in Pancreatic Adenocarcinoma. Biology 2023, 12, 319. https://doi.org/10.3390/biology12020319
Lyu H, Zhang J, Wei Q, Huang Y, Zhang R, Xiao S, Guo D, Chen X-Z, Zhou C, Tang J. Identification of Wnt/β-Catenin- and Autophagy-Related lncRNA Signature for Predicting Immune Efficacy in Pancreatic Adenocarcinoma. Biology. 2023; 12(2):319. https://doi.org/10.3390/biology12020319
Chicago/Turabian StyleLyu, Hao, Jiahui Zhang, Qian Wei, Yuan Huang, Rui Zhang, Shuai Xiao, Dong Guo, Xing-Zhen Chen, Cefan Zhou, and Jingfeng Tang. 2023. "Identification of Wnt/β-Catenin- and Autophagy-Related lncRNA Signature for Predicting Immune Efficacy in Pancreatic Adenocarcinoma" Biology 12, no. 2: 319. https://doi.org/10.3390/biology12020319