
Associations between Objectively Determined Physical Activity and Cardiometabolic Health in Adult Women: A Systematic Review and Meta-Analysis


 ,
,
Abstract
:Simple Summary
Abstract
1. Introduction
2. Methods
2.1. Inclusion Criteria and Study Selection
2.1.1. Participants
2.1.2. Interventions
2.1.3. Comparisons
2.1.4. Outcomes
2.2. Study Design
2.3. Other Criteria
2.4. Literature Search
2.5. Data Extraction
2.6. Risk of Bias and Quality Assessment
2.7. Statistical Analysis
3. Results
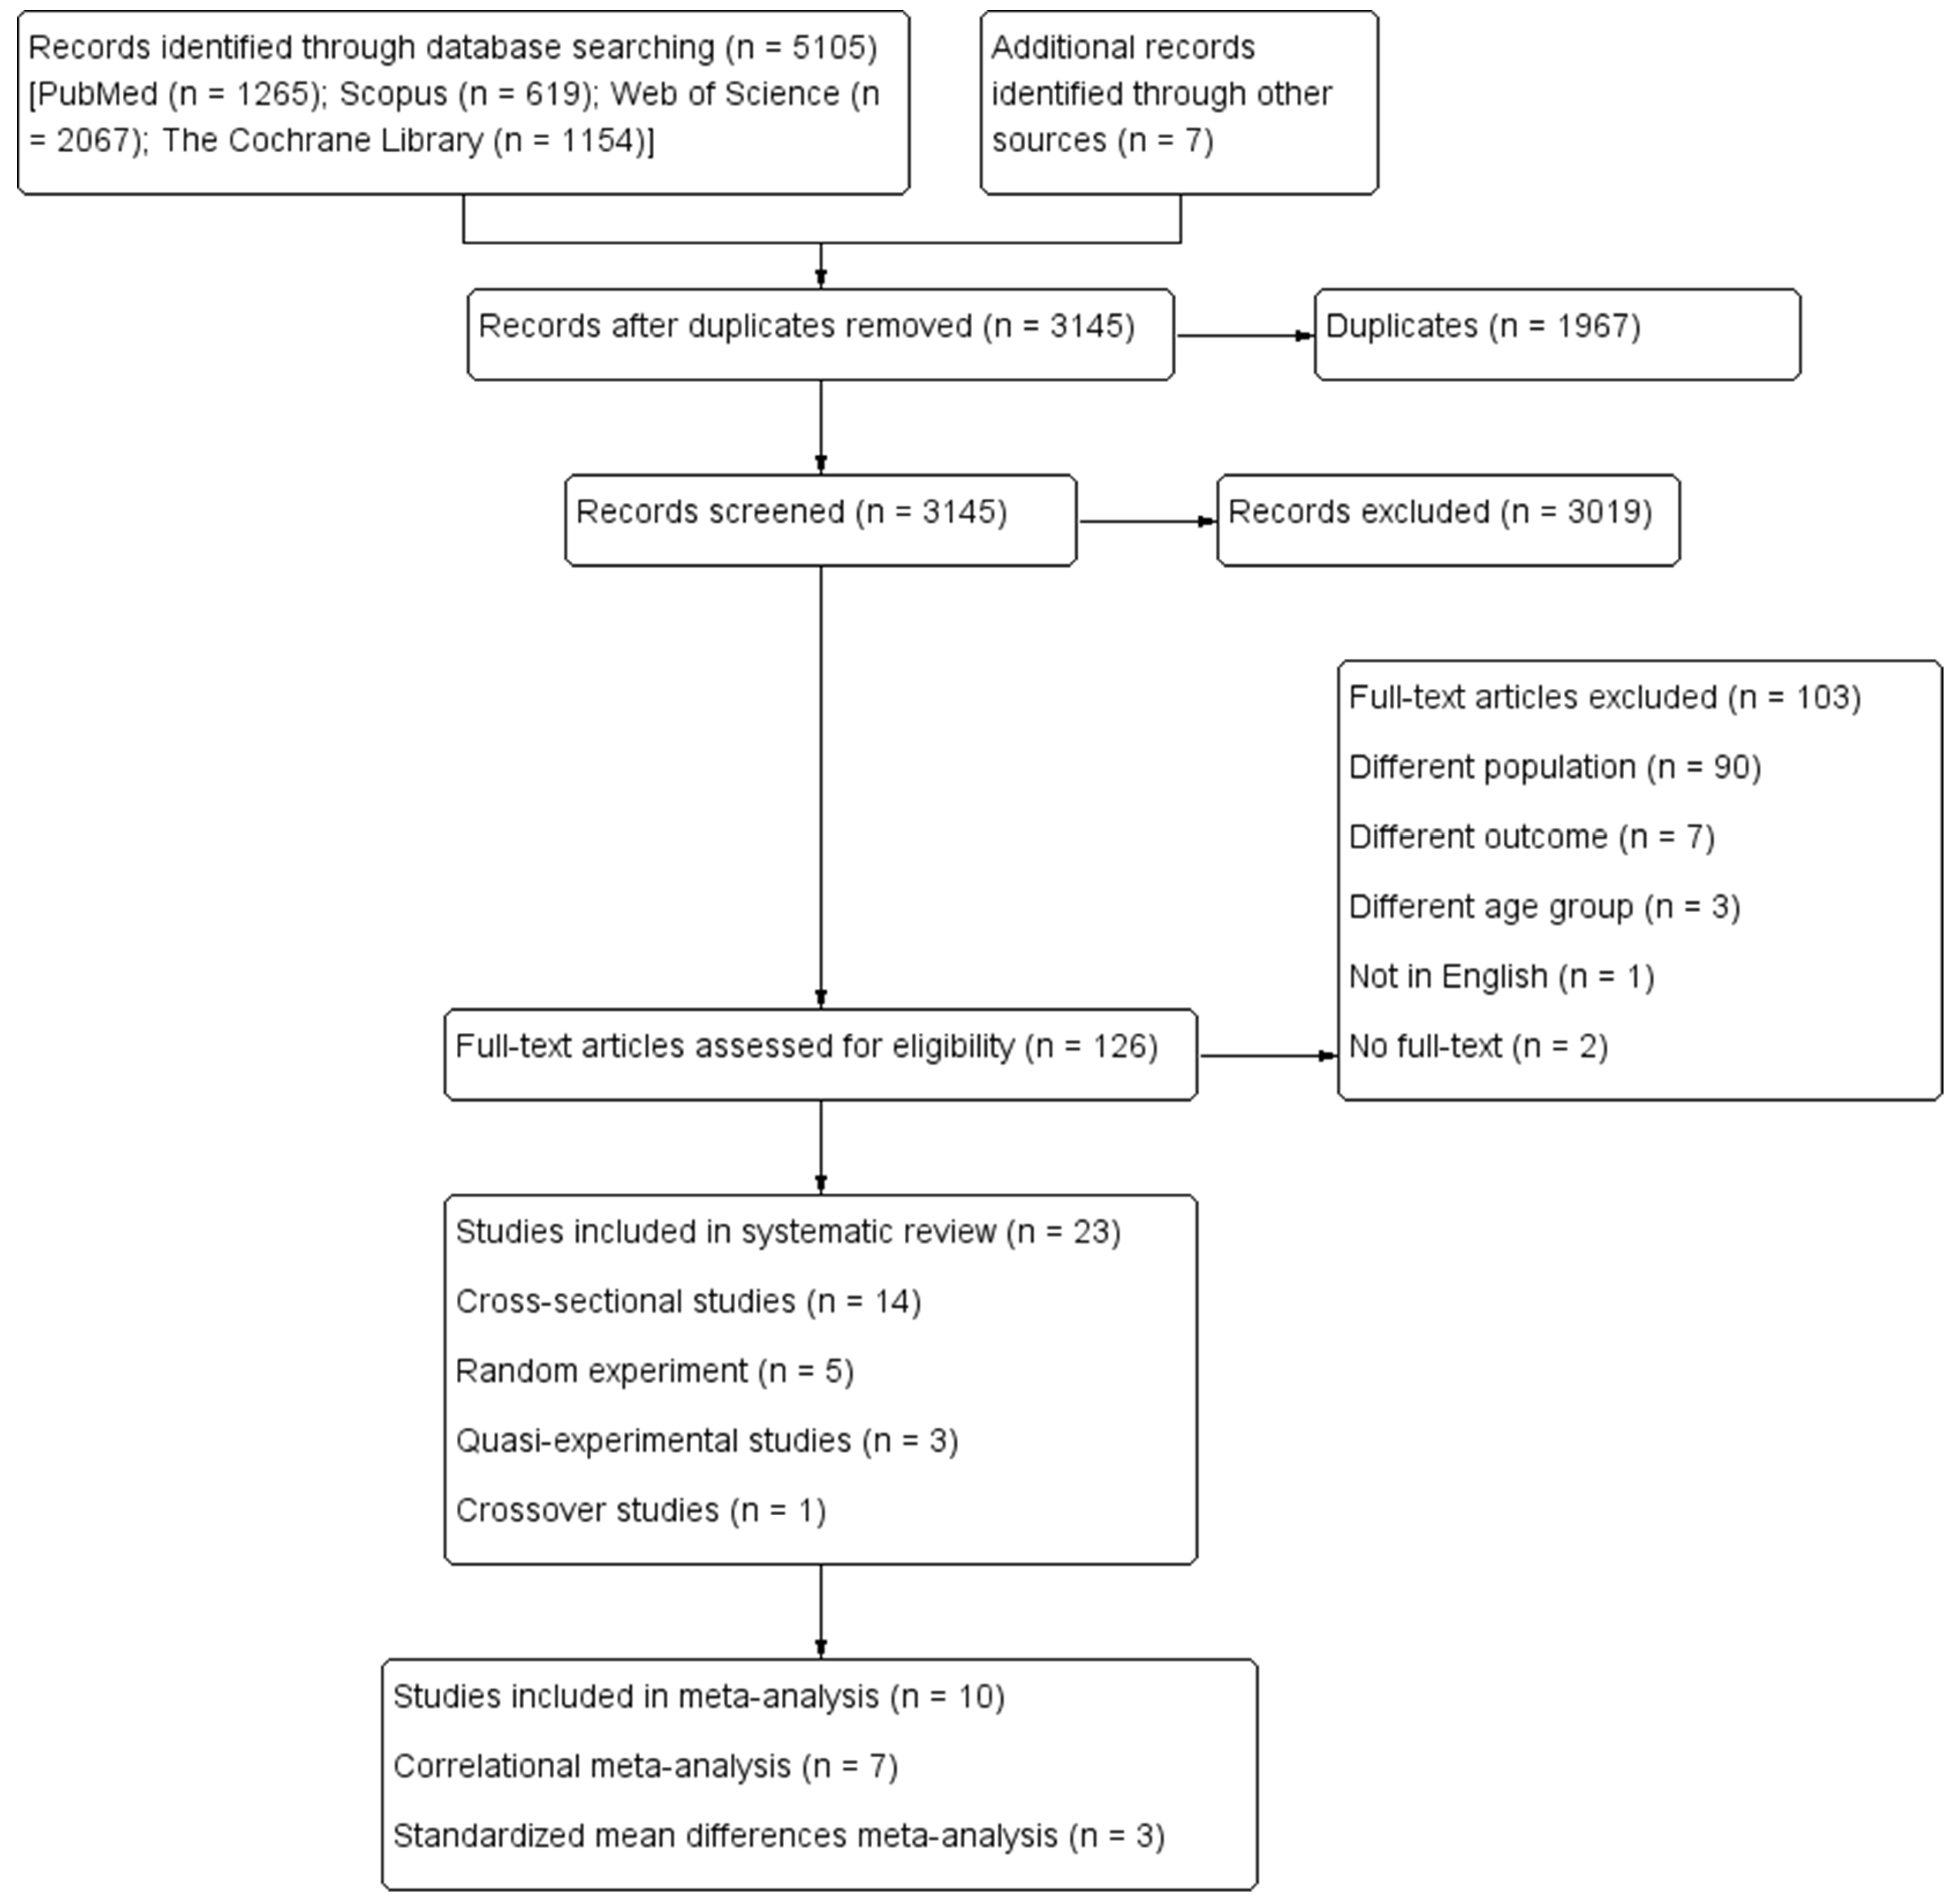
3.1. Study Selection and Characteristics
3.2. Sample Characteristics
3.3. Physical Activity Assessment
3.4. Cardiometabolic Health Outcomes Assessment
3.5. Risk of Bias Assessment and the Quality of Evidence
3.6. Association between PA and Cardiometabolic Health Outcomes
3.6.1. Blood Pressure
3.6.2. Lipid Profile
3.6.3. Carbohydrate Metabolism
3.6.4. Endocrine Regulation
3.6.5. Inflammation Markers
3.6.6. Metabolic Syndrome
3.7. Meta-Analysis
4. Discussion
4.1. Meta-Analytic Findings
4.2. Association between Steps and Cardiometabolic Biomarkers
4.3. Association between TPA and Cardiometabolic Biomarkers
4.4. Association between Volume of PA at Different Intensity and Health Outcomes
4.5. Strengths, Limitations, and Future Directions
5. Registration
6. Implications for Practice and Future Research
7. Conclusions
Supplementary Materials
Author Contributions
Funding
Institutional Review Board Statement
Informed Consent Statement
Data Availability Statement
Acknowledgments
Conflicts of Interest
Appendix A

| Database | PubMed (n = 1265) | |
|---|---|---|
| Date | 1 January 1990–31 January 2022 | |
| Search Terms | #1 | (Accelerometry[Mesh] OR Accelero * [TIAB] OR Actigraphy[MAJR] OR actigra * [TIAB]) Filters: Young Adult: 19–24 years, Adult: 19–44 years, Middle Aged: 45–64 years, Female |
| #2 | (objectively[TIAB] AND assessed[TIAB] AND physical[TIAB] AND activity[TIAB]) Filters: Young Adult: 19–24 years, Adult: 19–44 years, Middle Aged: 45–64 years, Female | |
| #3 | (objectively[TIAB] AND measured[TIAB] AND physical[TIAB] AND activity[TIAB]) Filters: Young Adult: 19–24 years, Adult: 19–44 years, Middle Aged: 45–64 years, Female | |
| #4 | pedometer[TIAB] Filters: Young Adult: 19–24 years, Adult: 19–44 years, Middle Aged: 45–64 years, Female | |
| #5 | “blood pressure” OR “systolic blood pressure” OR “diastolic blood pressure” OR triglyceride OR TG OR “high density lipoprotein” OR HDL OR “low density lipoprotein” OR LDL OR “total cholesterol” OR TC OR insulin OR HOMA OR glucose OR HbA1c OR “glycosylated hemoglobin” OR “glycated hemoglobin” OR CRP OR “C-reactive protein” OR IL-6 OR interleukin-6 OR TNF-alpha OR TNF-α OR “Cardiometabolic Risk Factors”[Mesh] OR “Metabolic Syndrome”[Mesh] Filters: Young Adult: 19–24 years, Adult: 19–44 years, Middle Aged: 45–64 years, Female | |
| #1 OR #2 OR #3 OR #4 AND #5 | ||
| (((((Accelerometry[Mesh] OR Accelero *[TIAB] OR Actigraphy[Mesh] OR actigra * [TIAB]) AND (adult[Filter] OR middleaged[Filter] OR youngadult[Filter])) OR ((objectively[TIAB] AND assessed[TIAB] AND physical[TIAB] AND activity[TIAB]) AND (youngadult[Filter] OR adult[Filter] OR middleaged[Filter]))) OR ((objectively[TIAB] AND measured[TIAB] AND physical[TIAB] AND activity[TIAB]) AND (youngadult[Filter] OR adult[Filter] OR middleaged[Filter]))) OR (pedometer[TIAB] AND (youngadult[Filter] OR adult[Filter] OR middleaged[Filter]))) AND (“blood pressure” OR “systolic blood pressure” OR “diastolic blood pressure” OR triglyceride OR TG OR “high density lipoprotein” OR HDL OR “low density lipoprotein” OR LDL OR “total cholesterol” OR TC OR insulin OR HOMA OR glucose OR HbA1c OR “glycosylated hemoglobin” OR “glycated hemoglobin” OR CRP OR “C-reactive protein” OR IL-6 OR interleukin-6 OR TNF-alpha OR TNF-α OR “Cardiometabolic Risk Factors”[Mesh] OR “Metabolic Syndrome”[Mesh] AND ((female[Filter]) AND (english[Filter]) AND (youngadult[Filter] OR adult[Filter] OR middleaged[Filter]))) | ||
| Database | SCOPUS (n = 619) | |
| Date | January 1, 1990–January 31, 2022 | |
| #1 | TITLE-ABS-KEY (accelerometry OR accelero * OR actigra * OR actigraphy) | |
| #2 | TITLE-ABS-KEY ((objectively AND measured AND physical AND activity)) | |
| #3 | TITLE-ABS-KEY ((objectively AND assessed AND physical AND activity)) | |
| #4 | TITLE-ABS-KEY (pedometer) | |
| #5 | “blood pressure” OR “systolic blood pressure” OR “diastolic blood pressure” OR triglyceride OR TG OR “high density lipoprotein” OR HDL OR “low density lipoprotein” OR LDL OR “total cholesterol” OR TC OR insulin OR HOMA OR glucose OR HbA1c OR “glycosylated hemoglobin” OR “glycated hemoglobin” OR CRP OR “C-reactive protein” OR IL-6 OR interleukin-6 OR TNF-alpha OR TNF-α OR “Cardiometabolic Risk Factors” OR “Metabolic Syndrome” | |
| #1 OR #2 OR #3 OR #4 AND #5 | ||
| (TITLE-ABS-KEY(accelerometry OR accelero * OR actigra * OR actigraphy) OR TITLE-ABS-KEY(objectively AND measured AND physical AND activity) OR TITLE-ABS-KEY(objectively AND assessed AND physical AND activity) OR TITLE-ABS-KEY(pedometer)) AND (TITLE-ABS-KEY (“blood pressure” OR “systolic blood pressure” OR “diastolic blood pressure” OR triglyceride OR tg OR “high density lipoprotein” OR hdl OR “low density lipoprotein” OR ldl OR “total cholesterol” OR tc OR insulin OR homa OR glucose OR hba1c OR “glycosylated hemoglobin” OR “glycated hemoglobin” OR crp OR “C-reactive protein” OR il-6 OR interleukin-6 OR TNF-alpha OR TNF-α OR “Cardiometabolic Risk Factors” OR “Metabolic Syndrome”)) AND NOT ((child *) OR (old *) OR (eld *) OR (pregnan *) OR (disable *) OR (athlete)) AND (LIMIT-TO (DOCTYPE, “ar”)) AND (LIMIT-TO (LANGUAGE, “English”)) | ||
| Database | Web of Science (n = 2067) | |
| Date | January 1, 1990–January 31, 2022 | |
| #1 | TS = (accelerometry OR accelero * OR actigra * OR actigraphy) | |
| #2 | TS = (objectively AND measured AND physical AND activity) | |
| #3 | TS = (objectively AND assessed AND physical AND activity) | |
| #4 | TS = (pedometer) | |
| #5 | TS = (“blood pressure” OR “systolic blood pressure” OR “diastolic blood pressure” OR triglyceride OR TG OR “high density lipoprotein” OR HDL OR “low density lipoprotein” OR LDL OR “total cholesterol” OR TC OR insulin OR HOMA OR glucose OR HbA1c OR “glycosylated hemoglobin” OR “glycated hemoglobin” OR CRP OR “C-reactive protein” OR IL-6 OR interleukin-6 OR TNF-alpha OR TNF-α OR “Cardiometabolic Risk Factors” OR “Metabolic Syndrome”) | |
| (((((#1) OR #2) OR #3) OR #4) AND #5) NOT TS = (((child *) OR (old *) OR (eld *) OR (pregnan *) OR (disable *) OR (athlete))) | ||
| Database | The Cochrane library (n = 1154) | |
| Date | 1 January 1990–31 January 2022 | |
| #1 | MeSH descriptor: [Accelerometry] this term only | |
| #2 | accelero * OR actigra * OR actigraphy | |
| #3 | #1 OR #2 | |
| #4 | objectively AND measured AND physical AND activity:ti,ab,kw | |
| #5 | objectively AND assessed AND physical AND activity:ti,ab,kw | |
| #6 | pedometer | |
| #7 | #3 OR #4 OR #5 OR #6 | |
| #8 | “blood pressure” OR “systolic blood pressure” OR “diastolic blood pressure” OR triglyceride OR TG OR “high density lipoprotein” OR HDL OR “low density lipoprotein” OR LDL OR “total cholesterol” OR TC OR insulin OR HOMA OR glucose OR HbA1c OR “glycosylated hemoglobin” OR “glycated hemoglobin” OR CRP OR “C-reactive protein” OR IL-6 OR interleukin-6 OR TNF-alpha OR TNF-α | |
| #9 | MeSH descriptor: [Cardiometabolic Risk Factors] this term only | |
| #10 | #8 OR #9 | |
| #11 | MeSH descriptor: [Metabolic Syndrome] this term only | |
| #12 | #10 OR #11 | |
| #13 | (child *) OR (old *) OR (eld*) OR (pregnan *) OR (disable *) OR (athlete) | |
| #14 | #7 AND #12 NOT #13 |
Appendix B
| Reference | Device | Wear Position | Frequency/Epoch | Required Time | Valid Time | Reported Measure, Cut-Off/Definition |
|---|---|---|---|---|---|---|
| Camhi et al., 2015 [36] | ACC: ActiGraph GT3X+, triaxial | waist | / | 7 d/wake exp. w | 8 h/3 d | LPA min/d, 100–759 cpm; MPA min/d, 760–5998 cpm; VPA min/d, ≥5999 cpm; MVPA bouts n/d, a minimum of 10 min with allowance for a 2-min interruption with a minimum of 760 cpm |
| Diniz et al., 2015 [37] | ACC: ActiGraph GT3x, triaxial | waist | 60 s | 7 d/wake exp. w | 10 h/5 d | LPA, <1952 cpm; MPA, 1952–5724 cpm; VPA, 5725–9498 cpm; VVPA, >9499 cpm |
| Graff et al., 2012 [38] | PED: BP 148 | / | / | 6 d/day exp. w | / | inactive, <6000 step/d; active, ≥6000 step/d |
| Green et al., 2014 [39] | ACC: ActiGraph GT3X+, triaxial | right hip | 60 s | 7 d/day exp. w | 10 h/4 d (1 weekend) | LPA, 150–2689 cpm; MVPA, ≥2690 cpm |
| Hasan et al., 2018 [50] | PED: KenzLifeCoder e-step | waist | / | 9 w/wake exp. w | / | sedentary, <5000 steps/d; low active, 5000–7499 steps/d; somewhat active, 7500–9999 steps/d; active, 10,000–12,499 steps/d; highly active, ≥12,500 steps/d |
| Hornbuckle et al., 2012 [51] | PED: New Lifestyles Digi-Walker SW-200 | hip | / | / | / | / |
| Koniak-Griffin et al., 2014 [40] | ACC: Kenz Lifecorder Plus, uniaxial | 4 s | 7 d/wake exp. w | 8 h/4 d | / | |
| Lecheminant et al., 2011 [41] | ACC: Actigraph, uniaxial | left hip | 10 min | 7 d/day exp. w | / | MPA, 30,000–49,999 counts/10 min; VPA, ≥50,000 counts/10 min |
| Loprinzi et al., 2012 [42] | / | right hip | / | 7 d/wake | 10 h/4 d | MPA min/d, 2020–5999 cpm; VPA min/d, ≥6000 cpm; MVPA min/d, ≥2020 cpm |
| Macena et al., 2021 [43] | ACC: ActivPAL, triaxial | right hip | 10 s | 3 d/day exp. w | 3 d | Sitting/lying down h/d, 1.25 MET; Standing h/d, 1.40 MET; Walking, 120 steps/min 4MET |
| Moreau et al., 2001 [52] | PED: Yamax SW200 pedometer | waist | / | 1–2 w/wake | / | / |
| Musto et al., 2010 [53] | PED: Sportline 330 | / | / | 7 d/wake | / | / |
| Pal et al., 2011 [54] | PED: Yamax Digi-Walker SW-200 | waist | / | / | / | / |
| Panton et al., 2007 [44] | PED: Yamax Digi-Walker SW-200, sealed | waist | / | 2 w/wake exp. w | / | Sedentary, <5000 steps/d; Active, ≥5000 steps/d |
| Rodriguez-Hernandez et al., 2018 [55] | ACC: ActiGraph GT3X, triaxial | right hip | 30 Hz/60 s | wake exp. w | 10 h/3 d | sedentary, <100 cpm; LPA, 500–2019 cpm; MPA, 2020–5999 cpm; VPA, >5999 cpm |
| Slater et al., 2021 [45] | ACC: Actigraph w-GT3X, triaxial; ACC: Acti-Watch | non-dominant hip; non-dominant wrist | 60 s | 8 d/day exp. w | 12 h/4 d | sedentary, 0–99 cpm; LPA, 100–2019 cpm; MPA, 2020–5998 cpm; VPA, ≥5999 cpm; MVPA, ≥2020 cpm |
| Sugawara et al., 2006 [56] | ACC: Lifecorder, uniaxial | hip | 32 Hz/4 s | 14d | 7 d | LPA, <4 METs; MPA, 4–6 METs; VPA, >6 METs |
| Sugiura et al., 2002 [57] | PED: n/r | / | / | / | / | / |
| Swartz et al., 2003 [58] | PED: Yamax Digi-Walker SW-200, | / | / | 12 w | / | / |
| Tabozzi et al., 2020 [46] | ACC: ActiGraph GT3X + BT, triaxial | waist | / | 7 d/wake exp. w | 8 h | sedentary, ≤1.5METs; LPA, 1.5–4 METs; MPA, 4–7 METs; VPA, >7METs; MVPA, >4 |
| Vella et al., 2011 [47] | ACC: Actigraph GT1M, uniaxial | right hip | 60s | 4 d (3 weekday, 1 weekend)/wake exp. w | 12 h/4 d | LPA, 100–1951 cpm; MPA, 1952–5724 cpm; VPA, ≥5725 cpm |
| Vella et al., 2009 [48] | ACC: ActiGraph GT1M, uniaxial | right hip | 60s | 4 d (3 weekday, 1 weekend)/wake exp. w | 12 h/4 d | / |
| Zając-Gawlak et al., 2017 [49] | ACC: ActiGraph GT1M, uniaxial | right hip | 60s | 8 d/wake exp. w | 12 h/8 d | active, 10,000–12,499 steps/d; highly active, ≥12,500 steps/d |
References
- Katzmarzyk, P.T. Physical activity, sedentary behavior, and health: Paradigm paralysis or paradigm shift? Diabetes 2010, 59, 2717–2725. [Google Scholar] [CrossRef] [PubMed] [Green Version]
- Ekelund, U.; Tarp, J.; Steene-Johannessen, J.; Hansen, B.H.; Jefferis, B.; Fagerland, M.W.; Whincup, P.; Diaz, K.M.; Hooker, S.P.; Chernofsky, A.; et al. Dose-response associations between accelerometry measured physical activity and sedentary time and all cause mortality: Systematic review and harmonised meta-analysis. BMJ 2019, 366, l4570. [Google Scholar] [CrossRef] [PubMed] [Green Version]
- Bull, F.C.; Al-Ansari, S.S.; Biddle, S.; Borodulin, K.; Buman, M.P.; Cardon, G.; Carty, C.; Chaput, J.P.; Chastin, S.; Chou, R.; et al. World Health Organization 2020 guidelines on physical activity and sedentary behaviour. Br. J. Sports Med. 2020, 54, 1451–1462. [Google Scholar] [CrossRef] [PubMed]
- Piercy, K.L.; Troiano, R.P.; Ballard, R.M.; Carlson, S.A.; Fulton, J.E.; Galuska, D.A.; George, S.M.; Olson, R.D. The Physical Activity Guidelines for Americans. JAMA 2018, 320, 2020–2028. [Google Scholar] [CrossRef] [PubMed]
- Hajna, S.; Ross, N.A.; Dasgupta, K. Steps, moderate-to-vigorous physical activity, and cardiometabolic profiles. Prev. Med. 2018, 107, 69–74. [Google Scholar] [CrossRef]
- Dipietro, L.; Zhang, Y.; Mavredes, M.; Simmens, S.J.; Whiteley, J.A.; Hayman, L.L.; Faro, J.; Malin, S.K.; Winston, G.; Napolitano, M.A. Physical Activity and Cardiometabolic Risk Factor Clustering in Young Adults with Obesity. Med. Sci. Sports Exerc. 2020, 52, 1050–1056. [Google Scholar] [CrossRef]
- Huang, B.H.; Hamer, M.; Chastin, S.; Pearson, N.; Koster, A.; Stamatakis, E. Cross-sectional associations of device-measured sedentary behaviour and physical activity with cardio-metabolic health in the 1970 British Cohort Study. Diabet. Med. 2021, 38, e14392. [Google Scholar] [CrossRef]
- Amaro-Gahete, F.J.; De-la, O.A.; Jurado-Fasoli, L.; Martinez-Tellez, B.; Ruiz, J.R.; Castillo, M.J. Exercise Training as a Treatment for Cardiometabolic Risk in Sedentary Adults: Are Physical Activity Guidelines the Best Way to Improve Cardiometabolic Health? The FIT-AGEING Randomized Controlled Trial. J. Clin. Med. 2019, 8, 97. [Google Scholar] [CrossRef] [Green Version]
- Jung, M.E.; Locke, S.R.; Bourne, J.E.; Beauchamp, M.R.; Lee, T.; Singer, J.; MacPherson, M.; Barry, J.; Jones, C.; Little, J.P. Cardiorespiratory fitness and accelerometer-determined physical activity following one year of free-living high-intensity interval training and moderate-intensity continuous training: A randomized trial. Int. J. Behav. Nutr. Phys. Act. 2020, 17, 25. [Google Scholar] [CrossRef]
- Goodpaster, B.H.; Delany, J.P.; Otto, A.D.; Kuller, L.; Vockley, J.; South-Paul, J.E.; Thomas, S.B.; Brown, J.; McTigue, K.; Hames, K.C.; et al. Effects of diet and physical activity interventions on weight loss and cardiometabolic risk factors in severely obese adults: A randomized trial. JAMA 2010, 304, 1795–1802. [Google Scholar] [CrossRef] [Green Version]
- Arem, H.; Moore, S.C.; Patel, A.; Hartge, P.; Berrington de Gonzalez, A.; Visvanathan, K.; Campbell, P.T.; Freedman, M.; Weiderpass, E.; Adami, H.O.; et al. Leisure time physical activity and mortality: A detailed pooled analysis of the dose-response relationship. JAMA Intern. Med. 2015, 175, 959–967. [Google Scholar] [CrossRef] [PubMed]
- Kubota, Y.; Iso, H.; Yamagishi, K.; Sawada, N.; Tsugane, S. Daily Total Physical Activity and Incident Stroke: The Japan Public Health Center-Based Prospective Study. Stroke 2017, 48, 1730–1736. [Google Scholar] [CrossRef] [PubMed] [Green Version]
- Verswijveren, S.J.J.M.; Salmon, J.; Daly, R.M.; Arundell, L.; Cerin, E.; Dunstan, D.W.; Hesketh, K.D.; Della Gatta, P.A.; Ridgers, N.D. Reallocating sedentary time with total physical activity and physical activity bouts in children: Associations with cardiometabolic biomarkers. J. Sports Sci. 2021, 39, 332–340. [Google Scholar] [CrossRef] [PubMed]
- Chastin, S.F.M.; De Craemer, M.; De Cocker, K.; Powell, L.; van Cauwenberg, J.; Dall, P.; Hamer, M.; Stamatakis, E. How does light-intensity physical activity associate with adult cardiometabolic health and mortality? Systematic review with meta-analysis of experimental and observational studies. Br. J. Sports Med. 2019, 53, 370–376. [Google Scholar] [CrossRef] [Green Version]
- Guthold, R.; Stevens, G.A.; Riley, L.M.; Bull, F.C. Worldwide trends in insufficient physical activity from 2001 to 2016: A pooled analysis of 358 population-based surveys with 1.9 million participants. Lancet Glob. Health 2018, 6, e1077–e1086. [Google Scholar] [CrossRef] [Green Version]
- Saeed, A.; Kampangkaew, J.; Nambi, V. Prevention of Cardiovascular Disease in Women. Methodist Debakey Cardiovasc. J. 2017, 13, 185–192. [Google Scholar] [CrossRef]
- Vainshelboim, B.; Brennan, G.M.; LoRusso, S.; Fitzgerald, P.; Wisniewski, K.S. Sedentary behavior and physiological health determinants in male and female college students. Physiol. Behav. 2019, 204, 277–282. [Google Scholar] [CrossRef]
- Cooper, A.J.; Gupta, S.R.; Moustafa, A.F.; Chao, A.M. Sex/Gender Differences in Obesity Prevalence, Comorbidities, and Treatment. Curr. Obes. Rep. 2021, 10, 458–466. [Google Scholar] [CrossRef]
- Ferrari, P.; Friedenreich, C.; Matthews, C.E. The role of measurement error in estimating levels of physical activity. Am. J. Epidemiol. 2007, 166, 832–840. [Google Scholar] [CrossRef] [Green Version]
- Skender, S.; Ose, J.; Chang-Claude, J.; Paskow, M.; Brühmann, B.; Siegel, E.M.; Steindorf, K.; Ulrich, C.M. Accelerometry and physical activity questionnaires—A systematic review. BMC Public Health 2016, 16, 515. [Google Scholar] [CrossRef] [Green Version]
- Page, M.J.; McKenzie, J.E.; Bossuyt, P.M.; Boutron, I.; Hoffmann, T.C.; Mulrow, C.D.; Shamseer, L.; Tetzlaff, J.M.; Akl, E.A.; Brennan, S.E.; et al. The PRISMA 2020 statement: An updated guideline for reporting systematic reviews. BMJ 2021, 372, n71. [Google Scholar] [CrossRef] [PubMed]
- Schardt, C.; Adams, M.B.; Owens, T.; Keitz, S.; Fontelo, P. Utilization of the PICO framework to improve searching PubMed for clinical questions. BMC Med. Inform. Decis. Mak. 2007, 7, 16. [Google Scholar] [CrossRef] [PubMed] [Green Version]
- Kossi, O.; Lacroix, J.; Ferry, B.; Batcho, C.S.; Julien-Vergonjanne, A.; Mandigout, S. Reliability of ActiGraph GT3X+ placement location in the estimation of energy expenditure during moderate and high-intensity physical activities in young and older adults. J. Sports Sci. 2021, 39, 1489–1496. [Google Scholar] [CrossRef] [PubMed]
- Wells, G.A.; Shea, B.; O’Connell, D.; Peterson, J.; Welch, V.; Losos, M.; Tugwell, P. The Newcastle-Ottawa Scale (NOS) for Assessing the Quality of Nonrandomised Studies in Meta-Analyses. Available online: http://www.ohri.ca/programs/clinical_epidemiology/oxford.asp (accessed on 5 March 2022).
- Ramsey, K.A.; Zhou, W.; Rojer, A.G.M.; Reijnierse, E.M.; Maier, A.B. Associations of objectively measured physical activity and sedentary behaviour with fall-related outcomes in older adults: A systematic review. Ann. Phys. Rehabil. Med. 2022, 65, 101571. [Google Scholar] [CrossRef]
- Higgins, J.P.; Altman, D.G.; Gøtzsche, P.C.; Jüni, P.; Moher, D.; Oxman, A.D.; Savovic, J.; Schulz, K.F.; Weeks, L.; Sterne, J.A. The Cochrane Collaboration’s tool for assessing risk of bias in randomised trials. BMJ 2011, 343, d5928. [Google Scholar] [CrossRef] [Green Version]
- Guyatt, G.; Oxman, A.D.; Akl, E.A.; Kunz, R.; Vist, G.; Brozek, J.; Norris, S.; Falck-Ytter, Y.; Glasziou, P.; DeBeer, H.; et al. GRADE guidelines: 1. Introduction-GRADE evidence profiles and summary of findings tables. J. Clin. Epidemiol. 2011, 64, 383–394. [Google Scholar] [CrossRef]
- Ramakrishnan, R.; He, J.R.; Ponsonby, A.L.; Woodward, M.; Rahimi, K.; Blair, S.N.; Dwyer, T. Objectively measured physical activity and all cause mortality: A systematic review and meta-analysis. Prev. Med. 2021, 143, 106356. [Google Scholar] [CrossRef]
- Ainsworth, B.E.; Haskell, W.L.; Herrmann, S.D.; Meckes, N.; Bassett, D.R., Jr.; Tudor-Locke, C.; Greer, J.L.; Vezina, J.; Whitt-Glover, M.C.; Leon, A.S. 2011 Compendium of Physical Activities: A second update of codes and MET values. Med. Sci. Sports Exerc. 2011, 43, 1575–1581. [Google Scholar] [CrossRef] [Green Version]
- Aune, D.; Norat, T.; Leitzmann, M.; Tonstad, S.; Vatten, L.J. Physical activity and the risk of type 2 diabetes: A systematic review and dose-response meta-analysis. Eur. J. Epidemiol. 2015, 30, 529–542. [Google Scholar] [CrossRef]
- Peterson, R.A.; Brown, S.P. On the use of beta coefficients in meta-analysis. J. Appl. Psychol. 2005, 90, 175–181. [Google Scholar] [CrossRef] [Green Version]
- Cohen, J. Statistical Power Analysis for the Behavioral Sciences, 2nd ed.; L. Erlbaum Associates: Hillsdale, NJ, USA, 1988. [Google Scholar]
- Higgins, J.P.T.; Thompson, S.G.; Deeks, J.J.; Altman, D.G. Measuring inconsistency in meta-analyses. BMJ 2003, 327, 557–560. [Google Scholar] [CrossRef] [PubMed] [Green Version]
- Egger, M.; Davey Smith, G.; Schneider, M.; Minder, C. Bias in meta-analysis detected by a simple, graphical test. BMJ 1997, 315, 629–634. [Google Scholar] [CrossRef] [PubMed] [Green Version]
- Murray, C.B.; Patel, K.V.; Twiddy, H.; Sturgeon, J.A.; Palermo, T.M. Age differences in cognitive-affective processes in adults with chronic pain. Eur. J. Pain 2021, 25, 1041–1052. [Google Scholar] [CrossRef] [PubMed]
- Camhi, S.M.; Crouter, S.E.; Hayman, L.L.; Must, A.; Lichtenstein, A.H. Lifestyle Behaviors in Metabolically Healthy and Unhealthy Overweight and Obese Women: A Preliminary Study. PLoS ONE 2015, 10, e0138548. [Google Scholar] [CrossRef]
- Diniz, T.A.; Fortaleza, A.C.; Buonani, C.; Rossi, F.E.; Neves, L.M.; Lira, F.S.; Freitas-Junior, I.F. Relationship between moderate-to-vigorous physical activity, abdominal fat and immunometabolic markers in postmenopausal women. Eur. Obstet. Gynecol. Reprod. Biol. 2015, 194, 178–182. [Google Scholar] [CrossRef] [Green Version]
- Graff, S.K.; Alves, B.C.; Toscani, M.K.; Spritzer, P.M. Benefits of pedometer-measured habitual physical activity in healthy women. Appl. Physiol. Nutr. Metab. 2012, 37, 149–156. [Google Scholar] [CrossRef]
- Green, A.N.; McGrath, R.; Martinez, V.; Taylor, K.; Paul, D.R.; Vella, C.A. Associations of objectively measured sedentary behavior, light activity, and markers of cardiometabolic health in young women. Eur. J. Appl. Physiol. 2014, 114, 907–919. [Google Scholar] [CrossRef]
- Koniak-Griffin, D.; Brecht, M.L.; Takayanagi, S.; Villegas, J.; Melendrez, M. Physical activity and cardiometabolic characteristics in overweight Latina women. J. Immigr. Minor. Health 2014, 16, 856–864. [Google Scholar] [CrossRef] [Green Version]
- Lecheminant, J.D.; Tucker, L.A. Recommended levels of physical activity and insulin resistance in middle-aged women. Diabetes Educ. 2011, 37, 573–580. [Google Scholar] [CrossRef]
- Loprinzi, P.D.; Cardinal, B.J. Interrelationships among physical activity, depression, homocysteine, and metabolic syndrome with special considerations by sex. Prev. Med. 2012, 54, 388–392. [Google Scholar] [CrossRef]
- Macena, M.L.; Da Silva Júnior, A.E.; Praxedes, D.R.S.; Vasconcelos, L.G.L.; Pureza, I.R.O.M.; Florêncio, T.M.M.T.; Bueno, N.B. Association between sitting/lying down, standing, walking time and number of steps per day with the hormonal profile and resting energy expenditure of women with obesity living in a low-income region. Br. J. Nutr. 2021. [Google Scholar] [CrossRef] [PubMed]
- Panton, L.B.; Kushnick, M.R.; Kingsley, J.D.; Moffatt, R.J.; Haymes, E.M.; Toole, T. Pedometer measurement of physical activity and chronic disease risk factors of obese lower socioeconomic status African American women. J. Phys. Act. Health 2007, 4, 447–458. [Google Scholar] [CrossRef] [PubMed]
- Slater, J.; Kruger, R.; Douwes, J.; O’Brien, W.J.; Corbin, M.; Miles-Chan, J.L.; Breier, B.H. Objectively Measured Physical Activity Is Associated With Body Composition and Metabolic Profiles of Pacific and New Zealand European Women With Different Metabolic Disease Risks. Front. Physiol. 2021, 12, 684782. [Google Scholar] [CrossRef]
- Tabozzi, S.A.; Di Santo, S.G.; Franchini, F.; Ratto, F.; Luchi, M.; Filiputti, B.; Ardigò, L.P.; Lafortuna, C.L. Sedentary Behaviors and Physical Activity Habits Independently Affect Fat Oxidation in Fasting Conditions and Capillary Glucose Levels After Standardized Glucose-Rich Meal in Healthy Females. Front. Physiol. 2020, 11, 710. [Google Scholar] [CrossRef]
- Vella, C.A.; Ontiveros, D.; Zubia, R.Y.; Dalleck, L. Physical activity recommendations and cardiovascular disease risk factors in young Hispanic women. J. Sports Sci. 2011, 29, 37–45. [Google Scholar] [CrossRef]
- Vella, C.A.; Zubia, R.Y.; Ontiveros, D.; Cruz, M.L. Physical activity, cardiorespiratory fitness, and metabolic syndrome in young Mexican and Mexican-American women. Appl. Physiol. Nutr. Metab. 2009, 34, 10–17. [Google Scholar] [CrossRef]
- Zając-Gawlak, I.; Kłapcińska, B.; Kroemeke, A.; Pośpiech, D.; Pelclová, J.; Přidalová, M. Associations of visceral fat area and physical activity levels with the risk of metabolic syndrome in postmenopausal women. Biogerontology 2017, 18, 357–366. [Google Scholar] [CrossRef] [Green Version]
- Hasan, H.; Attlee, A.; Jan Bin Jan Mohamed, H.; Aris, N.; Bin Wan Muda, W.A.M. Counting Footsteps with a Pedometer to Improve HMW Adiponectin and Metabolic Syndrome among Young Female Adults in the United Arab Emirates. J. Obes. 2018, 2018, 1597840. [Google Scholar] [CrossRef] [PubMed]
- Hornbuckle, L.M.; Liu, P.Y.; Ilich, J.Z.; Kim, J.S.; Arjmandi, B.H.; Panton, L.B. Effects of resistance training and walking on cardiovascular disease risk in African-American women. Med. Sci. Sports Exerc. 2012, 44, 525–533. [Google Scholar] [CrossRef]
- Moreau, K.L.; Degarmo, R.; Langley, J.; McMahon, C.; Howley, E.T.; Bassett, D.R., Jr.; Thompson, D.L. Increasing daily walking lowers blood pressure in postmenopausal women. Med. Sci. Sports Exerc. 2001, 33, 1825–1831. [Google Scholar] [CrossRef]
- Musto, A.; Jacobs, K.; Nash, M.; DelRossi, G.; Perry, A. The effects of an incremental approach to 10,000 steps/day on metabolic syndrome components in sedentary overweight women. J. Phys. Act. Health 2010, 7, 737–745. [Google Scholar] [CrossRef] [PubMed]
- Pal, S.; Cheng, C.; Ho, S. The effect of two different health messages on physical activity levels and health in sedentary overweight, middle-aged women. BMC Public Health 2011, 11, 204. [Google Scholar] [CrossRef] [PubMed] [Green Version]
- Rodriguez-Hernandez, M.; Martin, J.S.; Pascoe, D.D.; Roberts, M.D.; Wadsworth, D.W. Multiple Short Bouts of Walking Activity Attenuate Glucose Response in Obese Women. J. Phys. Act. Health 2018, 15, 279–286. [Google Scholar] [CrossRef] [PubMed]
- Sugawara, J.; Otsuki, T.; Tanabe, T.; Hayashi, K.; Maeda, S.; Matsuda, M. Physical activity duration, intensity, and arterial stiffening in postmenopausal women. Am. J. Hypertens. 2006, 19, 1032–1036. [Google Scholar] [CrossRef] [PubMed] [Green Version]
- Sugiura, H.; Sugiura, H.; Kajima, K.; Mirbod, S.M.; Iwata, H.; Matsuoka, T. Effects of long-term moderate exercise and increase in number of daily steps on serum lipids in women: Randomised controlled trial [ISRCTN21921919]. BMC Womens Health 2002, 2, 3. [Google Scholar] [CrossRef] [Green Version]
- Swartz, A.M.; Strath, S.J.; Bassett, D.R.; Moore, J.B.; Redwine, B.A.; Groër, M.; Thompson, D.L. Increasing daily walking improves glucose tolerance in overweight women. Prev. Med. 2003, 37, 356–362. [Google Scholar] [CrossRef]
- Bravata, D.M.; Smith-Spangler, C.; Sundaram, V.; Gienger, A.L.; Lin, N.; Lewis, R.; Stave, C.D.; Olkin, I.; Sirard, J.R. Using pedometers to increase physical activity and improve health: A systematic review. JAMA 2007, 298, 2296–2304. [Google Scholar] [CrossRef]
- Albright, C.; Thompson, D.L. The effectiveness of walking in preventing cardiovascular disease in women: A review of the current literature. J. Womens Health 2006, 15, 271–280. [Google Scholar] [CrossRef]
- Leon, A.S.; Sanchez, O.A. Response of blood lipids to exercise training alone or combined with dietary intervention. Med. Sci. Sports Exerc. 2001, 33, S502–S515; discussion S528–S529. [Google Scholar] [CrossRef]
- Swift, D.L.; Nevels, T.R.; Solar, C.A.; Brophy, P.M.; McGee, J.E.; Brewer, S.B.; Clark, A.; Houmard, J.A.; Lutes, L.D. The Effect of Aerobic Training and Increasing Nonexercise Physical Activity on Cardiometabolic Risk Factors. Med. Sci. Sports Exerc. 2021, 53, 2152–2163. [Google Scholar] [CrossRef]
- Woolf, K.; Reese, C.E.; Mason, M.P.; Beaird, L.C.; Tudor-Locke, C.; Vaughan, L.A. Physical activity is associated with risk factors for chronic disease across adult women’s life cycle. J. Am. Diet. Assoc. 2008, 108, 948–959. [Google Scholar] [CrossRef] [PubMed]
- Huffman, K.M.; Sun, J.L.; Thomas, L.; Bales, C.W.; Califf, R.M.; Yates, T.; Davies, M.J.; Holman, R.R.; McMurray, J.J.; Bethel, M.A.; et al. Impact of baseline physical activity and diet behavior on metabolic syndrome in a pharmaceutical trial: Results from NAVIGATOR. Metabolism 2014, 63, 554–561. [Google Scholar] [CrossRef] [PubMed] [Green Version]
- Yates, T.; Davies, M.J.; Haffner, S.M.; Schulte, P.J.; Thomas, L.; Huffman, K.M.; Bales, C.W.; Preiss, D.; Califf, R.M.; Holman, R.R.; et al. Physical activity as a determinant of fasting and 2-h post-challenge glucose: A prospective cohort analysis of the NAVIGATOR trial. Diabet. Med. 2015, 32, 1090–1096. [Google Scholar] [CrossRef] [PubMed] [Green Version]
- Ponsonby, A.L.; Sun, C.; Ukoumunne, O.C.; Pezic, A.; Venn, A.; Shaw, J.E.; Dunstan, D.W.; Barr, E.L.; Blair, S.N.; Cochrane, J.; et al. Objectively measured physical activity and the subsequent risk of incident dysglycemia: The Australian Diabetes, Obesity and Lifestyle Study (AusDiab). Diabetes Care 2011, 34, 1497–1502. [Google Scholar] [CrossRef] [Green Version]
- Sumner, J.; Uijtdewilligen, L.; Yee, A.C.H.; Xian, S.N.H.; Barreira, T.V.; Sloan, R.A.; van Dam, R.M.; Müller-Riemenschneider, F. Volume and Intensity of Stepping Activity and Cardiometabolic Risk Factors in a Multi-ethnic Asian Population. Int. J. Environ. Res. Public Health 2020, 17, 863. [Google Scholar] [CrossRef] [Green Version]
- Wolff-Hughes, D.L.; Fitzhugh, E.C.; Bassett, D.R.; Churilla, J.R. Total Activity Counts and Bouted Minutes of Moderate-to-Vigorous Physical Activity: Relationships With Cardiometabolic Biomarkers Using 2003-2006 NHANES. J. Phys. Act. Health 2015, 12, 694–700. [Google Scholar] [CrossRef]
- Batacan, R.B., Jr.; Duncan, M.J.; Dalbo, V.J.; Tucker, P.S.; Fenning, A.S. Effects of Light Intensity Activity on CVD Risk Factors: A Systematic Review of Intervention Studies. Biomed. Res. Int. 2015, 2015, 596367. [Google Scholar] [CrossRef]
- Loprinzi, P.D. Light-Intensity Physical Activity and All-Cause Mortality. Am. J. Health Promot. 2017, 31, 340–342. [Google Scholar] [CrossRef]
- Migueles, J.H.; Lee, I.M.; Sanchez, C.C.; Ortega, F.B.; Buring, J.E.; Shiroma, E.J. Revisiting the association of sedentary behavior and physical activity with all-cause mortality using a compositional approach: The Women’s Health Study. Int. J. Behav. Nutr. Phys. Act. 2021, 18, 104. [Google Scholar] [CrossRef]
- Ballin, M.; Nordström, P.; Niklasson, J.; Nordström, A. Associations of Objectively Measured Physical Activity and Sedentary Time with the Risk of Stroke, Myocardial Infarction or All-Cause Mortality in 70-Year-Old Men and Women: A Prospective Cohort Study. Sports Med. 2021, 51, 339–349. [Google Scholar] [CrossRef]
- Abdulnour, J.; Boulay, P.; Brochu, M.; Rabasa-Lhoret, R.; Yasari, S.; Prud’homme, D. Relationship between the percentage of predicted cardiorespiratory fitness and cardiovascular disease risk factors in premenopausal women: A MONET study. Climacteric 2010, 13, 347–354. [Google Scholar] [CrossRef] [PubMed] [Green Version]
- Kodama, S.; Saito, K.; Tanaka, S.; Maki, M.; Yachi, Y.; Asumi, M.; Sugawara, A.; Totsuka, K.; Shimano, H.; Ohashi, Y.; et al. Cardiorespiratory fitness as a quantitative predictor of all-cause mortality and cardiovascular events in healthy men and women: A meta-analysis. JAMA 2009, 301, 2024–2035. [Google Scholar] [CrossRef] [PubMed] [Green Version]
- Sultana, R.N.; Sabag, A.; Keating, S.E.; Johnson, N.A. The Effect of Low-Volume High-Intensity Interval Training on Body Composition and Cardiorespiratory Fitness: A Systematic Review and Meta-Analysis. Sports Med. 2019, 49, 1687–1721. [Google Scholar] [CrossRef] [PubMed]
- O’Donoghue, G.; Blake, C.; Cunningham, C.; Lennon, O.; Perrotta, C. What exercise prescription is optimal to improve body composition and cardiorespiratory fitness in adults living with obesity? A network meta-analysis. Obes. Rev. 2021, 22, e13137. [Google Scholar] [CrossRef]
- Wen, D.; Utesch, T.; Wu, J.; Robertson, S.; Liu, J.; Hu, G.; Chen, H. Effects of different protocols of high intensity interval training for VO(2)max improvements in adults: A meta-analysis of randomised controlled trials. J. Sci. Sport 2019, 22, 941–947. [Google Scholar] [CrossRef]
- Kong, Z.; Sun, S.; Liu, M.; Shi, Q. Short-Term High-Intensity Interval Training on Body Composition and Blood Glucose in Overweight and Obese Young Women. J. Diabetes Res. 2016, 2016, 4073618. [Google Scholar] [CrossRef]
- Amagasa, S.; Machida, M.; Fukushima, N.; Kikuchi, H.; Takamiya, T.; Odagiri, Y.; Inoue, S. Is objectively measured light-intensity physical activity associated with health outcomes after adjustment for moderate-to-vigorous physical activity in adults? A systematic review. Int. J. Behav. Nutr. Phys. Act. 2018, 15, 65. [Google Scholar] [CrossRef]
- Drenowatz, C.; Gribben, N.; Wirth, M.D.; Hand, G.A.; Shook, R.P.; Burgess, S.; Blair, S.N. The Association of Physical Activity during Weekdays and Weekend with Body Composition in Young Adults. J. Obes. 2016, 2016, 8236439. [Google Scholar] [CrossRef] [Green Version]
- Knaeps, S.; Bourgois, J.G.; Charlier, R.; Mertens, E.; Lefevre, J.; Wijndaele, K. Ten-year change in sedentary behaviour, moderate-to-vigorous physical activity, cardiorespiratory fitness and cardiometabolic risk: Independent associations and mediation analysis. Br. J. Sports Med. 2018, 52, 1063–1068. [Google Scholar] [CrossRef] [Green Version]
- Mielke, G.I.; Menezes, A.M.B.; BGC, D.A.S.; Ekelund, U.; Crochemore-Silva, I.; Wehrmeister, F.C.; Gonçalves, H.; Brown, W.J. Associations between Device-measured Physical Activity and Cardiometabolic Health in the Transition to Early Adulthood. Med. Sci. Sports Exerc. 2021, 53, 2076–2085. [Google Scholar] [CrossRef]
- Strath, S.J.; Holleman, R.G.; Ronis, D.L.; Swartz, A.M.; Richardson, C.R. Objective physical activity accumulation in bouts and nonbouts and relation to markers of obesity in US adults. Prev. Chronic Dis. 2008, 5, A131. [Google Scholar] [PubMed]
- Millard, L.A.C.; Tilling, K.; Gaunt, T.R.; Carslake, D.; Lawlor, D.A. Association of physical activity intensity and bout length with mortality: An observational study of 79,503 UK Biobank participants. PLoS Med. 2021, 18. [Google Scholar] [CrossRef] [PubMed]
- Marschollek, M. Physical activity event regularity and health outcome—’Undiscovered country’ in cohort accelerometer data. Stud. Health Technol. Inform. 2015, 210, 657–659. [Google Scholar] [PubMed]
- Loprinzi, P.D.; Cardinal, B.J. Association between biologic outcomes and objectively measured physical activity accumulated in ≥10-minute bouts and <10-minute bouts. Am. J. Health Promot. 2013, 27, 143–151. [Google Scholar] [CrossRef]
- Jefferis, B.J.; Parsons, T.J.; Sartini, C.; Ash, S.; Lennon, L.T.; Wannamethee, S.G.; Lee, I.M.; Whincup, P.H. Does duration of physical activity bouts matter for adiposity and metabolic syndrome? A cross-sectional study of older British men. Int. J. Behav. Nutr. Phys. Act. 2016, 13, s12966-s016. [Google Scholar] [CrossRef] [Green Version]
- White, D.K.; Gabriel, K.P.; Kim, Y.; Lewis, C.E.; Sternfeld, B. Do Short Spurts of Physical Activity Benefit Cardiovascular Health? The CARDIA Study. Med. Sci. Sports Exerc. 2015, 47, 2353–2358. [Google Scholar] [CrossRef] [Green Version]
- Saint-Maurice, P.F.; Troiano, R.P.; Matthews, C.E.; Kraus, W.E. Moderate-to-Vigorous Physical Activity and All-Cause Mortality: Do Bouts Matter? J. Am. Heart Assoc. 2018, 7. [Google Scholar] [CrossRef] [Green Version]
- LaMonte, M.J.; Lewis, C.E.; Buchner, D.M.; Evenson, K.R.; Rillamas-Sun, E.; Di, C.; Lee, I.M.; Bellettiere, J.; Stefanick, M.L.; Eaton, C.B.; et al. Both Light Intensity and Moderate-to-Vigorous Physical Activity Measured by Accelerometry Are Favorably Associated With Cardiometabolic Risk Factors in Older Women: The Objective Physical Activity and Cardiovascular Health (OPACH) Study. J. Am. Heart Assoc. 2017, 6. [Google Scholar] [CrossRef] [Green Version]
- Hamer, M.; Stamatakis, E. Physical activity and risk of cardiovascular disease events: Inflammatory and metabolic mechanisms. Med. Sci. Sports Exerc. 2009, 41, 1206–1211. [Google Scholar] [CrossRef]
- Sofi, F.; Capalbo, A.; Marcucci, R.; Gori, A.M.; Fedi, S.; Macchi, C.; Casini, A.; Surrenti, C.; Abbate, R.; Gensini, G.F. Leisure time but not occupational physical activity significantly affects cardiovascular risk factors in an adult population. Eur. J. Clin. Investig. 2007, 37, 947–953. [Google Scholar] [CrossRef]
- Reaven, G.M. Insulin resistance: The link between obesity and cardiovascular disease. Med. Clin. N. Am. 2011, 95, 875–892. [Google Scholar] [CrossRef] [PubMed]
- Rubin, D.A.; Hackney, A.C. Inflammatory cytokines and metabolic risk factors during growth and maturation: Influence of physical activity. Med. Sport Sci. 2010, 55, 43–55. [Google Scholar] [CrossRef] [PubMed]
- Dring, K.J.; Cooper, S.B.; Morris, J.G.; Sunderland, C.; Foulds, G.A.; Pockley, A.G.; Nevill, M.E. Multi-Stage Fitness Test Performance, V O(2) Peak and Adiposity: Effect on Risk Factors for Cardio-Metabolic Disease in Adolescents. Front. Physiol. 2019, 10, 629. [Google Scholar] [CrossRef] [PubMed] [Green Version]
- Schultz, N.S.; Chui, K.K.H.; Economos, C.D.; Lichtenstein, A.H.; Volpe, S.L.; Sacheck, J.M. Impact of physical activity, diet quality and stress on cardiometabolic health in school employees. Prev. Med. Rep. 2020, 20, 101243. [Google Scholar] [CrossRef]
- Pitanga, F.J.G.; Matos, S.M.A.; Almeida, M.; Patrão, A.L.; Molina, M.; Aquino, E.M. Association between leisure-time physical activity and sedentary behavior with cardiometabolic health in the ELSA-Brasil participants. SAGE Open Med. 2019, 7, 2050312119827089. [Google Scholar] [CrossRef]
- Crichton, G.E.; Alkerwi, A. Physical activity, sedentary behavior time and lipid levels in the Observation of Cardiovascular Risk Factors in Luxembourg study. Lipids Health Dis. 2015, 14, 87. [Google Scholar] [CrossRef] [Green Version]
- Nascimento-Ferreira, M.V.; De Moraes, A.C.F.; Toazza Oliveira, P.V.; Rendo-Urteaga, T.; Gracia-Marco, L.; Forjaz, C.L.M.; Moreno, L.A.; Carvalho, H.B. Assessment of physical activity intensity and duration in the paediatric population: Evidence to support an a priori hypothesis and sample size in the agreement between subjective and objective methods. Obes. Rev. 2018, 19, 810–824. [Google Scholar] [CrossRef]


| Reference | Study Design | Sample Size | PA Measure | Health Outcome | Association |
|---|---|---|---|---|---|
| Camhi et al., 2015 [36] | cross-sectional | 46 | ACC: ActiGraph GT3X+; triaxial Volume (min/d): LPA, MPA, VPA, MVPA, MVPA bout (10 min); TPA (counts/d); Steps (n/d). | MS | t-test: (1) MHO group had significantly higher levels of LPA compared to MUO; (2) No differences in MPA, VPA, MVPA, MVPA bouts, TPA, and steps between MHO and MUO groups. |
| Diniz et al., 2015 [37] | cross-sectional | 49 | ACC: ActiGraph GT3x; triaxial meeting/not meeting MVPA (150 min/w) | TNF-alpha, Fasting insulin, HOMA-IR | U-test: (1) Meeting MVPA volume had no effect on TNF-alpha, fasting insulin, and HOMA-IR; |
| Graff et al., 2012 [38] | cross-sectional | 68 | PED: BP 148 Steps (n/d) | TC, LDL, HDL, TG, FPG, PPG, Fasting insulin, Postprandial insulin, HOMA-IR | t-test and U-test: (1) No differences in TC, LDL, HDL, TG, FPG, PPG between Group (Steps/d < 6000) and Group (Steps/d ≥ 6000); (2) Group (Steps/d < 6000) had higher fasting insulin, postprandial insulin and HOMA-IR than Group (Steps/d ≥ 6000). |
| Green et al., 2014 [39] | cross-sectional | 50 | ACC: ActiGraph GT3X+; triaxial Volume (min/d) of LPA, MVPA, MVPA bout (10 min) | FPG, SBP, DBP, TG, TC, HDL, LDL, HOMA-IR, Fasting insulin, CRP, IL-6, TNF-alpha | Regression: (1) MVPA had no association with TG (adjusted for SB, VO2peak, BM) (2) LPA was favorably associated with TG, had no association with HOMA-IR (adjusted for MVPA, VO2peak, BM). Correlation: (1) LPA was favorably associated with TG, TC, HOMR-IR; had no association with FPG, SBP, DBP, HDL, LDL, fasting insulin, CRP, IL-6, TNF-alpha; (2) MVPA was favorably associated with CRP, TNF-alpha; had no association with FPG, SBP, DBP, TG, TC, HDL, LDL, HOMR-IR, fasting insulin, IL-6; (3) MVPA bouts were favorably associated with HOMA-IR, fasting insulin, CRP; had no association with FPG, SBP, DBP, TG, TC, HDL, LDL, IL-6, TNF-alpha. |
| Koniak-Griffin et al., 2014 [40] | cross-sectional | 210 | ACC: Kenz Lifecorder Plus; uniaxial Volume (min/d) of MVPA, MVPA bout (10 min) Steps (n/d) | SBP, DBP, LDL, HDL, TC, TG, FPG | Correlation: (1) Steps/d were favorably associated with TG; had no association with SBP, DBP, LDL, HDL, TC, FPG; (2) MVPA was favorably associated with HDL; unfavorably associated with TC; had no association with SBP, DBP, LDL, TG, FPG; (3) MVPA bouts had no association with SBP, DBP, LDL, HDL, TC, TG, FPG. |
| Lecheminant et al., 2011 [41] | cross-sectional | 264 | ACC: Actigraph; uniaxial Volume (min/w) of MPA, VPA meeting/not meeting MPA (150 min/w) | HOMA-IR | ANCOVA: age, weight, BMI, %BF, and ACi (1) Meeting MPA guidelines had favorable effect on HOMA-IR when adjusted for age or BM; (2) Meeting MPA guidelines had no effect on HOMA-IR when adjusted for %BF, BMI, or ACi; (3) Taking VPA ≥ 60 min/w had favorable effect on HOMA-IR when adjusted for age, BM or BMI; (4) Taking VPA ≥ 60 min/w had no effect on HOMA-IR when adjusted for %BF or ACi; |
| Loprinzi et al., 2012 [42] | cross-sectional | 535 | ACC: n/r Volume (min/d) of MVPA | MS | Regression: adjusted for age, race and smoking (1) MVPA was favorably associated with the odds of being MS; |
| Macena et al., 2021 [43] | cross-sectional | 58 | ACC: ActivPAL; triaxial Sitting/lying down (1.25 METs), Standing (1.4 METs), Walking 120 steps/min (4 METs) (h/d) Steps/d | HOMA-IR | ANOVA: (1) Sitting/lying down, standing, walking, and steps/d had no association with HOMA-IR; |
| Panton et al., 2007 [44] | cross-sectional | 35 | PED: Yamax Digi-Walker SW-200, sealed Steps (n/d) | SBP, DBP; HbA1c, TC, HDL, LDL, TG, CRP | ANOVA: (1) Group (Steps/d < 5000) had lower TC, LDL compared to Group (Steps/d ≥ 5000); (2) No differences in SBP, DBP, HbA1c, HDL, TG, CRP between Groups. |
| Slater et al., 2021 [45] | cross-sectional | 275 | ACC: ActiGraph w-GT3X, Acti-Watch; triaxial Volume (min/d) of MVPA TPA (cpm/d) | HbA1c, FPG, HOMA-IR, TC, TG, HDL, LDL, SBP, DBP, Fasting insulin, CRP | Regression: adjusted for age, socioeconomic, %BF (1) In Group (Pacific), TPA was positivelyunfavorably associated with SBP; (2) In Group (European), TPA was unfavorably associated with HbA1c and CRP; (3) In Group (Pacific), MVPA was unfavorably associated with fasting insulin; (4) In Group (European), MVPA was favorably associated with HDL and HOMA-IR, unfavorably associated with fasting insulin and CRP; (5) In all, TPA was unfavorably associated with CRP and fasting insulin; MVPA was favorably associated with HOMA-IR and HDL, unfavorably associated with CRP and fasting insulin. |
| Tabozzi et al., 2020 [46] | cross-sectional | 13 | ACC: ActiGraph GT3X + BT; triaxial %Volume: LPA, MPA, VPA Volume (min/d) of MVPA Steps (n/d) | FPG, PPG | Regression: adjusted for age, SB (1) MVPA was favorably associated with peak PPG; Correlation: (1) %LPA, %MPA, %VPA, MVPA, steps had no association with FPG; (2)%MPA, %VPA, MVPA were negatively associated with PPG; (3)%LPA and Steps had no association with PPG; |
| Vella et al., 2011 [47] | cross-sectional | 60 | ACC: Actigraph GT1M; uniaxial meeting/not meeting MVPA (30 min/d) | FPG, Fasting insulin, HOMA-IR, TC, HDL, LDL, TG, CRP, SBP, DBP | t-test: (1) Meeting MVPA guidelines had favorable effects on TC and TG; |
| Vella et al., 2009 [48] | cross-sectional | 60 | ACC: Actigraph GT1M; uniaxial Steps (n/d) | FPG, HDL, TG, SBP, DBP | correlation: (1) Steps/d were favorably associated with FPG; Regression: adjusted for age, FFM, FM (1) Steps/d were favorably associated with HDL and TG; |
| Zając-Gawlak et al., 2017 [49] | cross-sectional | 85 | ACC: ActiGraph GT1M; uniaxial Steps (n/d) | MS | U test: (1) Group (Steps/d ≥ 12500) had lower number of MS criteria than Group (10,000–12,500) and Group(<10,000); (2) No differences in the number of MS between Group (10,000–12,500) and Group(<10,000); Odds ratios: Group (Steps/d ≥ 12500) had 3.84 times lower risk of being MS than Group (Steps/d < 12,500); |
| Reference | Study Design | Sample Size | Intervention | PA Measure | Health Outcome | Association |
|---|---|---|---|---|---|---|
| Hasan et al., 2018 [50] | Quasi-experimental design | 52 | 9-week walking program asked to walk 10,000 steps per day | PED: KenzLifeCoder e-step Steps (n/d) | SBP, DBP, TC, TG, HDL, LDL, FPG, Fasting insulin, HOMA-IR, MS | t-test: (1) After intervention, LDL decreased; (2) In Group (18 ≤ BMI < 25), no intervention effect on cardiometabolic parameters; (3) In Group (BMI ≥ 25), after intervention, TG and fasting insulin decreased; (4) In Group (Steps/d > 7056), after intervention, TG decreased; (5) In Group (Steps/d < 7056), no intervention effect on cardiometabolic parameters; Correlation: (1) After intervention, steps/d were favorably associated with MS Score; (2) After intervention, in Group (18 ≤ BMI < 25), steps/d had no association with all parameters; (3) After intervention, in Group (BMI ≥ 25), steps/d were favorably associated with MS Score; unfavorably associated with SBP and DBP; |
| Hornbuckle et al., 2012 [51] | Random experiment | 44 | 12-week exercise intervention Group 1: asked to walk 10,000 steps/d Group 2: asked to walk 10,000 steps/d + RT 2d/w | PED: New Lifestyles Digi-Walker SW-200 Steps (n/d) | SBP, DBP, HDL, TG, TC, HbA1c, CRP | ANOVA: (1) No changes in all parameters after intervention in Group 1; (2) HbA1c decreased after intervention in Group 2; |
| Moreau et al., 2001 [52] | Randomized controlled trial | 24 | 24-week incremental walking program Group 1: 3 km increase in daily walking; CONT: maintain current physical activity | PED: Yamax SW200 pedometer Steps (n/d) | SBP, DBP, Fasting insulin, FPG, HOMA-IR | ANOVA: (1) SBP decreased after intervention in Group 1 compared with CONT; (2) No changes in other parameters in either group after intervention. |
| Musto et al., 2010 [53] | Quasi-experimental design | 77 | 12-week incremental walking program; asked to increase steps/d by 10% per week; the progression was reduced to a 3% when steps/d reached 10,000 Group 1: improved steps/d by 3000 or greater; CONT: stopped participating or did not achieve step improvement level | PED: Sportline 330 Steps (n/d) | SBP, DBP, TG, FPG, HDL | ANOVA: (1) SBP and FPG decreased after intervention in Group 1; |
| Pal et al., 2011 [54] | Random experiment | 28 | 12-week walking program; Group 1: asked to undertake 30 min of walking/day; with sealed pedometer Group B: asked to accumulate 10,000 steps/d, with unsealed pedometer | PED: Yamax Digi-Walker SW-200 Steps (n/d) | SBP, DBP | ANOVA: (1) No changes in SBP and DBP in either group after intervention. |
| Rodriguez-Hernandez et al., 2018 [55] | Crossover design study | 10 | 3-condition multiple walking breaks Condition 1: 4-h SB; Condition 2: 4-h SB with 2-min of moderate-intensity walking every 30 min; Condition 3: 4-h SB with 5-min of moderate-intensity walking every 30 min. | ACC: ActiGraph GT3X; triaxial %Volume: LPA, MVPA | PPG, AUCglucose | ANOVA: (1) There were between-condition differences for both %LPA and %MVPA during experiment between all conditions; (2) There were between-condition differences for the 4h-PPG between Condition 1 and Condition 3; (3) No between-condition differences for 1 h-, 2 h-, and 3 h-PPG; (4) No between-condition differences for peak PPG; (5) 2h-AUCglucose was lower in Condition 3 compared to Condition 1; |
| Sugawara et al., 2006 [56] | Random experiment | 17 | 12-week cycling training Group 1 (n = 8): 180–300 kcal/session, 3–5 sessions/week at 40% HRR Group 2 (n = 9): at 70% HRR | ACC: Lifecorder; uniaxial LPA (<4METs), MPA (4–6METs), VPA (>6METs) (min/d) | SBP, DBP | ANOVA: (1) No changes in SBP or DBP in eigher group after intervention. |
| Sugiura et al., 2002 [57] | Randomized controlled trial | 27 | 24-month exercise intervention Group 1 (n = 14): 90-min exercise (40–60%VO2max) 1 d/w + asked to increase at least 2000–3000 steps/d CONT (n = 13): maintain current physical activity | PED: n/r Steps (n/d) | TC, HDL, TG, LDL | ANOVA: (1) TC decreased after intervention in Group 1; (2) HDL increased after intervention in Group 1 compared with CONT; Regression: age, BMI, menopausal status (1) Steps/d had no association with TC and HDL in Group 1 before intervention; (2) Steps/d were favorably associated with TC, HDL, ΔTC and ΔHDL in Group 1 after intervention; |
| Swartz et al., 2003 [58] | Quasi-experimental design | 18 | 4-week control period followed by 8-week walking program | PED: Yamax Digi-Walker SW-200 Steps (n/d) | SBP, DBP, FPG, PPG, Fasting insulin, Postprandial insulin, HOMA-IR, AUCglucose, AUCinsulin | ANOVA: (1) SBP, DBP, 2 h-PPG, 2 h-AUC glucose decreased after intervention. |
| Reference | Country | Race | Sample Size | Age | Body Mass Index | Menstrual Status | Diet | Education | Lifestyle | Socio-Economic Level | Tobacco |
|---|---|---|---|---|---|---|---|---|---|---|---|
| Camhi et al., 2015 [36] | USA | African American (61%) | 46 | 26.7 ± 4.7 | 31.1 ± 3.7 | / | no affected medications and dietary supplements | / | / | / | non-smoker (80%) |
| Diniz et al., 2015 [37] meet PA guideline | Brazil | / | 25 | 55.8 ± 7.2 | 26.9 ± 5.1 | postmenopausal | no affected medications | / | physically active | / | / |
| Diniz et al., 2015 [37] not meet PA guideline | Brazil | / | 24 | 61.6 ± 6.2 | 29.1 ± 9.0 | postmenopausal | no affected medications | / | physically inactive | / | / |
| Graff et al., 2012 [38] | Brazil | Caucasian (73%) | 68 | 28.0 ± 6.0 | 28.0 ± 6.0 | premenopausal | no affected medications | / | / | / | / |
| Green et al., 2014 [39] | USA | Caucasian (92%) | 50 | 24.0 ± 4.8 | 27.0 ± 4.8 | premenopausal | no affected medications | collage (84%) | / | college student (84%) | no smoking for 6 months |
| Koniak-Griffin et al., 2014 [40] | USA | Latina | 210 | 44.6 ± 7.9 | 32.6 ± 5.7 | / | / | college or more (4%) | / | low income | / |
| Lecheminant et al., 2011 [41] | USA | Caucasian (90%) | 264 | 40.1 ± 3.0 | 31.7 ± 6.9 | premenopausal | / | college or more (50%) | / | / | non-smoker |
| Loprinzi et al., 2012 [42] | USA | Caucasian (73%) | 535 | 49.3 ± 0.9 | 28.8 ± 0.3 | / | / | / | / | / | non-smoker (60%) |
| Macena et al., 2021 [43] | Brazil | / | 58 | 31.0 ± 7.0 | 33.3 ± 4.1 | premenopausal | no affected medications | / | / | low income | / |
| Panton et al., 2007 [44] | USA | African American | 35 | 48 ± 8 | 42.3 ± 9.8 | / | no affected medications | / | / | low income | non-smoker (83%) |
| Slater et al., 2021 [45] Pacific normal | New zealand | Pacific | 61 | 25.0 ± 7.0 | 25.9 ± 3.9 | premenopausal | / | / | / | low income | / |
| Slater et al., 2021 [45] Pacific obesity | New zealand | Pacific | 55 | 26.0 ± 6.0 | 35.6 ± 6.1 | premenopausal | / | / | / | low income | / |
| Slater et al., 2021 [45] European normal | New zealand | European | 85 | 30.0 ± 7.0 | 22.5 ± 2.1 | premenopausal | / | / | / | less deprived | / |
| Slater et al., 2021 [45] European obesity | New zealand | European | 74 | 33.0 ± 7.0 | 33.7 ± 3.8 | premenopausal | / | / | / | less deprived | / |
| Tabozzi et al., 2020 [46] | Italy | / | 13 | 32.5 ± 16.1 | 24.0 ± 3.3 | / | no affected medications | / | physically inactive | university nurse students/research staff | / |
| Vella et al., 2011 [47] no meet PA Guideline | USA | Hispanic | 42 | 25.2 ± 5.6 | 23.8 ± 4.0 | / | no affected medications | / | / | / | no smoking for 6 months |
| Vella et al., 2011 [47] meet PA Guideline | USA | Hispanic | 18 | 24.4 ± 4.9 | 23.0 ± 4.6 | / | no affected medications | / | / | / | no smoking for 6 months |
| Vella et al., 2009 [48] | USA | Mexican and Mexican American | 60 | 24.9 ± 0.7 | 23.6 ± 0.5 | / | no affected medications | / | / | / | no smoking for 6 months |
| Zając-Gawlak et al., 2017 [49] | Poland | / | 85 | 62.8 ± 5.9 | 27.6 ± 4.5 | postmenopausal | / | / | physically active | the Third Age University student | / |
| Hasan et al., 2018 [50] | UAE | / | 52 | 21.4 ± 4.8 | 27.5 ± 5.6 | / | no affected medications | college | / | college student | / |
| Hornbuckle et al., 2012 [51] | USA | African American | 44 | 49.0 ± 5.5 | 34.7 ± 6.4 | / | / | / | physically inactive | / | no smoking for 6 months |
| Moreau et al., 2001 [52] | USA | / | 24 | 54.0 ± 1.0 | / | postmenopausal | / | / | physically inactive | / | non-smoker |
| Musto et al., 2010 [53] Control | USA | / | 34 | 45.7 ± 9.5 | 29.5 ± 5.0 | / | / | / | physically inactive | / | / |
| Musto et al., 2010 [53] Active | USA | / | 43 | 46.3 ± 10.4 | 30.4 ± 5.5 | / | / | / | physically inactive | / | / |
| Pal et al., 2011 [54] 10,000 steps | Australia | / | 13 | 41.4 ± 2.7 | 28.9 ± 1.2 | / | no affected medications | / | physically inactive | / | non-smoker |
| Pal et al., 2011 [54] 30 min walking | Australia | / | 15 | 45.3 ± 2.2 | 29.7 ± 1.1 | / | no affected medications | / | physically inactive | / | non-smoker |
| Rodriguez-Hernandez et al., 2018 [55] | USA | / | 10 | 36.0 ± 5.0 | 38.0 ± 1.6 | / | no affected medications | / | physically inactive | / | / |
| Sugawara et al., 2006 [56] moderate intensity training | Japan | Asian | 8 | 58.0 ± 4.0 | 25.5 ± 3.6 | postmenopausal | / | / | physically inactive | / | non-smoker |
| Sugawara et al., 2006 [56] vigorou intensity training | Japan | Asian | 9 | 59.0 ± 6.0 | 24.2 ± 3.0 | / | / | / | / | / | / |
| Sugiura et al., 2002 [57] intervention | Japan | Asian | 14 | 48.6 ± 4.2 | 22.3 ± 1.6 | both | no affected medications | / | physically inactive | / | / |
| Sugiura et al., 2002 [57] control | Japan | Asian | 13 | 48.0 ± 3.6 | 22.6 ± 1.9 | both | no affected medications | / | physically inactive | / | / |
| Swartz et al., 2003 [58] | USA | / | 18 | 53.3 ± 7.0 | 35.0 ± 5.1 | both | / | / | physically inactive | / | non-smoker |
| Study Group | No. Studies | Meta-Analysis | p | Heterogeneity | |
|---|---|---|---|---|---|
| Variables | r (95%CI) | I² (%) | p | ||
| MVPA (min/day) | |||||
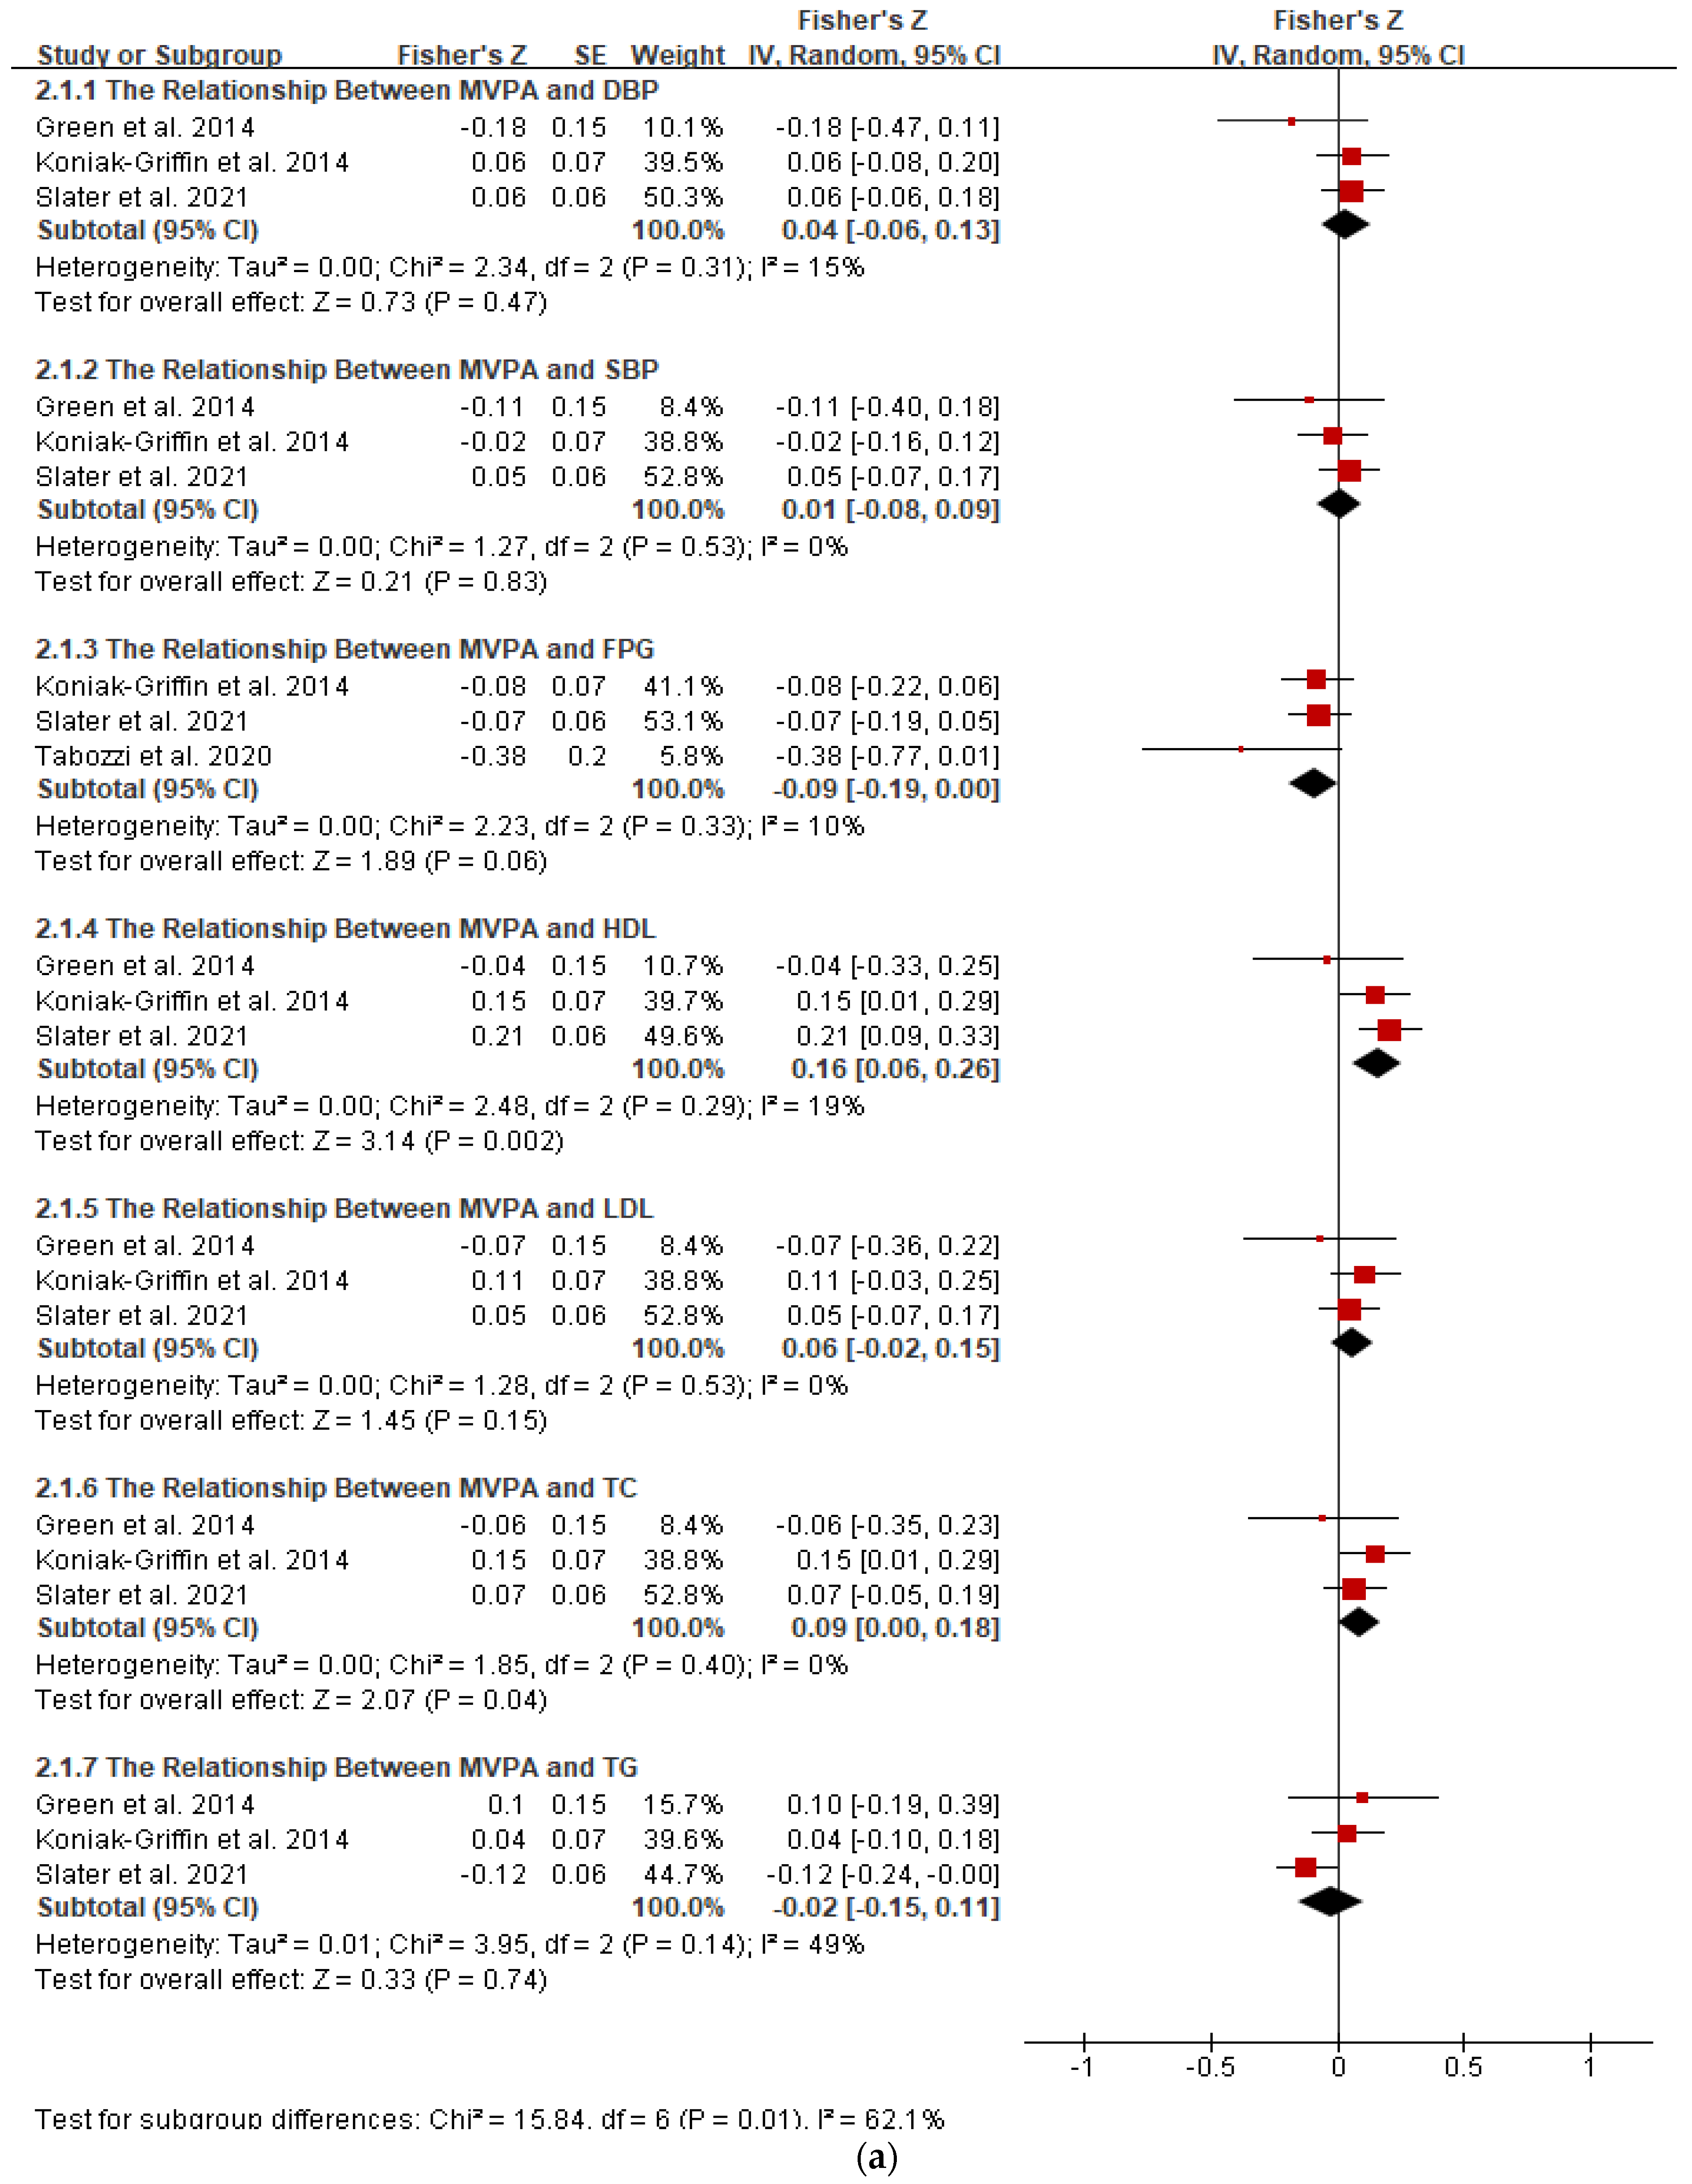
| DBP | 3 | 0.04 (−0.06, 0.13) | 0.47 | 15 | 0.31 |
| SBP | 3 | 0.01 (−0.08, 0.09) | 0.83 | 0 | 0.53 |
| FPG | 3 | −0.09 (−0.19, 0) | 0.06 | 10 | 0.33 |
| HDL | 3 | 0.16 (0.06, 0.25) | 0.002 | 19 | 0.29 |
| LDL | 3 | 0.06 (−0.02, 0.15) | 0.15 | 0 | 0.53 |
| TC | 3 | 0.09 (0, 0.18) | 0.04 | 0 | 0.4 |
| TG | 3 | −0.02 (−0.15, 0.11) | 0.74 | 49 | 0.14 |
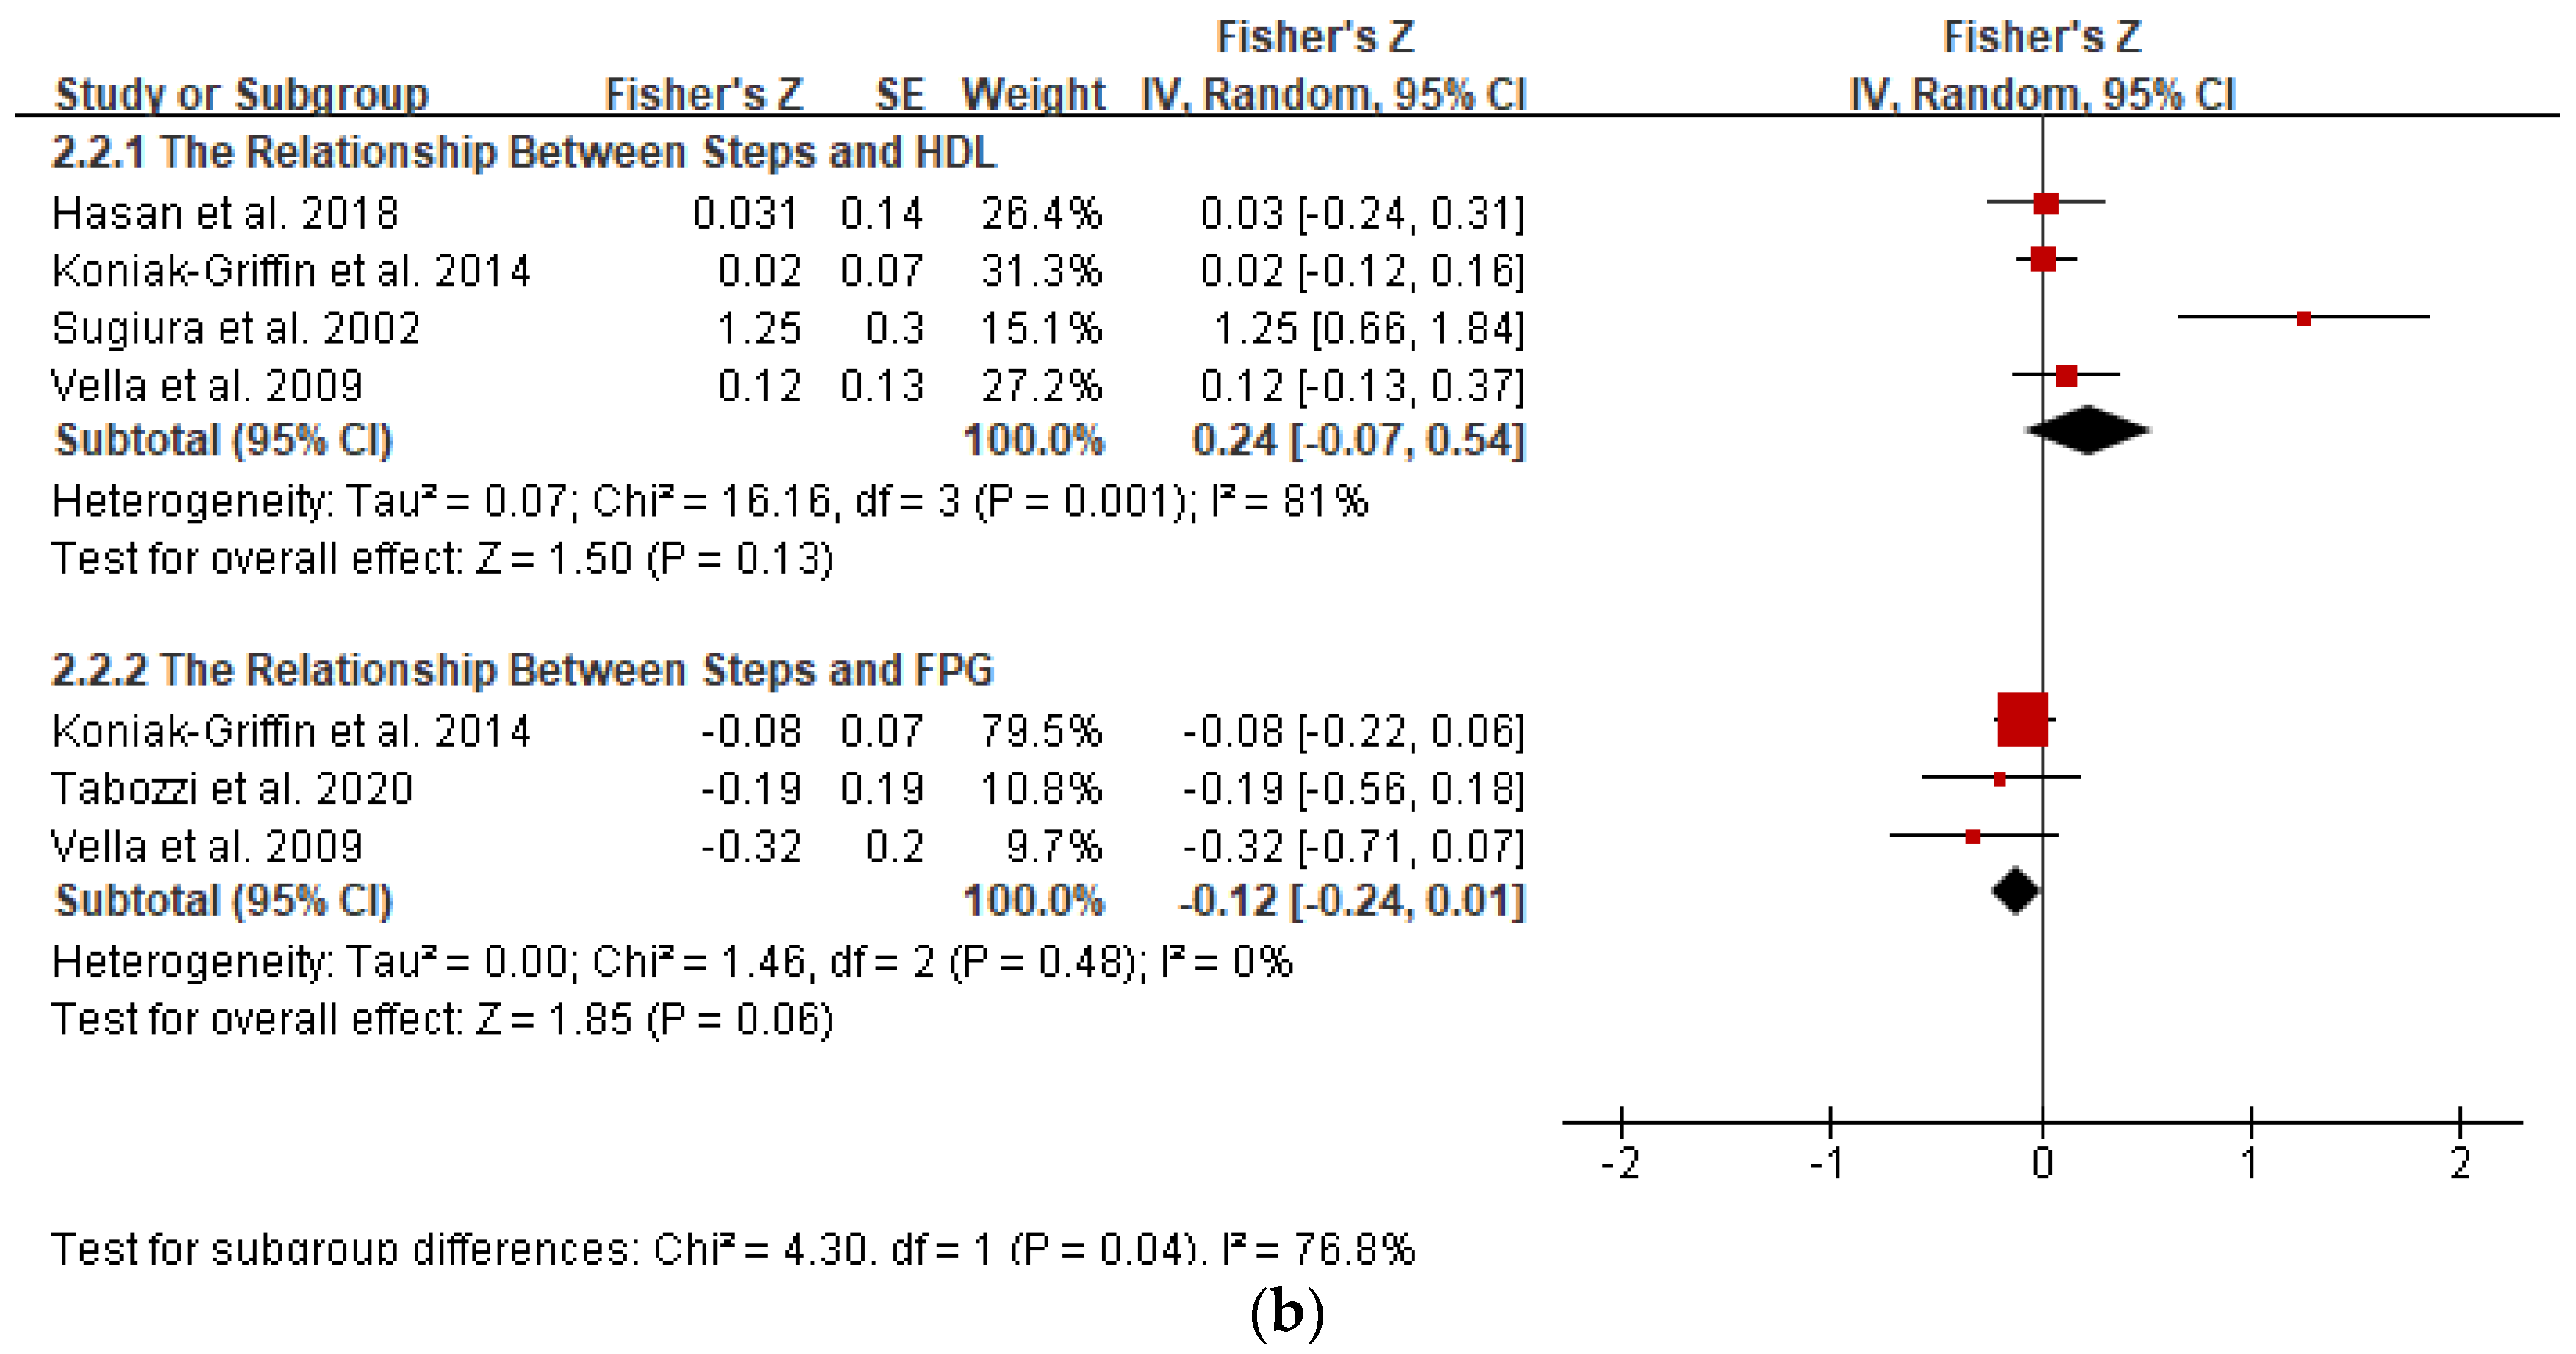
| Steps/day | |||||
| Glucose | 3 | −0.12 (−0.24, 0.01) | 0.06 | 0 | 0.48 |
| HDL | 4 | 0.24 (−0.07, 0.49) | 0.13 | 81 | 0.001 |
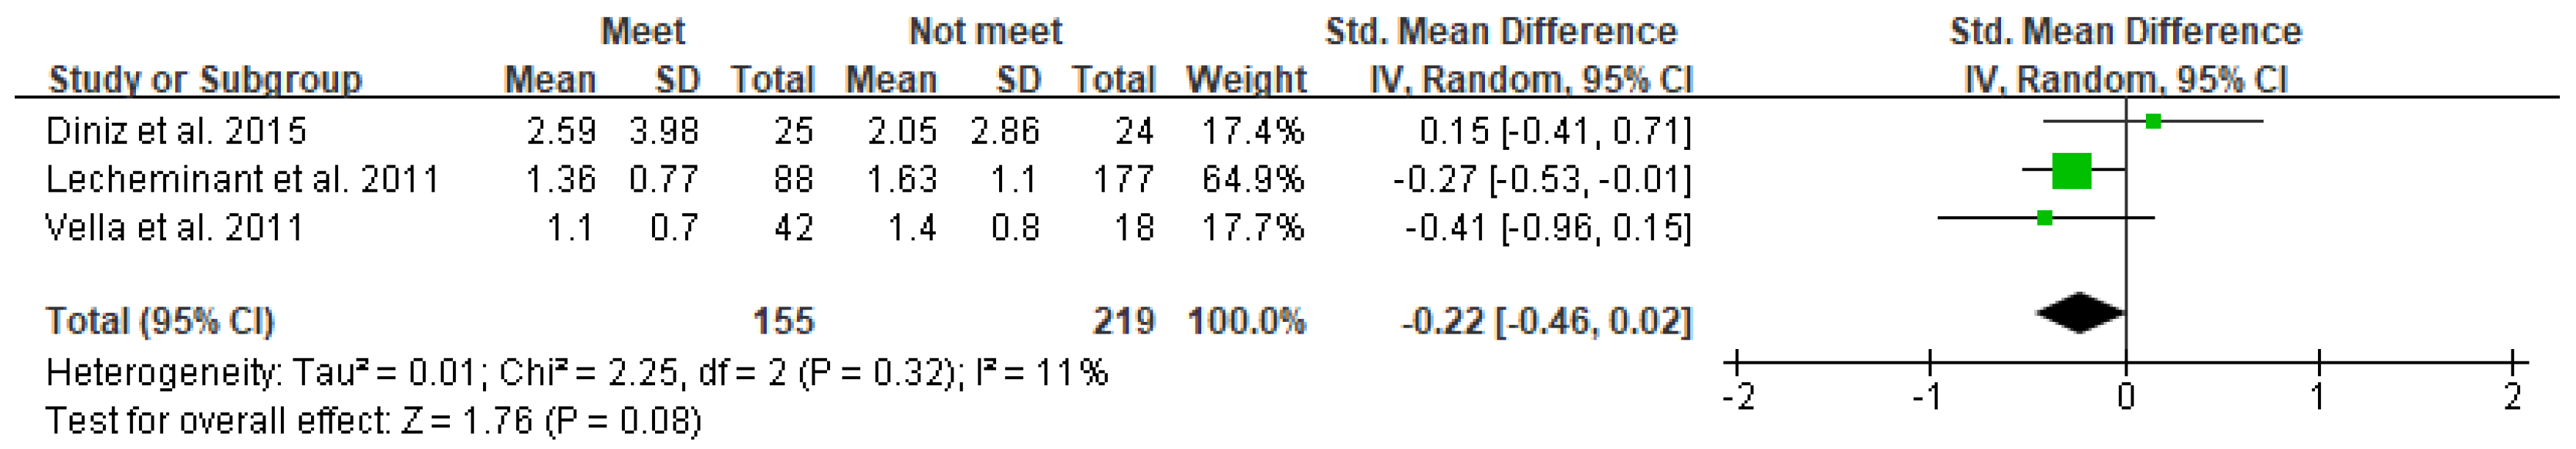
| Variables | No. Studies | Meta-Analysis | Heterogeneity | ||
|---|---|---|---|---|---|
| HOMA-IR | SMD (95%CI) | p | I² (%) | p | |
| Meet vs. Not meet | 3 | −0.22 (−0.46, 0.02) | 0.08 | 11 | 0.32 |
Publisher’s Note: MDPI stays neutral with regard to jurisdictional claims in published maps and institutional affiliations. |
© 2022 by the authors. Licensee MDPI, Basel, Switzerland. This article is an open access article distributed under the terms and conditions of the Creative Commons Attribution (CC BY) license (https://creativecommons.org/licenses/by/4.0/).
Share and Cite
Lu, Y.; Wiltshire, H.D.; Baker, J.S.; Wang, Q.; Ying, S.; Li, J.; Lu, Y. Associations between Objectively Determined Physical Activity and Cardiometabolic Health in Adult Women: A Systematic Review and Meta-Analysis. Biology 2022, 11, 925. https://doi.org/10.3390/biology11060925
Lu Y, Wiltshire HD, Baker JS, Wang Q, Ying S, Li J, Lu Y. Associations between Objectively Determined Physical Activity and Cardiometabolic Health in Adult Women: A Systematic Review and Meta-Analysis. Biology. 2022; 11(6):925. https://doi.org/10.3390/biology11060925
Chicago/Turabian StyleLu, Yining, Huw D. Wiltshire, Julien S. Baker, Qiaojun Wang, Shanshan Ying, Jianshe Li, and Yichen Lu. 2022. "Associations between Objectively Determined Physical Activity and Cardiometabolic Health in Adult Women: A Systematic Review and Meta-Analysis" Biology 11, no. 6: 925. https://doi.org/10.3390/biology11060925