
Sex- and Age-Related Dynamic Changes of the Macroelements Content in the Femoral Bone with Hip Osteoarthritis

 , ,
, ,
Abstract
:Simple Summary
Abstract
1. Introduction
2. Materials and Methods
2.1. Chemical Analysis
2.2. Statistical and Chemometrics Analysis
3. Results
4. Discussion
5. Conclusions
Author Contributions
Funding
Institutional Review Board Statement
Informed Consent Statement
Data Availability Statement
Conflicts of Interest
References
- Li, G.; Zheng, Q.; Landao-Bassonga, E.; Cheng, T.S.; Pavlos, N.J.; Ma, Y.; Zhang, C.; Zheng, M.H. Influence of age and gender on microarchitecture and bone remodeling in subchondral bone of the osteoarthritic femoral head. Bone 2015, 77, 91–97. [Google Scholar] [CrossRef]
- Shanbhogue, V.V.; Brixen, K.; Hansen, S. Age- and Sex-Related Changes in Bone Microarchitecture and Estimated Strength: A Three-Year Prospective Study Using HRpQCT. J. Bone Miner. Res. 2016, 31, 1541–1549. [Google Scholar] [CrossRef] [Green Version]
- Pasco, J.A.; Lane, S.E.; Brennan-Olsen, S.L.; Holloway, K.L.; Timney, E.N.; Bucki-Smith, G.; Morse, A.G.; Dobbins, A.G.; Williams, L.J.; Hyde, N.K.; et al. The Epidemiology of Incident Fracture from Cradle to Senescence. Calcif. Tissue Int. 2015, 97, 568–576. [Google Scholar] [CrossRef]
- Riggs, B.L.; Melton, L.J.; Robb, R.A.; Camp, J.J.; Atkinson, E.J.; McDaniel, L.; Amin, S.; Rouleau, P.A.; Khosla, S. A population-based assessment of rates of bone loss at multiple skeletal sites: Evidence for substantial trabecular bone loss in young adult women and men. J. Bone Miner. Res. 2008, 23, 205–214. [Google Scholar] [CrossRef]
- Mayhew, P.M.; Thomas, C.D.; Clement, J.G.; Loveridge, N.; Beck, T.J.; Bonfield, W.; Burgoyne, C.J.; Reeve, J. Relation between age, femoral neck cortical stability, and hip fracture risk. Lancet 2005, 366, 129–135. [Google Scholar] [CrossRef]
- Carballido-Gamio, J.; Harnish, R.; Saeed, I.; Streeper, T.; Sigurdsson, S.; Amin, S.; Atkinson, E.J.; Therneau, T.M.; Siggeirsdottir, K.; Cheng, X.; et al. Proximal femoral density distribution and structure in relation to age and hip fracture risk in women. J. Bone Miner. Res. 2013, 28, 537–546. [Google Scholar] [CrossRef] [Green Version]
- Karaaslan, F.; Mutlu, M.; Mermerkaya, M.U.; Karaoglu, S.; Sacmaci, S.; Kartal, S. Comparison of bone tissue trace-element concentrations and mineral density in osteoporotic femoral neck fractures and osteoarthritis. Clin. Interv. Aging 2014, 9, 1375–1382. [Google Scholar] [CrossRef] [PubMed] [Green Version]
- Ziola-Frankowska, A.; Kubaszewski, L.; Dabrowski, M.; Kowalski, A.; Rogala, P.; Strzyzewski, W.; Labedz, W.; Uklejewski, R.; Novotny, K.; Kanicky, V.; et al. The Content of the 14 Metals in Cancellous and Cortical Bone of the Hip Joint Affected by Osteoarthritis. Biomed. Res. Int. 2015, 2015, 815648. [Google Scholar] [CrossRef] [PubMed]
- Ziola-Frankowska, A.; Dabrowski, M.; Kubaszewski, L.; Rogala, P.; Frankowski, M. Factors affecting the aluminium content of human femoral head and neck. J. Inorg. Biochem. 2015, 152, 167–173. [Google Scholar] [CrossRef] [PubMed]
- Brodziak-Dopierala, B.; Kowol, J.; Kwapulinski, J.; Kusz, D.; Cielinski, L. Lead and calcium content in the human hip joint. Biol. Trace Elem. Res. 2011, 144, 6–16. [Google Scholar] [CrossRef] [PubMed]
- Jurkiewicz, A.; Wiechula, D.; Nowak, R.; Gazdzik, T.; Loska, K. Metal content in femoral head spongious bone of people living in regions of different degrees of environmental pollution in Southern and Middle Poland. Ecotoxicol. Environ. Saf. 2004, 59, 95–101. [Google Scholar] [CrossRef] [PubMed]
- Alvarez, C.; Cleveland, R.J.; Schwartz, T.A.; Renner, J.B.; Murphy, L.B.; Jordan, J.M.; Callahan, L.F.; Golightly, Y.M.; Nelson, A.E. Comorbid conditions and the transition among states of hip osteoarthritis and symptoms in a community-based study: A multi-state time-to-event model approach. Arthritis Res. Ther. 2020, 22, 12. [Google Scholar] [CrossRef] [PubMed] [Green Version]
- Hernandez-Becerra, E.; Gutierrez-Cortez, E.; Del Real, A.; Rojas-Molina, A.; Rodriguez-Garcia, M.; Rubio, E.; Quintero-Garcia, M.; Rojas-Molina, I. Bone Mineral Density, Mechanical, Microstructural Properties and Mineral Content of the Femur in Growing Rats Fed with Cactus Opuntia ficus indica (L.) Mill. (Cactaceae) Cladodes as Calcium Source in Diet. Nutrients 2017, 9, 108. [Google Scholar] [CrossRef] [PubMed] [Green Version]
- Berger, C.; Langsetmo, L.; Joseph, L.; Hanley, D.A.; Davison, K.S.; Josse, R.; Kreiger, N.; Tenenhouse, A.; Goltzman, D. Change in bone mineral density as a function of age in women and men and association with the use of antiresorptive agents. Cmaj 2008, 178, 1660–1668. [Google Scholar] [CrossRef] [PubMed] [Green Version]
- Gatti, D.; Rossini, M.; Zamberlan, N.; Braga, V.; Fracassi, E.; Adami, S. Effect of aging on trabecular and compact bone components of proximal and ultradistal radius. Osteoporos. Int. 1996, 6, 355–360. [Google Scholar] [CrossRef] [PubMed]
- Delsmann, M.M.; Strahl, A.; Muhlenfeld, M.; Jandl, N.M.; Beil, F.T.; Ries, C.; Rolvien, T. High prevalence and undertreatment of osteoporosis in elderly patients undergoing total hip arthroplasty. Osteoporos. Int. 2021, 32, 1661–1668. [Google Scholar] [CrossRef]
- Bergink, A.P.; van der Klift, M.; Hofman, A.; Verhaar, J.A.; van Leeuwen, J.P.; Uitterlinden, A.G.; Pols, H.A. Osteoarthritis of the knee is associated with vertebral and nonvertebral fractures in the elderly: The Rotterdam Study. Arthritis Rheum. 2003, 49, 648–657. [Google Scholar] [CrossRef]
- Atalar, H.; Yanik, B.; Ozcakar, B.; Atalar, E.; Koktener, A. Bone mineral density is not related to severity of osteoarthritis in the knee in postmenopausal women. Rheumatol. Int. 2008, 28, 233–236. [Google Scholar] [CrossRef]
- Makinen, T.J.; Alm, J.J.; Laine, H.; Svedstrom, E.; Aro, H.T. The incidence of osteopenia and osteoporosis in women with hip osteoarthritis scheduled for cementless total joint replacement. Bone 2007, 40, 1041–1047. [Google Scholar] [CrossRef]
- Aguado-Maestro, I.; Panteli, M.; Garcia-Alonso, M.; Garcia-Cepeda, I.; Giannoudis, P.V. Hip osteoarthritis as a predictor of the fracture pattern in proximal femur fractures. Injury 2017, 48 (Suppl. 7), S41–S46. [Google Scholar] [CrossRef]
- Funck-Brentano, T.; Nethander, M.; Moverare-Skrtic, S.; Richette, P.; Ohlsson, C. Causal Factors for Knee, Hip, and Hand Osteoarthritis: A Mendelian Randomization Study in the UK Biobank. Arthritis Rheumatol. 2019, 71, 1634–1641. [Google Scholar] [CrossRef] [Green Version]
- Lopez-Gomez, J.J.; Izaola-Jauregui, O.; Primo-Martin, D.; Torres-Torres, B.; Gomez-Hoyos, E.; Ortola-Buigues, A.; Martin-Ferrero, M.A.; Perez-Castrillon, J.L.; De Luis-Roman, D.A. Effect of weight loss on bone metabolism in postmenopausal obese women with osteoarthritis. Obes. Res. Clin. Pract. 2019, 13, 378–384. [Google Scholar] [CrossRef]
- Tai, V.; Leung, W.; Grey, A.; Reid, I.R.; Bolland, M.J. Calcium intake and bone mineral density: Systematic review and meta-analysis. BMJ 2015, 351, h4183. [Google Scholar] [CrossRef] [Green Version]
- Whitmarsh, T.; Otake, Y.; Uemura, K.; Takao, M.; Sugano, N.; Sato, Y. A cross-sectional study on the age-related cortical and trabecular bone changes at the femoral head in elderly female hip fracture patients. Sci. Rep. 2019, 9, 305. [Google Scholar] [CrossRef] [Green Version]
- Hussain, S.M.; Cicuttini, F.M.; Bell, R.J.; Robinson, P.J.; Davis, S.R.; Giles, G.G.; Graves, S.; Milne, R.L.; Wang, Y. Incidence of total knee and hip replacement for osteoarthritis in relation to circulating sex steroid hormone concentrations in women. Arthritis Rheumatol. 2014, 66, 2144–2151. [Google Scholar] [CrossRef]
- Hussain, S.M.; Cicuttini, F.M.; Alyousef, B.; Wang, Y. Female hormonal factors and osteoarthritis of the knee, hip and hand: A narrative review. Climacteric 2018, 21, 132–139. [Google Scholar] [CrossRef]
- Hellevik, A.I.; Nordsletten, L.; Johnsen, M.B.; Fenstad, A.M.; Furnes, O.; Storheim, K.; Zwart, J.A.; Flugsrud, G.; Langhammer, A. Age of menarche is associated with knee joint replacement due to primary osteoarthritis (The HUNT Study and the Norwegian Arthroplasty Register). Osteoarthr. Cartil. 2017, 25, 1654–1662. [Google Scholar] [CrossRef] [Green Version]
- Zaichick, S.; Zaichick, V.; Karandashev, V.K.; Moskvina, I.R. The effect of age and gender on 59 trace-element contents in human rib bone investigated by inductively coupled plasma mass spectrometry. Biol. Trace Elem. Res. 2011, 143, 41–57. [Google Scholar] [CrossRef]
- Zaichick, V.; Tzaphlidou, M. Calcium and phosphorus concentrations and the calcium/phosphorus ratio in trabecular bone from the femoral neck of healthy humans as determined by neutron activation analysis. Appl. Radiat. Isot. 2003, 58, 623–627. [Google Scholar] [CrossRef]
- Milovanovic, P.; Potocnik, J.; Stoiljkovic, M.; Djonic, D.; Nikolic, S.; Neskovic, O.; Djuric, M.; Rakocevic, Z. Nanostructure and mineral composition of trabecular bone in the lateral femoral neck: Implications for bone fragility in elderly women. Acta Biomater. 2011, 7, 3446–3451. [Google Scholar] [CrossRef]


| Sex | Female | Male | |||||
|---|---|---|---|---|---|---|---|
| Age Groups | 51–60 | 61–70 | >70 | 51–60 | 61–70 | >70 | |
| n | 12 | 19 | 19 | 16 | 11 | 9 | |
| Femoral neck | Ca | 153.4 ± 32.3 148 (128–178) | 168.6 ± 41.7 165.8 (126–217) | 142.3 ± 33.2 139.7 (121–158) | 170.8 ± 32.4 171.4 (144–202) | 153.6 ± 50.9 144.4 (131–181) | 126.7 ± 36.5 118.5 (103–154) |
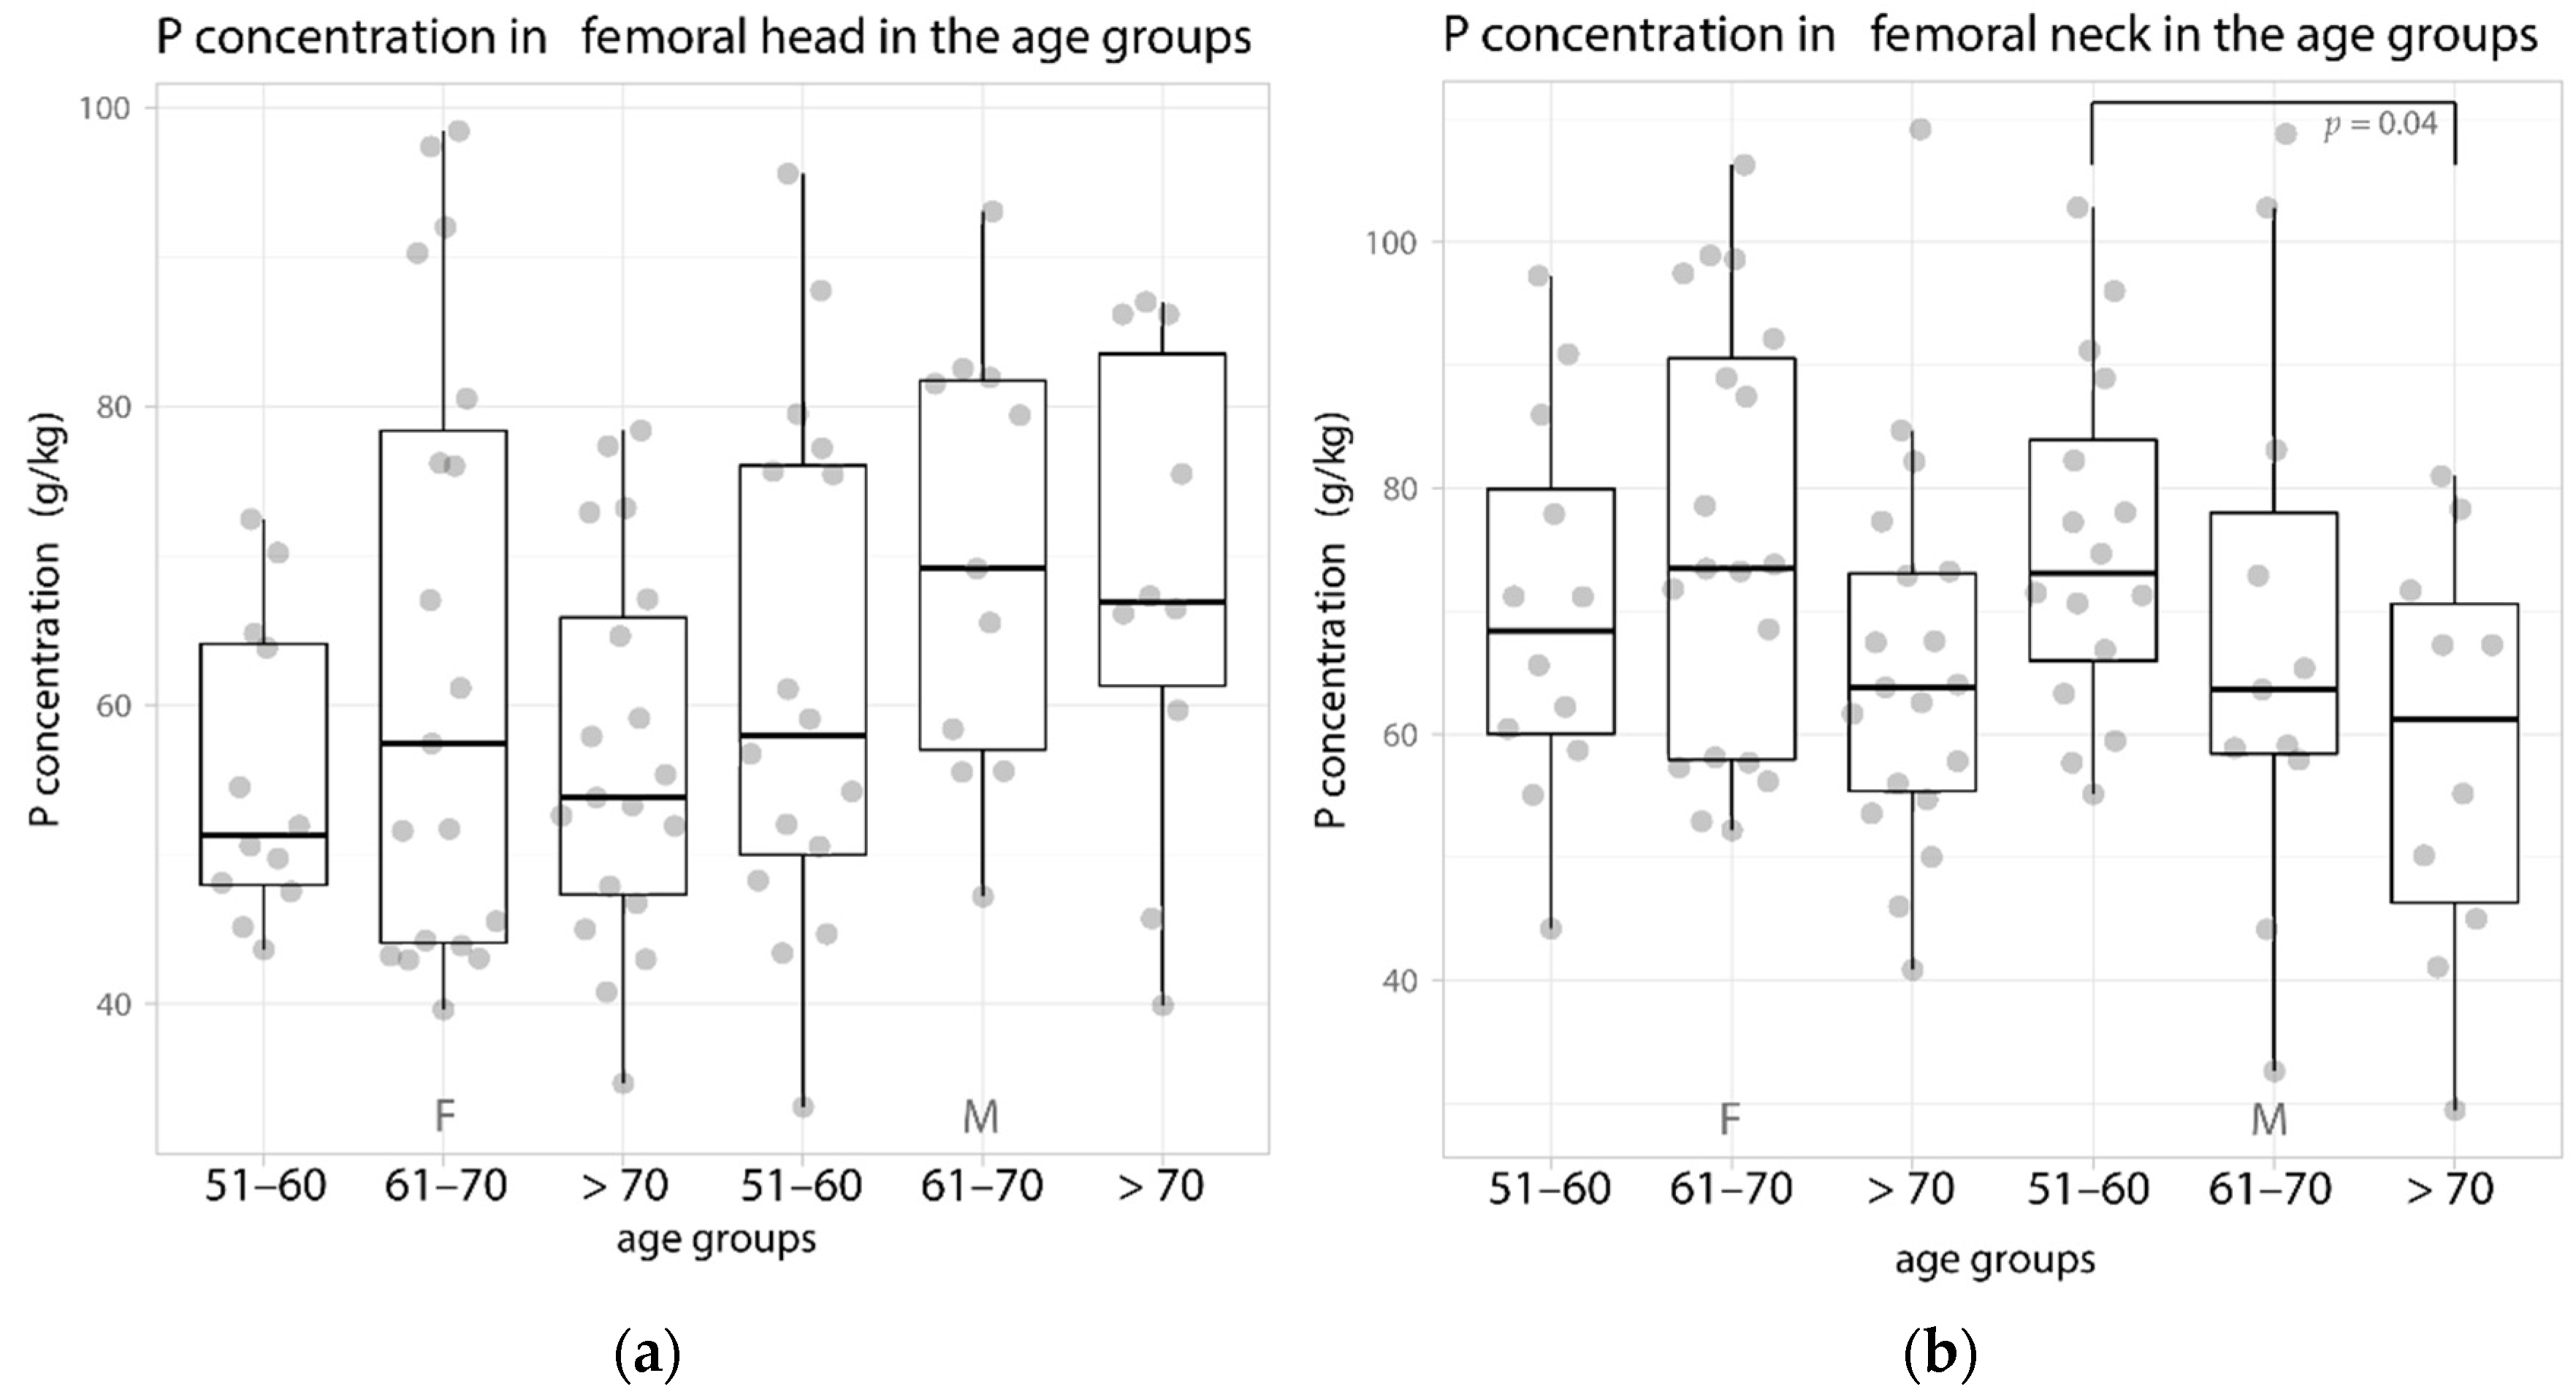
| P | 70.1 ± 15.6 68.4 (60–82) | 76 ± 17.6 73.5 (58–92) | 65.6 ± 15.8 63.8 (55–73) | 75.5 ± 13.9 73.1 (65–86) | 68.1 ± 22.9 63.7 (58–83) | 57.7 ± 17.9 55.2 (45–72) | |
| Ca/P | 2.2 ± 0.1 2.2 (2.1–2.2) | 2.2 ± 0.1 2.2 (2.1–2.3) | 2.2 ± 0.1 2.2 (2.1–2.2) | 2.3 ± 0.2 2.2 (2.2–2.3) | 2.3 ± 0.1 2.3 (2.2–2.3) | 2.2 ± 0.1 2.2 (2.1–2.3) | |
| Mg | 1.6 ± 0.3 1.6 (1–2) | 1.7 ± 0.3 1.7 (1–2) | 1.5 ± 0.3 1.5 (1–2) | 1.7 ± 0.3 1.7 (1–2) | 1.5 ± 0.4 1.6 (1–2) | 1.4 ± 0.3 1.3 (1–2) | |
| Na | 4.6 ± 0.9 4.5 (4–5) | 4.9 ± 0.8 5 (4–5) | 4.6 ± 0.7 4.7 (4–5) | 4.8 ± 1 4.6 (4–5) | 4.5 ± 1.1 4.6 (4–6) | 4.3 ± 1.1 3.7 (4–5) | |
| Femoral head | Ca | 121.5 ± 22.6 112.1 (105–141) | 137.4 ± 44.8 127.7 (96–174) | 124 ± 25.2 122.4 (105–145) | 132.9 ± 37.2 123.8 (106–168) | 152.3 ± 33.3 141.8 (122–182) | 146.9 ± 35.4 150 (139–159) |
| P | 55.2 ± 10 51.3 (48–64) | 63.3 ± 20.7 57.4 (44–81) | 56.6 ± 12.7 53.8 (47–67) | 62.1 ± 17.7 57.9 (49–76) | 70 ± 14.6 69.1 (56–82) | 66 ± 16.1 66.5 (60–75) | |
| Ca/P | 2.2 ± 0.1 2.2 (2.2–2.2) | 2.2 ± 0.1 2.2 (2.1–2.2) | 2.2 ± 0.1 2.2 (2.1–2.2) | 2.2 ± 0.3 2.2 (2.2–2.2) | 2.2 ± 0.1 2.2 (2.1–2.2) | 2.2 ± 0.1 2.2 (2.2–2.3) | |
| Mg | 1.3 ± 0.3 1.2 (1–1) | 1.5 ± 0.4 1.4 (1–2) | 1.3 ± 0.3 1.3 (1–2) | 1.4 ± 0.3 1.3 (1–2) | 1.6 ± 0.3 1.6 (1–2) | 1.5 ± 0.4 1.6 (1–2) | |
| Na | 5.6 ± 1 5.4 (5–6) | 5.9 ± 1.1 5.8 (5–6) | 4.9 ± 0.9 4.8 (4–5) | 5.2 ± 0.9 5.2 (4–6) | 5.7 ± 1.3 5.8 (5–7) | 5.7 ± 1.2 5.8 (6–7) | |
| Sex | Female | Male | ||||
|---|---|---|---|---|---|---|
| Age Groups | 51–60 | 61–70 | > 70 | 51–60 | 61–70 | >70 |
| n | 12 | 19 | 19 | 16 | 11 | 9 |
| Weight (kg) | 71.1 ± 18.1 69 (56.3–81) | 69 ± 14.5 70 (56–77) | 69.9 ± 10.7 69 (64.4–73) | 87 ± 12.8 89 (77–95) | 86.1 ± 22.1 92.5 (68–106) | 78.6 ± 15.3 77 (71–80) |
| BMI (kg/m2) | 27.2 ± 6.6 25 (21.8–31.3) | 26.5 ± 4.4 26.6 (22.7–29.9) | 28 ± 4.1 27.1 (24.4–30.7) | 28.7 ± 3.8 30.1 (26.3–31.3) | 28.9 ± 6.8 29.8 (24.1–33) | 28 ± 5.8 27 (25.7–27.7) |
| Sex | Female | Male | |||||||
|---|---|---|---|---|---|---|---|---|---|
| Age Groups | 51–60 | 61–70 | >70 | All | 51–60 | 61–70 | >70 | All | |
| n | 12 | 19 | 19 | 50 | 16 | 11 | 9 | 36 | |
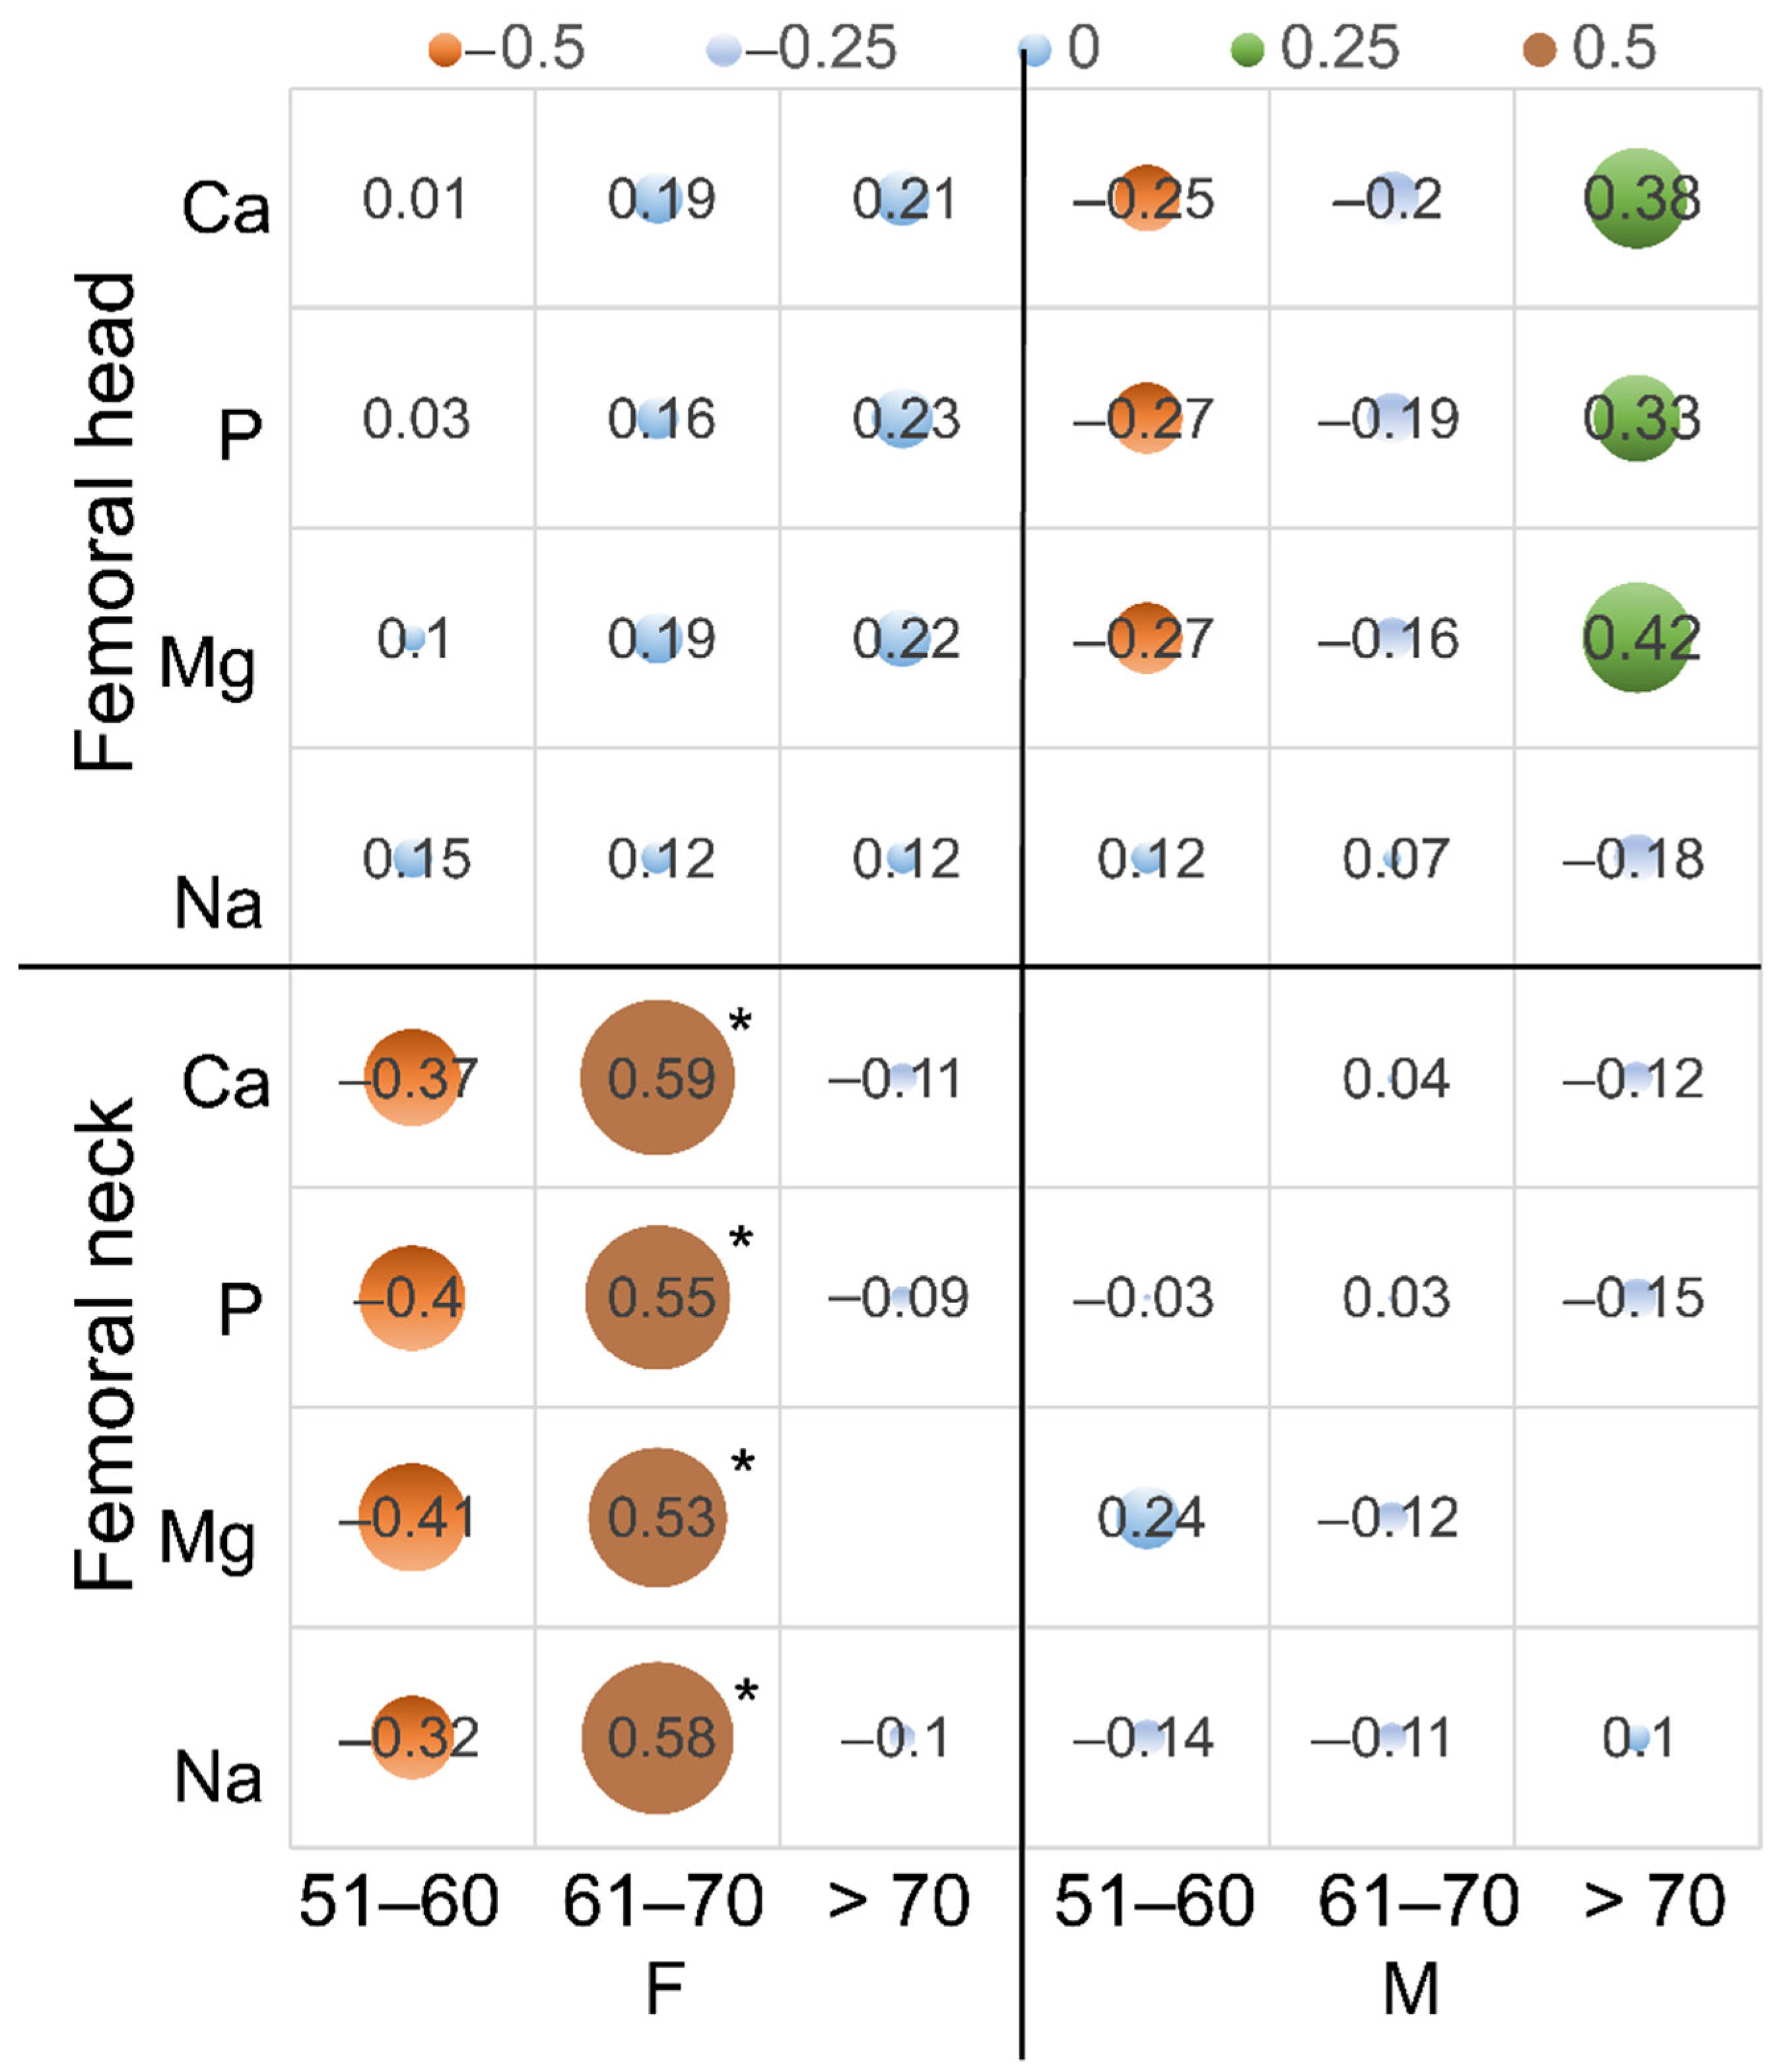
| Femoral neck | Ca | −0.59 * | −0.02 | −0.29 | −0.21 | −0.03 | −0.56 | −0.71 * | −0.48 * |
| P | −0.65 * | −0.01 | −0.38 | −0.21 | 0.02 | −0.53 | −0.76 * | −0.41 * | |
| Mg | −0.63 * | 0.02 | −0.35 | −0.20 | −0.13 | −0.28 | −0.66 | −0.44 * | |
| Na | −0.69 * | −0.18 | −0.42 | −0.14 | −0.25 | −0.09 | −0.59 | −0.30 | |
| Femoral head | Ca | 0 | −0.32 | −0.03 | −0.08 | 0.11 | 0.12 | −0.26 | 0.23 |
| P | 0.01 | −0.2 | −0.06 | −0.08 | 0.07 | 0.13 | −0.23 | 0.15 | |
| Mg | −0.03 | −0.11 | −0.08 | −0.05 | 0.11 | −0.07 | −0.33 | 0.15 | |
| Na | 0.44 | −0.32 | −0.05 | −0.35 * | −0.03 | −0.18 | −0.47 | 0.12 | |
Publisher’s Note: MDPI stays neutral with regard to jurisdictional claims in published maps and institutional affiliations. |
© 2022 by the authors. Licensee MDPI, Basel, Switzerland. This article is an open access article distributed under the terms and conditions of the Creative Commons Attribution (CC BY) license (https://creativecommons.org/licenses/by/4.0/).
Share and Cite
Dąbrowski, M.; Zioła-Frankowska, A.; Frankowski, M.; Daroszewski, P.; Szymankiewicz-Szukała, A.; Kubaszewski, Ł. Sex- and Age-Related Dynamic Changes of the Macroelements Content in the Femoral Bone with Hip Osteoarthritis. Biology 2022, 11, 344. https://doi.org/10.3390/biology11030344
Dąbrowski M, Zioła-Frankowska A, Frankowski M, Daroszewski P, Szymankiewicz-Szukała A, Kubaszewski Ł. Sex- and Age-Related Dynamic Changes of the Macroelements Content in the Femoral Bone with Hip Osteoarthritis. Biology. 2022; 11(3):344. https://doi.org/10.3390/biology11030344
Chicago/Turabian StyleDąbrowski, Mikołaj, Anetta Zioła-Frankowska, Marcin Frankowski, Przemysław Daroszewski, Agnieszka Szymankiewicz-Szukała, and Łukasz Kubaszewski. 2022. "Sex- and Age-Related Dynamic Changes of the Macroelements Content in the Femoral Bone with Hip Osteoarthritis" Biology 11, no. 3: 344. https://doi.org/10.3390/biology11030344