Article

Genome-Wide Association Study Revealed the Effect of rs312715211 in ZNF652 Gene on Abdominal Fat Percentage of Chickens

1
State Key Laboratory of Animal Nutrition, Key Laboratory of Animal (Poultry) Genetics Breeding and Reproduction, Ministry of Agriculture, Institute of Animal Science, Chinese Academy of Agricultural Sciences, Beijing 100193, China
2
College of Animal Science and Technology, College of Veterinary Medicine of Zhejiang A&F University, Hangzhou 311300, China
*
Author to whom correspondence should be addressed.
These authors contributed equally to this work.
Biology 2022, 11(12), 1849; https://doi.org/10.3390/biology11121849
Submission received: 6 November 2022 / Revised: 9 December 2022 / Accepted: 16 December 2022 / Published: 19 December 2022
(This article belongs to the Section Genetics and Genomics)

Abstract

:

Simple Summary

With intensive selection in broilers, excessive abdominal fat accumulation is also present and causes economic concerns. Abdominal fat percentage (AFP) is one of the main indices of abdominal fat traits. We identified key SNP and candidate gene affecting AFP by a genome-wide association study (GWAS). Additionally, the main findings show that rs312715211 on the ZNF652 gene can increase body weight (BW), reduce eviscerated carcass weight (ECW), and increase abdominal fat percentage (AFP).

Abstract

Abdominal fat percentage (AFP) is an important economic trait in chickens. Intensive growth selection has led to the over-deposition of abdominal fat in chickens, but the genetic basis of AFP is not yet clear. Using 520 female individuals from selection and control lines of Jingxing yellow chicken, we investigated the genetic basis of AFP using a genome-wide association study (GWAS) and fixation indices (FST). A 0.15 MB region associated with AFP was located on chromosome 27 and included nine significant single nucleotide polymorphisms (SNPs), which could account for 3.34–5.58% of the phenotypic variation. In addition, the π value, genotype frequency, and dual-luciferase results identified SNP rs312715211 in the intron region of ZNF652 as the key variant. The wild genotype was associated with lower AFP and abdominal fat weight (AFW), but higher body weight (BW). Finally, annotated genes based on the top 1% SNPs were used to investigate the physiological function of ZNF652. Kyoto Encyclopedia of Genes and Genomes (KEGG) analysis suggested that ZNF652 may reduce AFW and BW in broilers through the TGF-β1/SMad2/3 and MAPK/FoxO pathways via EGFR and TGFB1. Our findings elucidated the genetic basis of chicken AFP, rs312715211 on the ZNF652 gene, which can affect BW and AFW and was the key variant associated with AFP. These data provide new insight into the genetic mechanism underlying AF deposition in chickens and could be beneficial in breeding chickens for AF.

1. Introduction

Carcass traits of chickens are economically important, and include abdominal fat (abdominal fat weight, AFW; abdominal fat percentage, AFP), body weight (BW), eviscerated carcass weight (ECW), etc. Broilers typically contain 150–200 g of fat per kg of BW. Abdominal fat accounts for 22% of body fat, but is generally considered waste, due to its low economic value [1]. Excessive deposition of abdominal fat in broilers not only results in low feed conversion rate, fertility, and semen quality, but also affects the economy of the industry [2,3,4]. Currently, decreasing abdominal fat deposition is one of the objectives of broiler production. AFP is one of the main phenotypic indices of abdominal fat traits [5] and is an important component of chicken breeding. However, the genetic basis of AFP remains unclear.
AFP has relatively high heritability, ranging from 0.53 to 0.71 [1,6,7]. This suggests that direct selection may be used in future breeding programs to reduce AFP in broilers. Studies have shown that the AFP of broilers can be reduced via genetic selection [8], and selected broilers show lower AFP and fat deposition than unselected commercial chickens do [9,10]. In a Northeast Agricultural University study, high and low AFP lines were selected, and after 23 generations of selective breeding, the AFP of broilers from the fat line was 9.87 times greater than that of broilers from the control line, despite the fact that there was no difference in body weight between the two lines [11]. These studies show that selection for AFP can reduce abdominal fat deposition in broilers while maintaining or increasing their body weight.
Genome-wide association studies (GWAS) have become the main approach to studying economically important traits in poultry [12]. Numerous statistically significant single nucleotide polymorphisms (SNPs) and qualitative trait loci (QTLs) have been found for AFP of broilers. For example, Hu et al. [13] found that two SNPS in the fat line were significantly associated with AFP after selection. There are reports that revealed a QTL region that significantly affected AFP and explained 6.24% of phenotypic variation [14]. However, to date, the major sites of genetic variation and candidate genes affecting AFP have not yet been revealed. We are, therefore, committed to revealing genomic regions, mapping QTLs, searching for loci and genes associated with abdominal fat deposition, and applying our findings to actual breeding production, in order to improve selective breeding in broilers.
A total of 520 female Jingxing yellow chickens (selection line: 258, control line: 262) were used in this study; among them, the selection line was selected for 16 generations according to intramuscular fat (IMF) content and body weight (BW) [15]. In previous studies, IMF, BW, and AFP were moderately phenotypically and genetically correlated [16]. The objectives of this study were to identify the major SNPs and candidate genes affecting AFP using GWAS and fixation index (FST) analyses, in order to explore the genetic basis of AFP. We hope that effective variants can be identified and used in the practical breeding programs to improve the economics of broiler production.

2. Materials and Methods

2.1. Population and Sample Collection

A total of 520 female Jingxing yellow chickens (selected line: n = 252; control line: n = 268) were bred for intramuscular fat (IMF) and used in this experiment. After 16 generations of breeding, IMF and AFW in the selection line were significantly increased, and breeding programs were as described in Zhao et al. [15]. The chickens were immunized, reared, and maintained under uniform conditions and provided food and water ad libitum, in accordance with NRC international nutritional standards. Blood samples were collected from the chickens’ wings the day before slaughter, and EDTA anticoagulant was stored at −20 °C for DNA extraction. All experimental animals were slaughtered at 98 days of age, and phenotypic traits were measured from carcasses, including AFP, BW, ECW, half eviscerated weight, etc. Abdominal fat percentage was calculated as:
AFP = AFW/(ECW + AFW) × 100%

2.2. Genotyping and Quality Control

DNA was extracted from the blood of 520 female Jingxing yellow chickens using the standard phenolic method, and DNA concentration was measured using nano-Drop1000 nucleic acid protein analyzer (Thermo Fisher Scientific Inc., Waltham, MA, USA). The determination standard was A260 nm/A280 nm (1.8–2.0), Qualified samples were sent to the Beijing Boao Jingdian Company for whole-genome resequencing with a depth of 10×. Double-terminal sequencing (PE150) was used based on the Illumina Novaseq 6000 sequencing technology platform. Whole genome resequencing data were filtered using FASTP (0.19.5) for quality control. The phred mass value was 30, each read had ≥75 bases, and the base mass was removed <30% base. The clean reads were compared with the chicken 6.0 reference genome using BWA software (http://bio-bwa.sourceforge.net, accessed on 10 July 2022). More details about the genotyping and filtering steps are available in the work of Liu et al. [17]. The accession data codes are CRA002643 and CRA002650 at https://bigd.big.ac.cn/gsa/ (accessed on 10 July 2022).
The original sequencing data were first filled with SNP loci using Beagle 5.0 software [18]. PLINK 1.9 was used for further quality control of phenotype and genotype data. After quality control (SNPs and individuals with detection rates >90%, minor allele frequency > 0.05, and extreme deviation from Hardy–Weinberg proportions (p > 0.00001)), 495 animals, 8,940,029 SNPs, and chromosomes 1–28 were retained.

2.3. Genome-Wide Association Study

We applied a linear mixed model (LMM) to conduct a GWAS examining the traits underlying AFP in the selection (n = 252) and control (n = 268) lines, using GEMMA software [19]. The population structure was assessed via principal component analysis (PCA), using PLINK 1.9 to correct for differences between the two lines. The genetic relationship matrix and the first three PCA were added for correction during the LMM calculation based on the model: y = Wα + xβ + u + e, where y represents the phenotypic values of n samples, W represents the fixed effect matrix, α represents the fix effect (population structure, including PCA1, PCA2, and PCA3), x represents the SNPs, β represents the effects of corresponding markers, u represents the random effect vector, and e represents a vector of random residuals. Finally, we analyzed single loci one-by-one and calculated p-values using a derived Wald test. The Bonferroni correction multiple test was used to determine the significance threshold after LD linkage modified SNPs. The sums of the independent LD blocks plus singleton markers were used to define the number of independent statistical comparisons [20]. Finally, 378,446 independent SNPs were used to determine the p-value thresholds, including genome-wide significance (−log10(0.05/378,446)) and suggestive association (−log10(1/378,446)). The Manhattan plots of GWAS for AFP were produced using the “qqman” package in R (https://www.r-project.org/) (accessed on 10 July 2022).

2.4. Fixation Indices (FST) and Heterozygosity (π)

Selection signals combined with nucleotide polymorphism analysis can reveal the genetic mechanisms underlying population evolution. Based on the SNPs remaining after quality control, FST and π analyses were performed on the selected and control lines using Vcftools (V0.1.13) [21]. In FST analysis, a single SNP was used as the step size for genome-wide scanning. The top 5% of FST values were defined as selected loci between the selection and the control lines. Then, π values were calculated for the significant SNPs screened by FST. During π analysis, the window 40,000 and step 10,000 were used to calculate the region.

2.5. Dual-Luciferase Reporter Assay

To quantify the interaction of rs312715211 and its potential target gene ZNF652, we constructed vectors based on PGL4.18 plasmids. According to the chicken 6.0 reference genome sequence, we constructed a 1500 bp promoter sequence upstream of the transcription start site and designated it PGL4.18-ZNF652-pro. We also constructed wild and mutant luciferase reporter vectors of rs312715211 and designated them PGL4.18-SNP-TT and PGL4.18-SNP-AA. Next, chicken embryo fibroblasts (DF1) cells were cultured on a 24-well plate and were co-transfected with 250 ng of PGL4.18-ZNF652-pro and 250 ng of PGL4.18-SNP-TT or PGL4.18-SNP-AA. After 24 h, 100 μL lysate was added according to the Dual Luciferase Reporter Gene Assay Kit (Promega, Madison, WI, USA) and centrifuged for 15 min. Firefly and Renilla activities were measured using 20 ul supernatant, and each group was replicated three times.

2.6. RNA-Seq and Weighted Gene Correlation Network Analysis (WGCNA)

Transcriptomic sequencing was performed on 98-day-old Wenchang chickens’ abdominal fat, including 18 samples. After eliminating abnormal individuals, high and low AFP groups were selected. For detailed sequencing steps, please refer to previous studies [22]. Then, R package “WGCNA” was used to analyze the weighted gene correlation network of five transcriptomes from abdominal fat tissue of chickens with high or low AFP. A weighted co-expression network was constructed using β = 7 to calculate the adjacency between genes. In addition, parameters mergeCutHeight = 0.25 and minmodule-size = 30 were selected for calculation, and gene significance, correlation of modules, and gene expression profile were calculated. The RNA-seq data describing the abdominal fat are included in a previous report by our group and are available at https://bigd.big.ac.cn/gsa/ (accessed on 10 July 2022) (accession data code CRA006031).

2.7. Kyoto Encyclopedia of Genes and Genomes (KEGG)

The top 1% of SNPs were selected for gene annotation, and these genes were enriched. The genes of the significant modules analyzed from the WGCNA were also annotated and then enriched. The KEGG database (http://www.genome.jp/kegg) (accessed on 10 July 2022) [23] is an important public database used for metabolic analysis and regulatory network research. KEGG enrichment analysis of annotated genes was performed using KOBAS, and KEGG pathways with a Q value (corrected p value) ≤ 0.05 were considered significantly enriched. The results were drawn using the “ggplot2” package in R.

2.8. Statistical Analysis

R 4.0.4 and SAS 9.4 (SAS Institute, Cary, NC, USA) were used to generate descriptive statistics and for normal distribution tests of AFP and to test the significance of the differences between the groups using Student’s t-test. Confidence limits were set at 95%, and p < 0.05 (*) or < 0.01 (**) was considered significant. Data are presented as mean ± standard error. ASReml 3.0 software was used to estimate genetic variance, genetic correlation, and heritability. Genetic parameter estimation was based on the animal single trait model using restricted maximum likelihood (REML) and the model:
Y = Xb + Za + e, where Y represents the observed value of traits, b represents the fixed effect vector, and X represents the incidence matrices of fixed effects. a represents the additive genetic effect vector of the individual, Z represents the incidence matrices of the additive genetic effect of the individual, and e represents the random residual effect vector.
The phenotypic variation explained (PVE) can be estimated using equation [24]:
PVE = 2 β 2 M A F ( 1 M A F ) 2 β 2 M A F ( 1 M A F ) + ( s e ( β ) )   2 2 N M A F ( 1 M A F )
where β represents the effect value for the GWAS result, MAF represents SNP minor allele frequency, and N represents the number of individuals included in the GWAS analysis.

3. Results

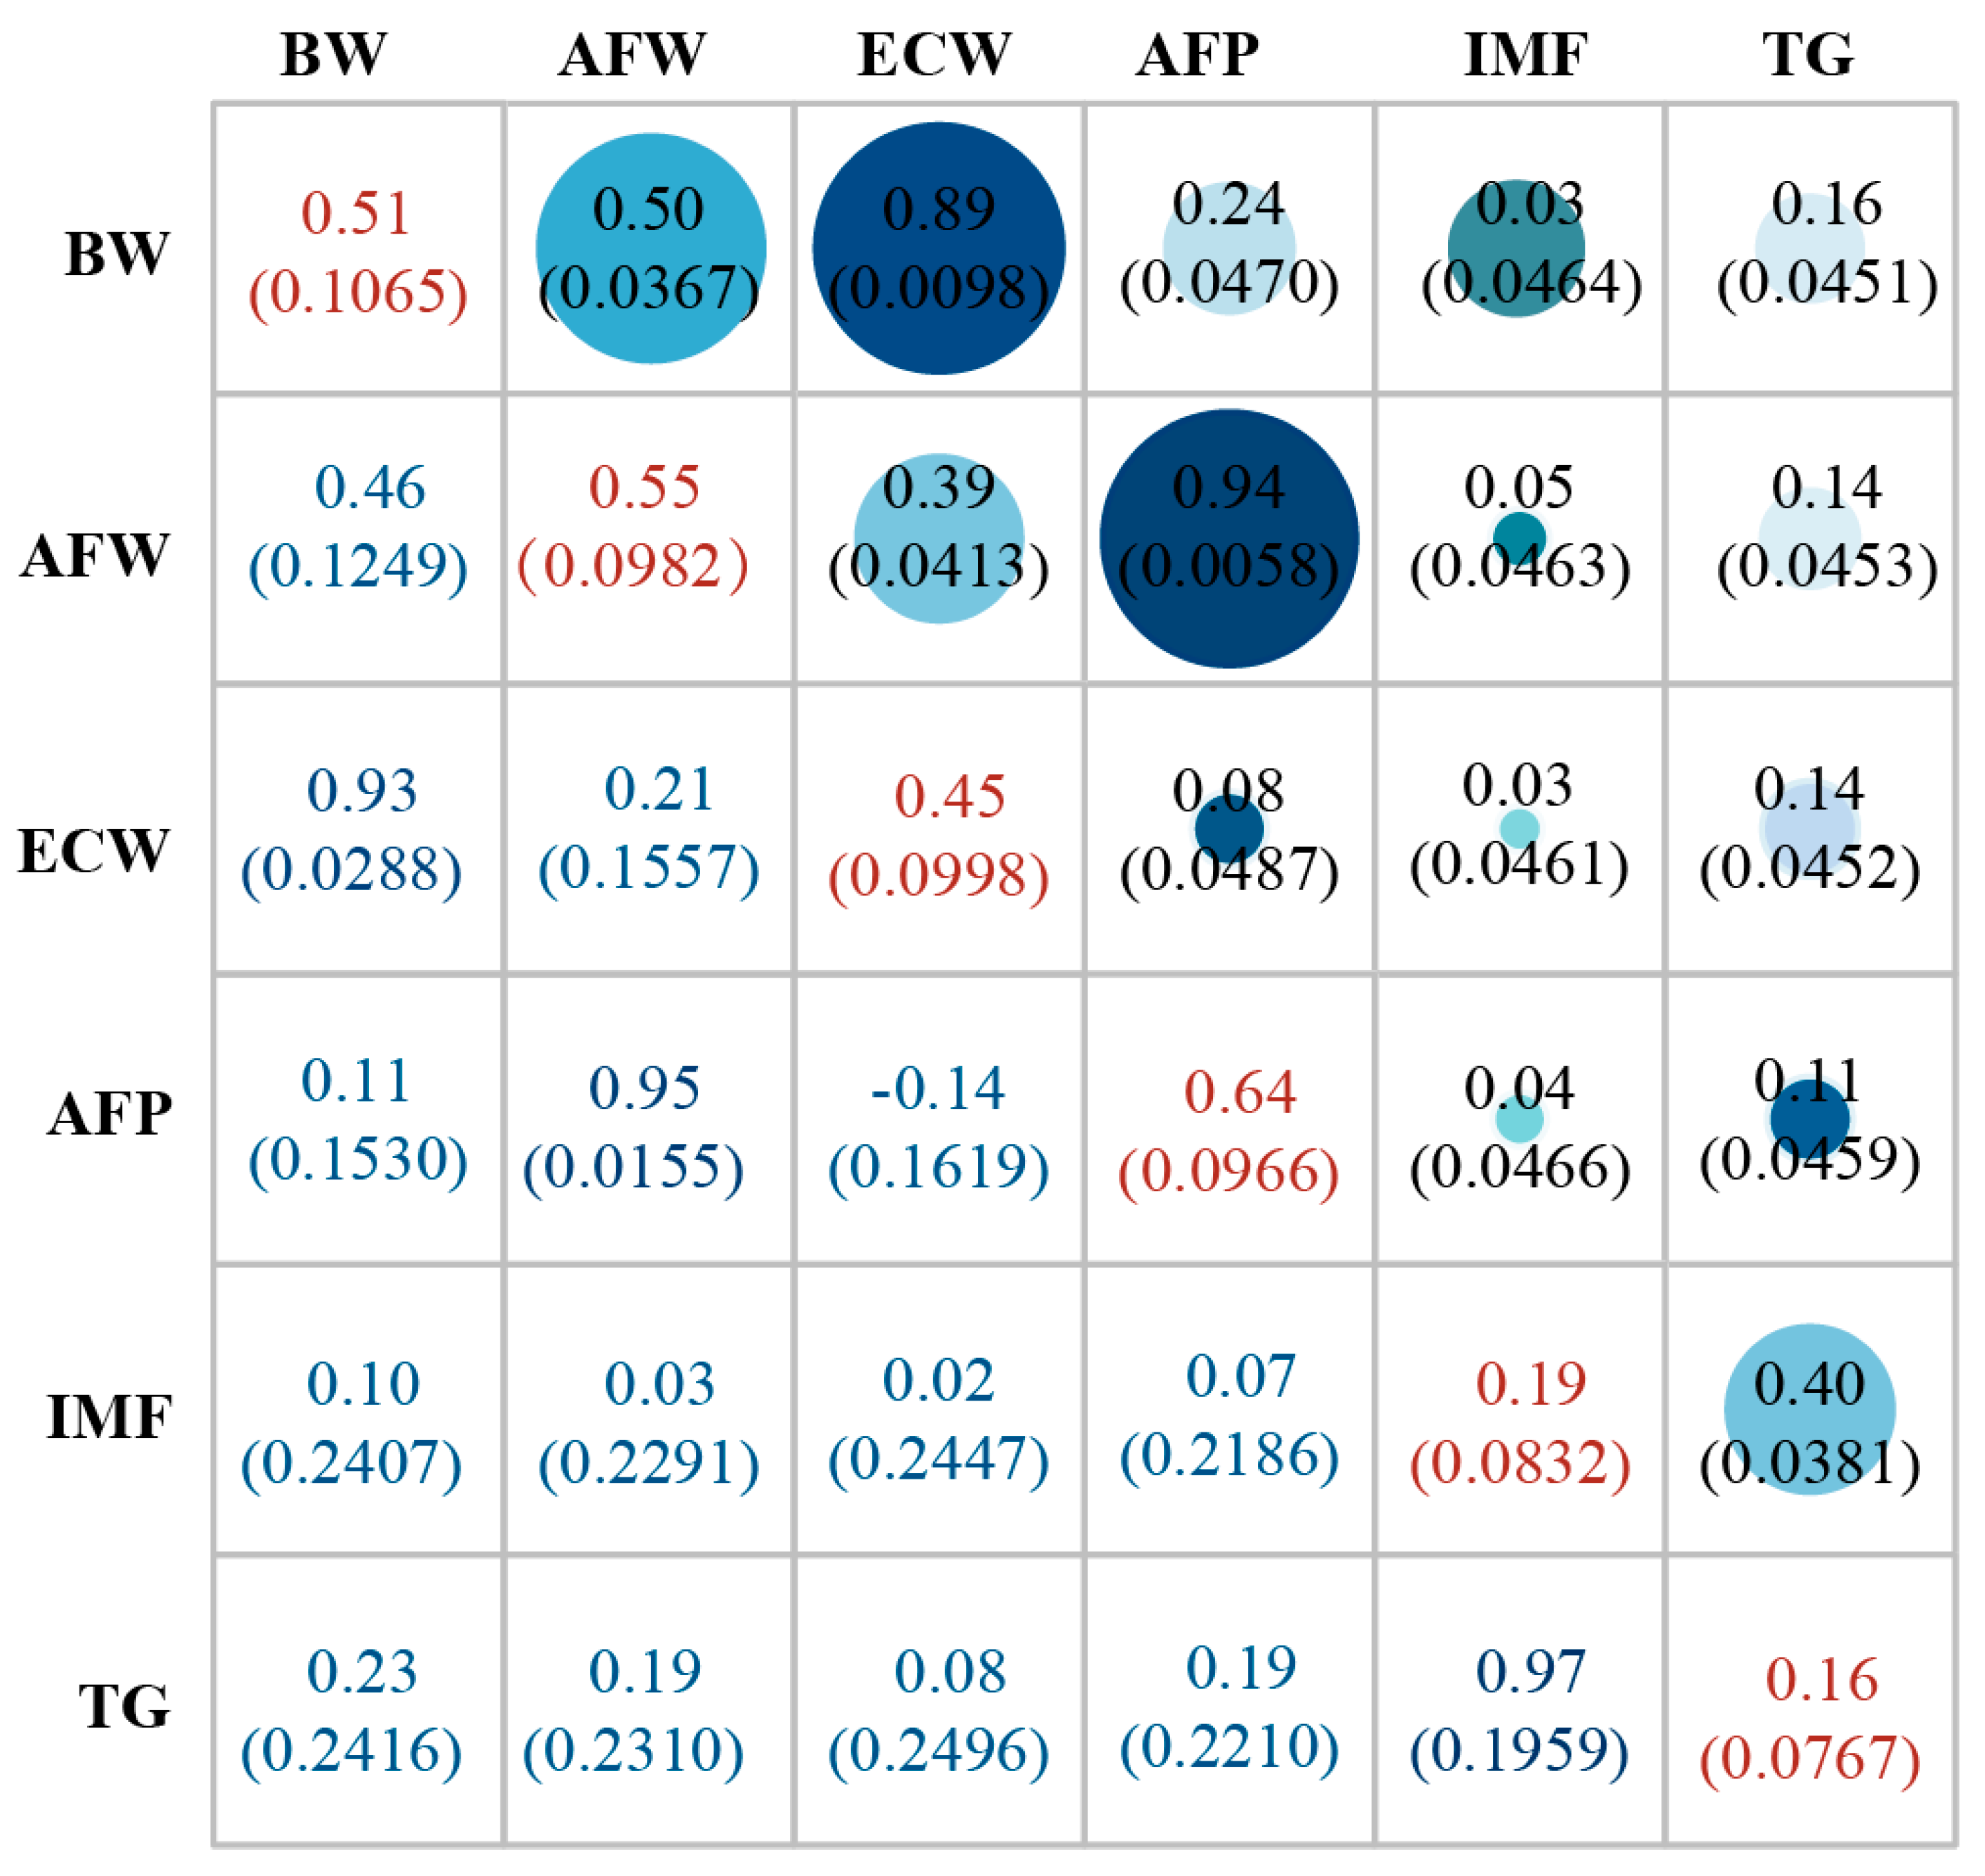
3.1. Phenotypic Statistics and Heritability Evaluation

Descriptive statistics for AFP, ECW, and AFW for both the selection and control lines are presented in Table 1 and Figure 1. The results showed that the AFP, AFW, ECW, etc., of the selection line was higher than control line after selection. Genetic parameter analyses revealed that AFP has high heritability—the heritability was 0.64. Moreover, AFP, BW, and IMF showed positive genetic correlation and phenotypic correlation. The AFW and ECW were significantly (p < 0.01) increased in the selection line, compared to the control line, resulting in no significant difference in AFP (AFP correlates with the AFW/ECW ratio) between the selection and control lines.

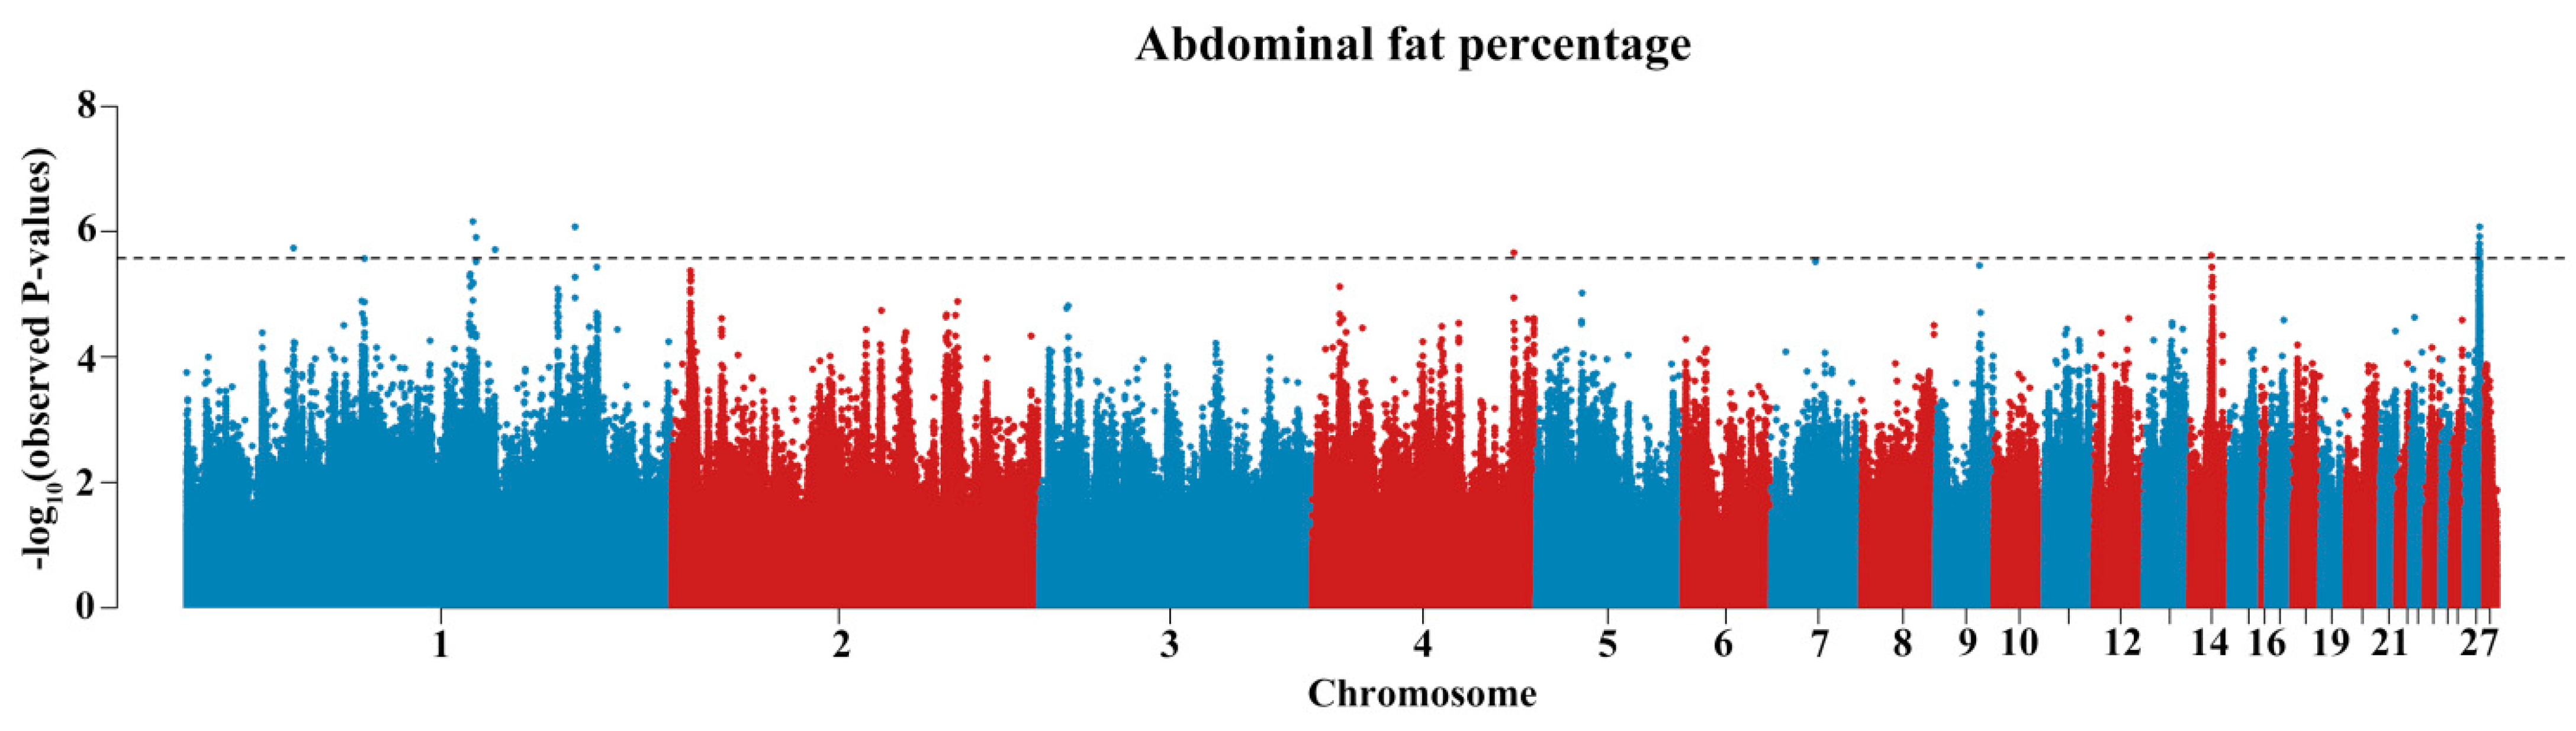
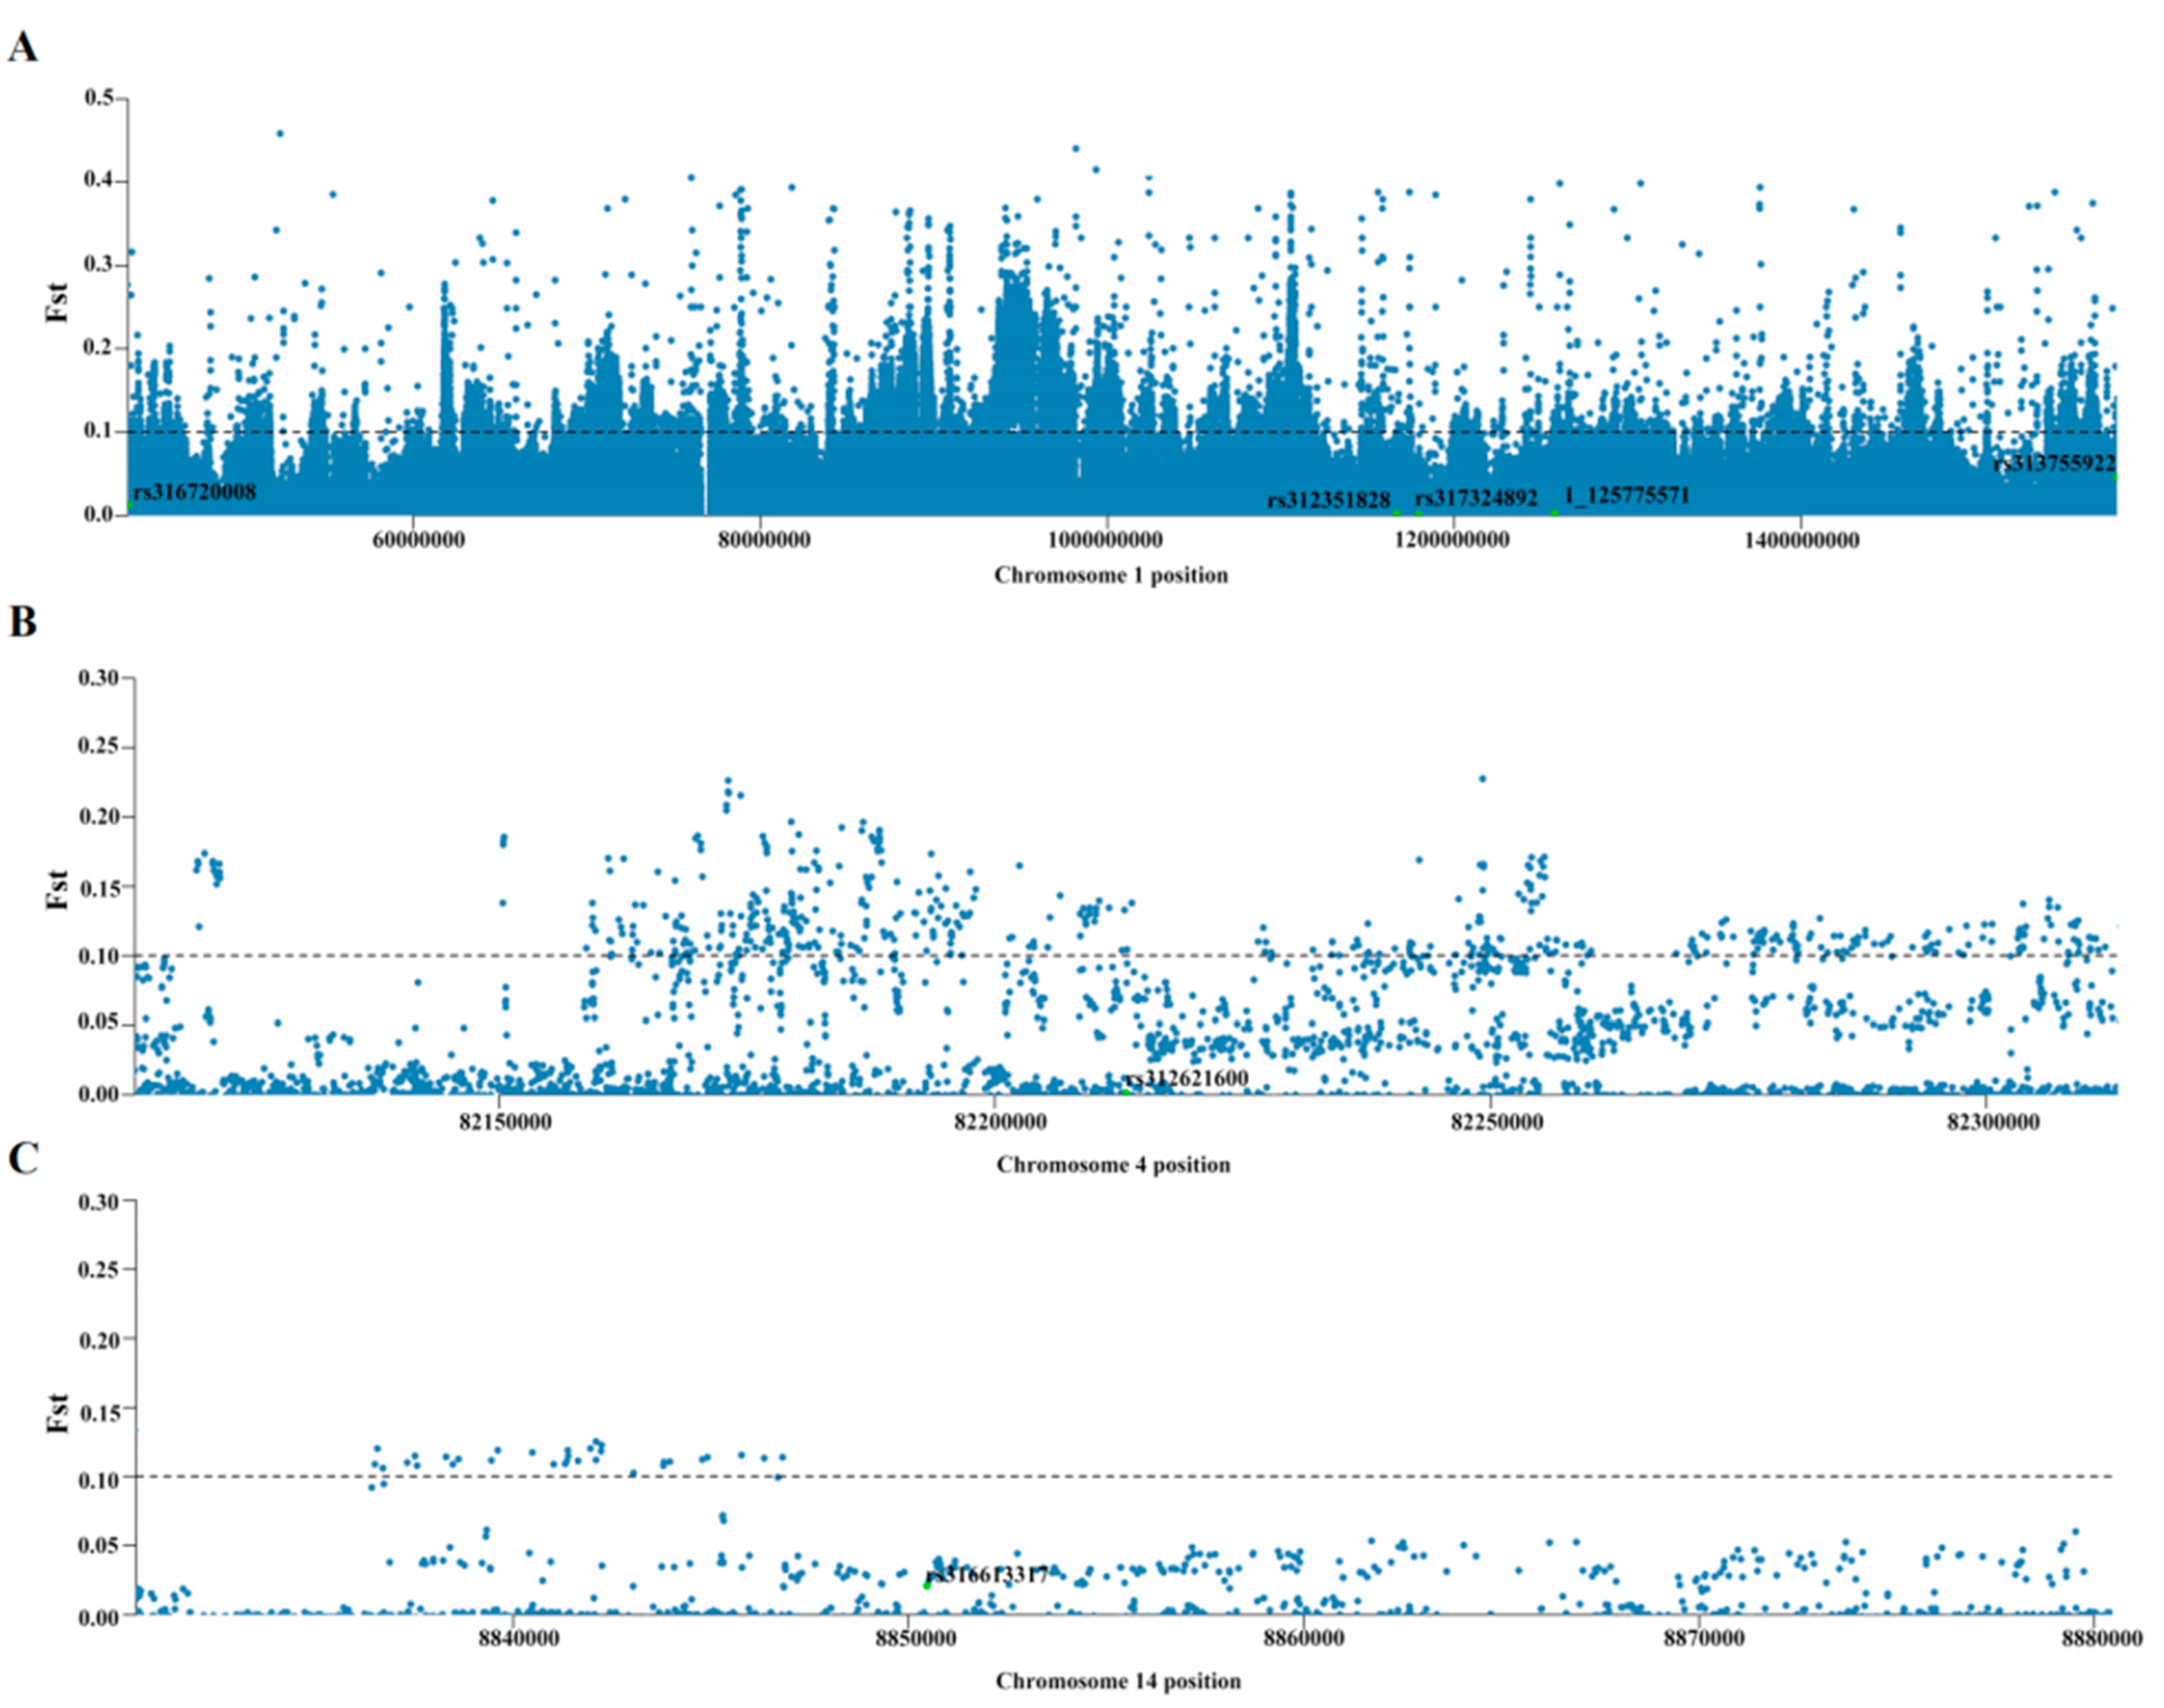
3.2. GWAS Identified the Effective Variants and Candidate Genes

To find significant variation at the genomic level, we performed GWAS of AFP. The GWAS results are summarized in Figure 2 and Table 2. The chromosomal significance threshold was −log10(0.05/378,446). The potential significance level threshold was −log10(1/378,446). These analyses showed that the significant SNPs associated with AFP phenotype were located on chromosomes 1, 14, and 27. An approximately 0.15 MB region on chromosome 27 (Chr27: 5,963,734–6,119,680) was strongly associated with AFP and included nine significant SNPs with AFP, which were annotated on IGF2BP1, ZNF652, GIP, UBE2Z, and ETV4, respectively. The most significant SNP (rs312351828) accounted for 5.35% of the observed phenotypic variance. Taken together, all of the SNPs that reached the GWAS threshold explain 3.34−5.58% of the observed phenotypic variance.

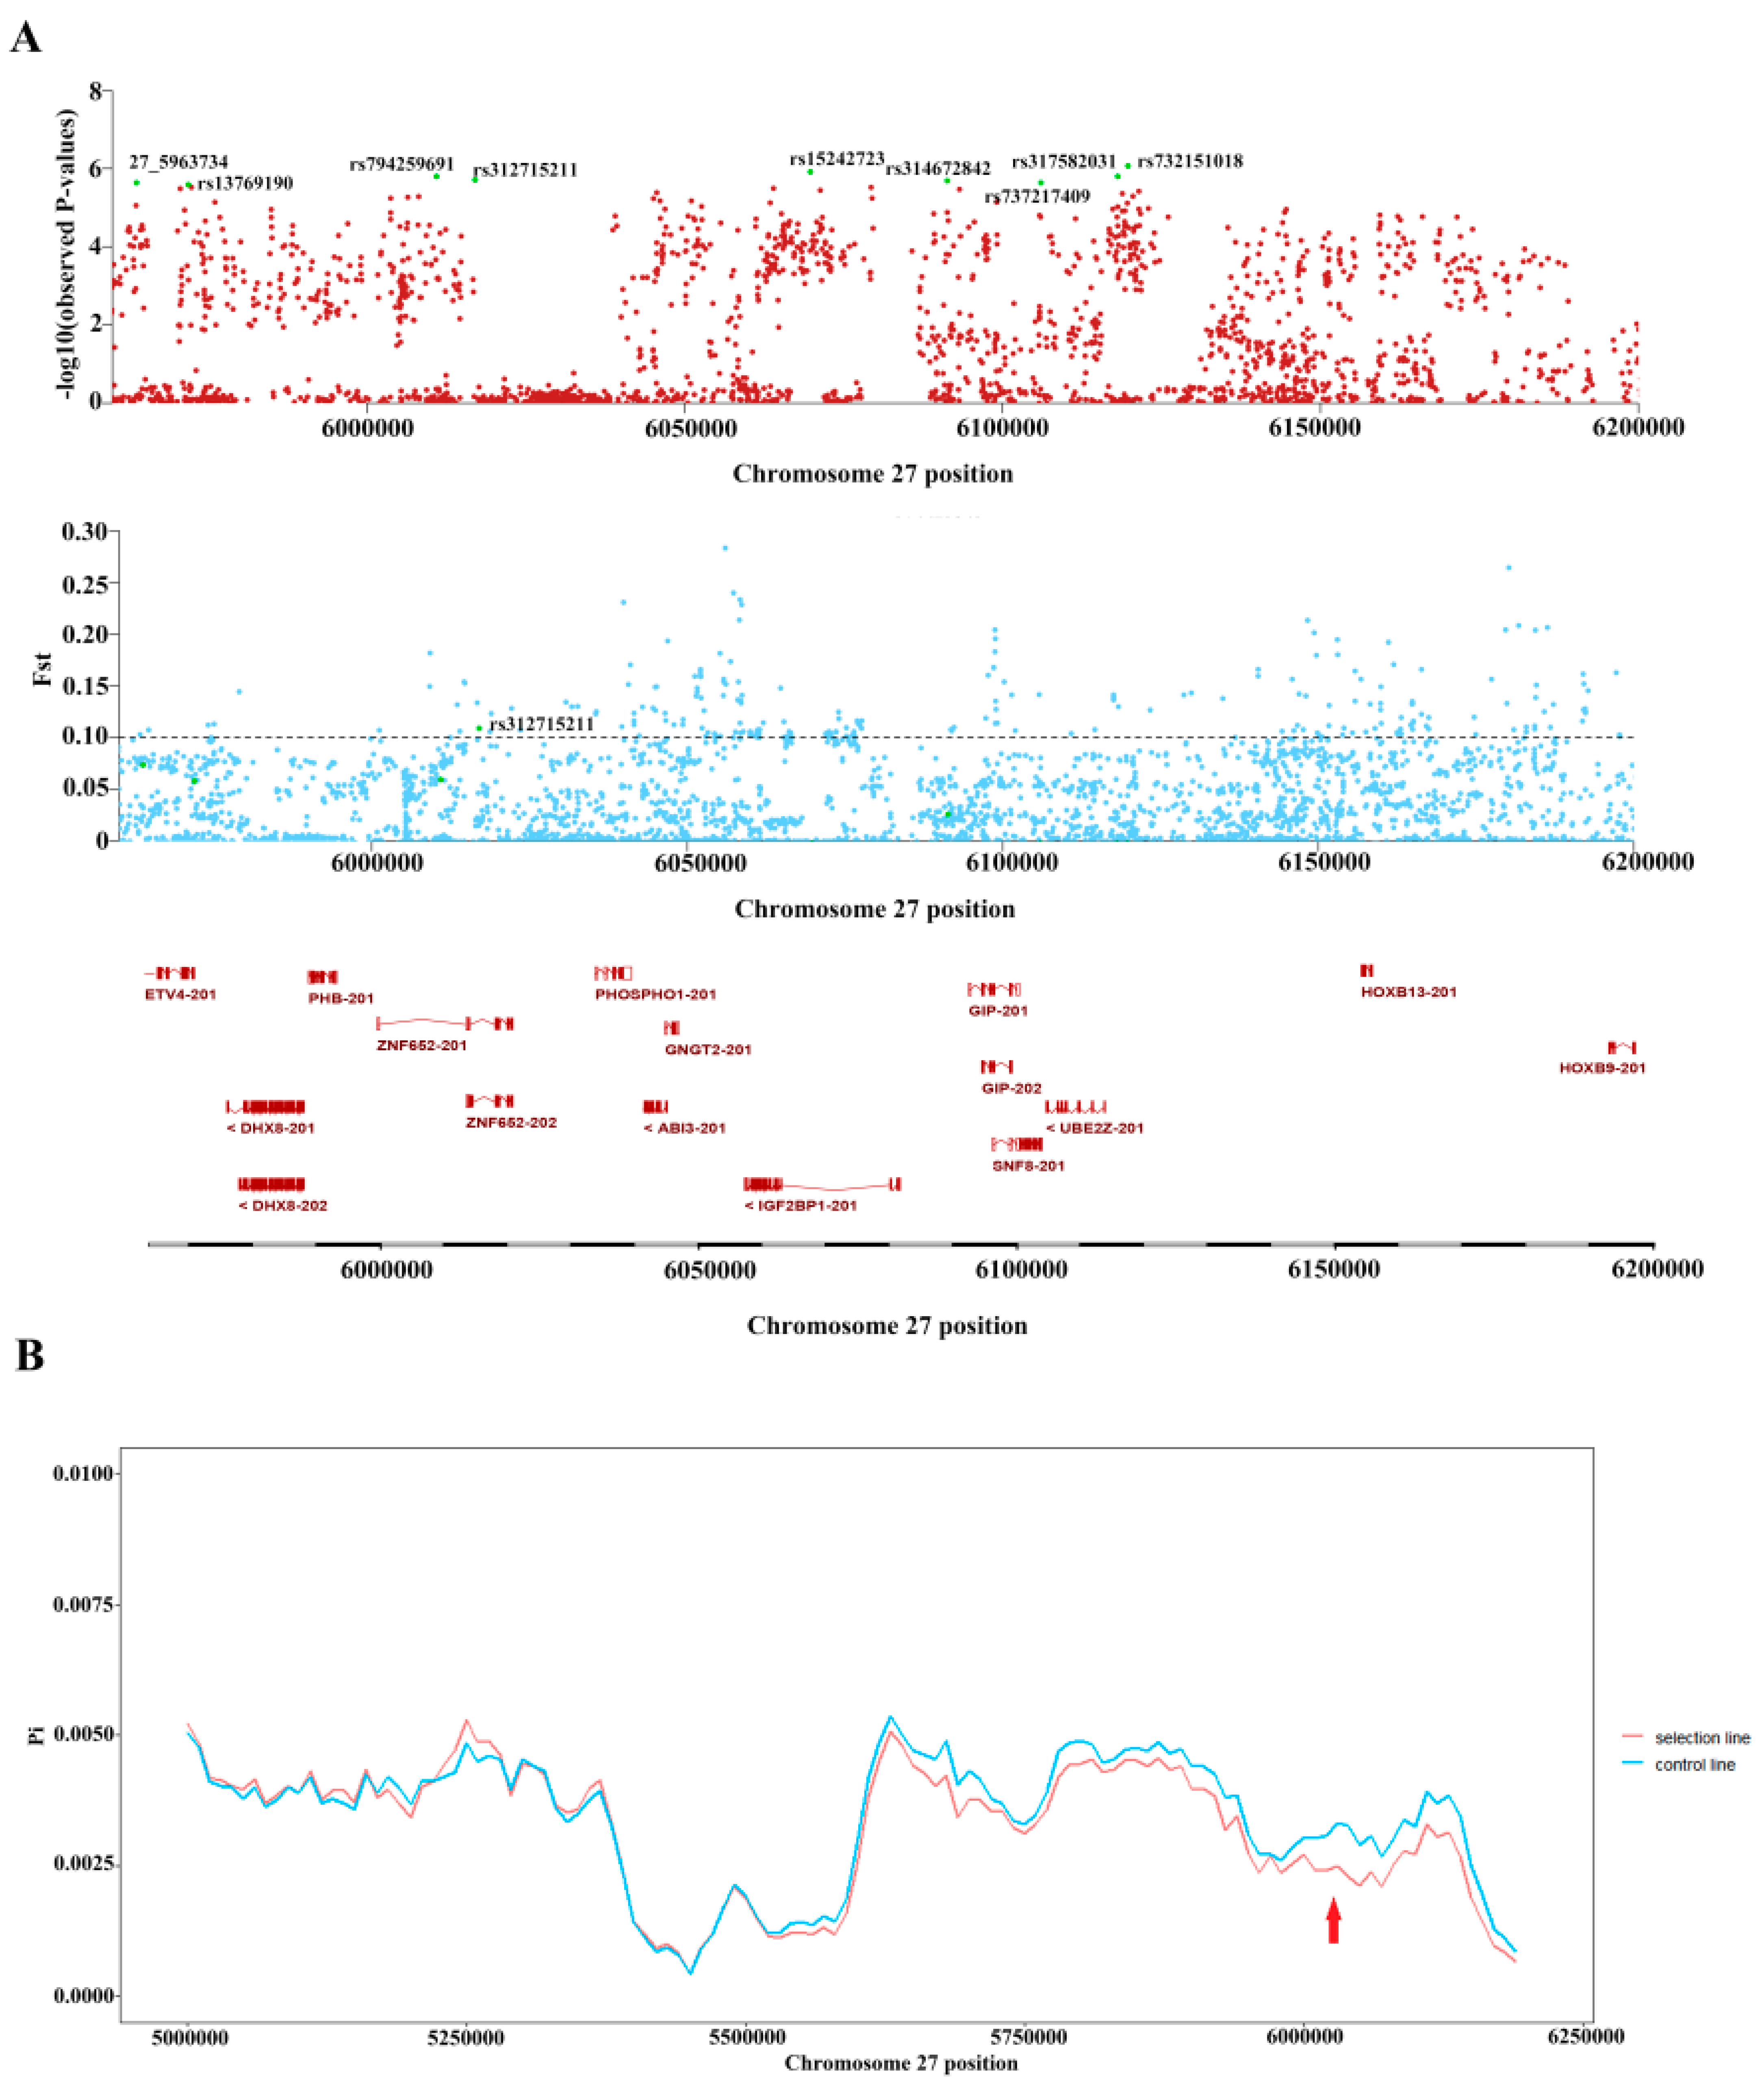
3.3. rs312715211 in the Intron Region of ZNF652 Was the Primary Variant Associated with AFP

To further identify candidate SNPs and genes, the FST and π values of all SNPs located on chromosome 1, 14, and the candidate region (Chr27: 5,963,734–6,119,680) were calculated. FST is calculated with a single SNP as the step size, and the FST threshold was 0.1. These data are summarized in Figure 3 and Figure 4. FST analysis showed that SNPs reaching the GWAS threshold line on chromosomes 1, 4, and 14 were not selected (Figure 3).
On chromosome 27, FST analysis showed that 159 SNPs in the target region were selected (Figure 4 and Table S1), and this region included the ZNF652, IGF2BP1, ETV4, DHX8, GIP, PHOSPHO1, SNF8, ABI3, and UBE2Z genes. However, only rs312715211 reached the threshold for GWAS and FST (Figure 4A). We calculated the π values in this region, in order to confirm whether the candidate sites were selected. The π values represent nucleotide polymorphisms, which decreased after selection; therefore, the π value was less in the selection than in the control line (Figure 4B). The results show that the two populations were strongly selected near the location of chr27:6,000,000, and rs312715211 was in this region. We have calculated the single point π value of rs312715211, as shown in Table 3. Taking all the results together, rs312715211, located on intron2 of ZNF652, reaches the thresholds of GWAS, FST, and π; therefore, it can be considered a key variant associated with AFP.

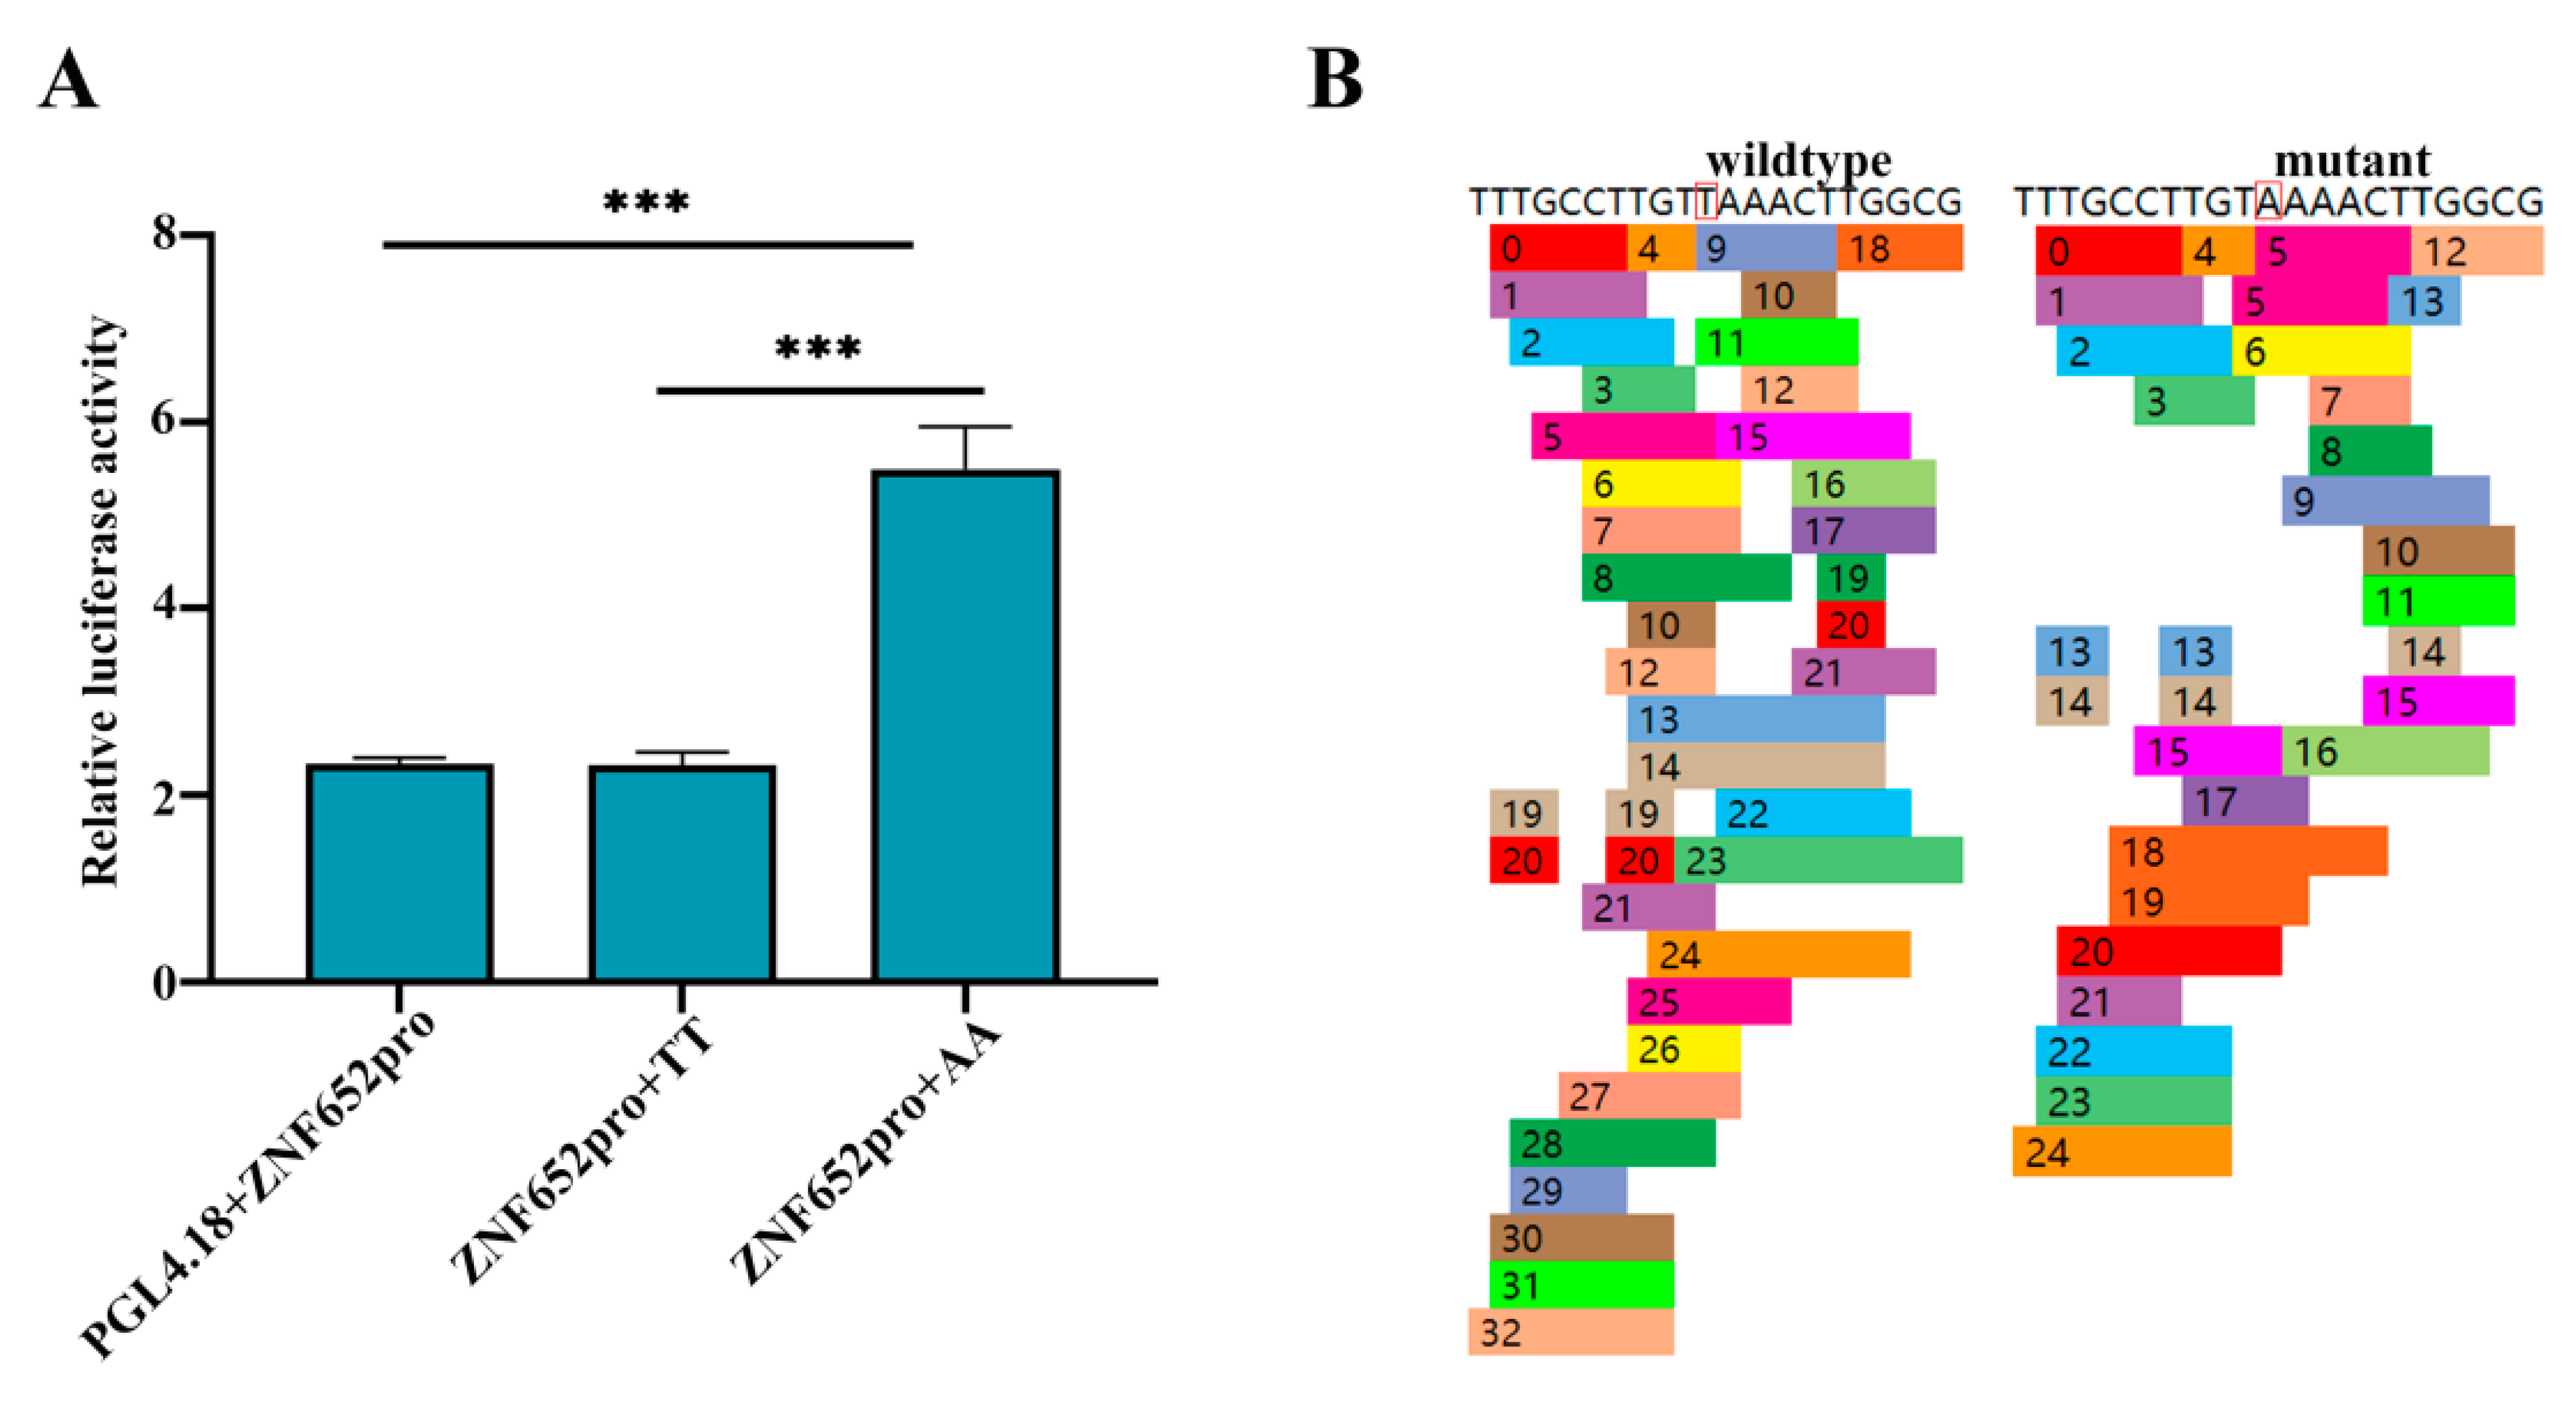
3.4. rs312715211 Can Affect the Activity of ZNF652 Promoter

We speculated that rs312715211 affects the expression of ZNF652, so a double-luciferase validation was performed to verify the regulation of rs312715211 on expression of ZNF652. Then, PGL4.18/ZNF652pro/TT/AA dual-luciferase plasmids were transferred into 293T cells. When rs312715211 was wild genotype (TT), ZNF652 promoter activity was not changed (Figure 5A). rs312715211 significantly increased the activity of the ZNF652 promoter, when the rs312715211 wild genotype TT was mutated to AA. The binding of transcription factors, meanwhile, was predicted using the PROMO online website after the rs312715211 mutation and wild-type. We found that most transcription factors were changed after mutation at this site (Figure 5B), which may affect gene expression. The results show that the rs312715211 region not only acts as an enhancer, but may be the transcription factor’s binding region.

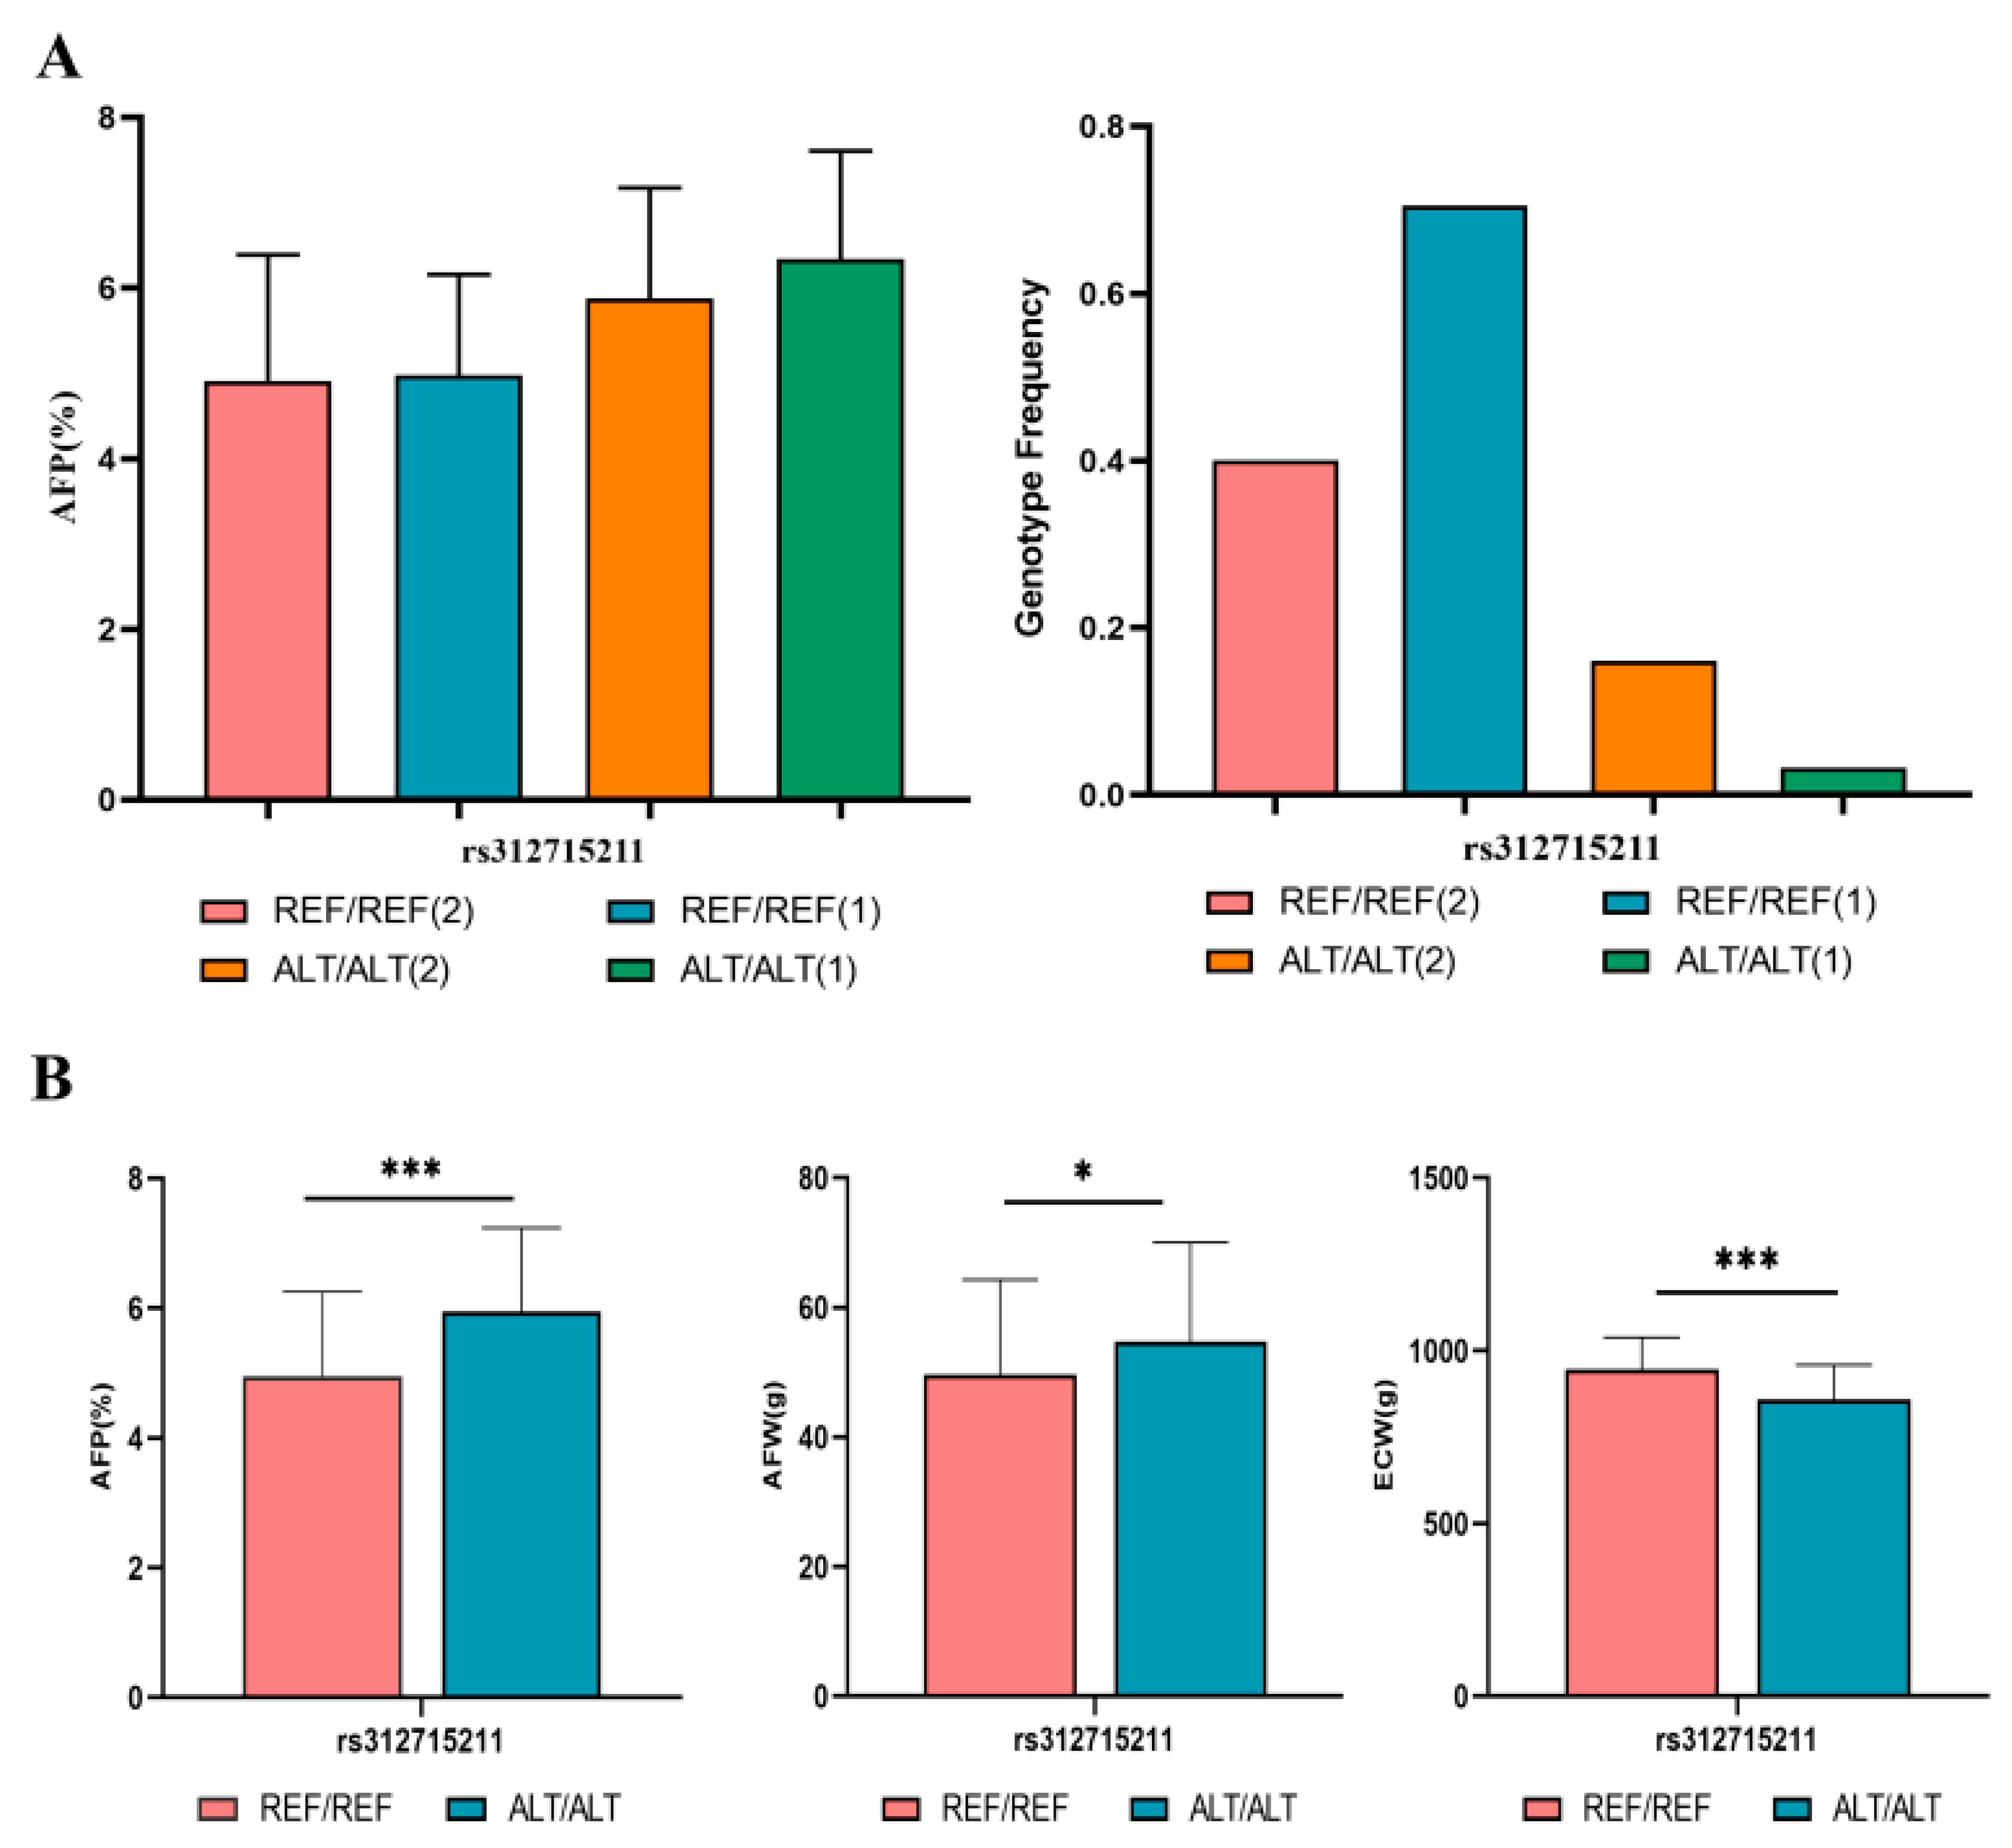
3.5. rs312715211 Mutation Can Increase AFP and AFW and Decrease ECW

AFP consists of AFW and ECW. We compared the genotype frequency and phenotype (AFP, AFW, and ECW) of individuals carrying wild or mutant genotypes of rs312715211 SNP. According to these results, rs312715211 caused significant differences in the AFP, AFW, and ECW phenotypes between the selected and control lines. We also confirmed that rs312715211 can increase AFW and reduce ECW, thereby affecting AFP (Figure 6B). Both the genotype frequency and the phenotype associated with this SNP changed significantly after selection. The frequency of rs312715211 in the wild genotype increased after selection, as did AFP. The frequency of rs312715211 in the mutant genotype decreased after selection, while AFP increased (Figure 6A).

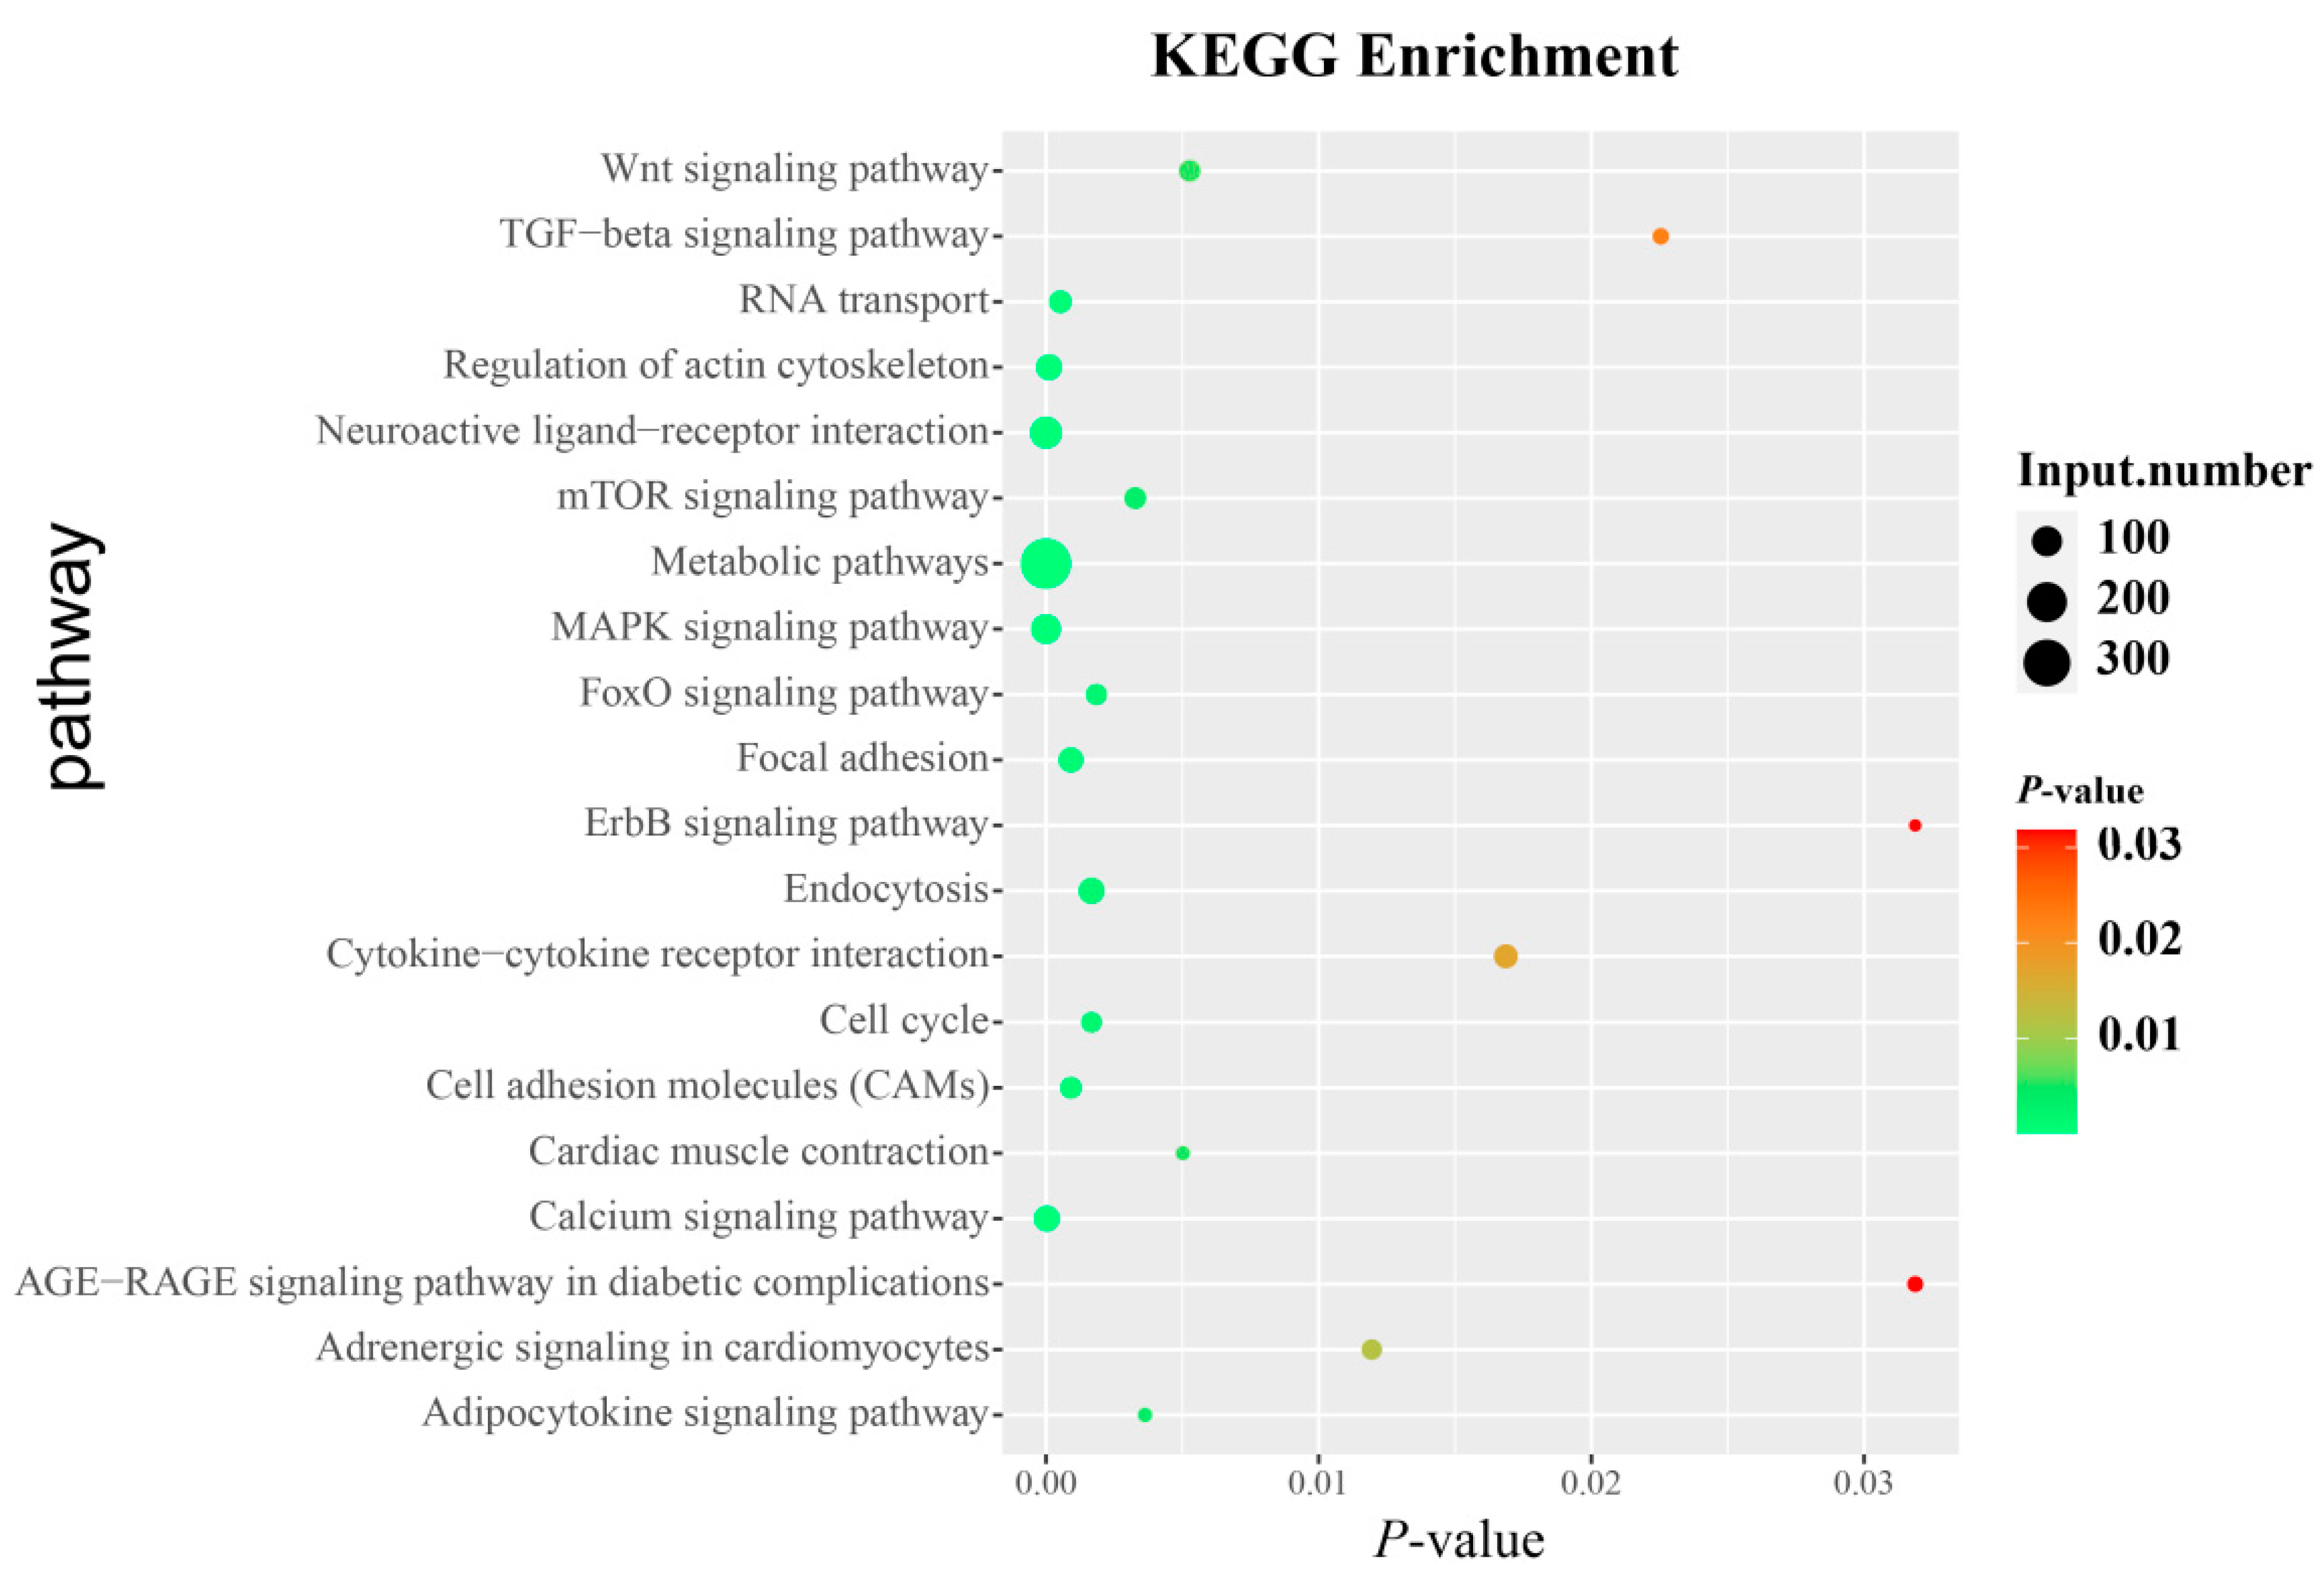
3.6. Identification of Candidate Genes and Pathways Related to AFP

To identify the candidate genes and pathways related to AFP, we widened the field of investigation. The top 1% of SNPs associated with AFP were screened accordingly, based on the GWAS results, and a total of 4736 genes were annotated and subjected to KEGG pathway enrichment analysis. KEGG enrichment analysis indicated that 52 pathways were significantly enriched (p < 0.05) (Figure 7 and Table S2). Among them, the metabolic pathways, MAPK, neuroactive ligand-receptor interaction, and calcium signaling pathways were the most significant. Furthermore, some pathways related to fat or carbohydrate metabolism were significantly enriched, including PPAR, adipocytokine, glycerophospholipid metabolism, glycolysis/gluconeogenesis, and other glycan degradation signaling pathways. Unfortunately, ZNF652 was not enriched in the related pathways. However, studies have shown that TGFB1 and EGFR are the target genes of ZNF652 and can be directly recruited and bound [25]. We also found that EGFR and TGFB1 were the target genes of ZNF652 and significantly enriched in 13 pathways (p < 0.05) (Table 4). Among these pathways, EGFR and TGFB1 were simultaneously enriched in the MAPK and FoxO signaling pathways.

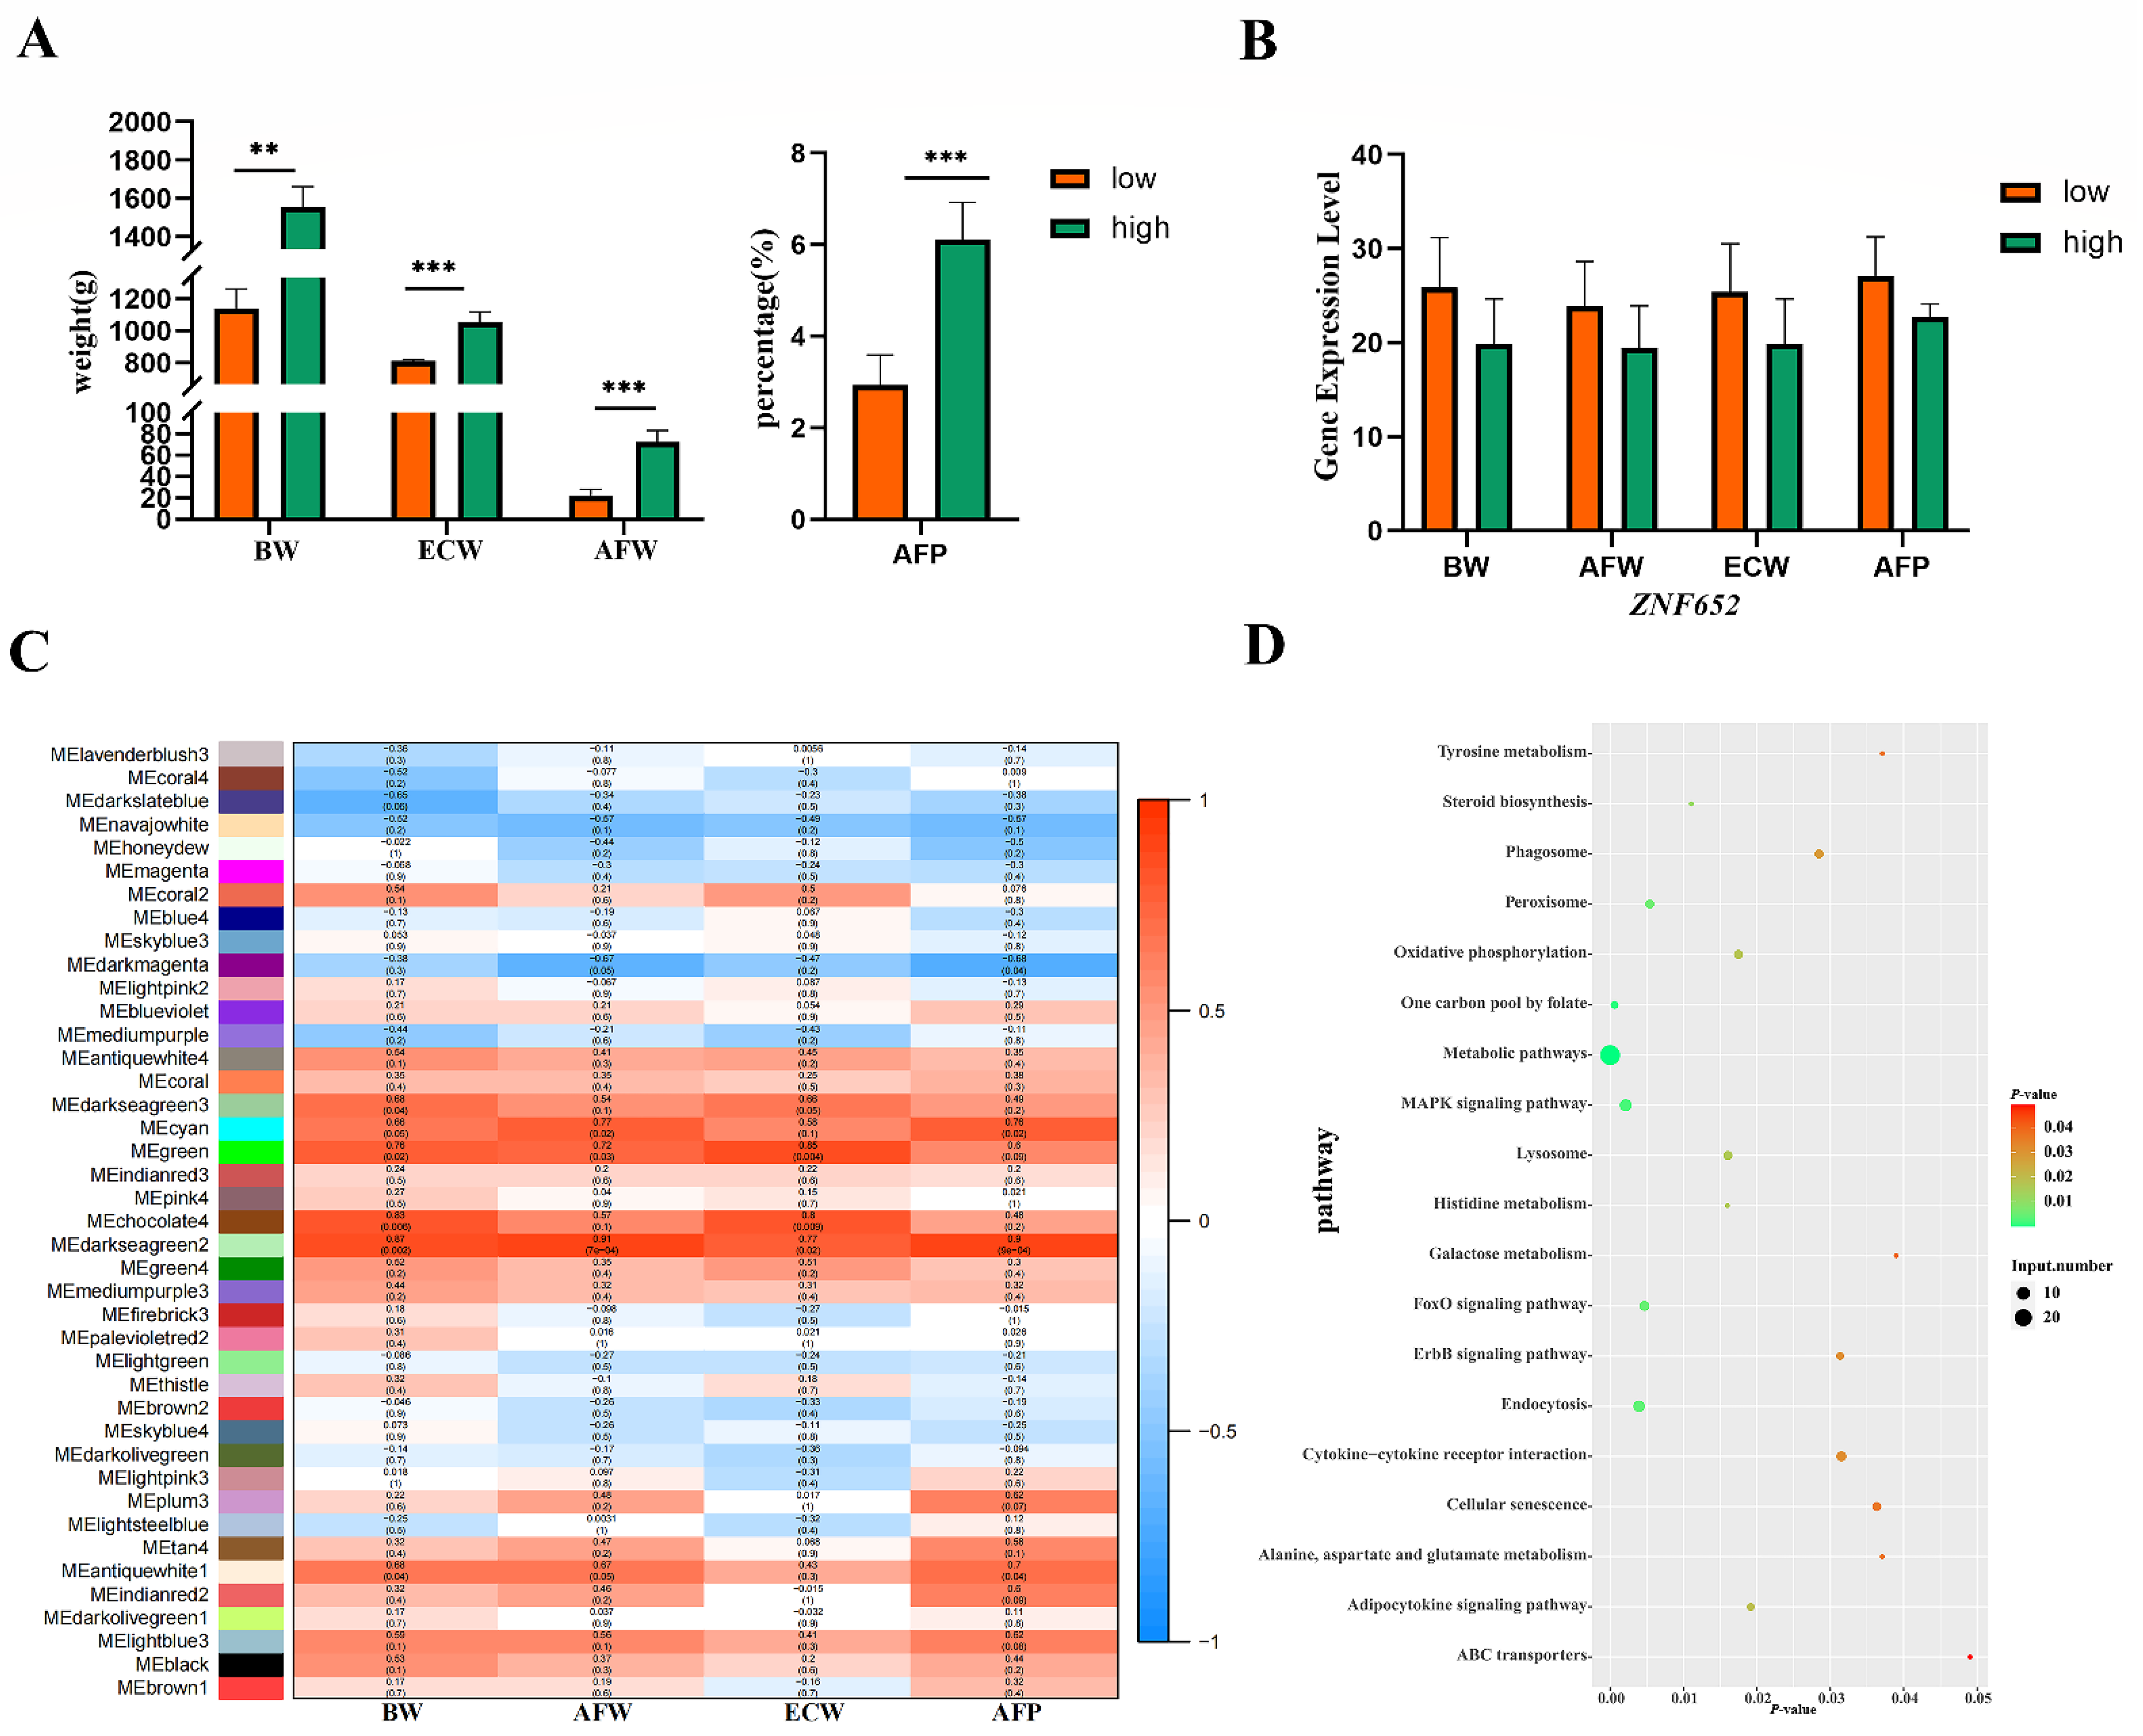
3.7. ZNF652 May Regulate Abdominal Fat and BW through MAPK/FoxO Signaling Pathways

To verify the above results, WGCNA was performed on the transcriptomes of the high and low AFP chickens. We found that ZNF652 was expressed less in high AFP group than in the AFP low group, consistent with the dual-luciferase result (Figure 8A,B). We also found that AFP, AFW, BW, and ECW were simultaneously mapped in a significant module (darkseagreen2) (p < 0.05) (Figure 8C). Although ZNF652 was not enriched in this significant module, it was co-expressed with classic lipid metabolism genes, such as LIPN1, LIPN2, GATA3, PPARG, DGKQ, and DGKE. Another KEGG analysis was performed on the enriched genes in the significant module, and a total of 19 significantly pathways were enriched (p < 0.05). Of these, the MAPK and FoxO signaling pathways were consistent with our above results (Figure 8D). In conclusion, we speculate that ZNF652, similar to the lipid metabolism genes, plays an important role in fatty acid degradation and may intervene in the MAPK and FoxO signaling pathways by binding with target genes, thus affecting body weight by decreasing AFP and AFW.

4. Discussion

Excessive abdominal fat in broilers not only reduces reproductive performance and causes metabolic diseases, but also reduces meat quality [26,27]. An increasing number of researchers are focusing on the genetic mechanisms underlying abdominal fat deposition. In this study, the heritability of AFP was 0.64, similar to the results reported by Demeure, Duclos et al. [7] and Chabault, Baéza et al. [6].
With the application of GWAS and selection signals, AFP in chickens has been fully utilized and SNPs and QTLs associated with abdominal fat have been identified [28]. According to the database, 292 QTLs and numerous SNPs were located in abdominal fat traits [2]. These QTLs and SNPs were verified in several broiler breeds and were significantly associated with fat deposition [29,30]. We attempted to identify the major genetic markers related to abdominal fat and growth traits in broilers. GWAS, FST, and π analysis identified one significant SNPs on chromosome 27, and the SNP differed significantly between wild and mutant individuals in phenotype (p < 0.05). This is consistent with Zhang [3] and suggests that the SNPs are important genetic markers for reducing abdominal fat deposition in broilers.
As a result, rs312715211 conformed with our expectation. The SNP was mapped to ZNF652 and may simultaneously regulate abdominal fat deposition and growth development in chickens. rs12715211 can increase AFP, AFW, and BW in broilers after mutant. After selection, AFW significantly increased and BW significantly decreased. Moreover, rs312715211 significantly increased ZNF652 promoter activity after mutant. In order to improve chicken breeding and increase its economic benefits, we should select wild homozygous individuals from rs312715211 for breeding and eliminate mutant homozygous individuals, so as to achieve increased body weight and reduce abdominal fat.
In the target region, ZNF652 and IGF2BP1 may be important for the control of abdominal fat deposition in broilers. IGF2BP1 (insulin-like growth factor 2 mRNA-binding protein 1) can bind IGF2 mRNA and is a member of the single-stranded RNA-binding protein family [31]. IGF2BP1 can function by affecting cell proliferation, migration, and apoptosis [32]. IGF2BP1 knockout mice can reduce Ramp3 mRNA expression; thus, IGF2BP1 indirectly affects glucose and lipid metabolism [33]. In chicken pan-genomic studies, a high expression of IGF2BP1 lead to high weight [34]. IGF2BP1 can increase body weight and affects feed efficiency in ducks [35], promotes adipocyte proliferation and differentiation, and regulates expression of genes related to fatty acid metabolism in broilers [36]. IGF2BP1 is also associated with tumors, cancer, dwarfism, and other diseases, but its mechanism of fat regulation requires further study.
ZNF652 is the classical C2H2 zinc finger DNA binding protein [37] and an inhibitor of gene transcription and plays a primary role in tumor invasion [25]. ZNF652 may be involved in human lipid and carbohydrate metabolism, e.g., sex hormone binding globulin (SHBG) [38] and may be related to body weight and bone growth [39,40]. However, its fat and growth regulatory mechanism in chickens is not currently known. It has been reported that the inhibition of ZNF652 can increase the expression of EGFR and TGFB1, and EGFR can regulate fat deposition by regulating fatty acid synthase [38,41]. The inhibition of EGFR expression can significantly reduce BW and subcutaneous and abdominal fat mass in mice, and more importantly, SREBP-1 and FASN expression decreased after EGFR inhibition [42]. EGFR is an epidermal growth factor receptor that regulates fat metabolism genes, especially PPAR, and the inhibition of EGFR can reduce the expression of adipose synthase [41]. TGFB1 (transforming growth factor β) [43] can bond with the SMAD family. Our studies showed that AFW and BW decreased after ZNF652 expression increased, consistent with the results after EGFR inhibition. Previous reports suggest the inhibition of the TGFB1 gene by PPARG activation, and PPARG can inhibit cell proliferation through the TGF-β1/Smad2/3 signaling pathways [44]. Therefore, we hypothesized that the effect of ZNF652 was associated with EGFR, TGFB, and PPARG by targeting the TGF-β1/SMad2/3 signaling pathways and MAPK/FoxO signaling pathways, resulting in reduced proliferation of adipocytes and accelerated fatty acid oxidation.

5. Conclusions

Our findings elucidated the genetic basis of chicken AFP. rs312715211 in the ZNF652 gene is the key variant associated with AFP of chickens, and the wild genotype is the favorable genotype to lower AFW and heighten BW. Additionally, ZNF652 is the key gene related to AFP by affecting BW and AFW. These data provide a new insight into our understanding of the genetic mechanisms underlying abdominal fat deposition in chickens and will aid in the breeding of broilers with lower AFP. In the future, the further study of these genetic variations may be applied in marker-assisted selection to reduce abdominal fat deposition in broilers.

Supplementary Materials

The following supporting information can be downloaded at: https://www.mdpi.com/article/10.3390/biology11121849/s1, Table S1: Reach the FST threshold line of SNPs, Table S2: KEGG of top 1% gene pathway.

Author Contributions

Y.Z. performed the study, analyzed the data, and drafted the manuscript. X.L. performed the study, analyzed the data. Y.W. (Yongli Wang)and L.L. performed the study. Y.W. (Yidong Wang) analyzed the data. J.W. and G.Z. contributed to the design of the study. H.C. contributed to the design of the study, analyzed the data, and modified the manuscript. All authors have read and agreed to the published version of the manuscript.

Funding

This research was funded by grants from the National Natural Science Foundation of China (32172723), the State Key Laboratory of Animal Nutrition (2004DA125184G2109), the Agricultural Science and Technology Innovation Program (ASTIP-IAS04), and the Earmarked Fund for Modern Agro-Industry Technology Research System (CARS-41).

Institutional Review Board Statement

The collection of blood samples at our institute and the determination of various indicators were performed in accordance with the experimental animal guidelines formulated by the Ministry of Agriculture (Beijing). This experiment was approved by the Animal Management Committee of the Institute of Animal Science, Chinese Academy of Agricultural Sciences (IAS-CAAS, Beijing, China) and the IAS-CAAS Animal Ethics Committee, which also provided a certificate of ethical approval for the experiment (permit No. IAS2019-21).

Informed Consent Statement

Not applicable.

Data Availability Statement

The whole-genome resequencing datasets generated in this study were submitted to https://bigd.big.ac.cn/gsa (accessed on 10 July 2022), with IDs CRA002643 and CRA00265. The RNA-resequencing datasets of this study have been deposited at https://bigd.big.ac.cn/gsa/, accessed on 10 July 2022, (accession data code CRA006031).

Conflicts of Interest

The authors declare that they have no competing interests.

Abbreviations

AFWAbdominal fat weight
AFPAbdominal fat percentage
ECWEviscerated carcass weight
IMFIntramuscular fat
GWASGenome-wide association study
LMMLinear mixed model
PCAPrincipal component analysis
LDLinkage disequilibrium
SNPSingle nucleotide polymorphism
FST Fixation indices
Heterozygosityπ
WGCNARNA-seq and weighted gene correlation network analysis
KEGGKyoto Encyclopedia of Genes and Genomes

References

  1. Zerehdaran, S.A.L.J.; Vereijken, A.J.; Van Arendonk, J.A.M.; Van der Waaijt, E.H. Estimation of genetic parameters for fat deposition and carcass traits in broilers. Poult Sci. 2004, 83, 521–525. [Google Scholar] [CrossRef] [PubMed]
  2. Moreira, G.C.M.; Godoy, T.F.; Boschiero, C.; Gheyas, A.; Gasparin, G.; Andrade, S.C.S.; Paduan, M.; Montenegro, H.; Burt, D.W.; Ledur, M.C.; et al. Variant discovery in a QTL region on chromosome 3 associated with fatness in chickens. Anim. Genet. 2015, 46, 141–147. [Google Scholar] [CrossRef] [PubMed]
  3. Zhang, K.; Cheng, B.H.; Yang, L.L.; Wang, Z.P.; Zhang, H.L.; Xu, S.S.; Wang, S.Z.; Wang, Y.X.; Zhang, H.; Li, H. Identification of a potential functional single nucleotide polymorphism for fatness and growth traits in the 3′-untranslated region of the PCSK1 gene in chickens. J. Anim. Sci. 2017, 95, 4776–4786. [Google Scholar] [CrossRef] [PubMed] [Green Version]
  4. Chao, X.; Guo, L.; Wang, Q.; Huang, W.; Liu, M.; Luan, K.; Jiang, J.; Lin, S.; Nie, Q.; Luo, W.; et al. miR-429-3p/LPIN1 axis promotes chicken abdominal fat deposition via PPARγ pathway. Front. Cell Dev. Biol. 2020, 8, 595637. [Google Scholar] [CrossRef]
  5. Huang, H.Y.; Liu, R.R.; Zhao, G.P.; Li, Q.H.; Zheng, M.Q.; Zhang, J.J.; Li, S.F.; Liang, Z.; Wen, J. Integrated analysis of microRNA and mRNA expression profiles in abdominal adipose tissues in chickens. Sci. Rep. 2015, 5, 16132. [Google Scholar] [CrossRef] [PubMed]
  6. Chabault, M.; Baéza, E.; Gigaud, V.; Chartrin, P.; Chapuis, H.; Boulay, M.; Arnould, C.; D’Abbadie, F.; Berri, C.; Bihan-Duval, L. Analysis of a slow-growing line reveals wide genetic variability of carcass and meat quality-related traits. BMC Genet. 2012, 13, 90. [Google Scholar] [CrossRef] [Green Version]
  7. Demeure, O.; Duclos, M.J.; Bacciu, N.; Le Mignon, G.; Filangi, O.; Pitel, F.; Boland, A.; Lagarrigue, S.; Cogburn, L.A.; Simon, J.; et al. Genome-wide interval mapping using SNPs identifies new QTL for growth, body composition and several physiological variables in an F2 intercross between fat and lean chicken lines. Genet. Sel. Evol. 2013, 45, 36. [Google Scholar] [CrossRef] [Green Version]
  8. Leenstra, F.R.; Pit, R. Fat deposition in a broiler sire strain. 4. Performance of broiler progeny of four differently selected sire lines. Poult. Sci. 1988, 67, 10–15. [Google Scholar] [CrossRef]
  9. Baéza, E.; Le Bihan-Duval, E. Chicken lines divergent for low or high abdominal fat deposition: A relevant model to study the regulation of energy metabolism. Animal 2013, 7, 965–973. [Google Scholar] [CrossRef] [Green Version]
  10. Leng, L.; Zhang, H.; Dong, J.Q.; Wang, Z.P.; Zhang, X.Y.; Wang, S.Z.; Cao, Z.P.; Li, Y.M.; Li, H. Selection against abdominal fat percentage may increase intramuscular fat content in broilers. J. Anim. Breed Genet. 2016, 133, 422–428. [Google Scholar] [CrossRef]
  11. Chen, C.; Su, Z.; Li, Y.; Luan, P.; Wang, S.; Zhang, H.; Xiao, F.; Guo, H.; Cao, Z.; Li, H.; et al. Estimation of the genetic parameters of traits relevant to feed efficiency: Result from broiler lines divergent for high or low abdominal fat content. Poult. Sci. 2021, 100, 461–466. [Google Scholar] [CrossRef]
  12. Wang, J.; Zhu, B.; Wen, J.; Li, Q.; Zhao, G. Genome-Wide Association Study and Pathway Analysis for Heterophil/Lymphocyte (H/L) Ratio in Chicken. Genes 2020, 11, 1005. [Google Scholar] [CrossRef] [PubMed]
  13. Hu, G.; Wang, S.; Tian, J.; Chu, L.; Li, H. Epistatic effect between ACACA and FABP2 gene on abdominal fat traits in broilers. J Genet. Genom. 2010, 37, 505–512. [Google Scholar] [CrossRef] [PubMed]
  14. Liu, X.; Li, H.; Wang, S.; Hu, X.; Gao, Y.; Wang, Q.; Li, N.; Wang, Y.; Zhang, H. Mapping quantitative trait loci affecting body weight and abdominal fat weight on chicken chromosome one. Poult Sci. 2007, 86, 1084–1089. [Google Scholar] [CrossRef] [PubMed]
  15. Zhao, G.P.; Chen, J.L.; Zheng, M.Q.; Wen, J.; Zhang, Y. Correlated responses to selection for increased intramuscular fat in a Chinese quality chicken line. Poult Sci. 2007, 86, 2309–2314. [Google Scholar] [CrossRef] [PubMed]
  16. Jiang, M.; Fan, W.L.; Xing, S.Y.; Wang, J.; Li, P.; Liu, R.R.; Li, Q.H.; Zheng, M.Q.; Cui, H.X.; Wen, J.; et al. Effects of balanced selection for intramuscular fat and abdominal fat percentage and estimates of genetic parameters. Poult Sci. 2017, 96, 282–287. [Google Scholar] [CrossRef] [PubMed]
  17. Liu, X.; Liu, L.; Wang, J.; Cui, H.; Chu, H.; Bi, H.; Zhao, G.; Wen, J. Genome-wide association study of muscle glycogen in jingxing yellow chicken. Genes 2020, 11, 497. [Google Scholar] [CrossRef]
  18. Browning, S.R.; Browning, B.L. Rapid and accurate haplotype phasing and missing-data inference for whole-genome association studies by use of localized haplotype clustering. Am. J. Hum. Genet. 2007, 81, 1084–1097. [Google Scholar] [CrossRef] [PubMed] [Green Version]
  19. Zhou, X.; Stephens, M. Genome-wide efficient mixed-model analysis for association studies. Nat Genet. 2012, 44, 821–824. [Google Scholar] [CrossRef] [PubMed] [Green Version]
  20. Nicodemus, K.K.; Liu, W.; Chase, G.A.; Tsai, Y.Y.; Fallin, M.D. Comparison of type I error for multiple test corrections in large single-nucleotide polymorphism studies using principal components versus haplotype blocking algorithms. BMC Genet. 2005, 6 (Suppl. S1), S78. [Google Scholar] [CrossRef]
  21. Danecek, P.; Auton, A.; Abecasis, G.; Albers, C.A.; Banks, E.; DePristo, M.A.; Handsaker, R.E.; Lunter, G.; Marth, G.T.; Sherry, S.T.; et al. The variant call format and VCFtools. Bioinformatics 2011, 27, 2156–2158. [Google Scholar] [CrossRef] [PubMed]
  22. Luo, N.; Shu, J.; Yuan, X.; Jin, Y.; Cui, H.; Zhao, G.; Wen, J. Differential regulation of intramuscular fat and abdominal fat deposition in chickens. BMC Genom. 2022, 23, 308. [Google Scholar] [CrossRef] [PubMed]
  23. Kanehisa, M.; Goto, S. KEGG: Kyoto encyclopedia of genes and genomes. Nucleic Acids Res. 2000, 28, 27–30. [Google Scholar] [CrossRef]
  24. Shim, H.; Chasman, D.I.; Smith, J.D.; Mora, S.; Ridker, P.M.; Nickerson, D.A.; Krauss, R.M.; Stephens, M. A multivariate genome-wide association analysis of 10 LDL subfractions, and their response to statin treatment, in 1868 Caucasians. PLoS ONE 2015, 10, e0120758. [Google Scholar] [CrossRef] [PubMed] [Green Version]
  25. Neilsen, P.M.; Noll, J.E.; Mattiske, S.; Bracken, C.P.; Gregory, P.A.; Schulz, R.B.; Lim, S.P.; Kumar, R.; Suetani, R.J.; Goodall, G.J.; et al. Mutant p53 drives invasion in breast tumors through up-regulation of miR-155. Oncogene 2013, 32, 2992–3000. [Google Scholar] [CrossRef] [Green Version]
  26. Chen, J.H.; Ren, X.Y.; Li, L.M.; Lu, S.Y.; Cheng, T.; Tan, L.T.; Liang, S.D.; He, D.L.; Luo, Q.B.; Nie, Q.H.; et al. The cell cycle pathway regulates chicken abdominal fat deposition as revealed by transcriptome sequencing. Yi Chuan 2019, 41, 962–973. [Google Scholar]
  27. Wang, W.; Li, Y.; Li, Z.; Wang, N.; Xiao, F.; Gao, H.; Guo, H.; Li, H.; Wang, S. Polymorphisms of KLF3 gene coding region and identification of their functionality for abdominal fat in chickens. Vet. Med. Sci. 2021, 7, 792–799. [Google Scholar] [CrossRef]
  28. Moreira, G.C.M.; Boschiero, C.; Cesar, A.S.M.; Reecy, J.M.; Godoy, T.F.; Pértille, F.; Ledur, M.C.; Moura, A.S.A.M.T.; Garrick, D.J.; Coutinho, L.L. Integration of genome wide association studies and whole genome sequencing provides novel insights into fat deposition in chicken. Sci. Rep. 2018, 8, 16222. [Google Scholar] [CrossRef] [Green Version]
  29. Park, H.B.; Jacobsson, L.; Wahlberg, P.; Siegel, P.B.; Andersson, L. QTL analysis of body composition and metabolic traits in an intercross between chicken lines divergently selected for growth. Physiol. Genom. 2006, 25, 216–223. [Google Scholar] [CrossRef] [Green Version]
  30. Zhou, J.; Yang, L.; Yu, J.; Zhang, K.; Xu, Z.; Cao, Z.; Luan, P.; Li, H.; Zhang, H. Association of PCSK1 gene polymorphisms with abdominal fat content in broilers. Anim. Sci. J. 2020, 91, e13371. [Google Scholar] [CrossRef]
  31. Huang, X.; Zhang, H.; Guo, X.; Zhu, Z.; Cai, H.; Kong, X. Insulin-like growth factor 2 mRNA-binding protein 1 (IGF2BP1) in cancer. J. Hematol. Oncol. 2018, 11, 88. [Google Scholar] [CrossRef] [PubMed]
  32. Zhang, J.; Luo, W.; Chi, X.; Zhang, L.; Ren, Q.; Wang, H.; Zhang, W. IGF2BP1 silencing inhibits proliferation and induces apoptosis of high glucose-induced non-small cell lung cancer cells by regulating Netrin-1. Arch. Biochem. Biophys. 2020, 693, 108581. [Google Scholar] [CrossRef]
  33. Li, C.; Xu, J.J.; Hu, H.T.; Shi, C.Y.; Yu, C.J.; Sheng, J.Z.; Wu, Y.T.; Huang, H.F. Amylin receptor insensitivity impairs hypothalamic POMC neuron differentiation in the male offspring of maternal high-fat diet-fed mice. Mol. Metab. 2021, 44, 101135. [Google Scholar] [CrossRef] [PubMed]
  34. Wang, K.; Hu, H.; Tian, Y.; Li, J.; Scheben, A.; Zhang, C.; Li, Y.; Wu, J.; Yang, L.; Fan, X.; et al. The chicken pan-genome reveals gene content variation and a promoter region deletion in IGF2BP1 affecting body size. Mol. Biol. Evol. 2021, 38, 5066–5081. [Google Scholar] [CrossRef]
  35. Zhou, Z.; Li, M.; Cheng, H.; Fan, W.; Yuan, Z.; Gao, Q.; Xu, Y.; Guo, Z.; Zhang, Y.; Hu, J.; et al. An intercross population study reveals genes associated with body size and plumage color in ducks. Nat. Commun. 2018, 9, 2648. [Google Scholar] [CrossRef] [Green Version]
  36. Chen, J.; Ren, X.; Li, L.; Lu, S.; Chen, T.; Tan, L.; Liu, M.; Luo, Q.; Liang, S.; Nie, Q.; et al. Integrative analyses of mRNA expression profile reveal the involvement of IGF2BP1 in chicken adipogenesis. Int. J. Mol. Sci. 2019, 20, 2923. [Google Scholar] [CrossRef] [PubMed] [Green Version]
  37. Kumar, R.; Cheney, K.M.; Neilsen, P.M.; Schulz, R.B.; Callen, D.F. CBFA2T3-ZNF651, like CBFA2T3-ZNF652, functions as a transcriptional corepressor complex. FEBS Lett. 2010, 584, 859–864. [Google Scholar] [CrossRef]
  38. Coviello, A.D.; Haring, R.; Wellons, M.; Vaidya, D.; Lehtimäki, T.; Keildson, S.; Lunetta, K.L.; He, C.; Fornage, M.; Lagou, V.; et al. A genome-wide association meta-analysis of circulating sex hormone-binding globulin reveals multiple Loci implicated in sex steroid hormone regulation. PLoS Genet. 2012, 8, e1002805. [Google Scholar] [CrossRef] [Green Version]
  39. Wang, Y.; Bu, L.; Cao, X.; Qu, H.; Zhang, C.; Ren, J.; Huang, Z.; Zhao, Y.; Luo, C.; Hu, X.; et al. Genetic dissection of growth traits in a unique chicken advanced intercross line. Front Genet. 2020, 11, 894. [Google Scholar] [CrossRef]
  40. Li, Y.D.; Liu, X.; Li, Z.W.; Wang, W.J.; Li, Y.M.; Cao, Z.P.; Luan, P.; Xiao, F.; Gao, H.H.; Guo, H.S.; et al. A combination of genome-wide association study and selection signature analysis dissects the genetic architecture underlying bone traits in chickens. Animal 2021, 15, 100322. [Google Scholar] [CrossRef]
  41. Bhushan, B.; Michalopoulos, G.K. Role of epidermal growth factor receptor in liver injury and lipid metabolism: Emerging new roles for an old receptor. Chem. Biol. Interact. 2020, 324, 109090. [Google Scholar] [CrossRef]
  42. Choung, S.; Kim, J.M.; Joung, K.H.; Lee, E.S.; Kim, H.J.; Ku, B.J. Epidermal growth factor receptor inhibition attenuates non-alcoholic fatty liver disease in diet-induced obese mice. PLoS ONE 2019, 14, e0210828. [Google Scholar] [CrossRef] [PubMed]
  43. Uluçay, S.; Çam, F.S.; Batır, M.B.; Sütçü, R.; Bayturan, Ö.; Demircan, K. A novel association between TGFb1 and ADAMTS4 in coronary artery disease: A new potential mechanism in the progression of atherosclerosis and diabetes. Anatol. J. Cardiol. 2015, 15, 823–829. [Google Scholar] [CrossRef] [PubMed]
  44. Pan, K.; Lu, J.; Song, Y. Artesunate ameliorates cigarette smoke-induced airway remodelling via PPAR-γ/TGF-β1/Smad2/3 signalling pathway. Respir Res. 2021, 22, 91. [Google Scholar] [CrossRef] [PubMed]
Figure 1. Genetic parameters and phenotypes. The upper triangle is phenotypic correlation coefficient (SD, standard error), the lower triangle is genetic correlation coefficient (SD, standard error), and the diagonal is heritability (SD, standard error).
Biology 11 01849 g001
Figure 2. Manhattan plot of the genome-wide association study of abdominal fat percentage. The Manhattan plot indicates −log10 (observed p−values, y−axis) for genome-wide SNPs plotted against their respective locations on the genome. The horizontal red lines indicate the suggestive significant (2.64 × 10⁻⁶) thresholds.
Biology 11 01849 g002
Figure 3. Locations of the candidate SNPs on chromosomes 1 and 14. (A) FST of chromosome 1. (B) FST of chromosome 4. (C) FST of chromosome 14. Green represents significant SNPs located by genome-wide association study (GWAS), FST threshold line: 0.1.
Biology 11 01849 g003
Figure 4. Locations of the candidate regions FST and π. (A) Localized genome−wide association study (GWAS) and FST. Green represents significant SNPs located by GWAS (Chr27: 5,963,734–6,119,680). Only rs312715211 reached the FST threshold line. (B) Single nucleotide polymorphisms (π-values) in significant regions.
Biology 11 01849 g004
Figure 5. rs312715211 can regulate ZNF652 promoter activity. (A) Fluorescence intensity of dual-luciferase, ZNF652 promoter activity was significantly increased after site mutation, *** p < 0.001. (B) Prediction of wildtype and mutant transcription factors. All of the transcription factors were changed after rs312715211 mutated to AA.
Biology 11 01849 g005
Figure 6. Genotype frequency and phenotype change of rs312715211 between the selected line and control line. (A) Phenotype and genotype frequency of candidate SNPs in the (1) selection line: 252, (2) control line: 268. (B) Candidate SNP phenotypes abdominal fat percentage (AFP), abdominal fat weight (AFW), and eviscerated carcass weight (ECW) in wild and mutant lines. AFP, AFW, and ECW were significantly increased after rs312715211 mutation, * p < 0.05, *** p < 0.001.
Biology 11 01849 g006
Figure 7. Kyoto Encyclopedia of Genes and Genomes (KEGG) analyses of annotated genes at the top 1% SNPs. The picture shows 20 KEGG pathways. Y represents the pathway, and X represents the rich factor. Size and color of the bubble represent the amounts of differentially expressed genes enriched in the pathway and the enrichment significance, respectively. The top 1% of SNPs were derived from the results of the genome-wide association study, and the analyzed individuals contained selection line: 252, control line: 268.
Biology 11 01849 g007
Figure 8. Expression levels of ZNF625 in high and low abdominal fat percentage (AFP) groups. (A) Phenotypes of the high and low AFP groups, ** p < 0.01, *** p < 0.001. (B) ZNF652 expression levels in the high and low AFP groups. (C) Heatmap showing module-trait associations. Each cell contains the corresponding correlation and p-value in parentheses. Red and blue colors represent positive and negative correlations. (D) Kyoto Encyclopedia of Genes and Genomes analyses of significantly module (darkseagreen2).
Biology 11 01849 g008
Table 1. Descriptive AFP, AFW, ECW statistics at different lines.
TraitGroupNMean (SD)CV (%)MinMaxp-Value
IMF(g)control line2521.84 ± 0.5629.930.473.52<0.0001
selection line2682.15 ± 0.6430.540.744.61
TG(mg/g)control line2523.51 ± 0.8528.491.656.08<0.0001
selection line2683.92 ± 1.1224.241.738.60
AFP (%)control line2525.21 ± 1.2824.501.638.810.7453
selection line2685.30 ± 1.2623.792.098.37
AFW (g)control line25248.94 ± 14.2629.148.6092.70<0.0001
selection line26854.77 ± 14.9627.3118.2096.30
ECW (g)control line252882.08 ± 86.679.83684.21091<0.0001
selection line268973.66 ± 84.948.72740.41206.4
N, number of samples. SD, standard deviation. CV, coefficient of variance.
Table 2. Summary of SNPs that reached the suggestive significance threshold on the genome.
SNPCHRPositionALT/REFMAFβ (SE) 1p-ValuePVEDistance 2Gene
rs316720008143,577,050C/T0.203−0.6383165(0.1291873)0.000001854.13%intron2lncRNA
rs3123518281116,670,617T/C0.126−0.8267067(0.1729973)0.00000075.35%intron29DMD
rs3173248921117,928,954A/T0.0650.4439148(0.09234324)0.000001244.89%intron9IL1RAPL1
1_1257755711125,775,571G/C0.1170.5044212(0.1054399)0.000001963.77%D51254ARHGAP6
rs3137559221158,194,105C/G0.4340.5432101(0.1122472)0.0000008424.22%intron1DACH1
rs312621600482,213,271A/G0.2−0.5663142(0.1179772)0.000002194.13%U1957GRK4
rs316613317148,850,467G/C0.231−0.5989047(0.1222303)0.000002444.35%intron7SYT17
27_5963734275,963,734G/A0.279−0.5798911(0.1171215)0.00000233.73%intron2ETV4
rs13769190275,971,903T/C0.19−0.5848534(0.1187516)0.000002585.41%D582ETV4
rs794259691276,010,935C/T0.191−0.5642823(0.1175598)0.000001575.58%intron1ZNF652
rs312715211276,017,027A/T0.285−0.5775431(0.1196338)0.000001924.29%intron2ZNF652
rs15242723276,069,759A/G0.28−0.5986492(0.1190552)0.000001214.49%intron12IGF2BP1
rs314672842276,091,289G/A0.2160.4740275(0.09803836)0.000002034.06%intron2GIP
rs737217409276,106,019T/C0.240.507996(0.1029385)0.00000233.83%intron2UBE2Z
rs317582031276,118,076T/C0.2270.5165271(0.1051145)0.000001573.34%D4347UBE2Z
rs732151018276,119,680A/G0.2410.5115049(0.1063718)0.0000008564.04%D5951UBE2Z
1 SE values are reported in parentheses. 2 U = upstream, D = downstream.
Table 3. Candidate SNP and Gene.
SNPCHRPositionFST1 π (Group1)2 π (Group2)Gene
rs312715211276,017,0270.1089710.2729970.471467ZNF652
1 group1, selection line, 2 group2, control line.
Table 4. KEGG of pathway.
PathwayPathway CodeCorrected p-ValueGenes
MAPK signaling pathwaygga040100.000001450EGFR, TGFB1, PPP3CA, NGFR, etc.
Calcium signaling pathwaygga040200.000031000EGFR, MCU, PPP3CC, STIM1, etc.
Regulation of actin cytoskeletongga048100.000112941EGFR, CHRM5, MYLK2, MRAS, etc.
Focal adhesiongga045100.000916584EGFR, FYN, MYLK2, COL9A3, etc.
Adherens junctiongga045200.001264711EGFR, BAIAP2, PTPRM, PTPRJ, etc.
Endocytosisgga041440.001669978EGFR, RAB7A, GRK5, ZFYVE9, etc.
FoxO signaling pathwaygga040680.001849407TGFB1, EGFR, BCL6, CREBBP, etc.
Cytokine-cytokine receptor interactiongga040600.016863281TGFB1, IL5, EDAR, BMP7, etc.
TGF-beta signaling pathwaygga043500.022547651TGFB1, SMAD9, SMAD5, DCN, etc.
AGE-RAGE signaling pathway in diabetic complicationsgga049330.031877403TGFB1, COL4A1, AKT3, NOX1, etc.
ErbB signaling pathwaygga040120.031877403EGFR, GSK3B, PAK1, PAK3, etc.
Gap junctiongga045400.037408823EGFR, DRD2, ADCY9, CDK1, etc.
Publisher’s Note: MDPI stays neutral with regard to jurisdictional claims in published maps and institutional affiliations.

