Article

Application of Transformed Cross-Section Method for Analytical Analysis of Laminated Veneer Lumber Beams Strengthened with Composite Materials

by
Michał Marcin Bakalarz
* and
Paweł Grzegorz Kossakowski
Department of Structural Theory and BIM, Kielce University of Technology, 25-314 Kielce, Poland
*
Author to whom correspondence should be addressed.
Fibers 2023, 11(3), 24; https://doi.org/10.3390/fib11030024
Submission received: 10 January 2023 / Revised: 14 February 2023 / Accepted: 21 February 2023 / Published: 23 February 2023
(This article belongs to the Special Issue Carbon Fibers from Sustainable Precursors)

Abstract

:
Due to the high cost of laboratory testing, many researchers are considering developing methods to predict the behavior of unreinforced and reinforced wood beams. This work aims to create either numerical or analytical models useful for extrapolating already conducted tests to other schemes/materials used as reinforcement. In the case of timber structures, due to the complexity of timber, this task is difficult. The first part of the article presents an analysis of the suitability of using a simplified mathematical model based on the equivalent cross-section method to describe the behavior of unreinforced and reinforced with carbon-fibre-reinforced polymer (CFRP) composite full-size laminated veneer lumber (LVL) beams. The theoretical results were compared with the results of conducted experimental tests. The scope of the analysis includes the estimation of modulus of rupture, bending stiffness, and determination of the neutral axis position. The equivalent cross-section method showed good agreement in determining the bending stiffness and neutral axis position of the strengthened sections. However, the suitability of using the equivalent cross-section method to estimate the load-carrying capacity of a cross-section reinforced with fiber composites still needs to be confirmed, which, according to the authors, is due to the differences between the assumed (linear) and actual (nonlinear) strain distribution in the compression zone. The second part uses the equivalent cross-section method to estimate the predicted bending stiffness of LVL beams strengthened with aramid-fibre-reinforced polymer (AFRP), glass-fibre-reinforced polymer (GFRP), and ultra-high modulus carbon-fibre-reinforced polymer (CFRP UHM) sheets. The proposed method can be used for preliminary evaluation of strengthening effectiveness of LVL beams.

1. Introduction

The significant increase in the cost of materials, and, thus, the cost of laboratory tests carried out, especially on real-scale objects, necessitates the search for methods to predict the behavior of un-strengthened and strengthened beams. Appropriately validated with experimental tests model should allow the extrapolation of the analyses carried out to other strengthening schemes or use of another material. These preliminary studies would be beneficial from an economic and environmental point of view.
An effective method for studying various strengthening configurations is to use the finite element method with advanced FEA programs. Burawska and Tarasovs used the numerical model to analyze the effect of adhesive bond parameters on the behavior of pine beams reinforced with CFRP straps [1]. Kula and Socha [2] described a numerical model of the performance of a beam reinforced with CFRP strips taking into account rheological phenomena—they concluded that reinforcement could reduce rheological deflection gains. Nowak et al. [3] used an elastic and elastic–perfectly plastic model with Hill criteria to represent the plastic stresses of historical beams reinforced with CFRP strips. Raftery and Harte [4] discussed a nonlinear numerical model for predicting the behavior of unreinforced and reinforced laminated timber beams. Ye et al. [5] performed numerical analysis of behavior of lap joints reinforced with CFRP sheets—obtaining a good agreement with experimental results. Chybiński and Polus conducted experimental and numerical analysis of the short-term behavior of bent laminated veneer lumber panels [6], comparing 2D and 3D finite element models with orthotropic and elastic–perfectly plastic material models, respectively. They used a developed model in further studies of aluminium–timber composite (ATC) beams with bolted connections [7] and partial shear connections [8], in which timber slab was made of LVL panels. A good agreement between experimental and numerical results for unreinforced and reinforced with CFRP bent wooden beams was achieved in paper [9] using linear elastic material in compression and elasto-plastic material in tension with orthotropic failure criteria for wood and isotropic elastic models for CFRP. The results of numerical analysis of CFRP-strengthened timber beams using a coupled orthotropic elasticity and anisotropic plasticity with the quadratic criterion of Hill to model the behavior of wood showed good correspondence with experimental tests [10]. Finally, a numerical analysis of the effect of CFRP composite type and shape on the load-carrying capacity and stiffness of wood I beams was presented by Makowski [11].
Mathematical models are among the fast methods that make it possible to approximate the basic parameters of wooden beams reinforced with modern or traditional materials. Diverse constitutive models have been used to describe the nonlinear behavior of wood in the compression zone. The bilinear Bazan–Buchanan model [12] assumes linear elastic behavior up to plasticization, followed by a kink in the curve with a negative slope angle in the compression zone. This model has been used in many works [13,14,15,16], as it corresponds well with experimental results. When the distribution of deformation in the compressive area was not known, a simplified linear elastic model of a perfectly plastic body was used [17,18,19,20]. Moreover, the following assumptions were considered by researchers [21,22,23,24,25] in theoretical analyses for the evaluation of the ultimate moment capacity of the strengthened beams: the composite material has a linear behavior; the stress–strain relationship of timber is linear in tension; there is no slippage or debonding between fibre-reinforced polymer (FRP) and the timber surface; and plane sections remain plane.
A simplified analytical model based on transformed cross-section characteristics was used by Kawecki and Sumorek [26], among others, to evaluate the cost-effectiveness of combining laminated wood with CFRP laminates. Timbolmas et al. [27] used the transformed section method to calculate the global modulus of elasticity and corresponding moduli in tension and compression for pure timber section and combined from different species. Due to different behavior in tension and compression of wood, they treated the pure section as bi-material. This assumption was the basis for the authors in further investigation of the application of an analytical approach to analyze different layouts of unreinforced and reinforced with CFRP composite glulam beams [28]. Halicka and Ślósarz used a bi-material model of a cross-section to evaluate the bending stiffness of glulam beams reinforced with prestressed CFRP [29].
The purpose of this study is to present the feasibility of using a simplified mathematical model based on equivalent cross-sectional characteristics to predict the flexural behavior of laminated veneer beams reinforced with carbon-fiber-reinforced polymer sheets and laminates. The analysis included comparing experimental results with theoretical ones regarding the modulus of rupture (MOR), bending stiffness EI, and neutral axis position at beam failure c. The presented model was then used to predict the bending stiffness values and neutral axis position of full-size LVL beams strengthened with AFRP aramid sheets, GFRP glass sheets, and CFRP UHM ultra-high modulus carbon sheets. The effect of the number of reinforcement layers on the values of these parameters was analyzed.

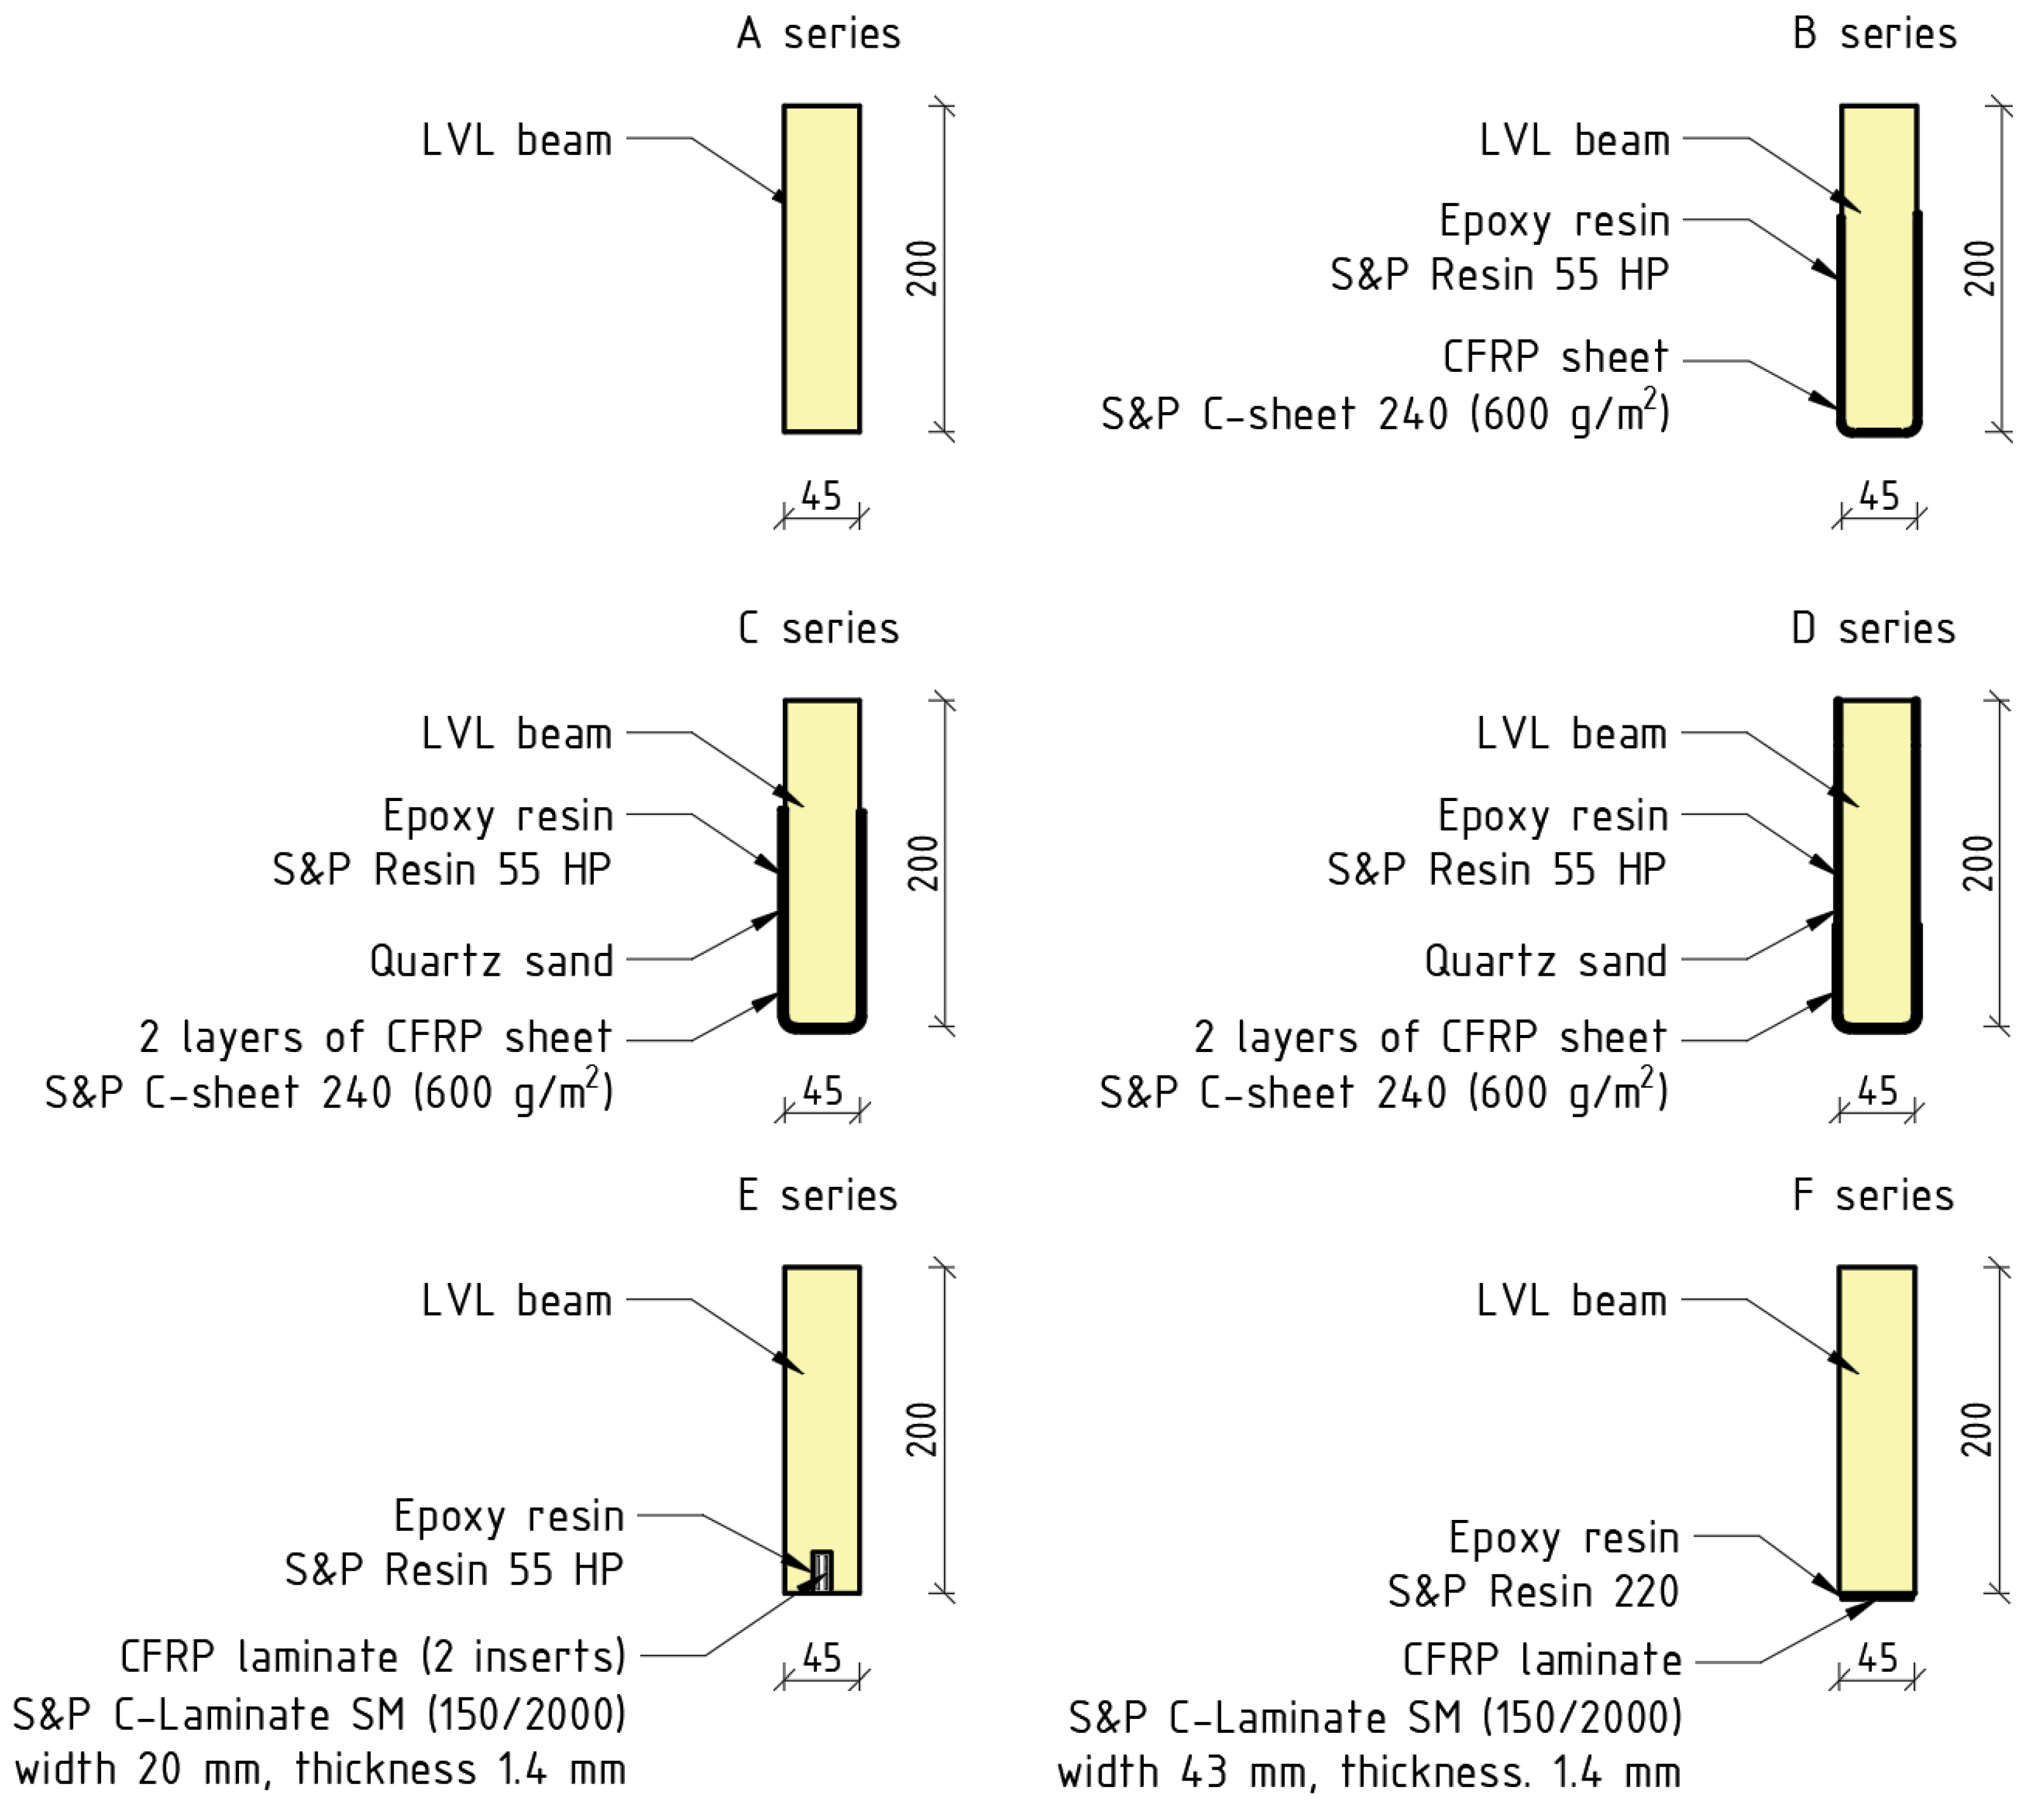
2. Materials and Methods

The behavior of LVL beams unreinforced and reinforced with CFRP composites is described using the equivalent cross-section method. This paper presents only the main assumptions necessary from the point of view of the given issue. A detailed description of the experimental and theoretical tests carried out is shown in the publications [30,31,32,33].

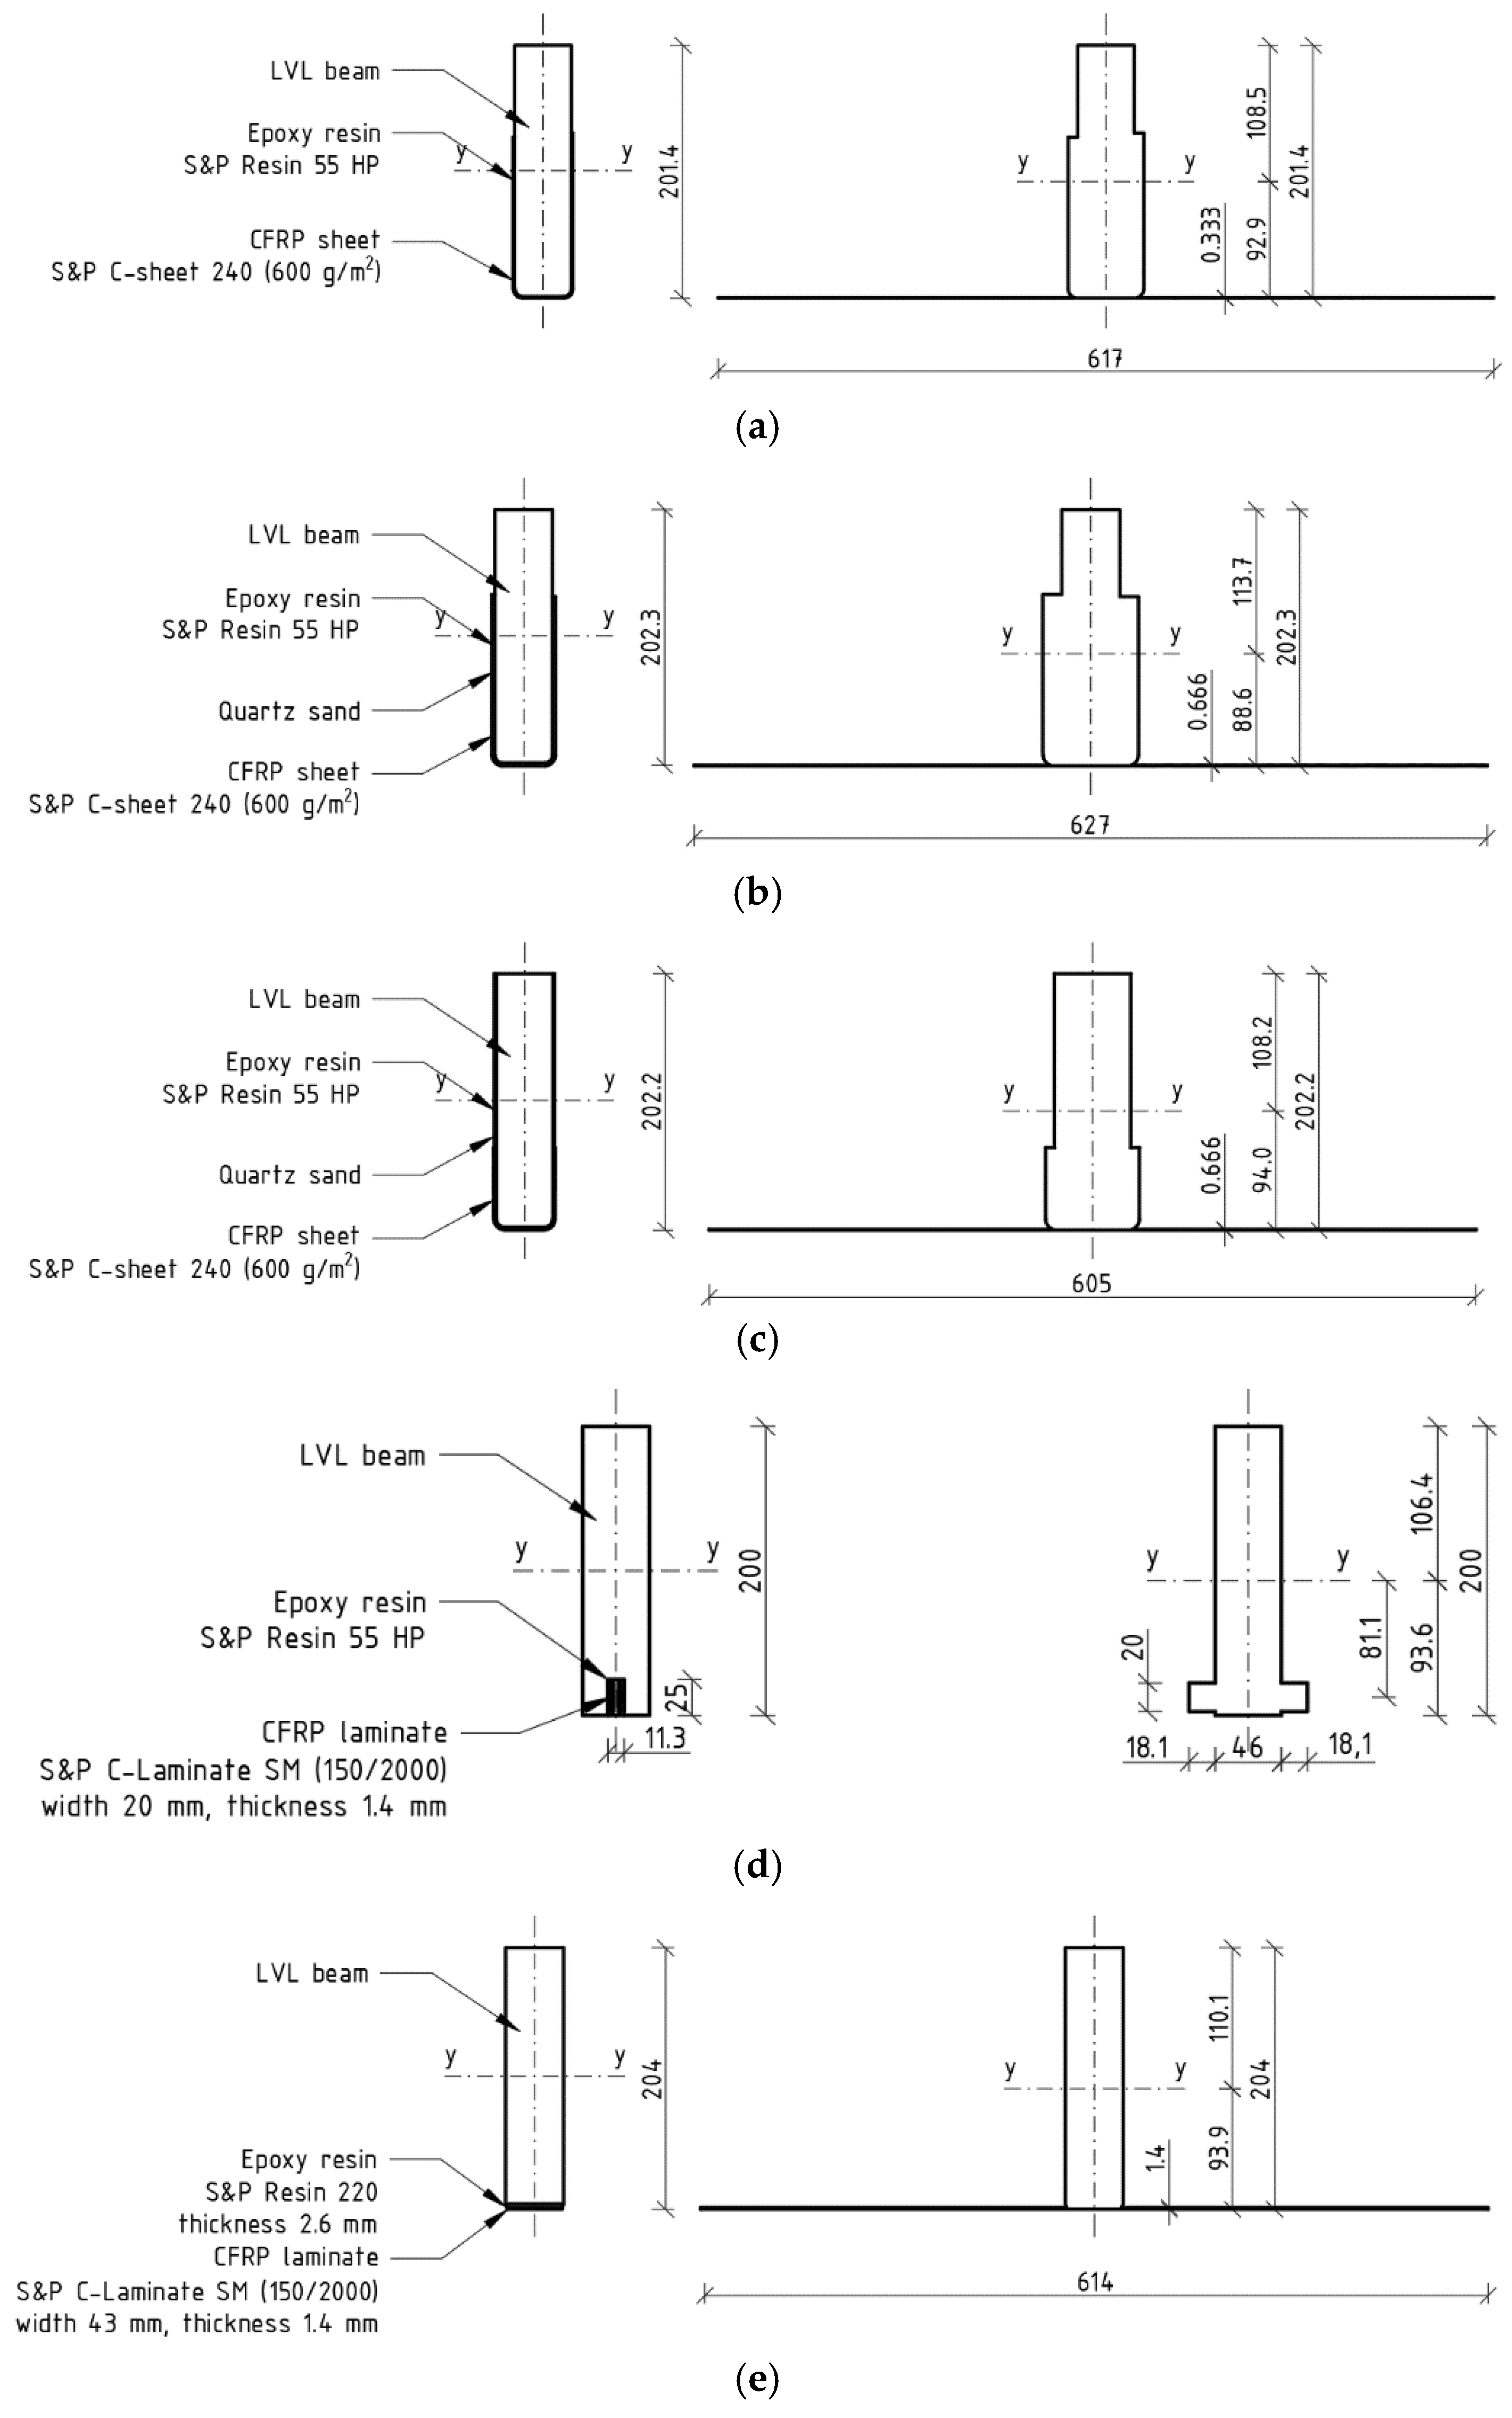
2.1. Transformed Cross Section Method

The mathematical model of the performance of full-size beams was created based on the method of equivalent cross-section, in which reinforcement is taken into account by proportionally increasing the geometric dimensions of the cross-section of the wooden beam [34,35]. Experimental tests were carried out on 30 beams, 5 unreinforced and 25 reinforced, divided into a 5 element series in the following arrangement (Figure 1): A—unreinforced beams; B—beams reinforced with one layer of CFRP sheet glued to the bottom and side surfaces; C—beams reinforced with two layers of CFRP sheet glued one over the other, covering the bottom and side surfaces; D—beams reinforced with two layers CFRP sheets covering the entire lateral surfaces with an overlap in the tension zone; E—beams reinforced with two inserts of CFRP laminate glued into grooves hollowed out along the bottom surface; F—beams reinforced with CFRP laminate glued to the bottom surface.
The basis for the calculations was the dimensions of each beam inventoried after experimental testing. Photographs of selected cross-sections of beams are shown in Figure 2—photos were taken of sections of beams cut from around the area of failure initiation.
The proportional increase in dimensions was determined using the η coefficient, which determines the ratio of the elastic modulus of the composite material and the laminated veneer [34,35]:
η = E f E d ,
where Ef—modulus of elasticity of composite material in fibre (main) direction; Ed—modulus of elasticity of laminated veneer lumber. The modulus of elasticity of the veneer and CFRP laminate was assumed based on experimental results of 14 GPa and 195 GPa, respectively. The modulus of elasticity of the CFRP sheet was assumed according to the data declared by the material manufacturer—265 GPa [36].
The substitute width of the veneer bz was determined separately for the reinforcement glued to the sidewalls (assuming a sheet thickness of 0.333 mm and carbon tape of 1.4 mm for the calculations) and glued to the underside (the width over which the reinforcement was applied), according to the formulas:
  • for composite parts oriented in vertical fashion:
b z = n   ·   t f   ·   η ,
  • for composite parts oriented in horizontal fashion:
b z = n   ·   b f   ·   η ,
where tf—thickness of composite; bf—width of composite; n—number of composite layers.
Examples of equivalent sections of reinforced beams (series B–F) are shown in Figure 3.

2.2. Methods

2.2.1. Modulus of Rupture (MOR)

The maximum normal stress occurring in the outermost fibers of the bent section (flexural strength) was estimated according to the formula (based on [34,35]):
M O R = M m a x · z I y ,
where Mmax—maximum bending moment; z—distance from neutral axis to external compressed fibers; Iy—moment of inertia of transformed or solid cross-section.
For reinforced beams, the geometric characteristics of the equivalent cross-section were used. For unreinforced beams, the geometric characteristics of the solid section were used. The calculations assumed a linear stress distribution over the height of the cross-section.
Except MOR, a theoretical value of maximum bending moment Mtheo carried by transformed cross-section was evaluated using reversed analysis based on Formula (4), assuming the maximum normal stress for the unreinforced LVL beam from the experimental test. For the calculations, a maximum normal stress in LVL equal to 57.8 MPa was assumed.

2.2.2. Bending Stiffness EI

Three methods were used to analyze bending stiffness, two of them based on the results of experimental tests and one based on theoretical analysis, including:
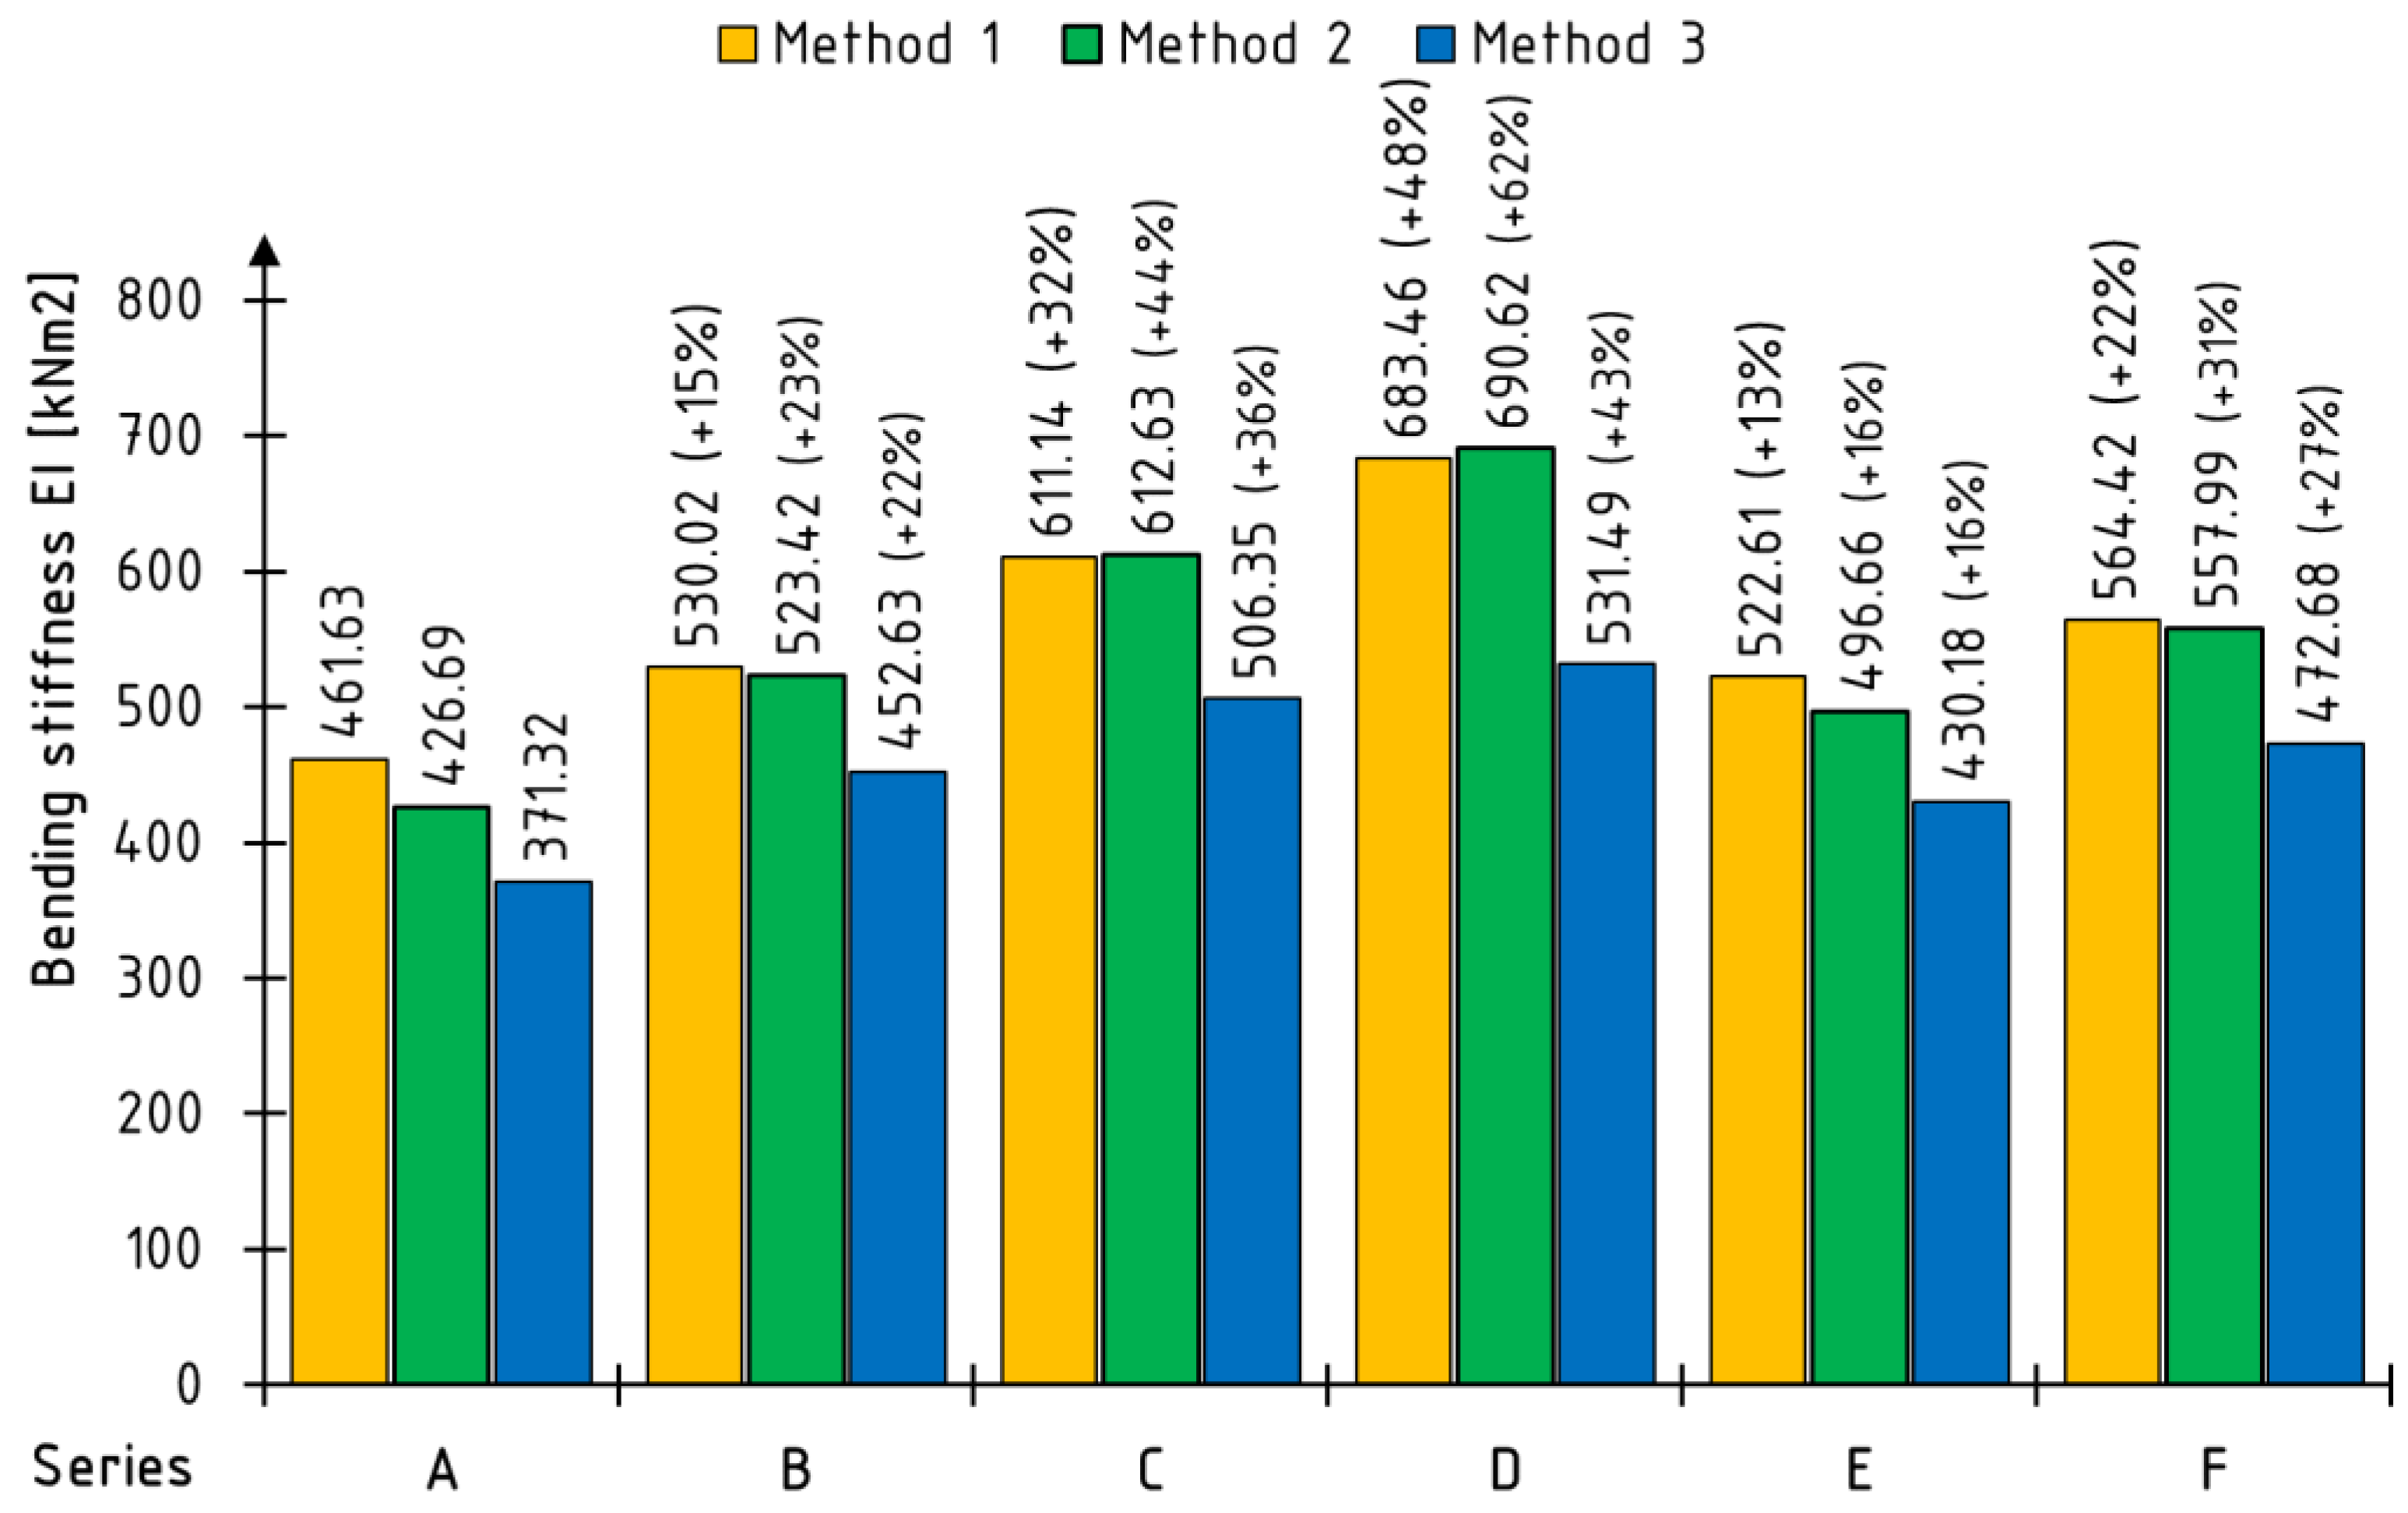
  • A method based on the curvature of the beam during bending (conducted using experimental data);
  • A method based on the characteristics of the equivalent cross-section using the elastic modulus of laminated veneer (conducted using simplified mathematical model);
  • A method based on a formula that describes the deflection value of a beam loaded with two concentrated forces (conducted using experimental data).
Methods 1 and 3 were used to validate the simplified analytical model (method 2), which was applied at the design stage to predict the strengthening effectiveness using different composites as a reinforcement.
In the first method, the bending stiffness EI1 of unreinforced and reinforced full-length beams was determined as the product of the bending moment at the center of the element span M and the radius of curvature ρ (Figure 4) in the plane of bending xy according to the formula [37]:
1 ρ = M E I 1     E I 1 = M   ·   ρ ,
where EI1—bending stiffness; M—bending moment; ρ—radius of curvature. A constant value of curvature and bending moment for the analyzed part of beam was assumed.
The curvature of the element κ in the xy plane is described using an arc plotted from points lying along a horizontal line running halfway up the cross-sectional height—the x-axis of the local coordinate system on the face of the beam. A point at the center (P2) and points offset by 100 mm from the axis of application of concentrated forces (P1, P3) were used to create the arc. The distance between points P1 and P2 and P2 and P3 was 500 mm.
The radius of curvature ρ of the beam was estimated from the geometric relationships present in a right triangle, using the estimated deflection arrow and the distance (horizontal component) between points P1 and P2, according to the formula [37]:
ρ 2 = ( ρ   -   f   ) 2 + ( x l ) 2     ρ = f   2   + x l 2 2   ·   f ,
where ρ—radius of curvature; xl—distance between point P1 and P2; f—displacement of point P2 from line drawn between points P1–P3.
In the second method, the bending stiffness EI2 was determined as the product of the moment of inertia of the equivalent cross-section Iy (or solid cross-section) and the modulus of elasticity of the veneer Ed in bending according to the formula:
EI2 = Ed · Iy,
where Ed—modulus of elasticity of LVL; Iy—moment of inertia of transformed or solid cross-section.
In the last method, the bending stiffness of EI3 was estimated using the transformed deflection formula for a beam subjected to four-point bending according to the formula:
u = P a 24 E I 3 ( 3 L 2 - 4 a 2 )     E I 3 = P a 24 u ( 3 L 2 -   4 a 2 ) ,
where P—loading force; u—midspan deflection; a—distance between support axis to the nearest concentrated force; L—span of beam.

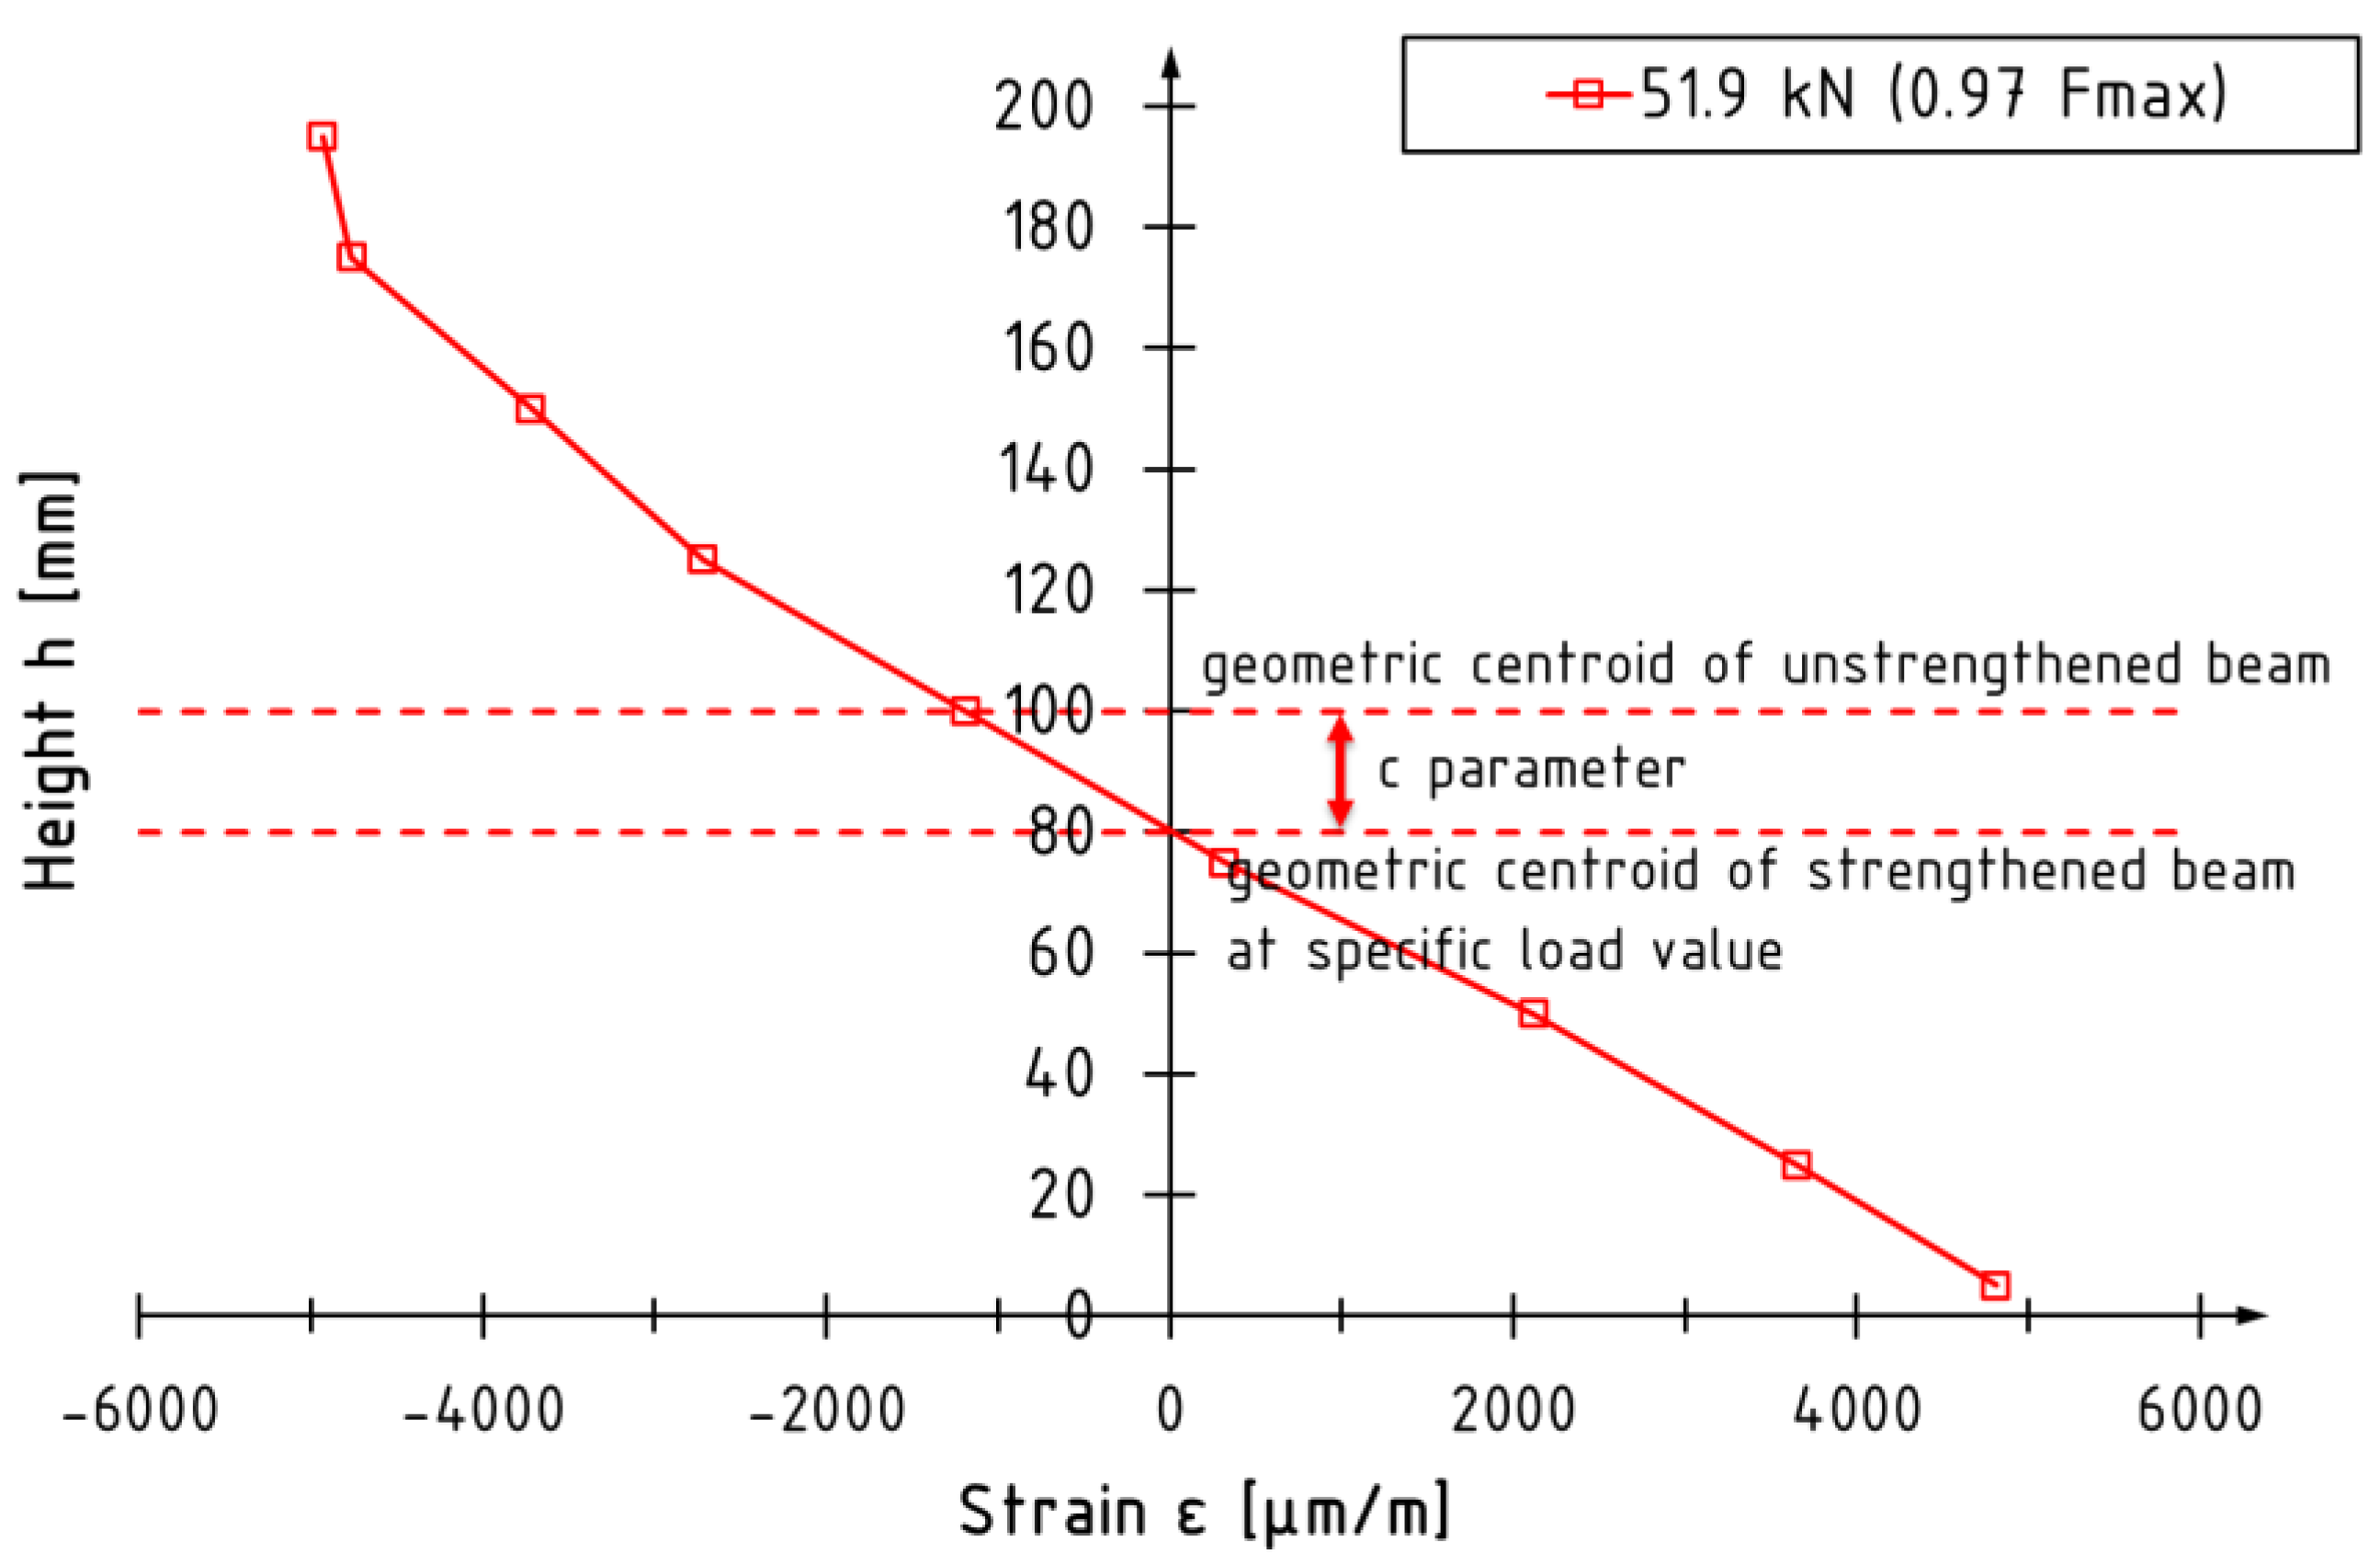
2.2.3. Position of Neutral Axis

The offset of the neutral axis from the geometric center of the height of the laminated veneer cross-section, hereafter denoted by the symbol c, was determined based on the strain profiles in the central section evaluated using digital image correlation [33]. The point of intersection of the curve with the vertical axis (the change in the sign of the strain) was determined by linear interpolation between the values closest to either side of the vertical axis in the center section. Schematically, the location of the center of gravity of the reinforced beam section is shown in Figure 5.

3. Results

The results of the analyses are presented in terms of three aspects of the beams’ performance: modulus of rupture (MOR), bending stiffness EI, and neutral axis position c.

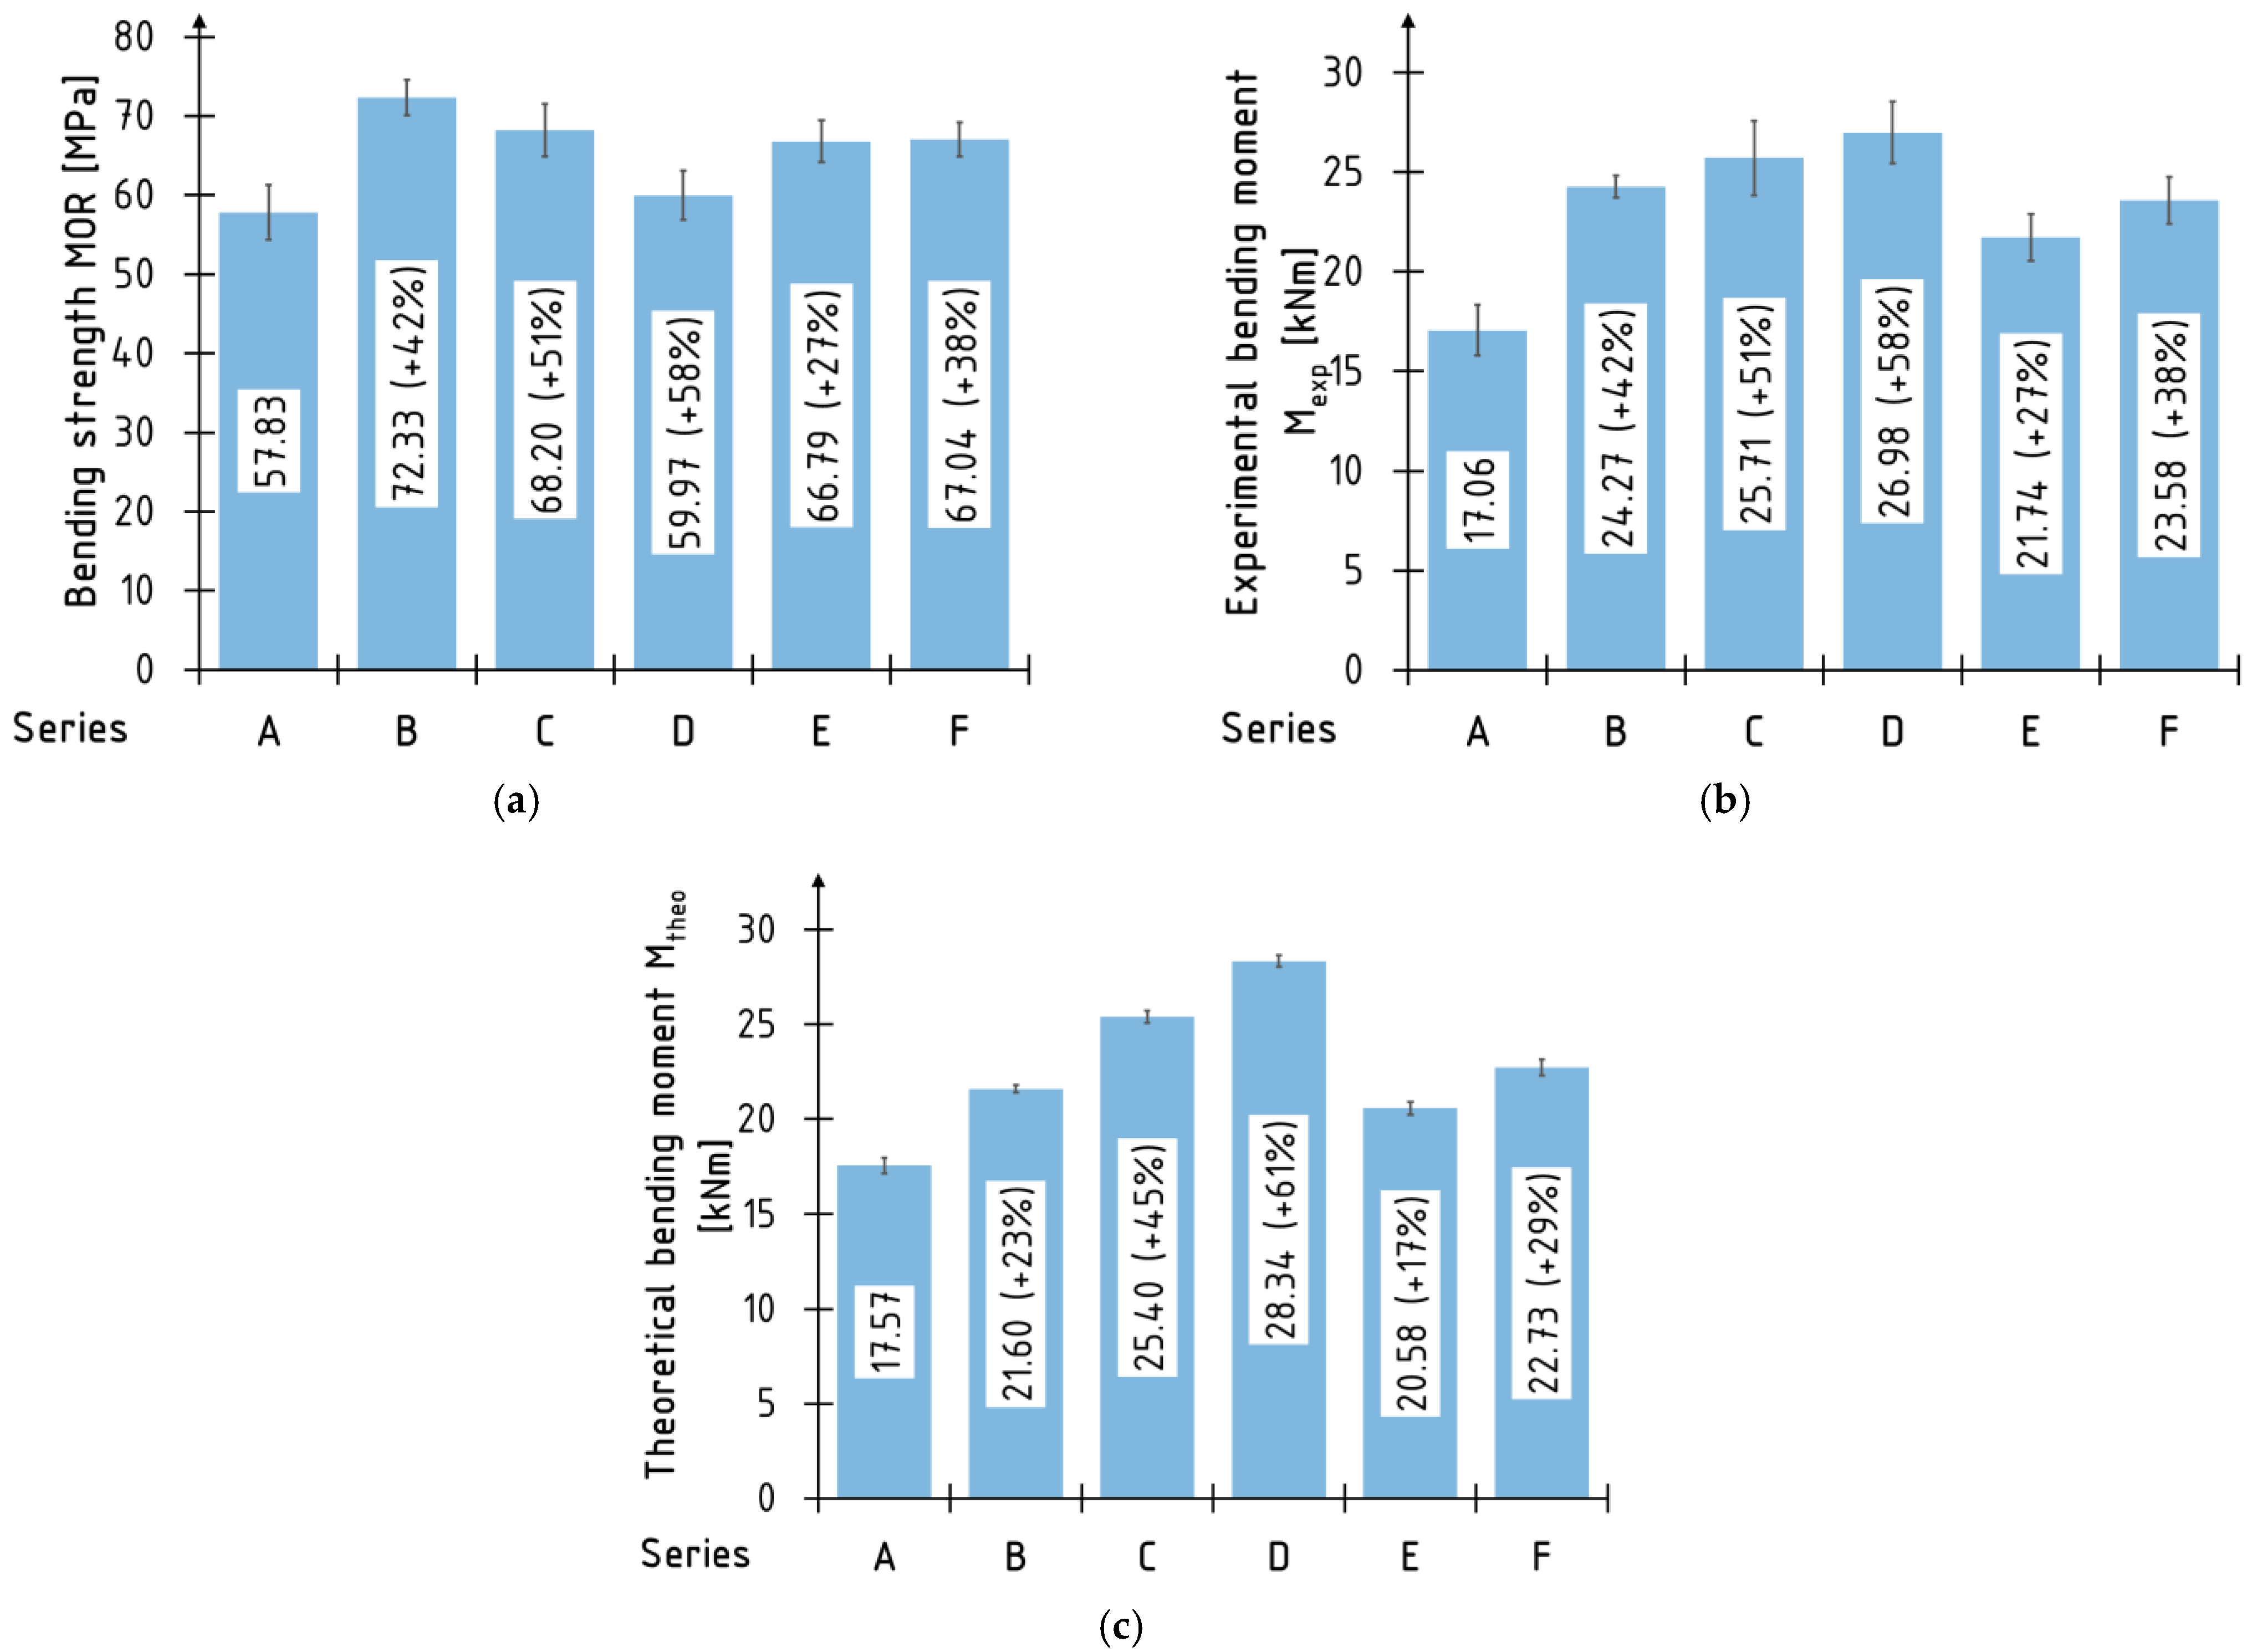
3.1. Modulus of Rupture (MOR)

The average values of the bending strength MOR and the average values of theoretical Mtheo and experimental maximum bending moment M for the tested beams are shown in Figure 6. The most significant values of MOR are recorded for the B series and the smallest for the D series beams. An inverted order can be seen in the case of the maximum bending moment of the cross-section—the smallest values are for the B and E series beams and the largest for the D series. There are several reasons for this: the incompatible reality assumption of linear stress distribution over the height of the cross-section, the way the composite reinforcement is distributed, and the degree of reinforcement of the cross-section. The stress distribution in the compression zone is bilinear and linear in the tension zone; the mathematical model assumed linear in both zones. The higher the degree of reinforcement, the higher the moment of inertia of the equivalent cross-section, and, thus, the lower the value of MOR—when in the calculations, the value of the bending moment between the different test series is similar. The distribution of sheets along the lateral surfaces causes a proportional thickening of the cross-section, which does not significantly translate into the value of the shift of the neutral axis of the cross-section.
Therefore, the suitability of this mathematical model for predicting the flexural strength of a reinforced cross-section cannot be confirmed. However, it can estimate the maximum stress in the tensile zone.
High accuracy was obtained for predicted (theoretical) values of maximum bending moment carried by transformed cross-section with the experimental results. It is then worth noting that a simplified mathematical model can be used for the evaluation of the maximum load a reinforced LVL beam can withstand. However, this calculation requires knowledge/assumptions about maximum normal stress for the unreinforced cross-section.
Failure modes of tested beams were discussed in detail in [30,31,32,33].

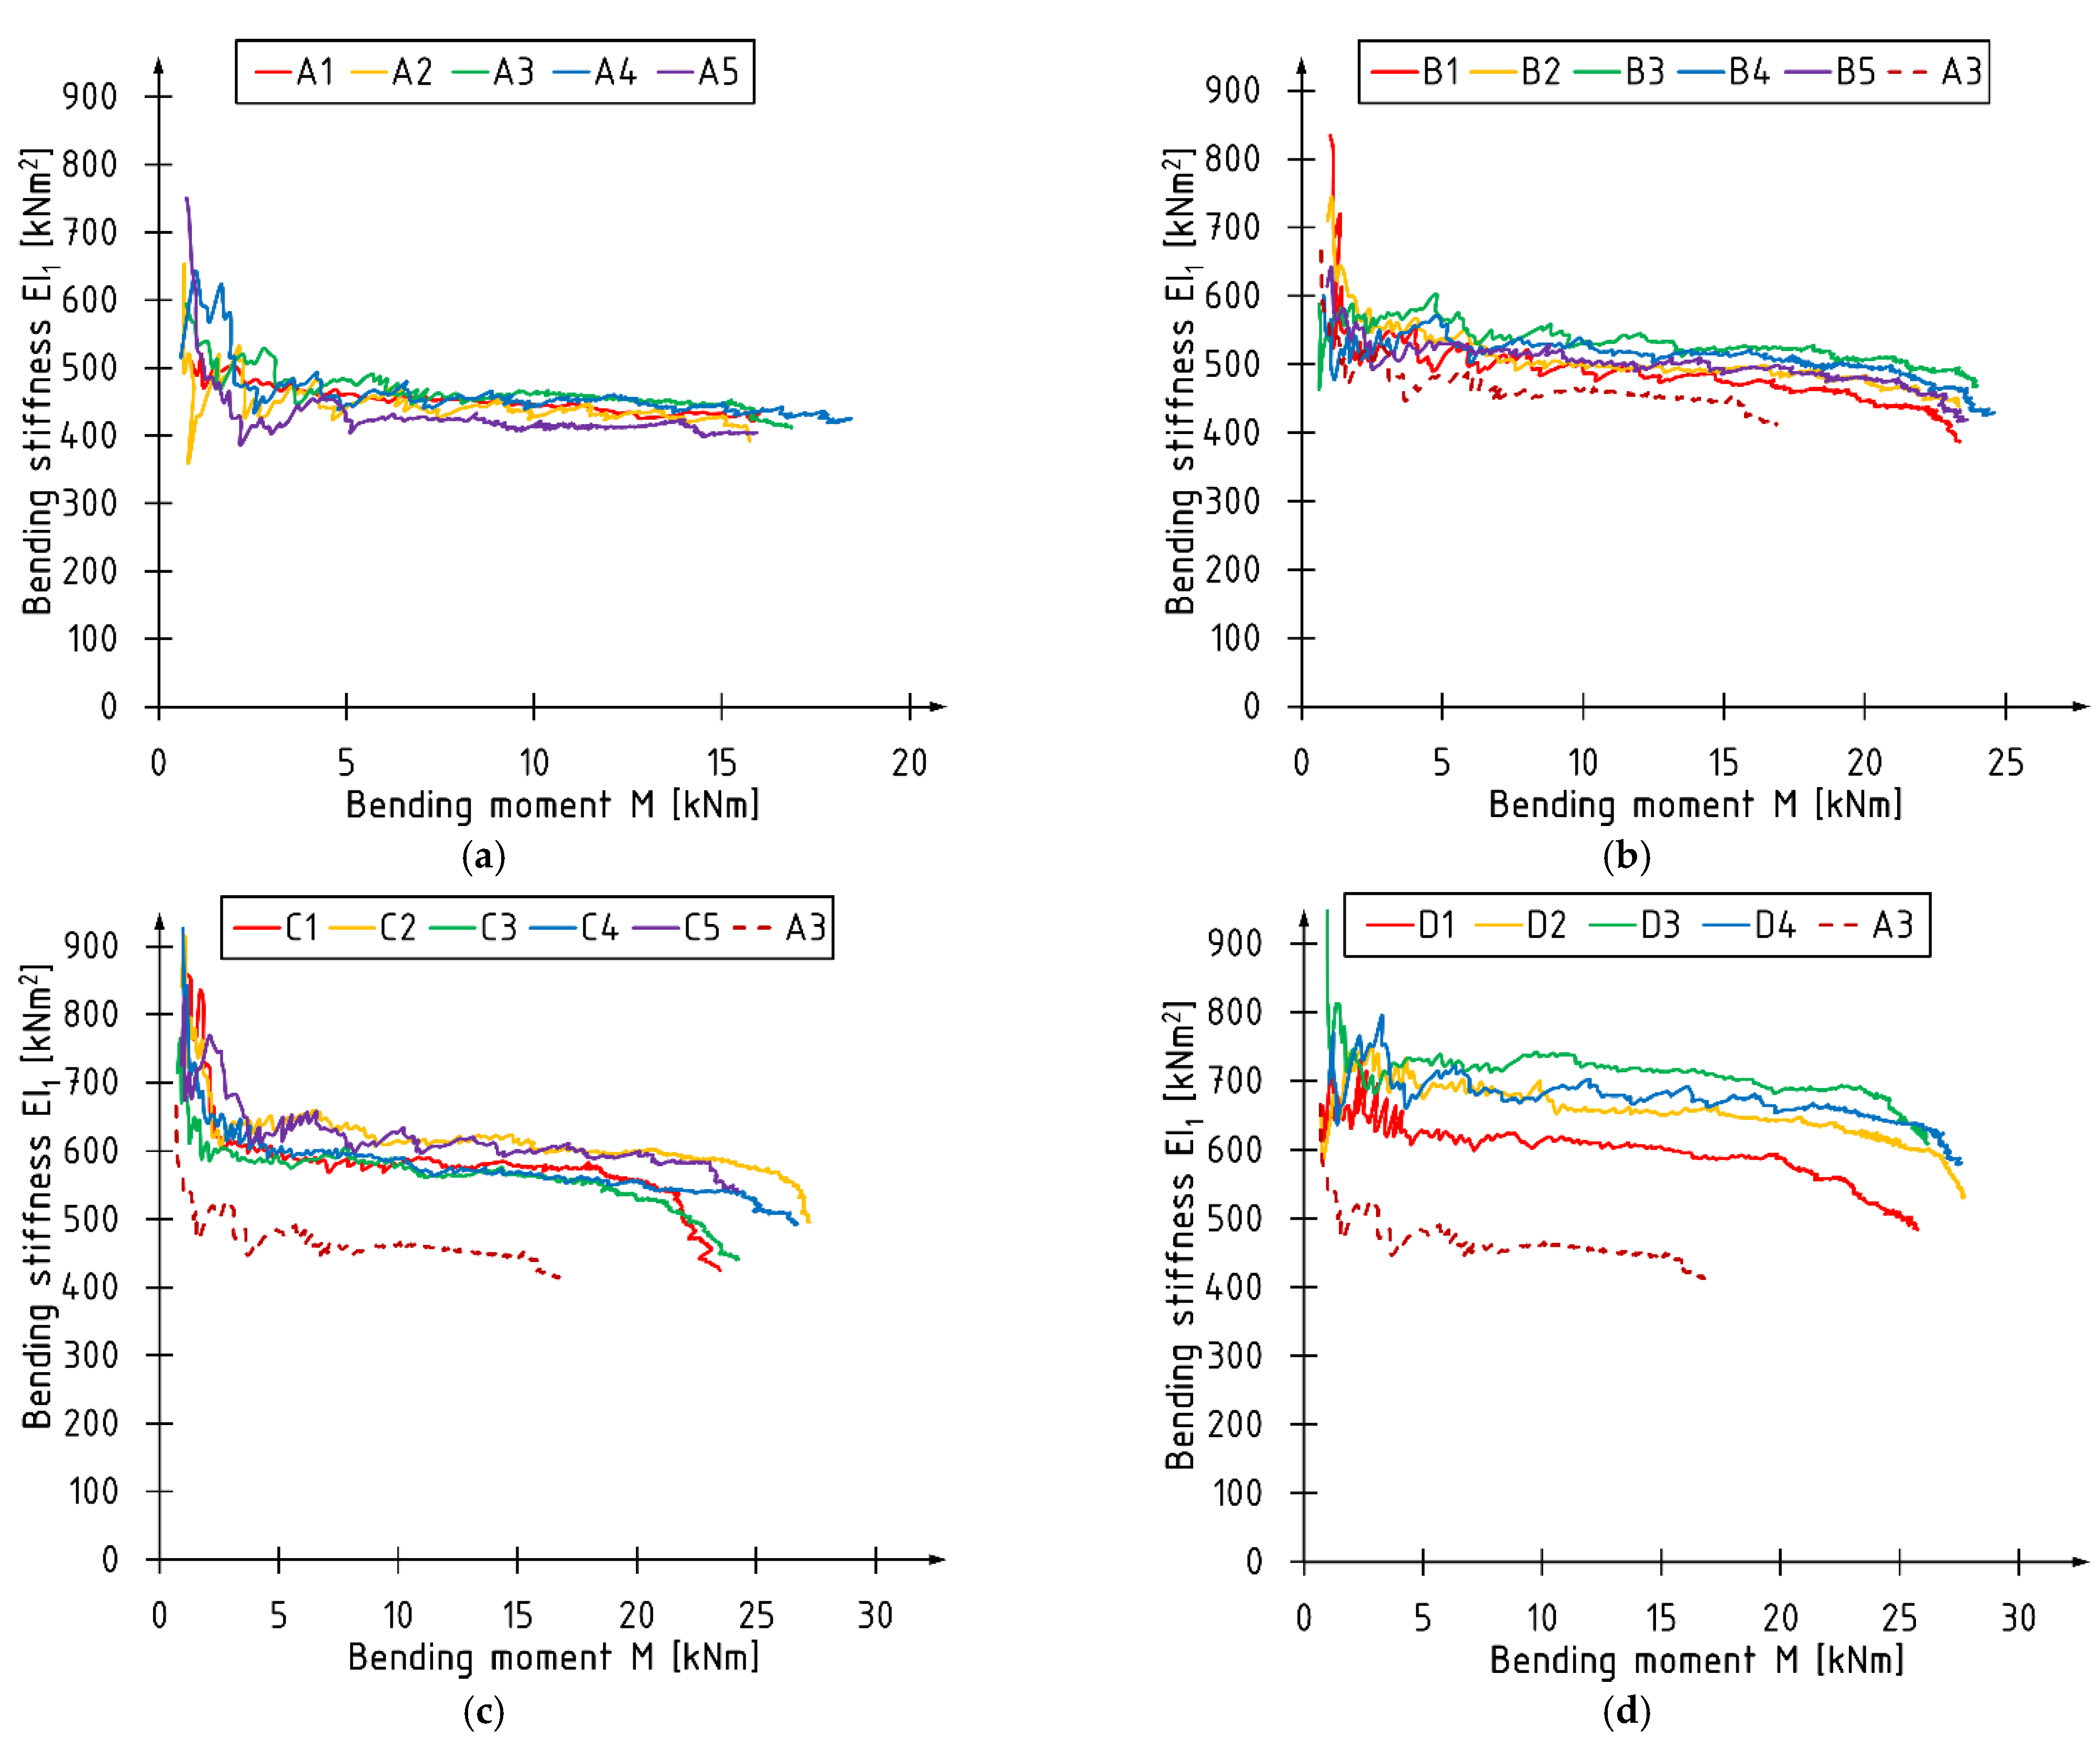
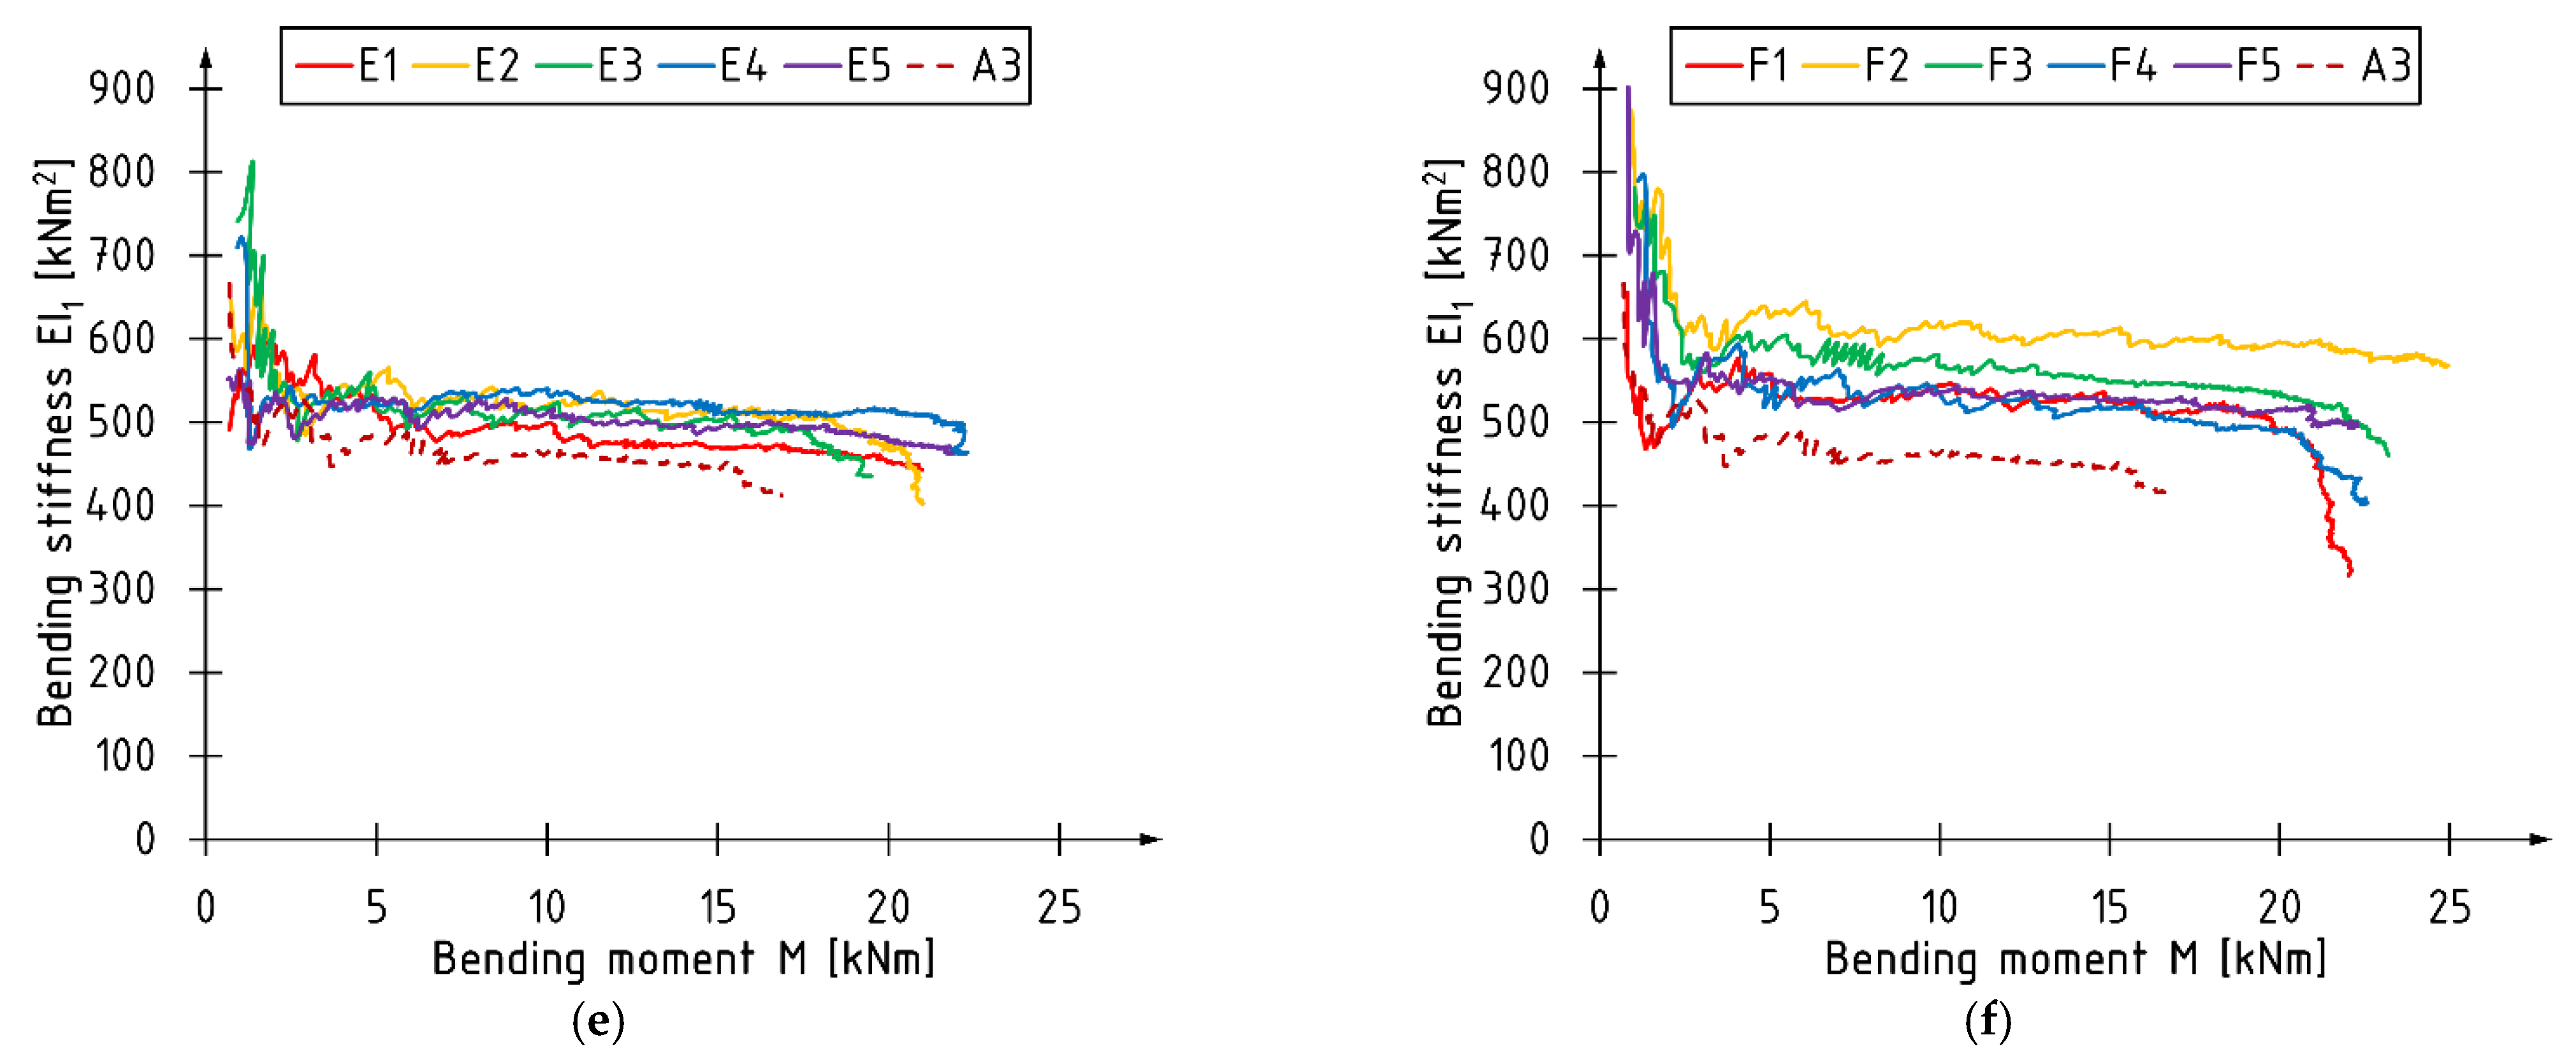
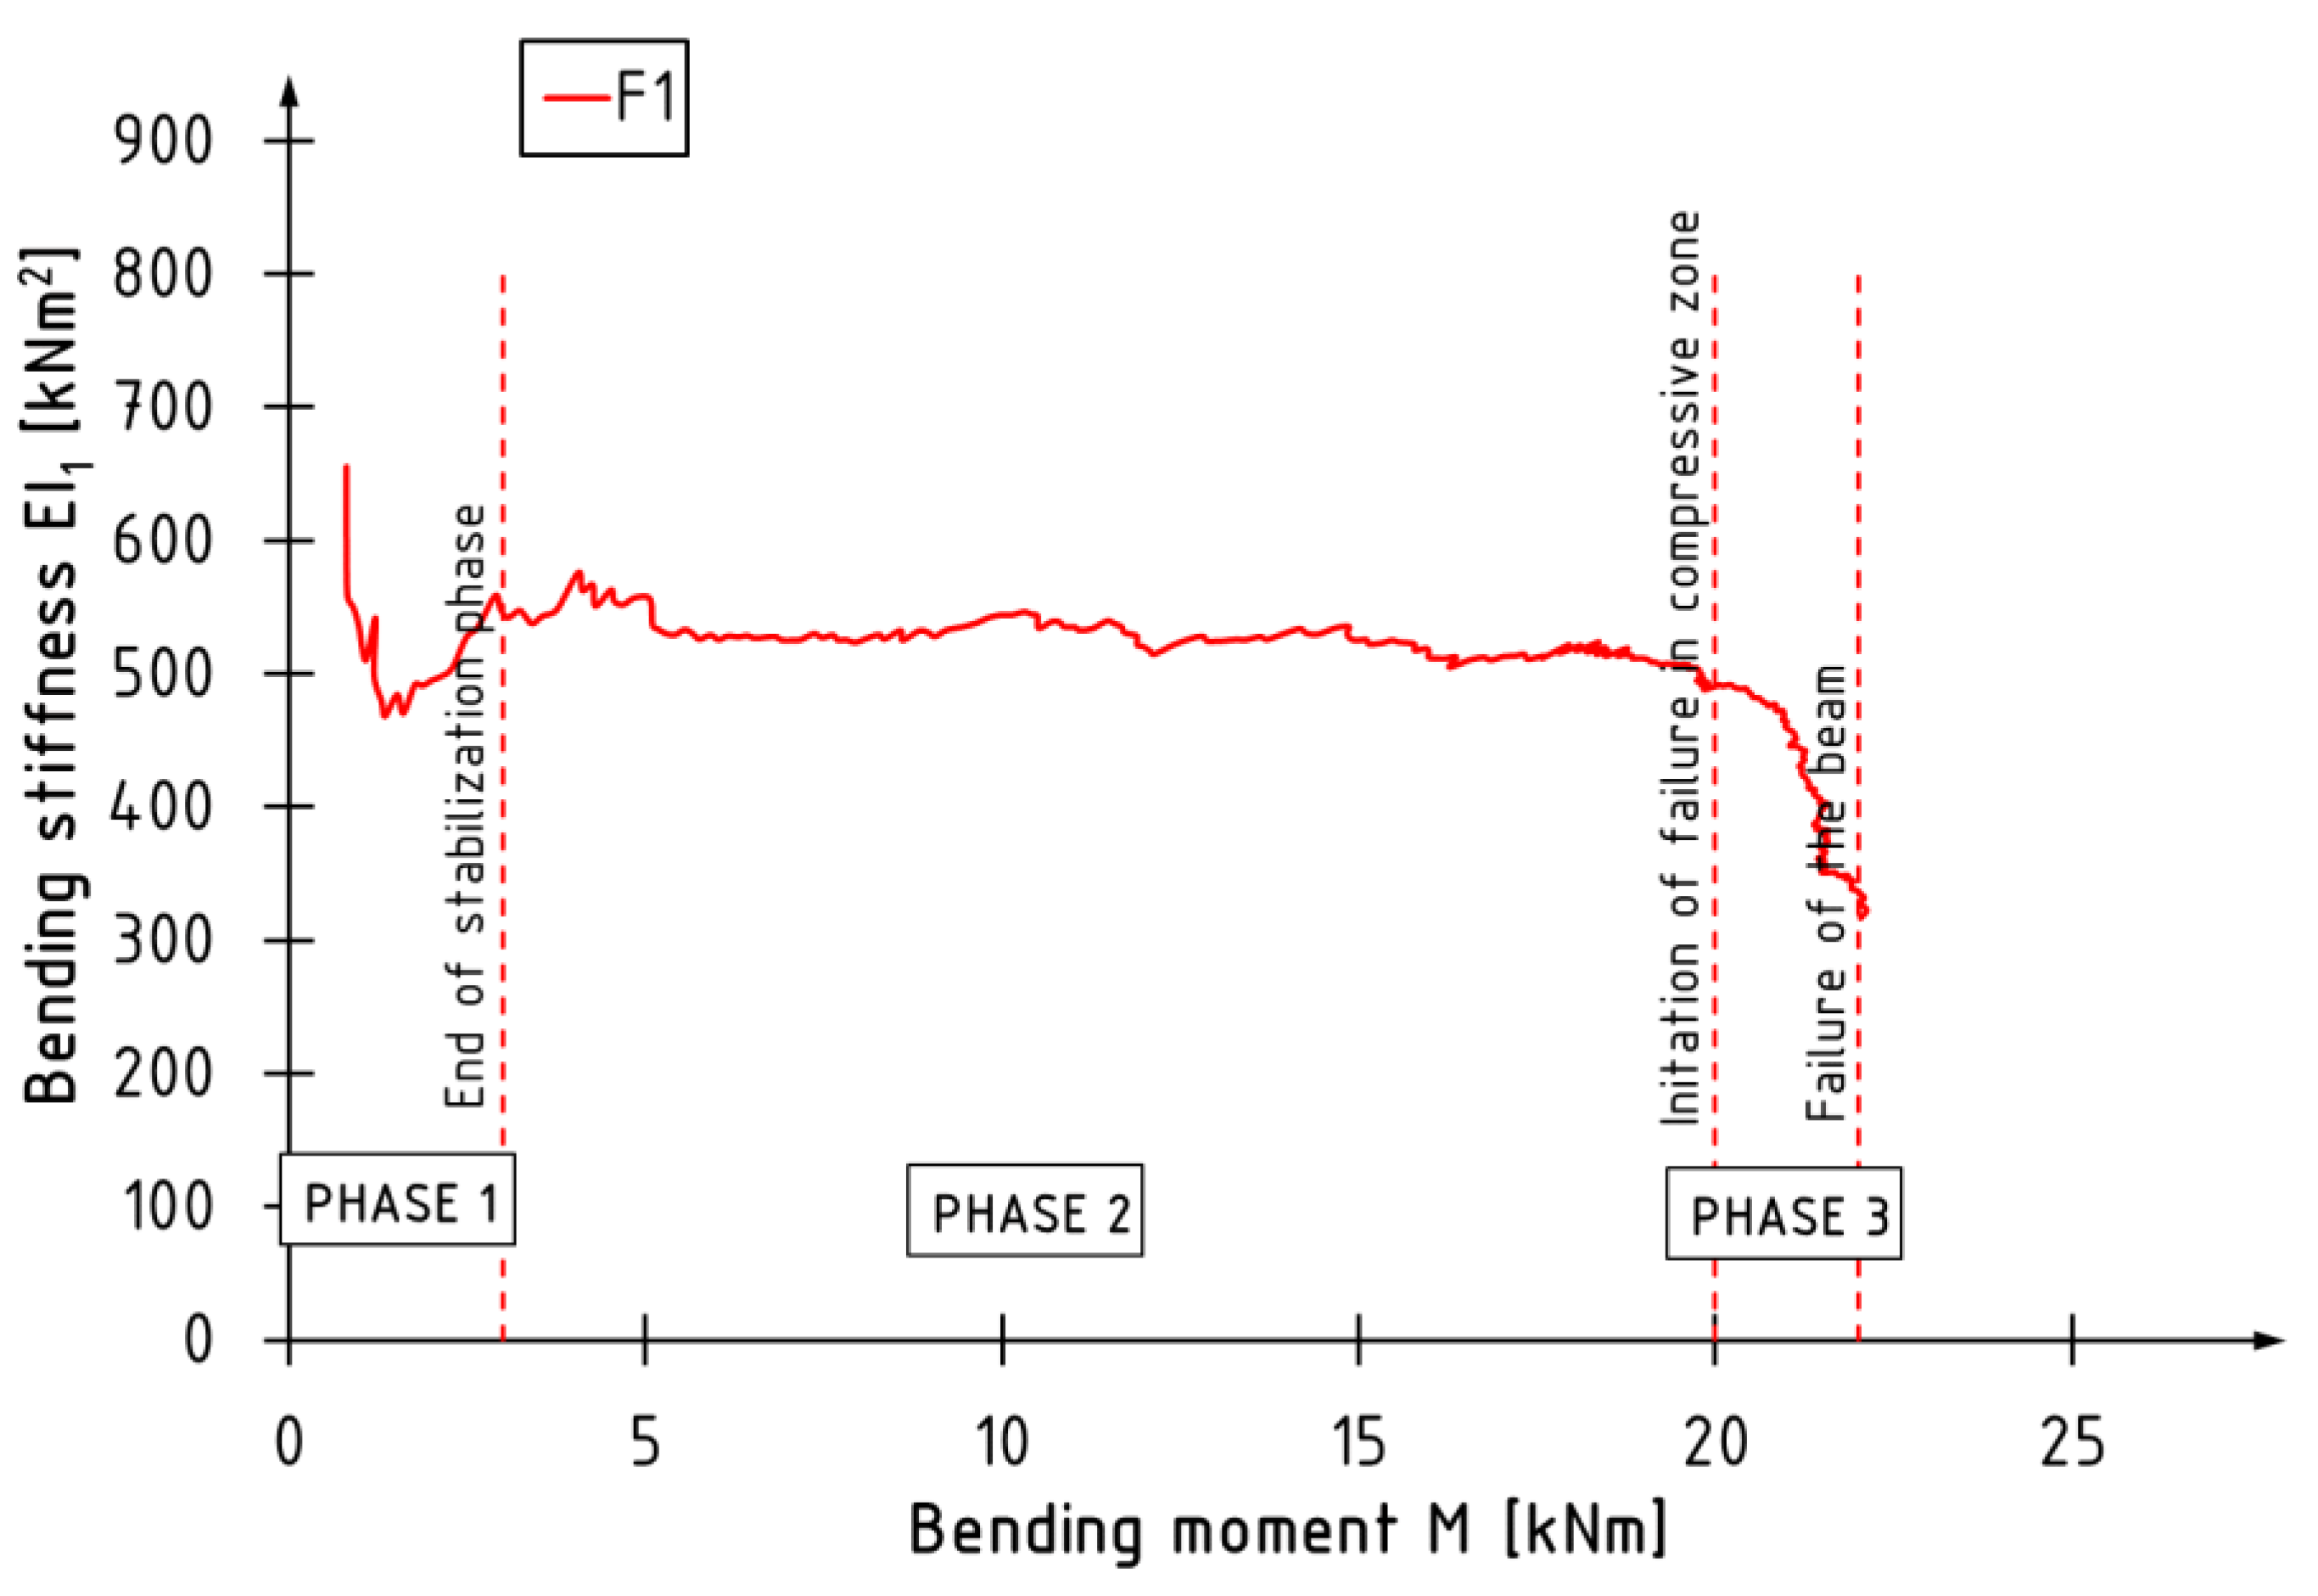
3.2. Bending Stiffness EI

Figure 7 shows graphs describing the changes in stiffness EI1 as a function of the bending moment M from the beginning of the test until the maximum value of the bending moment is reached, determined according to method 1. The graphs describing the behavior of elements reinforced with composite materials carry the curve of the course of changes in stiffness for beam A3, representing the upper limit of values for unreinforced beams.
The bending stiffness EI1 of reinforced beams is higher than that of reference beams. As the load increases, the bending stiffness decreases—the negative slope of the relationship EI1M curves. Due to the nature of changes in the curvature of the relationship, “bending stiffness EI1—bending moment M” can be divided into three parts, representing, respectively, (Figure 8):
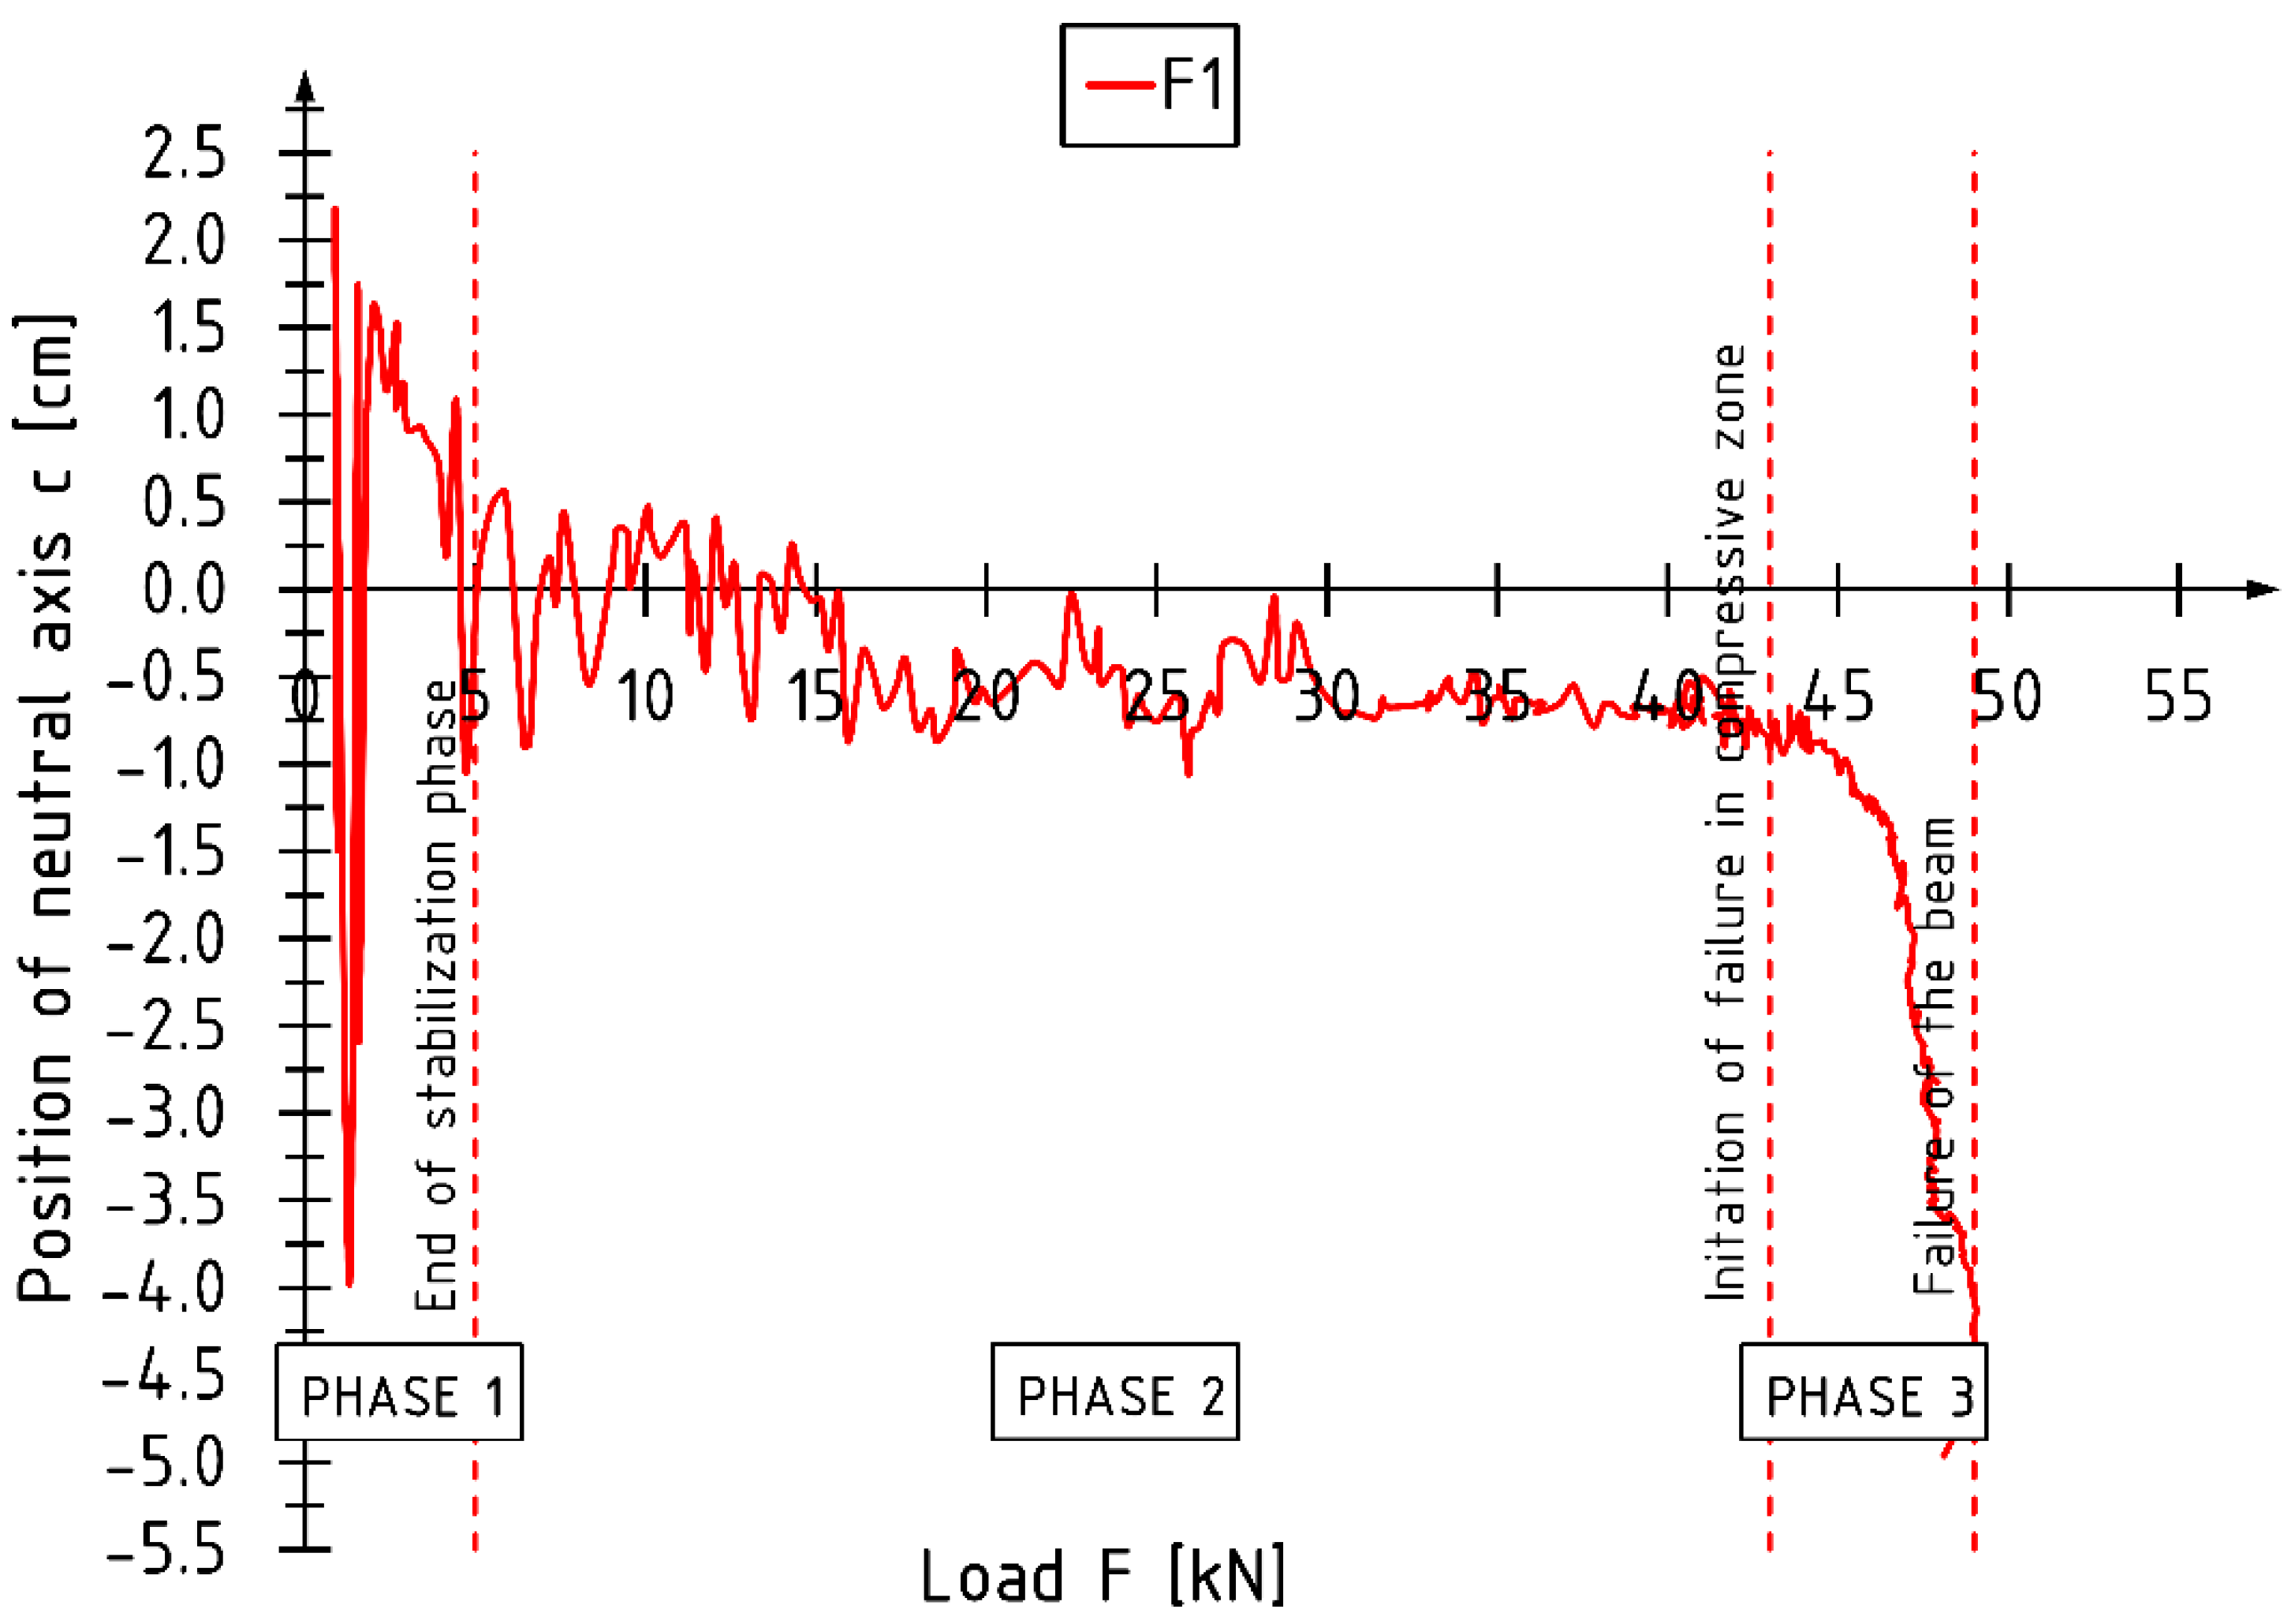
  • Initial phase—rapid changes (decreases in stiffness) associated with stabilizing beams in the test stand. Typically, this phase lasts up to a load approximately equal to 5 kN;
  • Middle phase—relative linear behavior, without significant changes in the curvature course;
  • Final phase—begins at the point of change in the slope of the curve in the final stage of the test. The difference in slope is related to the nature of the failure and the accompanying change in stiffness, for example, due to crack propagation in the compression zone. This phase does not occur for beams whose failure occurs suddenly and is caused by exceeding the strength of the veneer in the tensile area, as is the case for unreinforced beams.
Figure 9 shows the average bending stiffness values determined according to methods 1–3. Due to the changes in stiffness during the test, a load interval of 0.1 to 0.4 Fmax (maximum load) located in the middle phase of the operation was used to determine the stiffness values for each beam. The stiffness increments for the A series beams are given in parentheses. The highest increase in stiffness is recorded for beams reinforced with two layers of carbon sheets, amounting to more than 30% and 40% for the C and D series, respectively, for methods 1 and 3; and more than 40% and 60% for the C and D series, respectively, for method 2. The smallest increase is characterized by elements reinforced with carbon strips glued into the grooves, which averaged just over 10%.
Table 1 shows the relative differences between the values calculated by method 2 and method 3 in respect to method 1.
Most of the average EI bending stiffness values estimated based on the equivalent cross-section method (method 2) are lower than those estimated based on the curvature of the member (method 1). The most significant differences of more than 7% are recorded for reference beams A. Good agreement of results is obtained for beams reinforced with carbon sheets (B, C, D series) and tapes glued to the bottom surface (F series), for which the maximum differences are slightly more than 1%. For beams reinforced with laminate glued into grooves, the difference is 4.97%.
The values estimated from the transformed formula for beam deflection at mid-span (method 3) differ significantly from the other two methods. The differences range from −14.60% for B series beams to 22.24% for D series beams in respect to method 1.

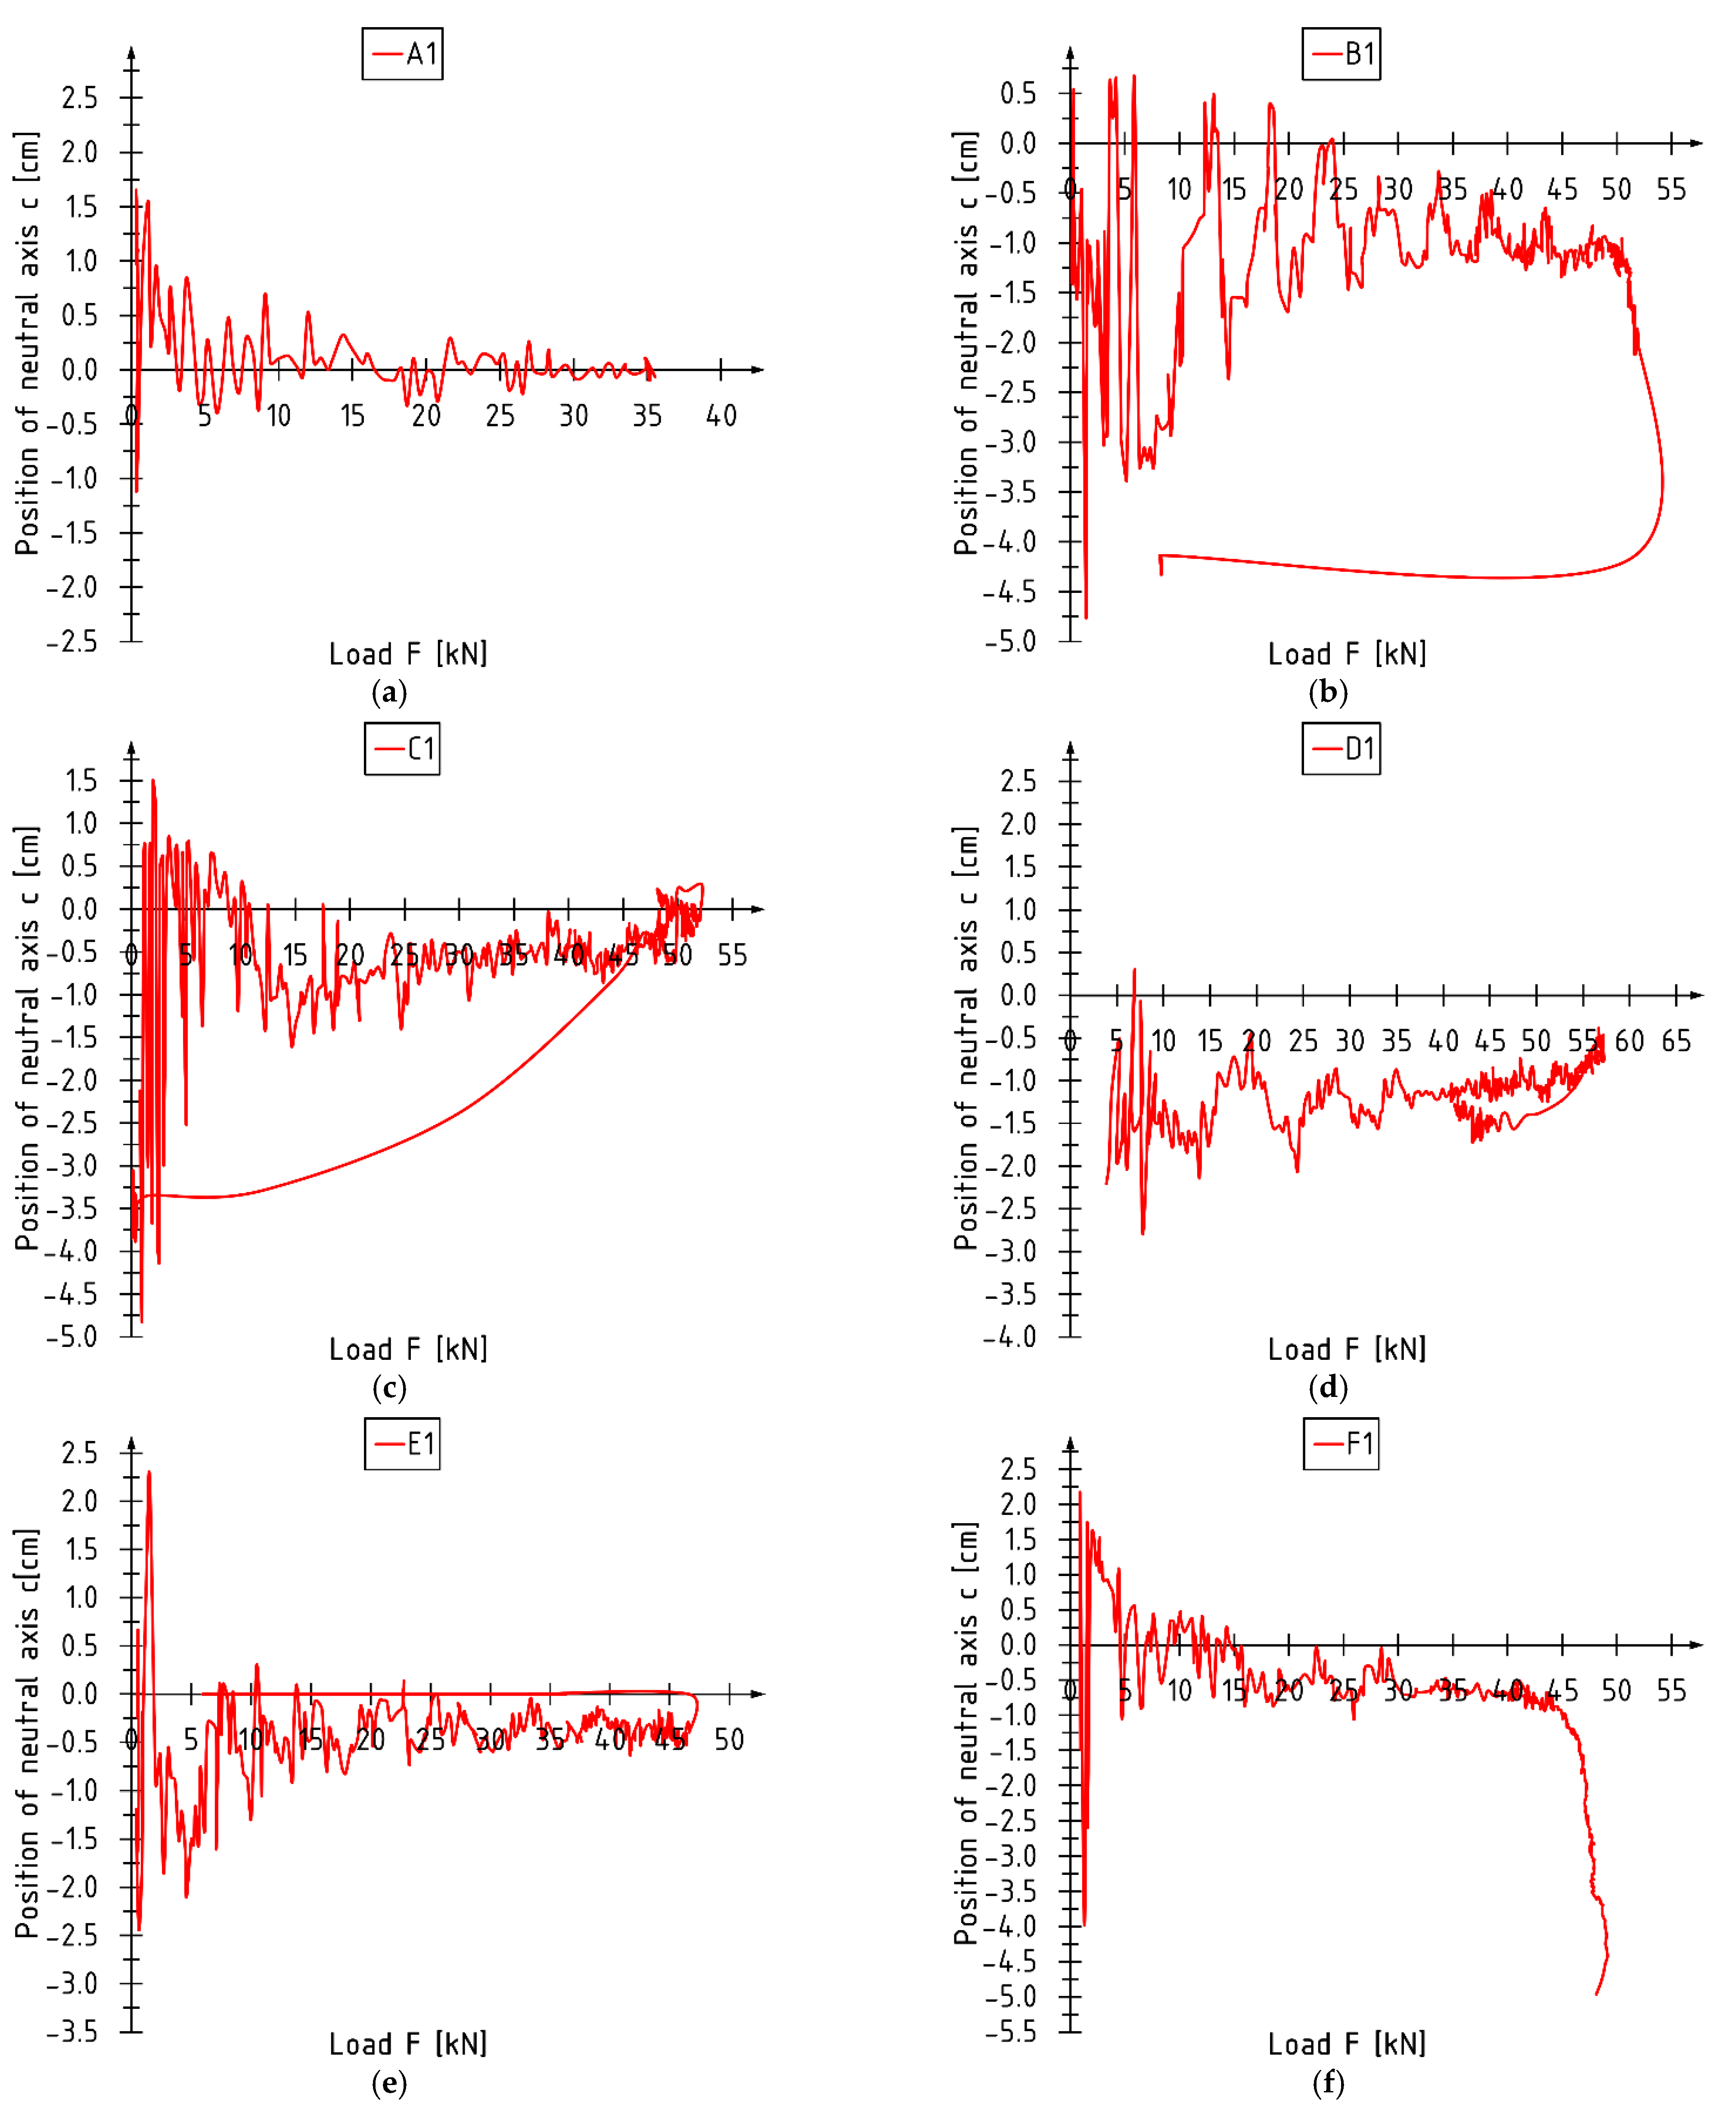
3.3. Neutral Axis Position c

Figure 10 shows the changes in neutral axis position c—measured from the geometric centroid of LVL section—as a function of load values for selected unreinforced and reinforced LVL beams tested. The trend of changes is either parabolic (usually curved upward) or linear, the slope of which can be both positive and negative. At the initial stage of the test, the amplitude of position displacements is the largest and decreases as the load increases. Abrupt changes in the curves of reinforced beams can cause beam failure.
The course of changes in curvature can be divided into phases similar to those for changes in stiffness described in Section 3.2 (Figure 11). As the load increases, the amplitude of displacements of the neutral axis position decreases—the highest values are recorded in the initial phase of the test. During this time, the neutral axis can repeatedly change its position relative to the center of the height of the cross-section, passing between positive and negative values of the coordinates of the ordinate axis. This phenomenon is typical for all tested elements (phase 1). The middle phase, the largest one, is when no significant changes occur (phase 2). The final value of the position of the center of gravity of the reinforced section is most influenced by the reinforcement method and the nature of the beam failure. Lateral torsional buckling of beams—twisting of the center profile—causes a shift of the neutral axis in the direction of the compressed fibers. Destruction in the compression zone causes the neutral axis to shift toward the tensile fibers. In the case of unreinforced beams, the way they are destroyed does not affect the changes in position in the final phase of the test (phase 3).
Table 2 shows the average values of the offset of the neutral axis from the center of the height of the cross-section recorded for the maximum load value and the offset estimated according to the equivalent cross-section method. In parentheses are given the percentage differences from the measured position. The highest agreement between experimental and theoretical results is obtained for beams reinforced with two layers of carbon sheets covering the entire lateral surface (D series)—2%. A similar agreement is obtained for beams reinforced with one layer of CFRP sheet and CFRP laminate glued into the grooves. The most significant differences between the actual and theoretical positions of the neutral axis are recorded for beams reinforced with laminates glued to the bottom surface (F series).

4. Discussion

Due to the high agreement of the values of bending stiffness EI and the position of the neutral axis c between the experimental results and the simplified mathematical model, it was decided to present the predicted values of these parameters for other types of composite sheets. The results of calculation can be used for optimization purposes, comparing strengthening effectiveness with price and the labor of strengthening technique.
The simulation was carried out for reinforcement with AFRP aramid sheets, GFRP glass sheets, and CFRP UHM ultra-high modulus carbon sheets. The effect of the number of reinforcement layers on the value of these parameters was also evaluated. It was assumed that reinforcement would be applied to the beams’ entire side and bottom surfaces—scheme in Figure 3c. This is the most effective of the reinforcement techniques presented. The characteristics of the FRP composite materials used in the analyses are shown in Table 3.
The predicted values of bending stiffness and neutral axis positions are shown in Table 4. Of course, as expected, the most effective solution is using carbon sheets with an ultra-high elastic modulus. Beams reinforced with aramid and glass sheets exhibit similar behavior—the lower elastic modulus of the glass sheet is compensated for by its greater thickness relative to the aramid sheet. As the stiffness of the material and the number of reinforcement layers increase, the reinforcement efficiency increases.
The effects of reinforcement on stiffness and neutral axis position discussed here are only a fragment of the behavior to be analyzed for reinforced beams subjected to bending. In addition, elements such as bending capacity, ductility, and maximum deflection should also be considered. An essential parameter in these analyses can be the value of elongation at failure of the composite material that can cause premature failure of the “beam-glue-reinforcement” system.

5. Conclusions

This paper analyzes the feasibility of using the equivalent cross-section method to analyze the behavior of unreinforced and composite-reinforced laminated veneer beams. In addition, the results of the analytical analysis were compared with the results of experimental tests. To summarize:
  • The suitability of using the equivalent cross-section method to estimate the cross-sectional capacity of laminated veneers reinforced with fiber composites has not been confirmed. This is related to the assumption of a linear distribution of stresses in the compression and tension zones. In contrast, the actual distribution is linear in the tension zone and nonlinear in the compression zone. The degree of reinforcement and the way the composite reinforcement is redistributed between the compression and tensile zones greatly influence the MOR value;
  • A high correspondence was obtained between the average values of EI bending stiffness estimated according to the method of equivalent characteristics (method 2) and the values derived from experimental tests (method 1). In the case of reinforcement with CFRP sheets and CFRP tapes glued to the external surface, the difference slightly exceeds 1%, and in the case of tapes glued into the grooves, less than 5%. The most significant discrepancies are recorded for reference beams—more than 7%. Of the three methods discussed for estimating the bending stiffness EI, method 3 (based on the formula for deflection at the center of the beam) differs the most from the others;
  • Changes in the shape of the curves describing changes in bending stiffness as well as the position of the neutral axis can be divided into three zones: initial (stabilization), middle (constant work), and final (decrease in stiffness). The final phase occurs only in the case of reinforced beams; the failure initiated in the compression zone—a significant reduction in bending stiffness. The equivalent cross-section most accurately describes the position of the neutral axis at failure for beams reinforced with sheets glued to the outer surfaces and CFRP laminates glued into the grooves. Beams reinforced with laminates glued to the bottom surface are the worst in this respect;
  • For the reinforcement simulation, using carbon sheets with an ultra-high modulus of elasticity proves the most beneficial due to the increased bending stiffness. In contrast, the least beneficial is the use of glass sheets. As the stiffness of the reinforcement and the number of sheets used increase, the effectiveness of the reinforcement increases.

Author Contributions

Conceptualization, M.M.B.; methodology, M.M.B. and P.G.K.; software, M.M.B.; validation, M.M.B.; formal analysis, M.M.B.; investigation, M.M.B.; writing—original draft preparation, M.M.B.; writing—review and editing, M.M.B. and P.G.K.; supervision, P.G.K. All authors have read and agreed to the published version of the manuscript.

Funding

The tests were implemented thanks to the financial support of the Kielce University of Technology within the framework of the statutory work No. 02.0.12.00/1.02.001 SUBB.BKWM.22.002.

Institutional Review Board Statement

Not applicable.

Informed Consent Statement

Not applicable.

Data Availability Statement

No new data were created or analyzed in this study. Data sharing is not applicable to this article.

Acknowledgments

Authors would like to thank S&P Polska Sp. z o.o. for providing the research materials.

Conflicts of Interest

The authors declare no conflict of interest.

References

  1. Burawska, I.; Tarasovs, S. Influence of glueline parameters on the mechanical behaviour of CFRP reinforced wood—Numerical analysis. Ann. Wars. Univ. Life Sci.–SGGW For. Wood Technol. 2014, 87, 18–24. [Google Scholar]
  2. Kula, K.; Socha, T. Renovation and strengthening of wooden beams with CFRP bands including rheological effects. Civ. Environ. Eng. Rep. 2016, 22, 93–102. [Google Scholar] [CrossRef] [Green Version]
  3. Nowak, T.P.; Jasieńko, J.; Czepiżak, D. Experimental tests and numerical analysis of historic bent timber elements reinforced with CFRP strips. Constr. Build. Mater. 2013, 40, 197–206. [Google Scholar] [CrossRef]
  4. Raftery, G.M.; Harte, A.M. Nonlinear numerical modeling of FRP reinforced glued laminated timber. Compos. Part B Eng. 2013, 52, 40–50. [Google Scholar] [CrossRef]
  5. Ye, L.; Wang, B.; Shao, P. Experimental and Numerical Analysis of a Reinforced Wood Lap Joint. Materials 2020, 13, 4117. [Google Scholar] [CrossRef] [PubMed]
  6. Chybiński, M.; Polus, Ł. Experimental and numerical investigations of laminated veneer lumber. Arch. Civ. Eng. 2021, 67, 351–372. [Google Scholar] [CrossRef]
  7. Chybiński, M.; Polus, Ł. Experimental and numerical investigations of aluminium-timber composite beams with bolted connections. Structures 2021, 34, 1942–1960. [Google Scholar] [CrossRef]
  8. Chybiński, M.; Polus, Ł. Structural Behaviour of Aluminium–Timber Composite Beams with Partial Shear Connections. Appl. Sci. 2023, 13, 1603. [Google Scholar] [CrossRef]
  9. Işleyen, U.K.; Kesik, H.İ. Experimental and numerical analysis of compression and bending strength of old wood reinforced with CFRP strips. Structures 2021, 33, 259–271. [Google Scholar] [CrossRef]
  10. Khelifa, M.; Loperena, N.V.; Bleron, L.; Khennane, A. Analysis of CFRP-strengthened timber beams. J. Adhes. Sci. Technol. 2014, 28, 1–14. [Google Scholar] [CrossRef]
  11. Makowski, A. Impact of the type and shape of the CFRP composite reinforcement on the improvement of strength parameters of wood combined elements. Electron. J. Pol. Agric. Univ. Wood Technol. 2006, 9, #37. Available online: http://www.ejpau.media.pl/volume9/issue4/art-37.html (accessed on 29 December 2022).
  12. Buchanan, A.H. Bending strength of lumber. J. Struct. Eng. (ASCE) 1990, 116, 1213–1229. [Google Scholar] [CrossRef]
  13. Borri, A.; Corradi, M.; Grazini, A.A. A method for flexural reinforcement of old wood beams with CFRP materials. Compos. Part B Eng. 2005, 36, 143–153. [Google Scholar] [CrossRef]
  14. Brady, J.F.; Harte, A.M. Prestressed FRP flexural strengthening of softwood glue-laminated timber beams. In Proceedings of World Conference on Timber Engineering (WCTE08), Miyazaki, Japan, 2–5 June 2008. [Google Scholar]
  15. Gentile, C.; Svecova, D.; Rizkalla, S.H. Timber beams strengthened with GFRP bars: Development and applications. J. Compos. Constr. 2002, 6, 11–20. [Google Scholar] [CrossRef]
  16. Vahedian, A.; Shrestha, R.; Crews, K. Experimental and analytical investigation on CFRP strengthened glulam laminated timber beams: Full-scale experiments. Compos. Part B Eng. 2019, 164, 377–389. [Google Scholar] [CrossRef]
  17. Hernandez, R.; Davalos, J.F.; Sonti, S.S.; Kim, Y.; Moody, R.C. Strength and Stiffness of Reinforced Yellow-Poplar Glued-Laminated Beams; Research Paper FPL-RP-554; Department of Agriculture, Forest Service, Forest Products Laboratory: Madison, WI, USA, 1997. [Google Scholar]
  18. Kliger, R.; Johansson, M.; Crocetti, R.; Al-Emrani, M. Strengthening timber with CFRP or steel plates–short and long-term performance. In Proceeding of World Conference on Timber Engineering (WCTE08), Miyazaki, Japan, 2–5 June 2008. [Google Scholar]
  19. Chen, S.; Wei, Y.; Ding, M.; Zhao, K.; Zheng, K. Combinatorial design and flexural behavior of laminated bamboo–timber composite beams. Thin-Walled Struct. 2022, 181, 109993. [Google Scholar] [CrossRef]
  20. Huang, S.; Yan, L.; Kasal, B. Flexural behaviour of wood beams strengthened by flax-glass hybrid FRP subjected to hygrothermal and weathering exposures. Constr. Build. Mater. 2023, 365, 130076. [Google Scholar] [CrossRef]
  21. Nadir, Y.; Nagarajan, P.; Ameen, M.; Arif, M.M. Flexural stiffness and strength enhancement of horizontally glued laminated wood beams with GFRP and CFRP composite sheets. Constr. Build. Mater. 2016, 112, 547–555. [Google Scholar] [CrossRef]
  22. Hoseinpour, H.; Valluzzi, M.R.; Garbin, E.; Panizza, M. Analytical investigation of timber beams strengthened with composite materials. Constr. Build. Mater. 2018, 191, 1242–1251. [Google Scholar] [CrossRef]
  23. Shekarchi, M.; Oskouei, A.V.; Raftery, G.M. Flexural behavior of timber beams strengthened with pultruded glass fiber reinforced polymer profiles. Compos. Struct. 2020, 241, 112062. [Google Scholar] [CrossRef]
  24. Di, J.; Zuo, H.; Li, Y.; Wang, Z. Design method for glulam beams strengthened with flax fiber reinforced polymer sheets. Structures 2023, 49, 26–43. [Google Scholar] [CrossRef]
  25. Yeboah, D.; Gkantou, M. Investigation of flexural behaviour of structural timber beams strengthened with NSM basalt and glass FRP bars. Structures 2021, 33, 390–405. [Google Scholar] [CrossRef]
  26. Kawecki, B.; Sumorek, A. Study on Profitability of Combining Wood and CFRP into Composite Based on Mechanical Performance of Bent Beams. Appl. Sci. 2022, 12, 10304. [Google Scholar] [CrossRef]
  27. Timbolmas, C.; Bravo, R.; Rescalvo, F.J.; Portela, M. Transformed-section method applied to multispecies glulam timber beams subjected to pure bending. Mech. Adv. Mater. Struct. 2021, 29, 1–10. [Google Scholar] [CrossRef]
  28. Timbolmas, C.; Bravo, R.; Rescalvo, F.J.; Gallego, A. Development of analytical model to predict the bending behavior of composite glulam beams in tension and compression. J. Build. Eng. 2022, 45, 103471. [Google Scholar] [CrossRef]
  29. Halicka, A.; Ślósarz, S. Strengthening of timber beams with pretensioned CFRP strips. Structures 2021, 34, 2912–2921. [Google Scholar] [CrossRef]
  30. Bakalarz, M.; Kossakowski, P. Strengthening of full-scale laminated veneer lumber beams with CFRP sheets. Materials 2022, 15, 6526. [Google Scholar] [CrossRef]
  31. Bakalarz, M. Load bearing capacity of laminated veneer lumber beams strengthened with CFRP strips. Arch. Civ. Eng. 2021, 67, 139–155. [Google Scholar]
  32. Bakalarz, M.M.; Kossakowski, P.G.; Tworzewski, P. Strengthening of Bent LVL Beams with Near-Surface Mounted (NSM) FRP Reinforcement. Materials 2020, 13, 2350. [Google Scholar] [CrossRef]
  33. Bakalarz, M.M.; Tworzewski, P.G. Application of Digital Image Correlation to Evaluate Strain, Stiffness and Ductility of Full-Scale LVL Beams Strengthened by CFRP. Materials 2023, 16, 1309. [Google Scholar] [CrossRef]
  34. Masłowski, E.; Spiżewska, D. Wzmacnianie Konstrukcji Budowlanych; Wydawnictwo Arkady: Warsaw, Poland, 2000. [Google Scholar]
  35. Rudziński, L. Konstrukcje Drewniane. Naprawy, Wzmocnienia, Przykłady Obliczeń; Wydawnictwo Politechniki Świętokrzyskiej: Kielce, Poland, 2010. [Google Scholar]
  36. S&P C-Sheet 240—Technical Information. Available online: https://www.sp-reinforcement.pl/sites/default/files/field_product_col_doc_file/c-sheet_240_polska_ver20190627.pdf (accessed on 19 September 2022).
  37. Kossakowski, P. Materiały Pomocnicze do Laboratorium Wytrzymałości Materiałów; Wydawnictwo Politechniki Świętokrzyskiej: Kielce, Poland, 2008. [Google Scholar]
  38. S&P A-Sheet 120—Technical Information. Available online: https://www.sp-reinforcement.pl/sites/default/files/field_product_col_doc_file/a_sheet_120_polska_ver012019-low.pdf (accessed on 29 December 2022).
  39. S&P G-Sheet E 90/10, Typ B; S&P G-Sheet AR 90/10, Typ B—Technical Information. Available online: https://www.sp-reinforcement.pl/sites/default/files/field_product_col_doc_file/g_sheet_e_ar_90_10_typ_b_polska_ver012019_low.pdf (accessed on 29 December 2022).
  40. S&P C-Sheet 640—Technical Information. Available online: https://www.sp-reinforcement.pl/sites/default/files/field_product_col_doc_file/c-_sheet_640_polska_ver012019_low.pdf (accessed on 29 December 2022).
Figure 1. Tested series: unreinforced beam (A series); beam reinforced with one layer of CFRP sheet (B series); beam reinforced with two layers of CFRP sheet bonded in tension zone (C series); beam reinforced with two layers of CFRP sheet covering entire side surface with overlap in tension zone (D series); beam reinforced with two CFRP laminate inserts bonded into pre-drilled grooves (E series); beam strengthen with CFRP laminate bonded to bottom side (F series) [33].
Fibers 11 00024 g001
Figure 2. Selected cross-section cut out of tested beams: (a) unreinforced beam (A series); (b) beam reinforced with one layer of CFRP sheet; (c) beam reinforced with two layers of CFRP sheet bonded in tension zone; (d) beam reinforced with two layers of CFRP sheet covering entire side surface with overlap in tension zone (D series); (e) beam reinforced with two CFRP laminate inserts bonded into pre-drilled grooves (E series); (f) beam strengthen with CFRP laminate bonded to bottom side (F series).
Fibers 11 00024 g002
Figure 3. Transformed cross-section of reinforced beams: (a) beam reinforced with one layer of CFRP sheet (B series); (b) beam reinforced with two layers of CFRP sheet bonded one on another (C series); (c) beam reinforced with two layers of CFRP sheet (D series); (d) beam reinforced with two CFRP laminate inserts bonded into pre-drilled grooves (E series); (e) beam reinforced with CFRP laminate bonded to bottom side (F series).
Fibers 11 00024 g003
Figure 4. Curvature of bent beam—designations.
Fibers 11 00024 g004
Figure 5. Position of neutral axis at specific load value.
Fibers 11 00024 g005
Figure 6. Average values of: (a) modulus of rupture (MOR); (b) experimental bending moment M; (c) theoretical bending moment Mtheo.
Fibers 11 00024 g006
Figure 7. Bending stiffness EI1 versus bending moment M curves: (a) A series; (b) B series; (c) C series; (d) D series; (e) E series; (f) F series.
Fibers 11 00024 g007aFibers 11 00024 g007b
Figure 8. Characteristic phases of bending stiffness changes during bending tests.
Fibers 11 00024 g008
Figure 9. Average values of bending stiffness EI.
Fibers 11 00024 g009
Figure 10. Changes in position of neutral axis for beam: (a) A1; (b) B1; (c) C1; (d) D1; (e) E1; (f) F1.
Fibers 11 00024 g010
Figure 11. Characteristic phases of neutral axis position changes during bending tests.
Fibers 11 00024 g011
Table 1. Relative differences between the values calculated by methods 2 and 3 in respect to method 1.
SeriesABCDEF
Method 2−7.57%−1.25%0.24%1.05%−4.97%−1.14%
Method 3−19.56%−14.60%−17.15%−22.24%−17.69%−16.25%
Table 2. Average values of offset of neutral axis from geometric centroid of beam at failure.
SeriesPosition of Neutral Axis c [cm]
Based on Strain DistributionTransformed Cross-Section
A0.220.00
B−0.62−0.83 (−25%)
C−1.12−1.39 (−19%)
D−0.87−0.85 (2%)
E−0.44−0.67 (−33%)
F−2.04−1.01 (102%)
Table 3. Selected mechanical and physical parameters of composites [38,39,40].
Sheet TypeAFRP Sheet S&P A-Sheet 120GFRP Sheet S&P G-Sheet E 90/10BCFRP UHM Sheet S&P C-Sheet 640
Modulus of elasticity Ef [GPa]12073640
Tensile strength ft,f [MPa]290034002600
Density ρf [kg/m3]145026002120
Elongation at rupture εf [%]2.54.50.4
Thickness for dimensioning tf [mm]0.2000.3080.189
Table 4. Predicted values of bending stiffness and position of neutral axis for reinforced LVL beams.
Sheet TypeAFRP Sheet S&P A-Sheet 120GFRP Sheet S&P G-Sheet E 90/10BCFRP UHM Sheet S&P C-Sheet 640
Number of Layers123123123
Bending stiffness EI2 [kNm2]48555662548155061874210511354
Position of neutral axis c [cm]−0.28−0.54−0.75−0.26−0.51−0.72−1.06−1.55−1.83
Disclaimer/Publisher’s Note: The statements, opinions and data contained in all publications are solely those of the individual author(s) and contributor(s) and not of MDPI and/or the editor(s). MDPI and/or the editor(s) disclaim responsibility for any injury to people or property resulting from any ideas, methods, instructions or products referred to in the content.

