

Engineering Properties of Waste Badminton String Fiber
Abstract
:1. Introduction
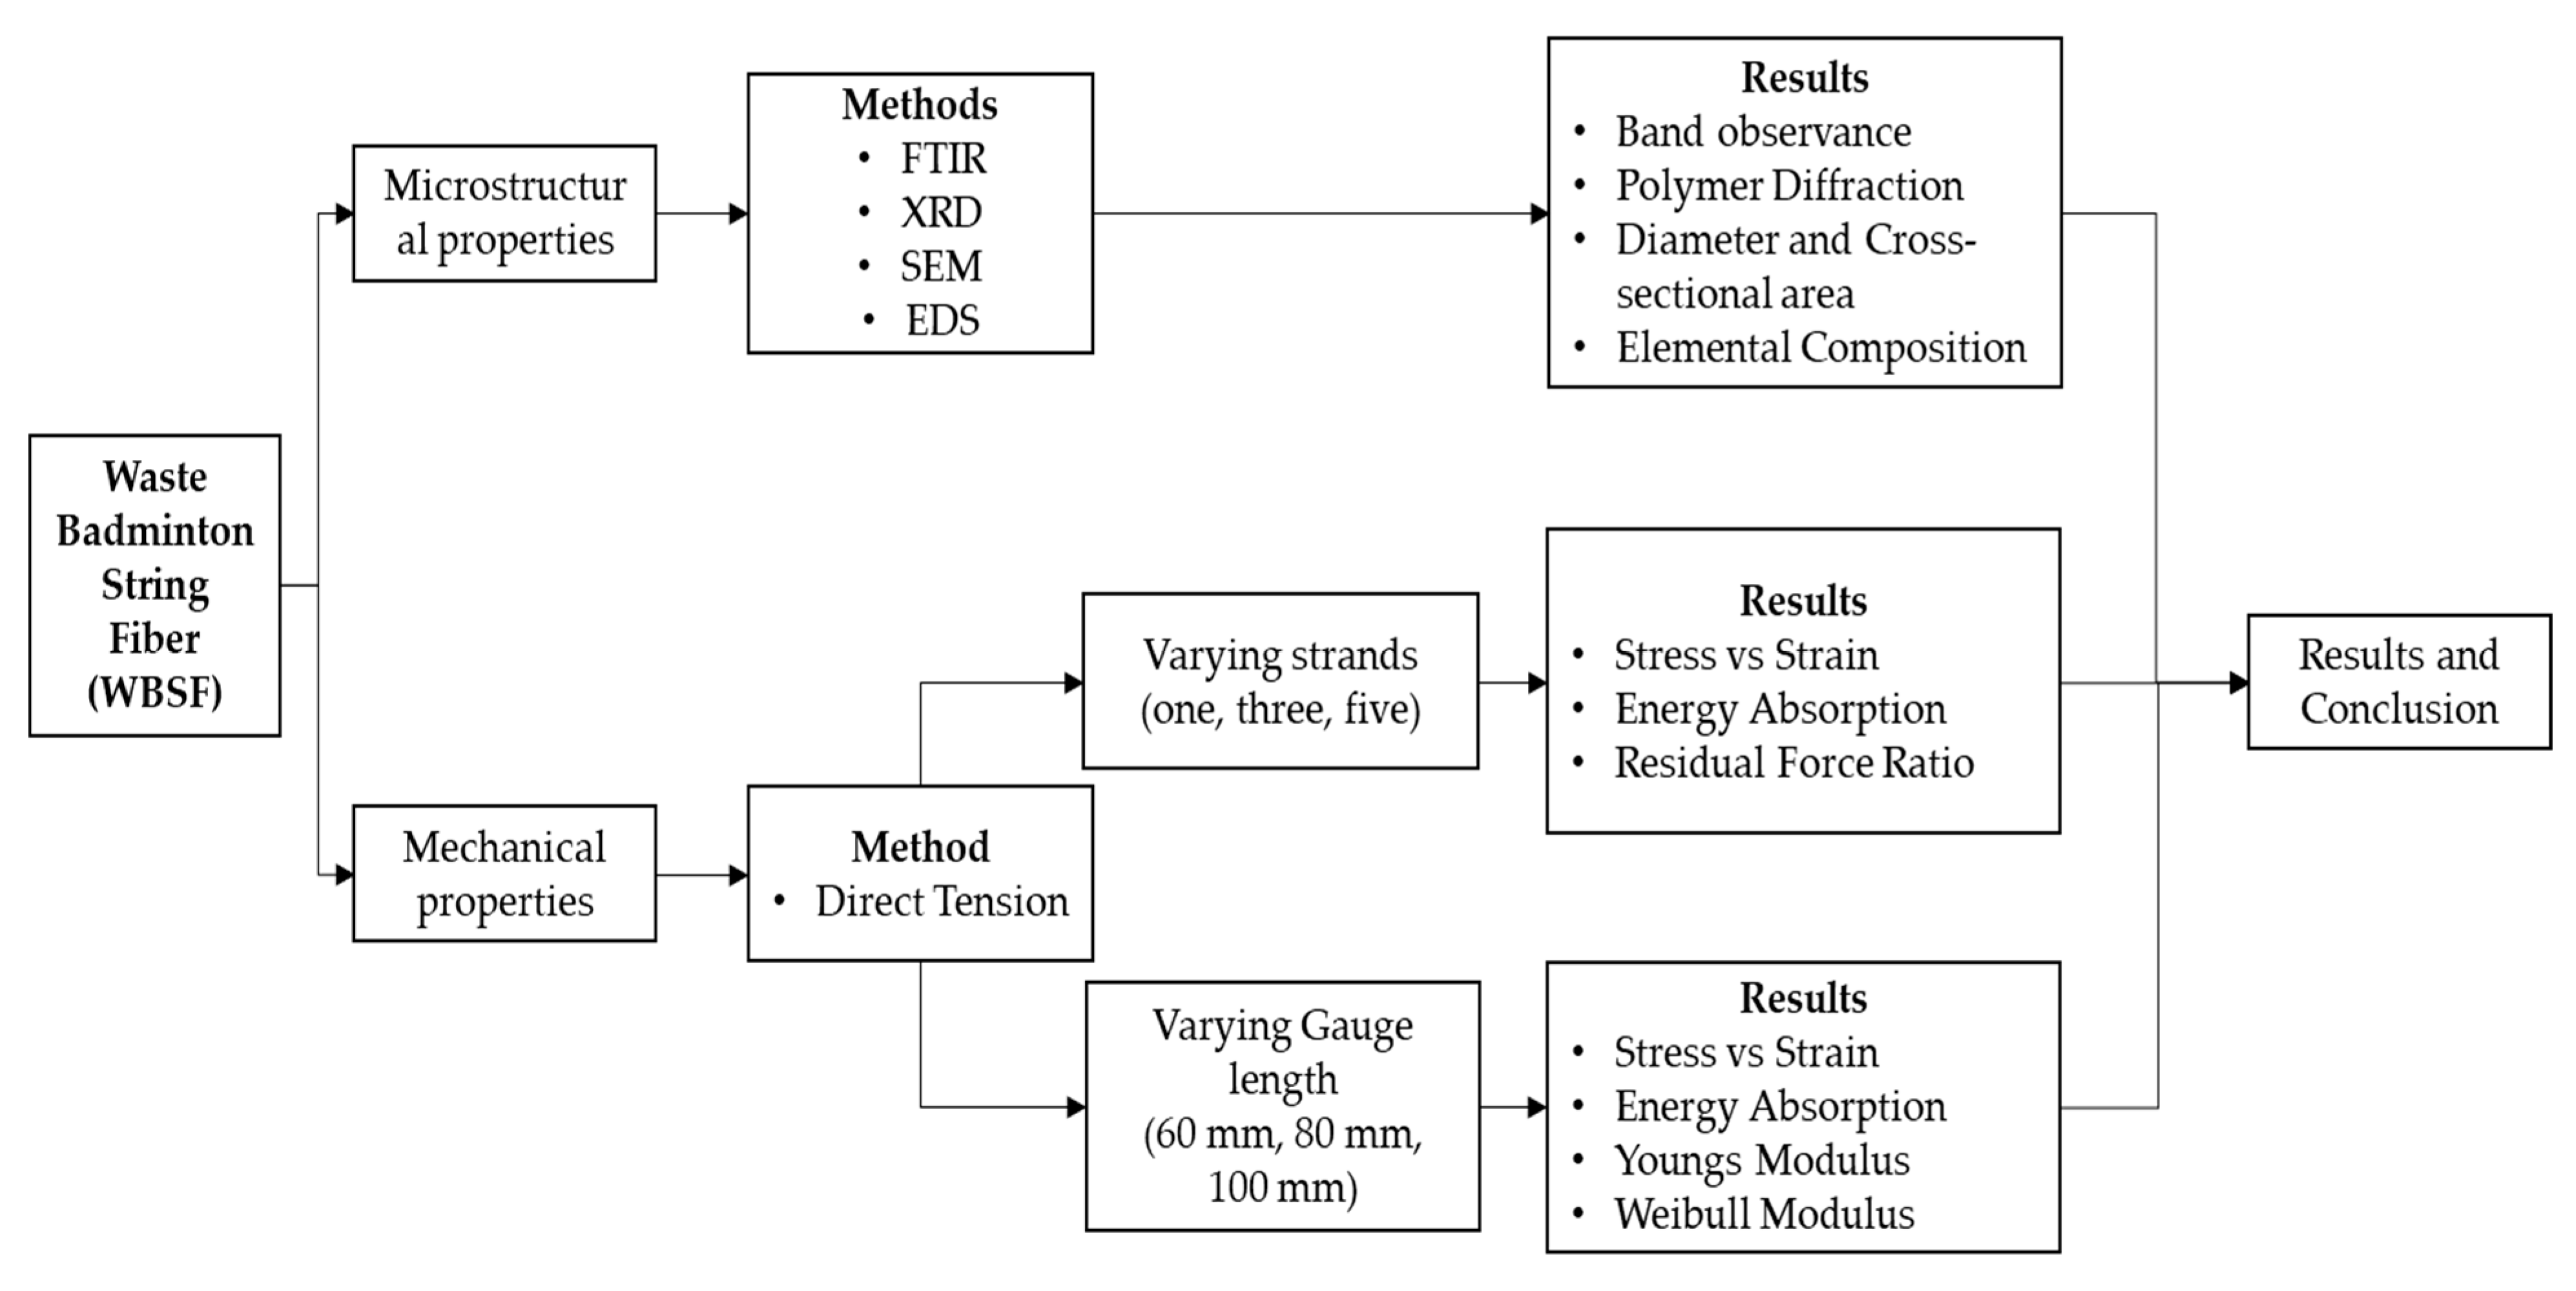
2. Methodology
3. Experimental Methods
3.1. Microstructural Analysis
3.1.1. Fourier Transform Infrared Spectroscopy
3.1.2. X-ray Diffraction
3.1.3. Scanning Electron Microscopy and Energy Dispersion Spectroscopy
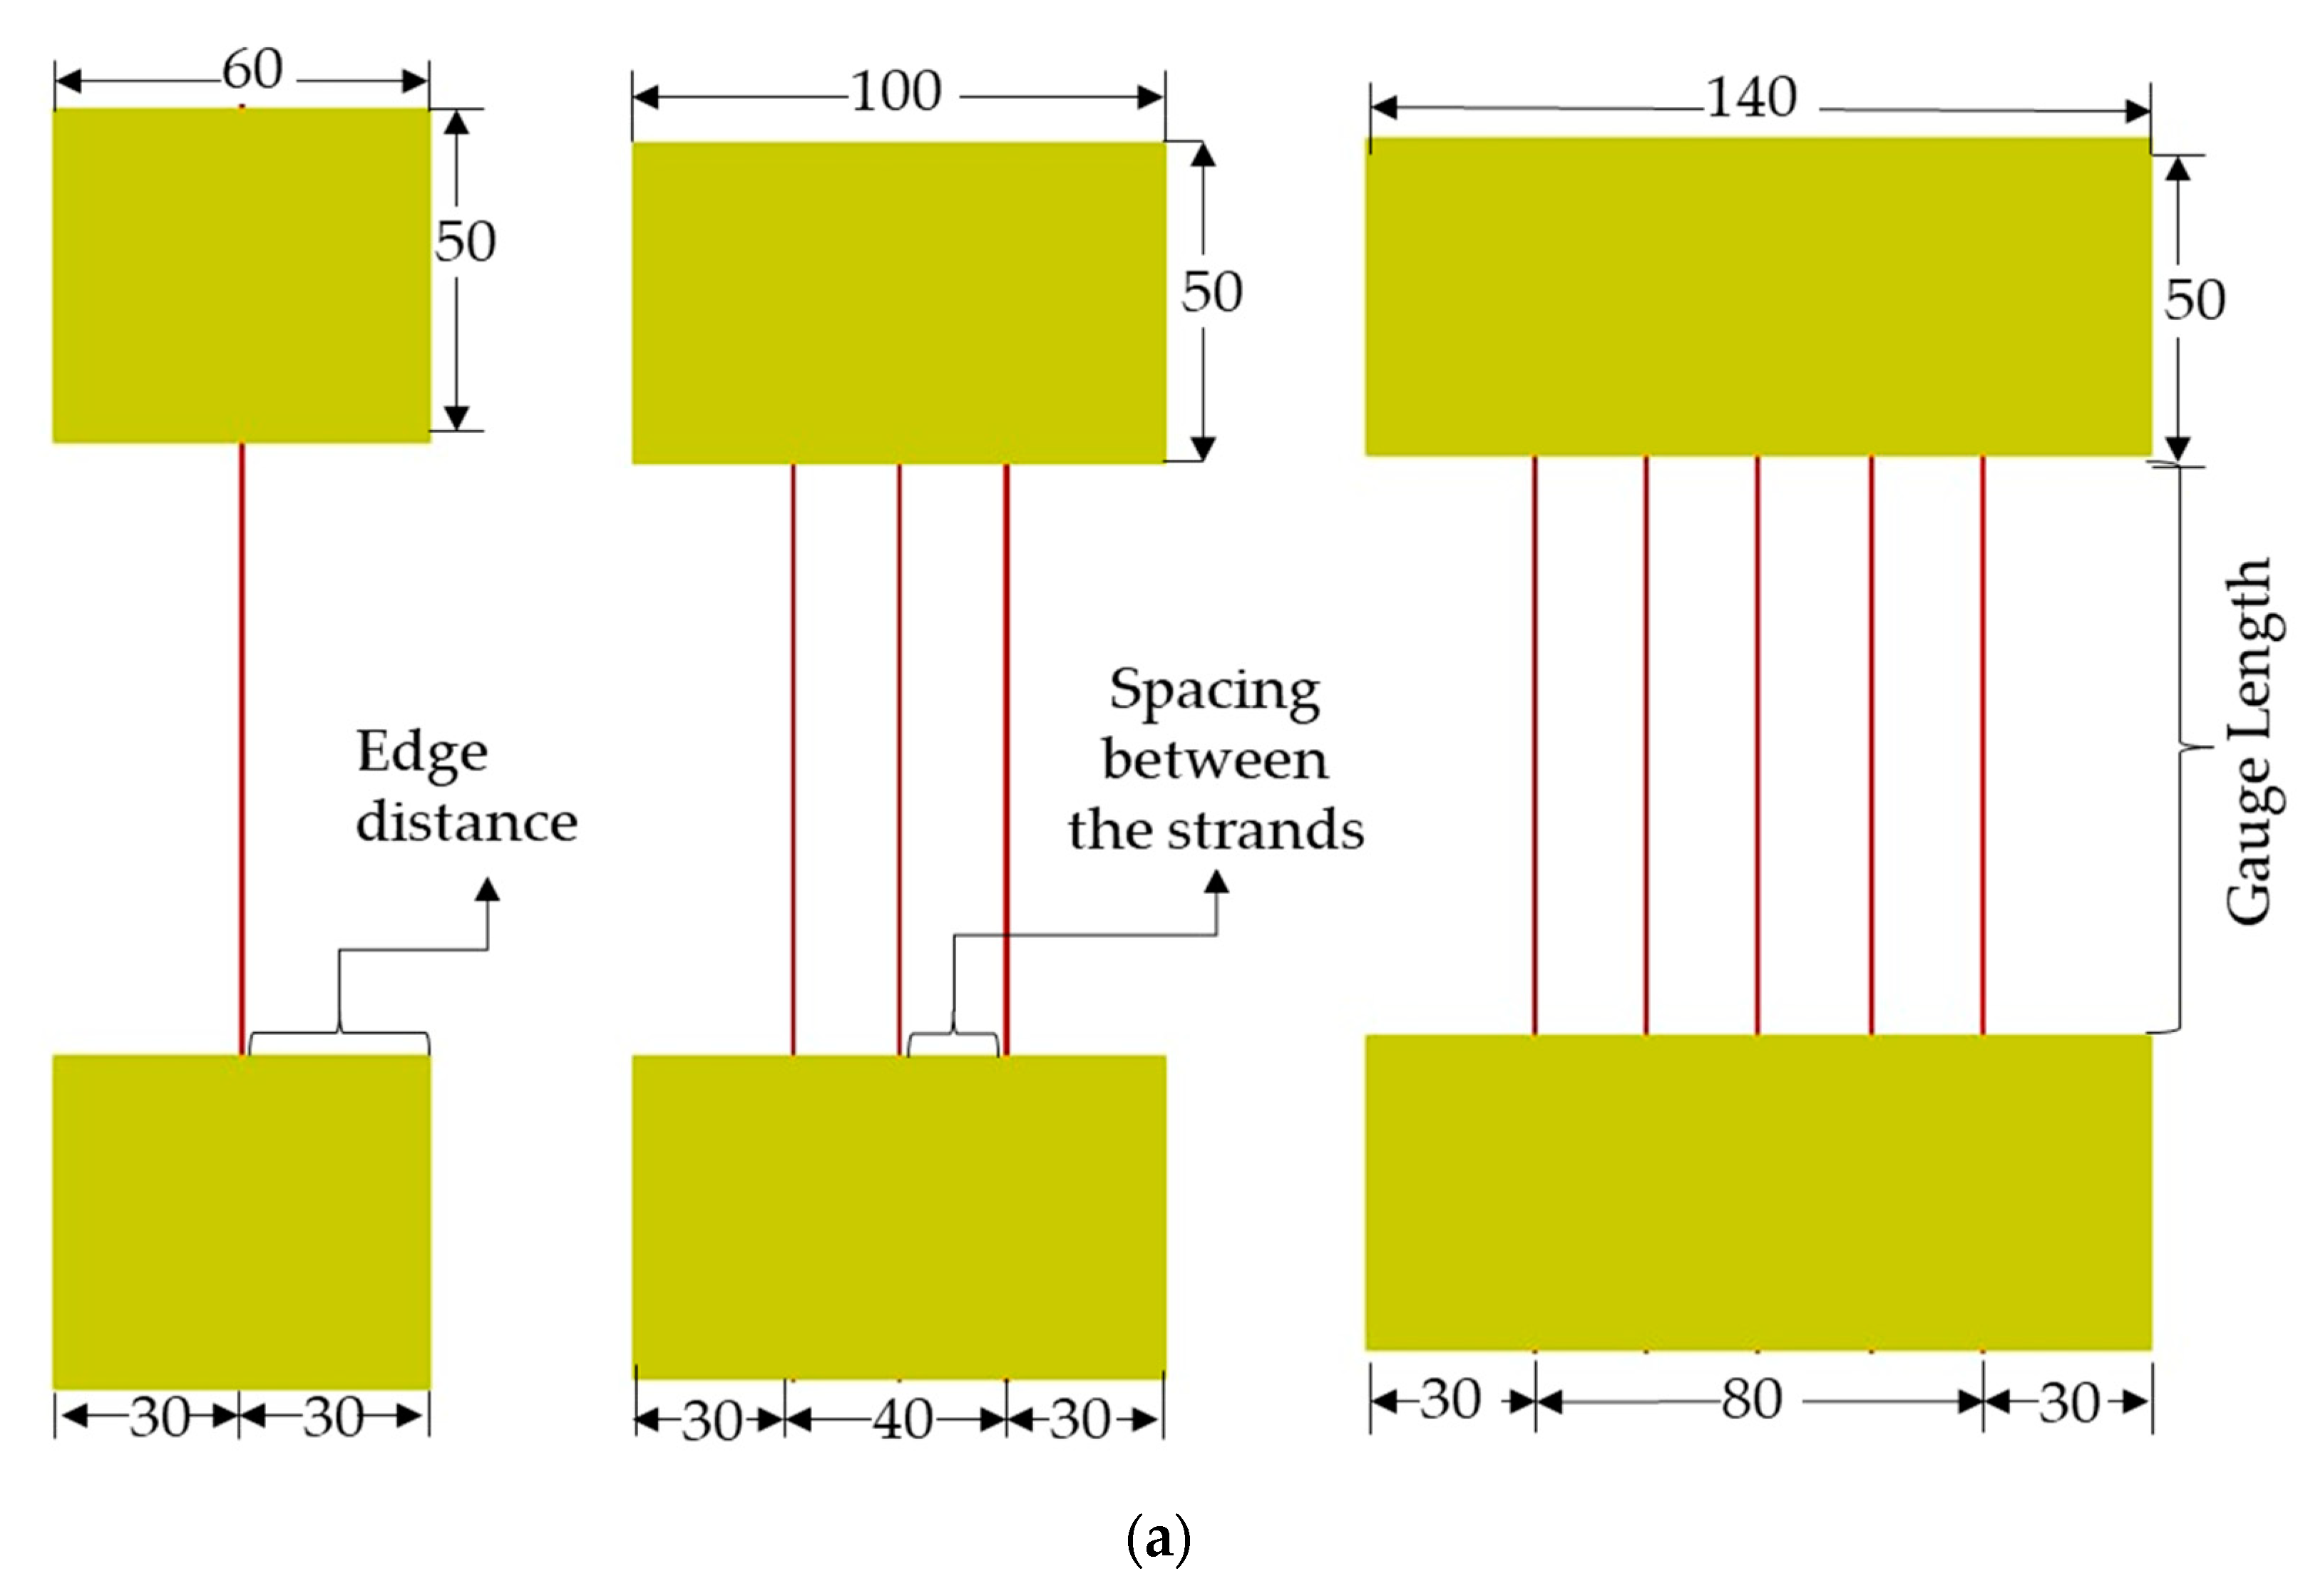
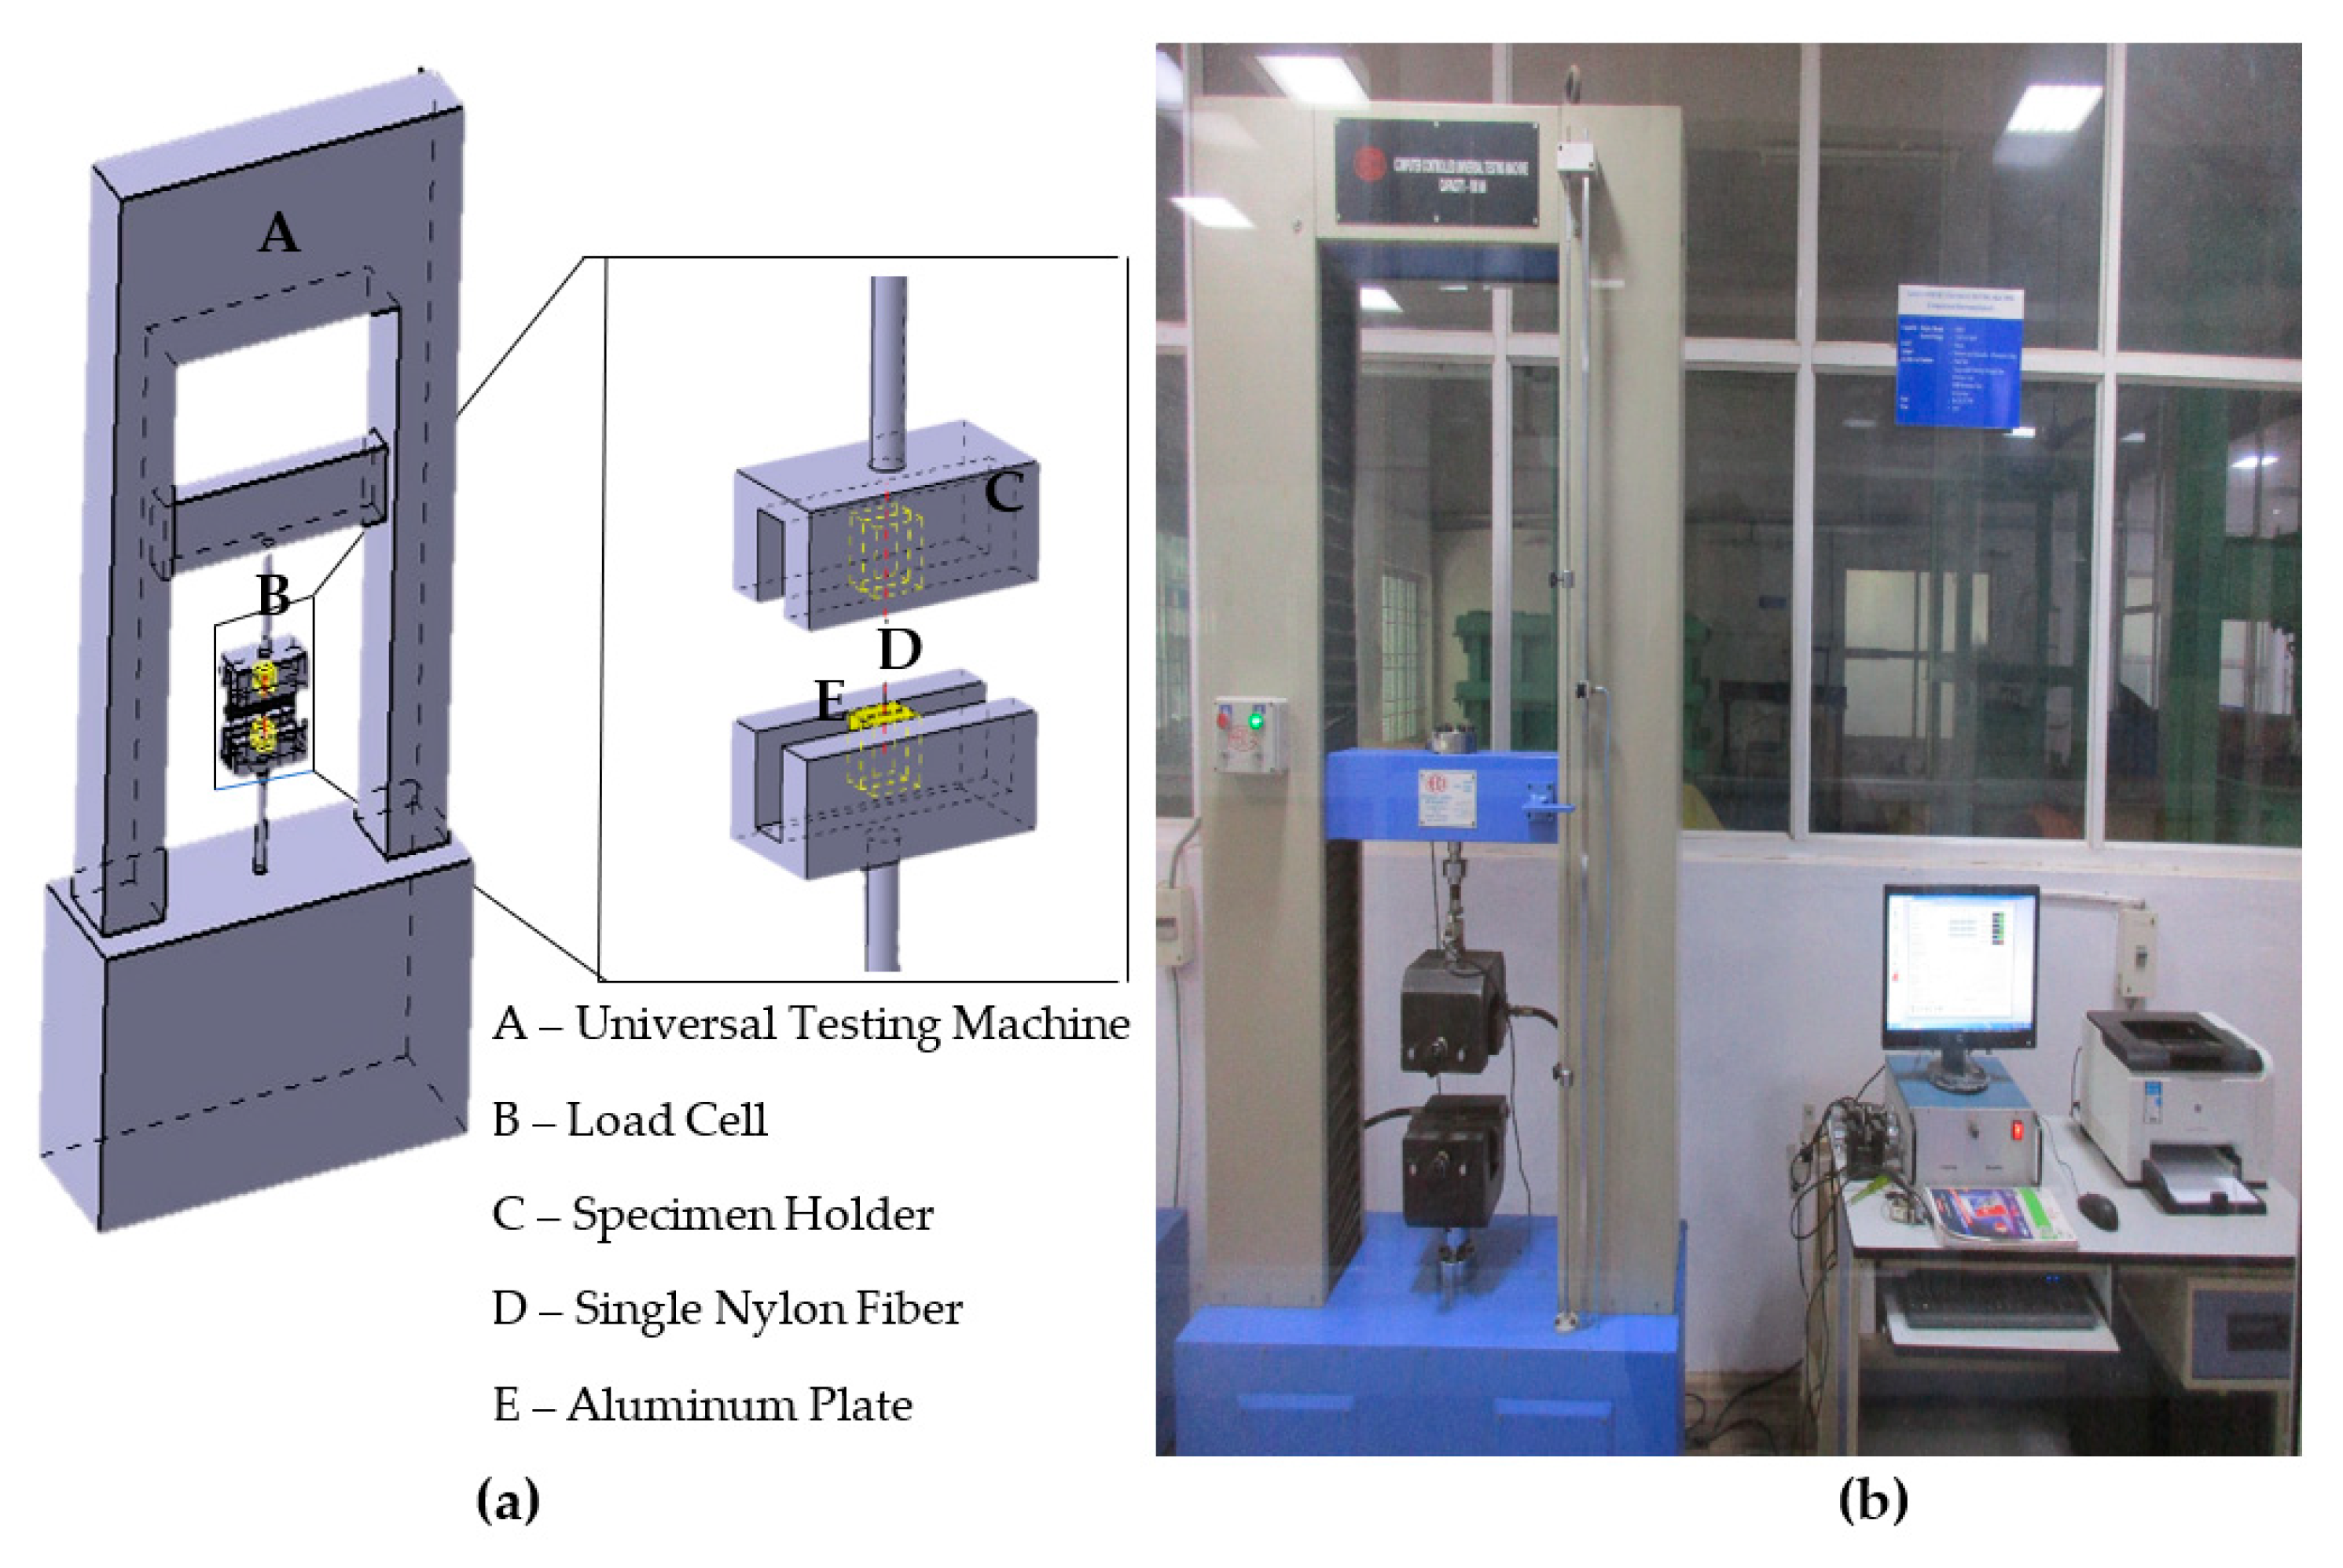
3.2. Mechanical Study
4. Results and Discussion
4.1. Microstructural Analysis
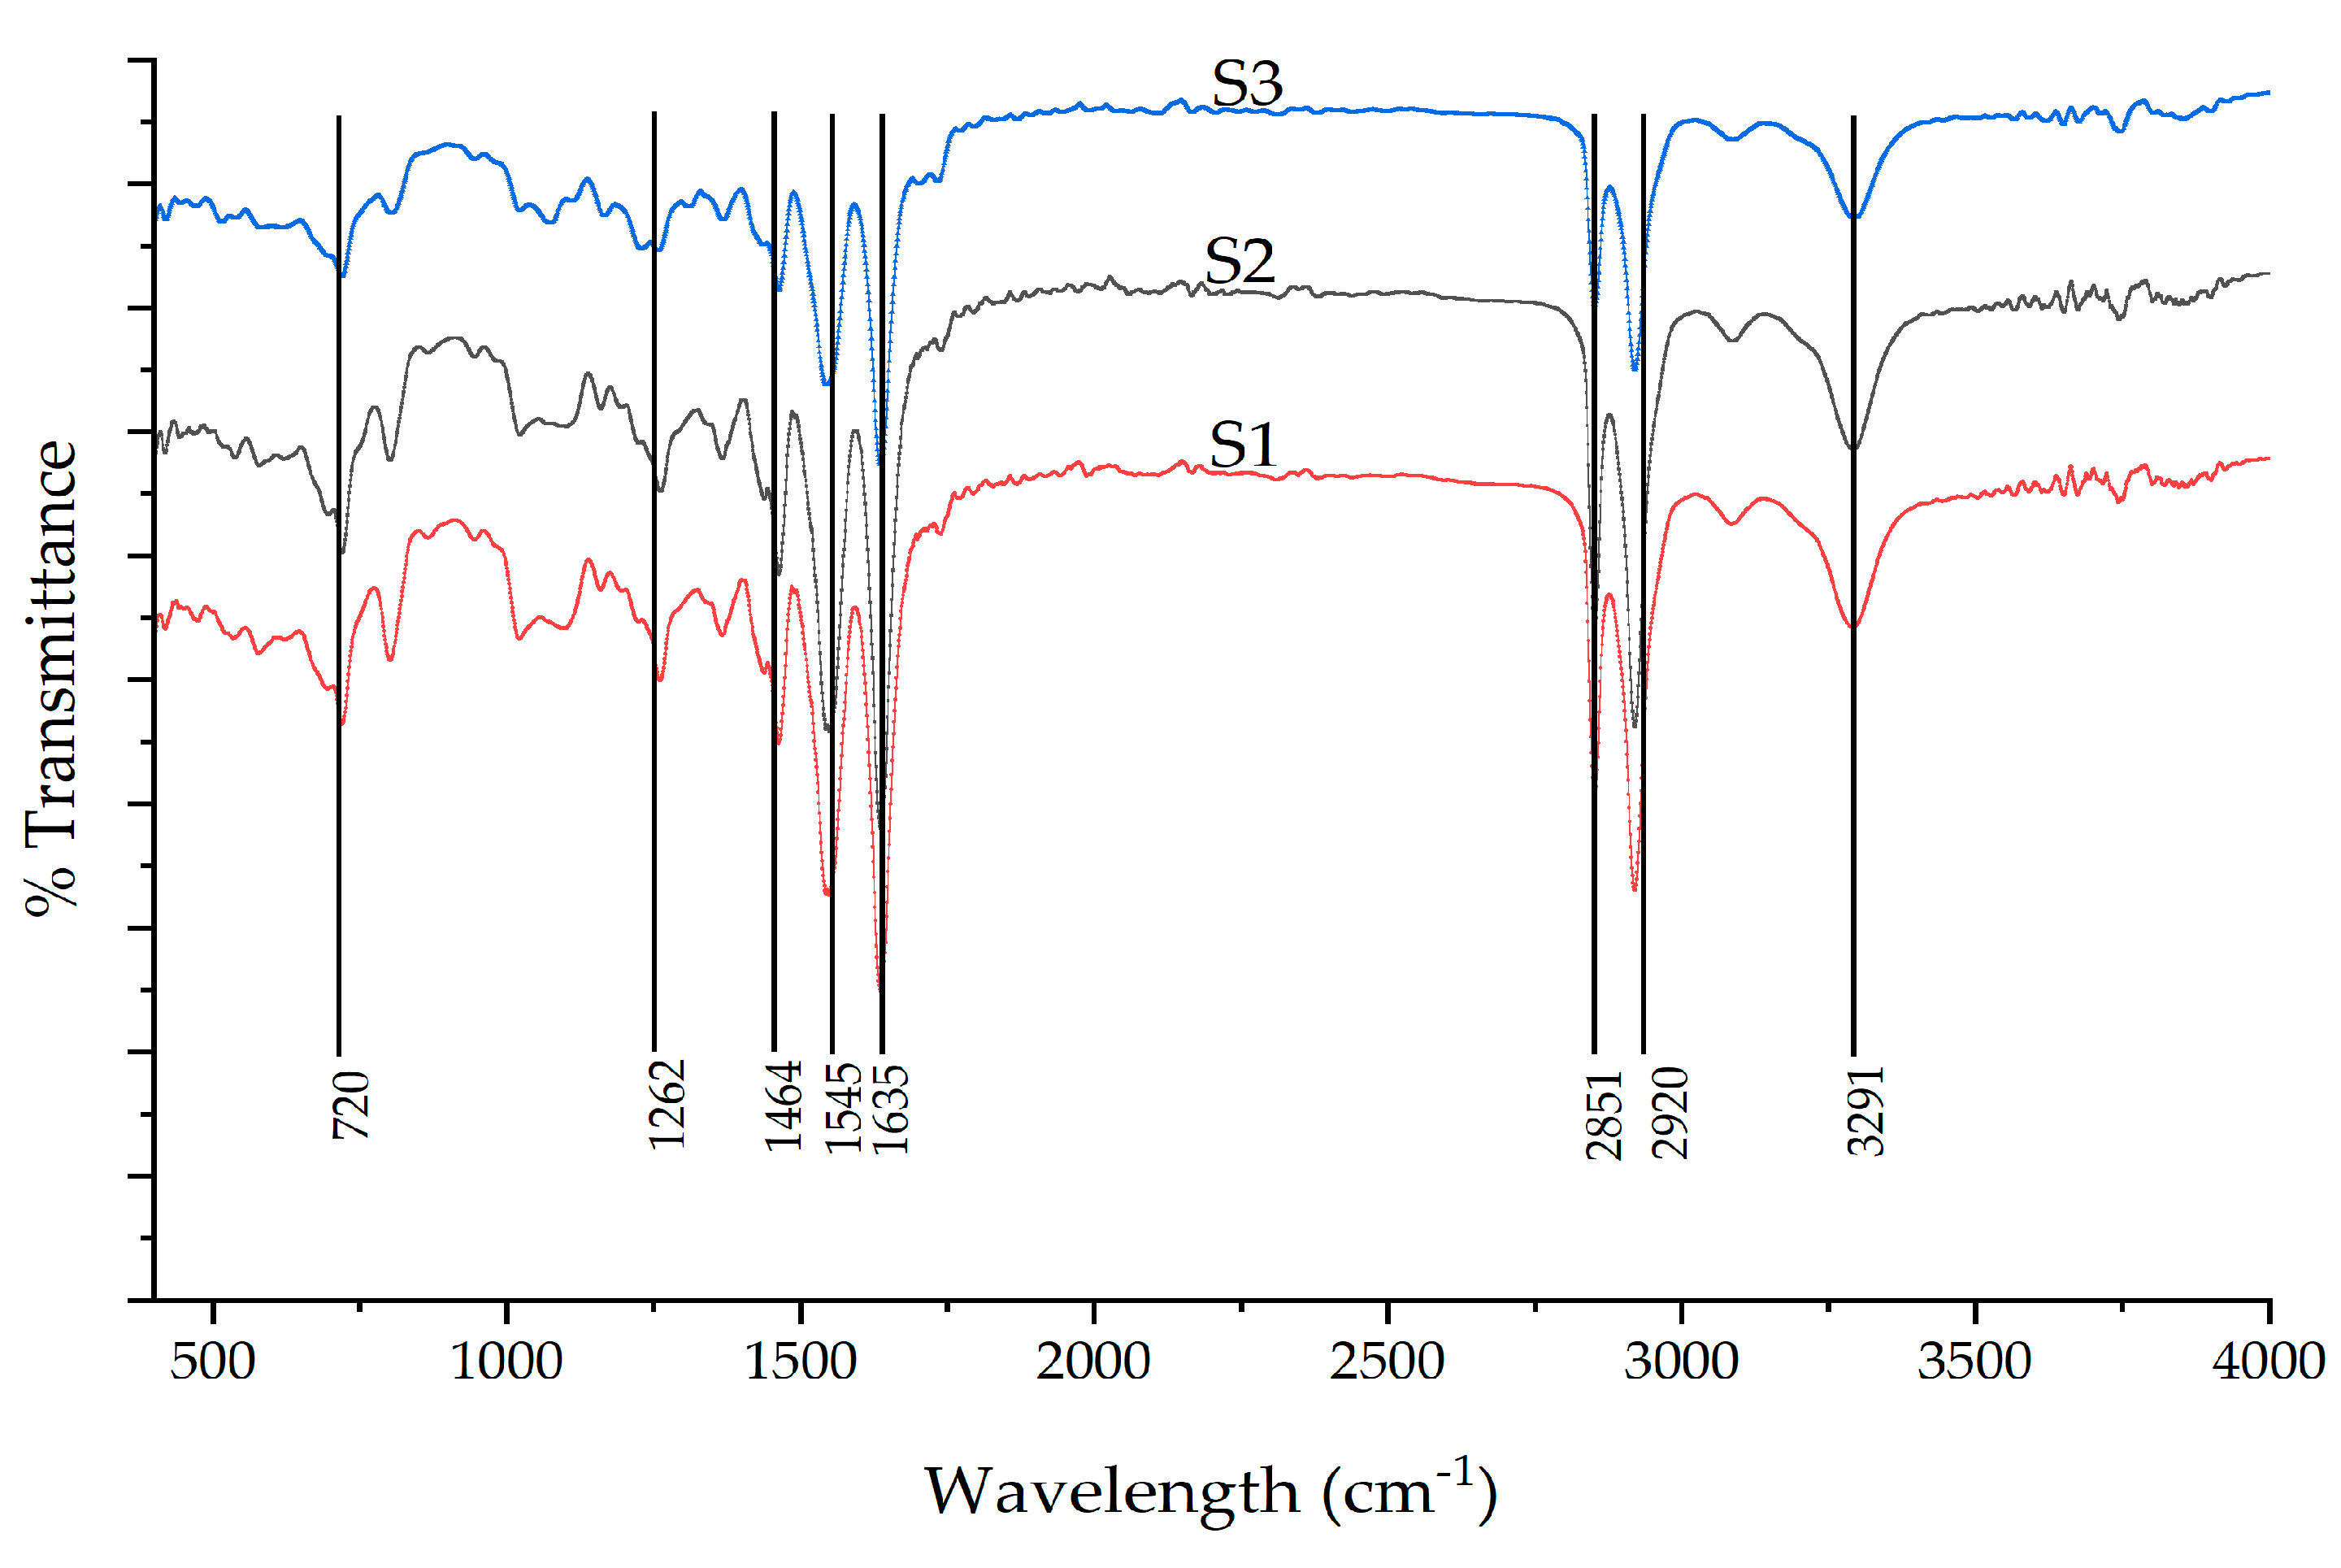
4.1.1. Fourier Transform Infrared Spectroscopy
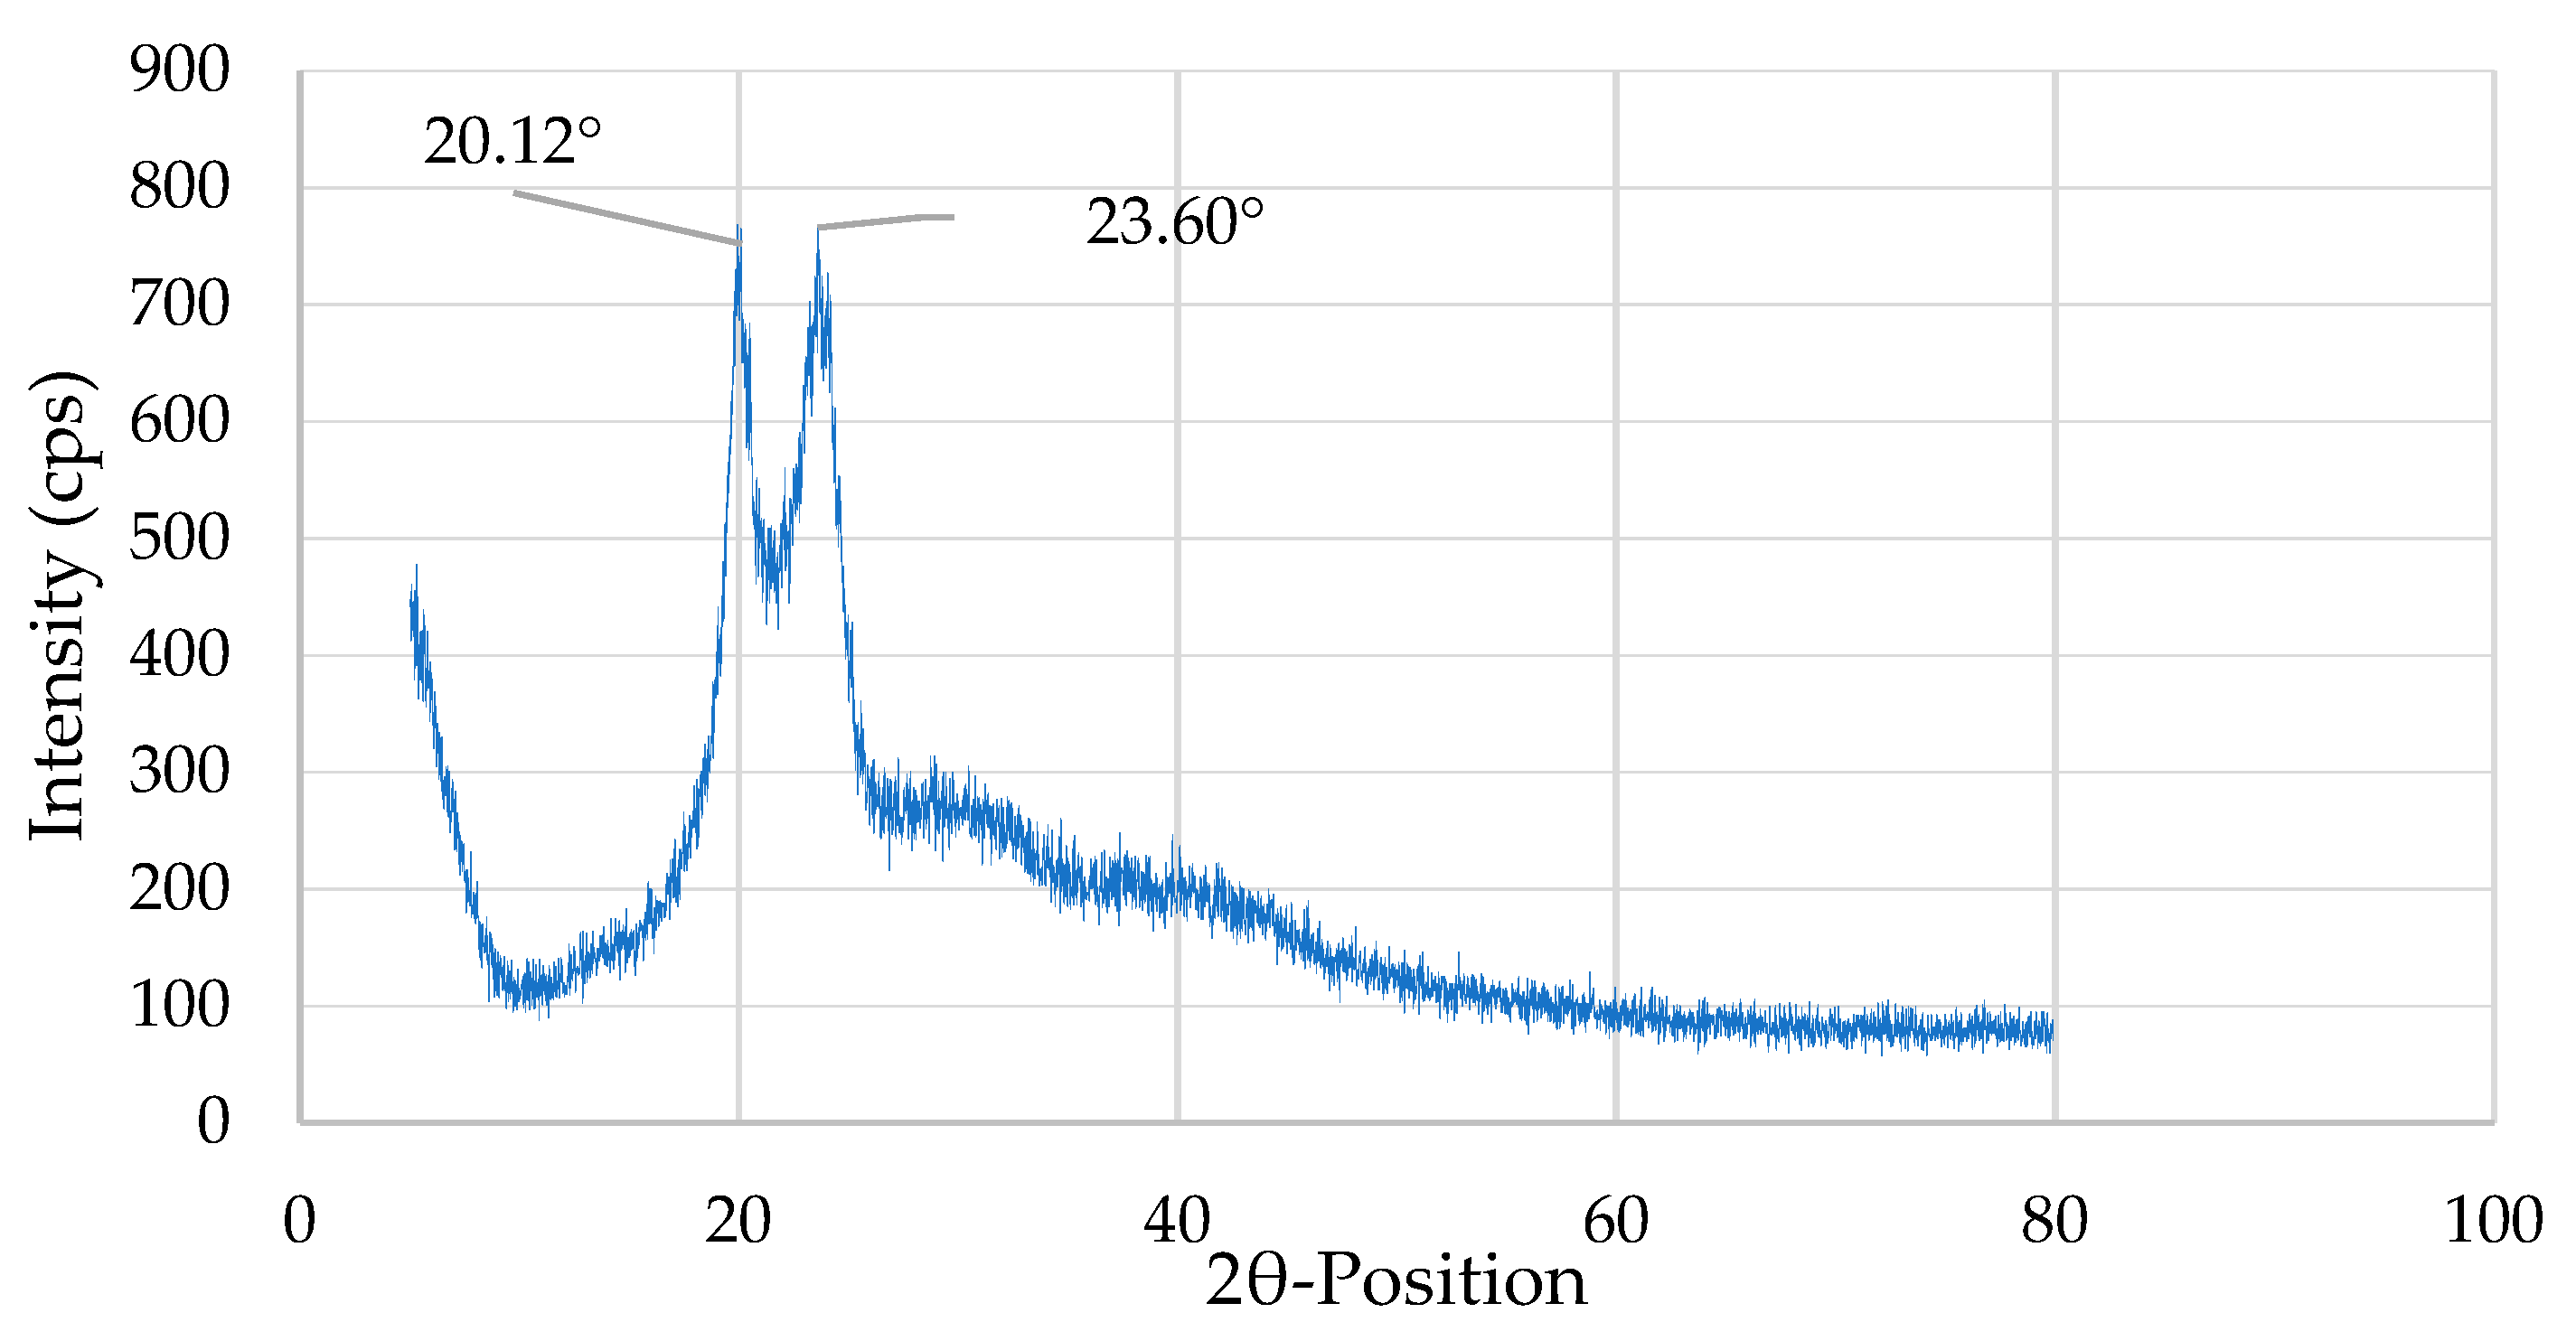
4.1.2. X-ray Spectroscopy
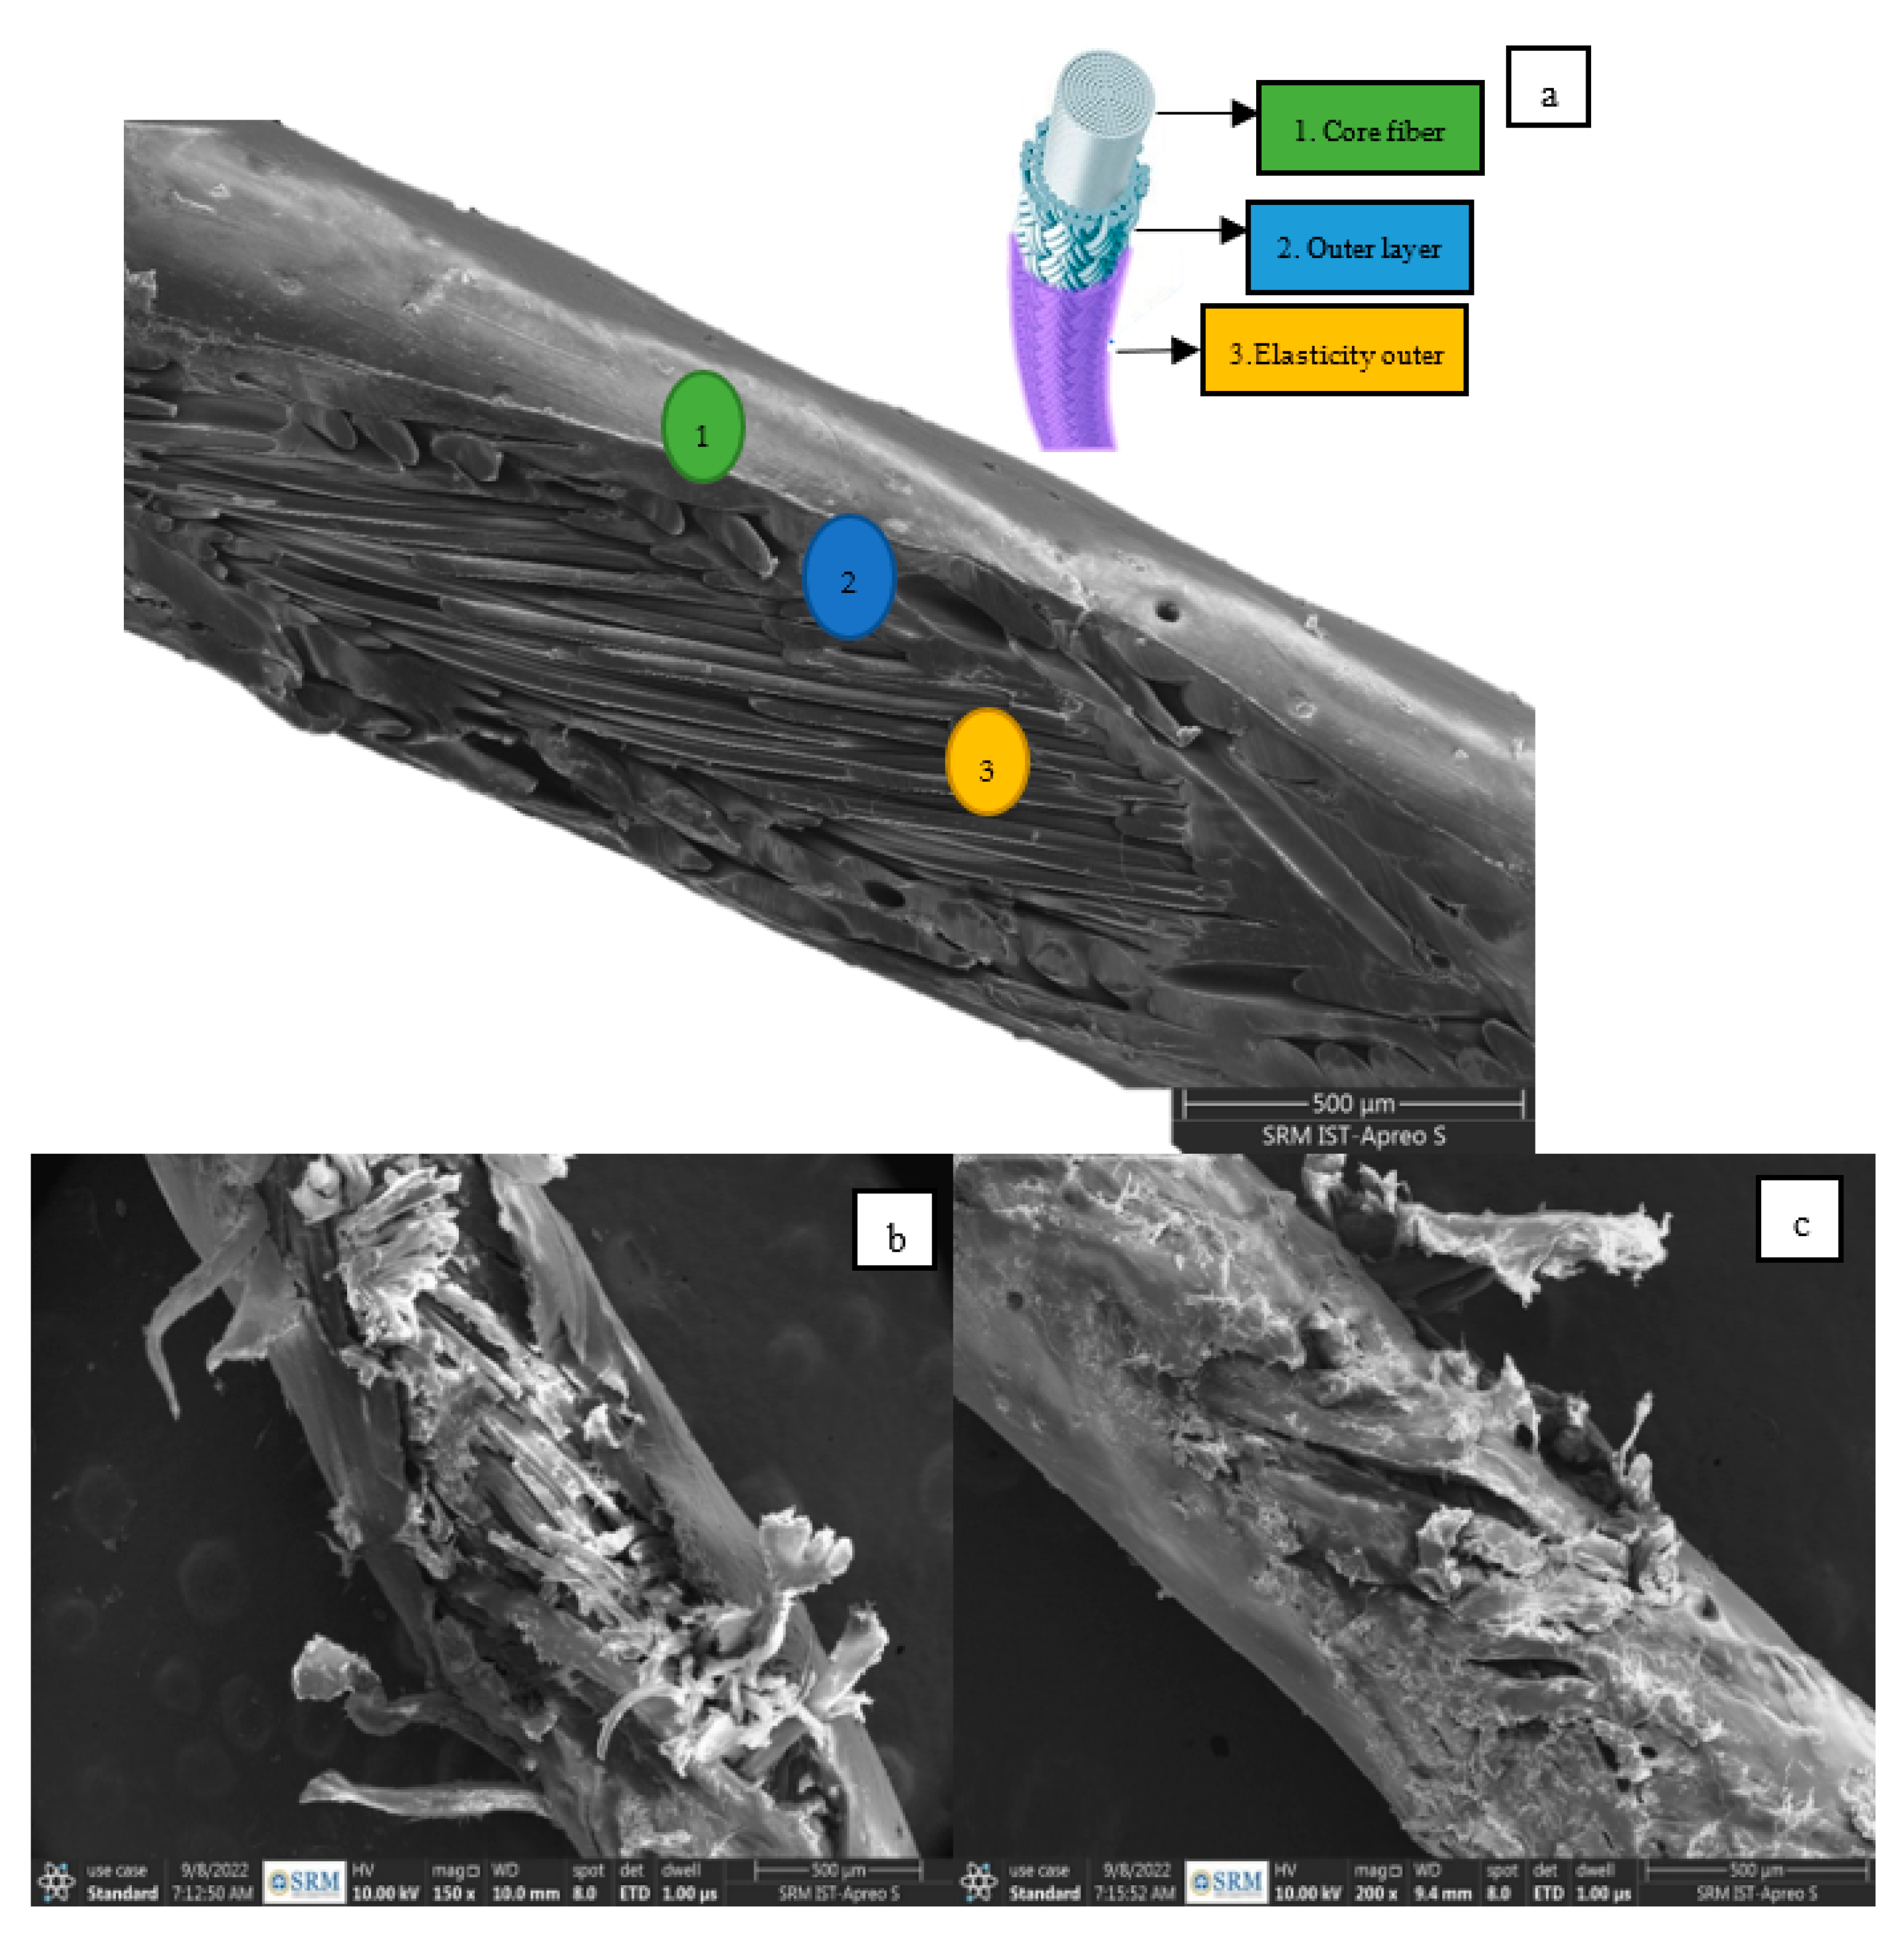
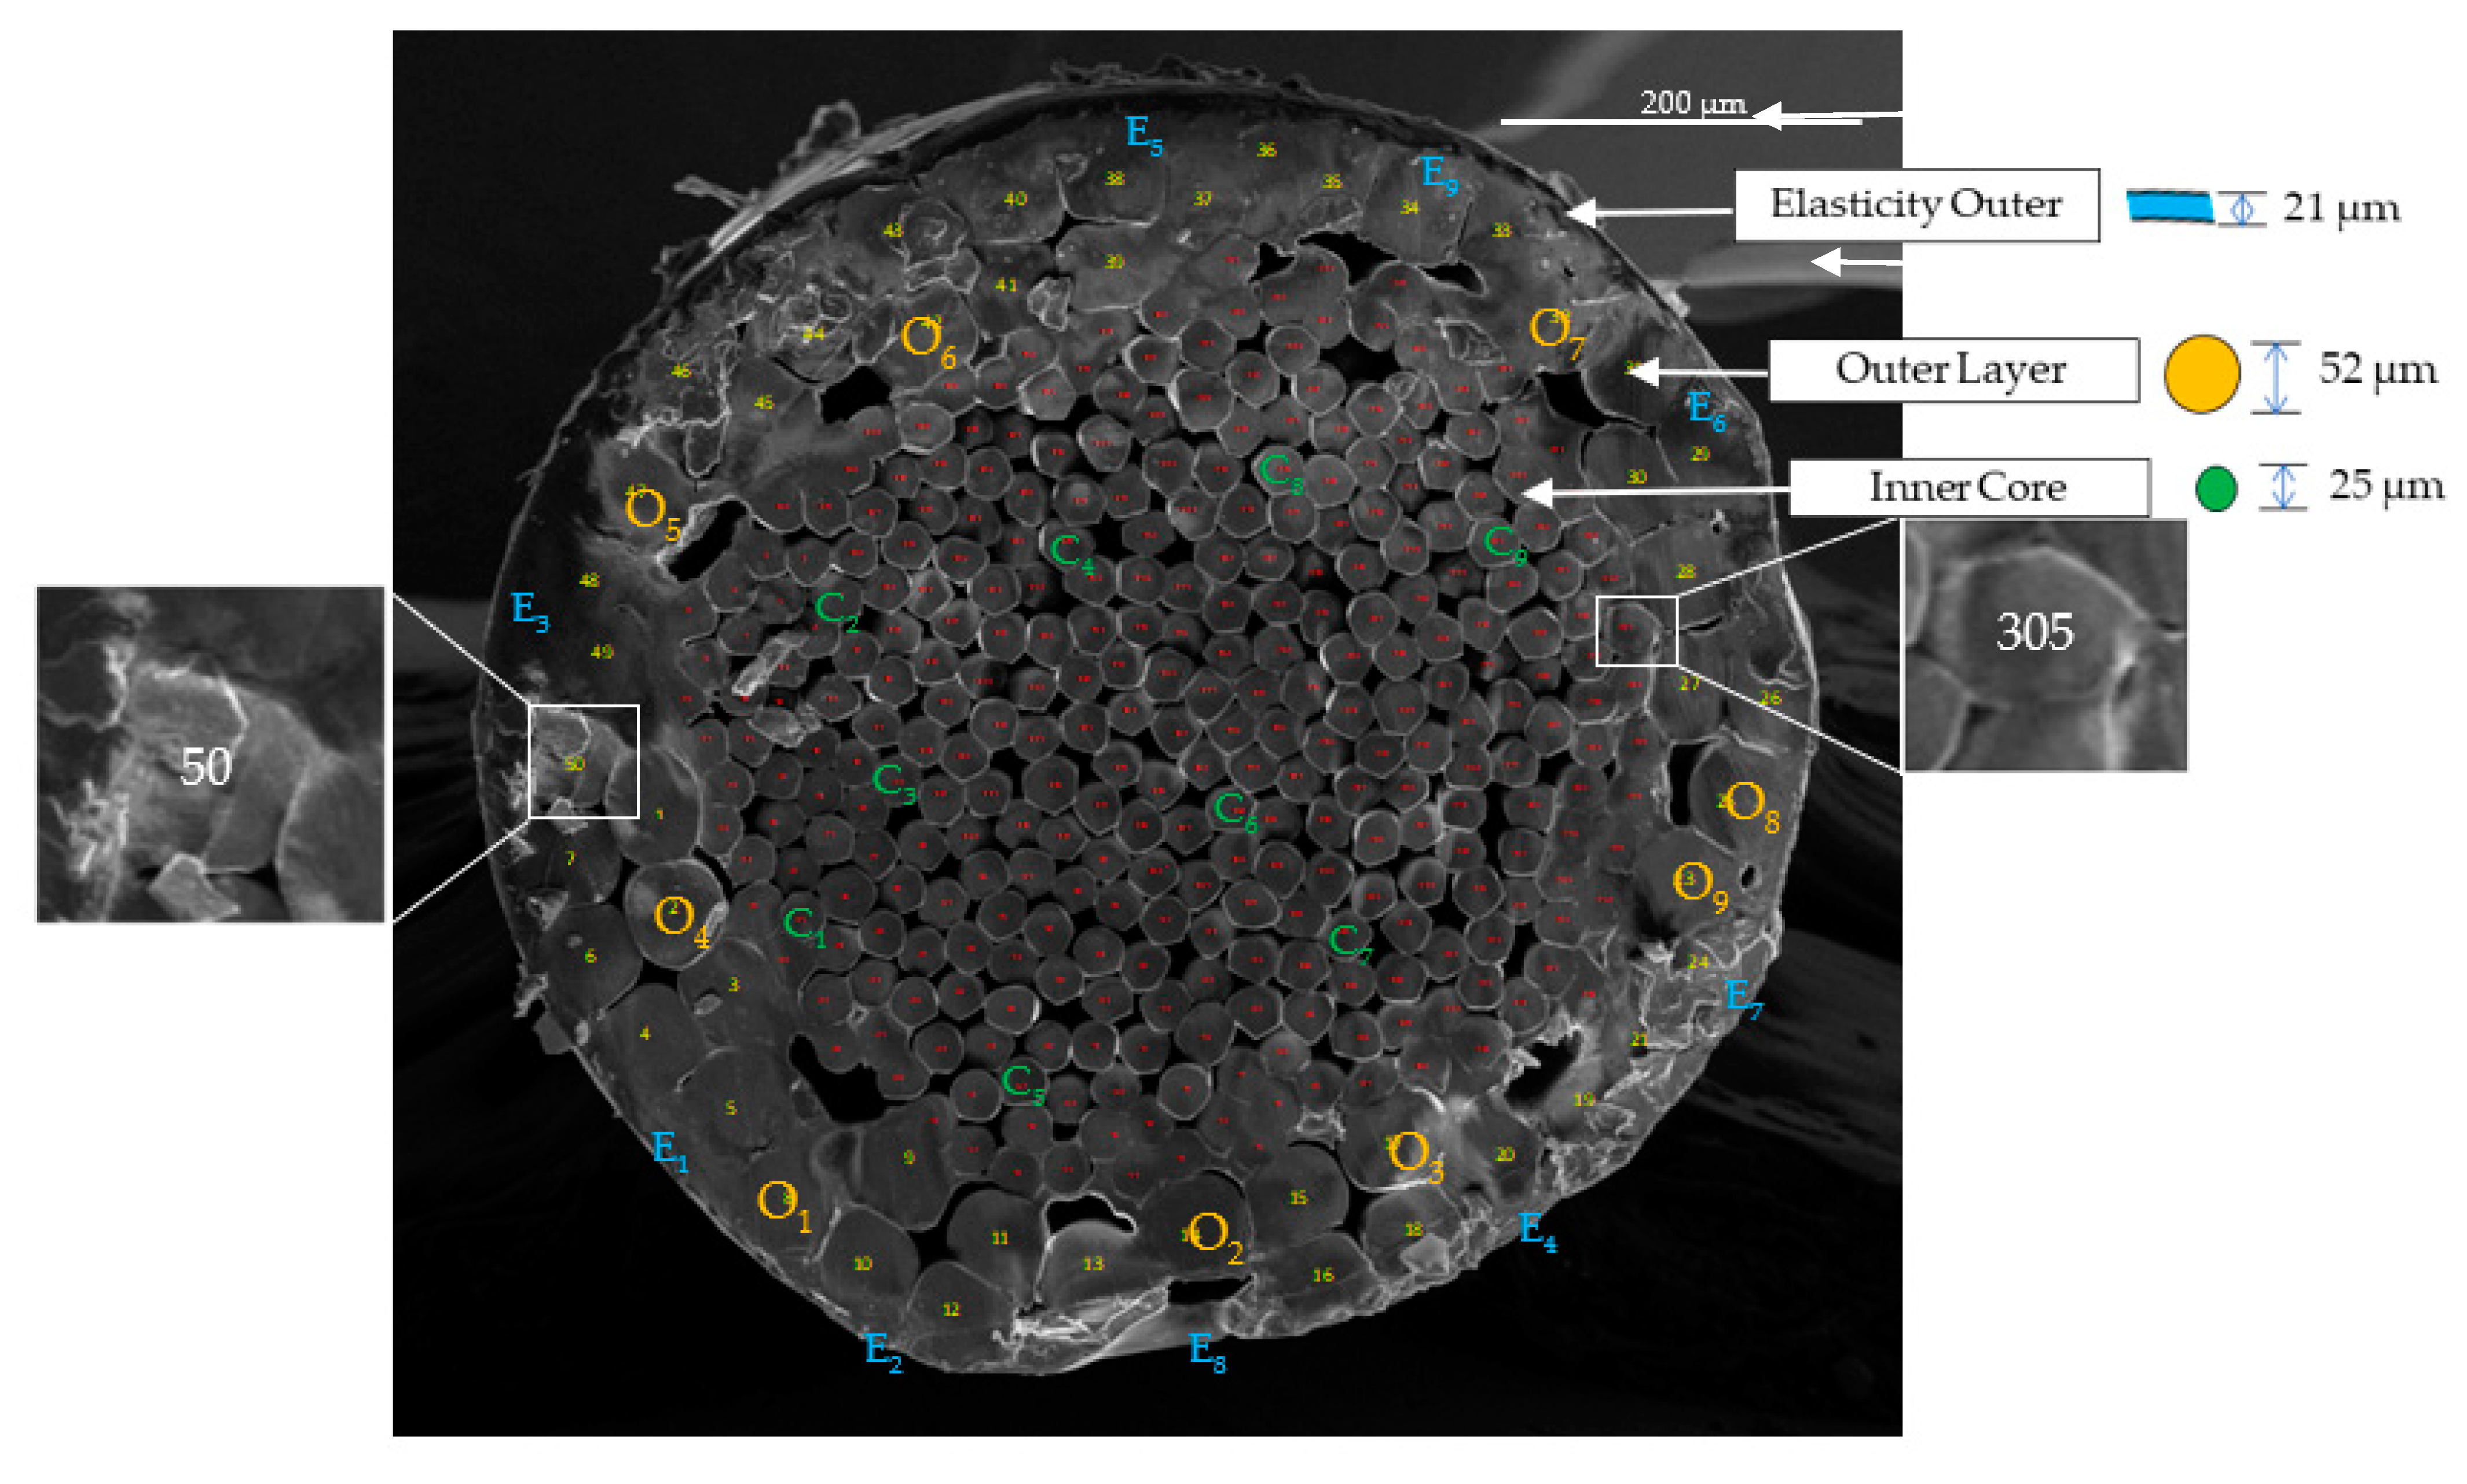
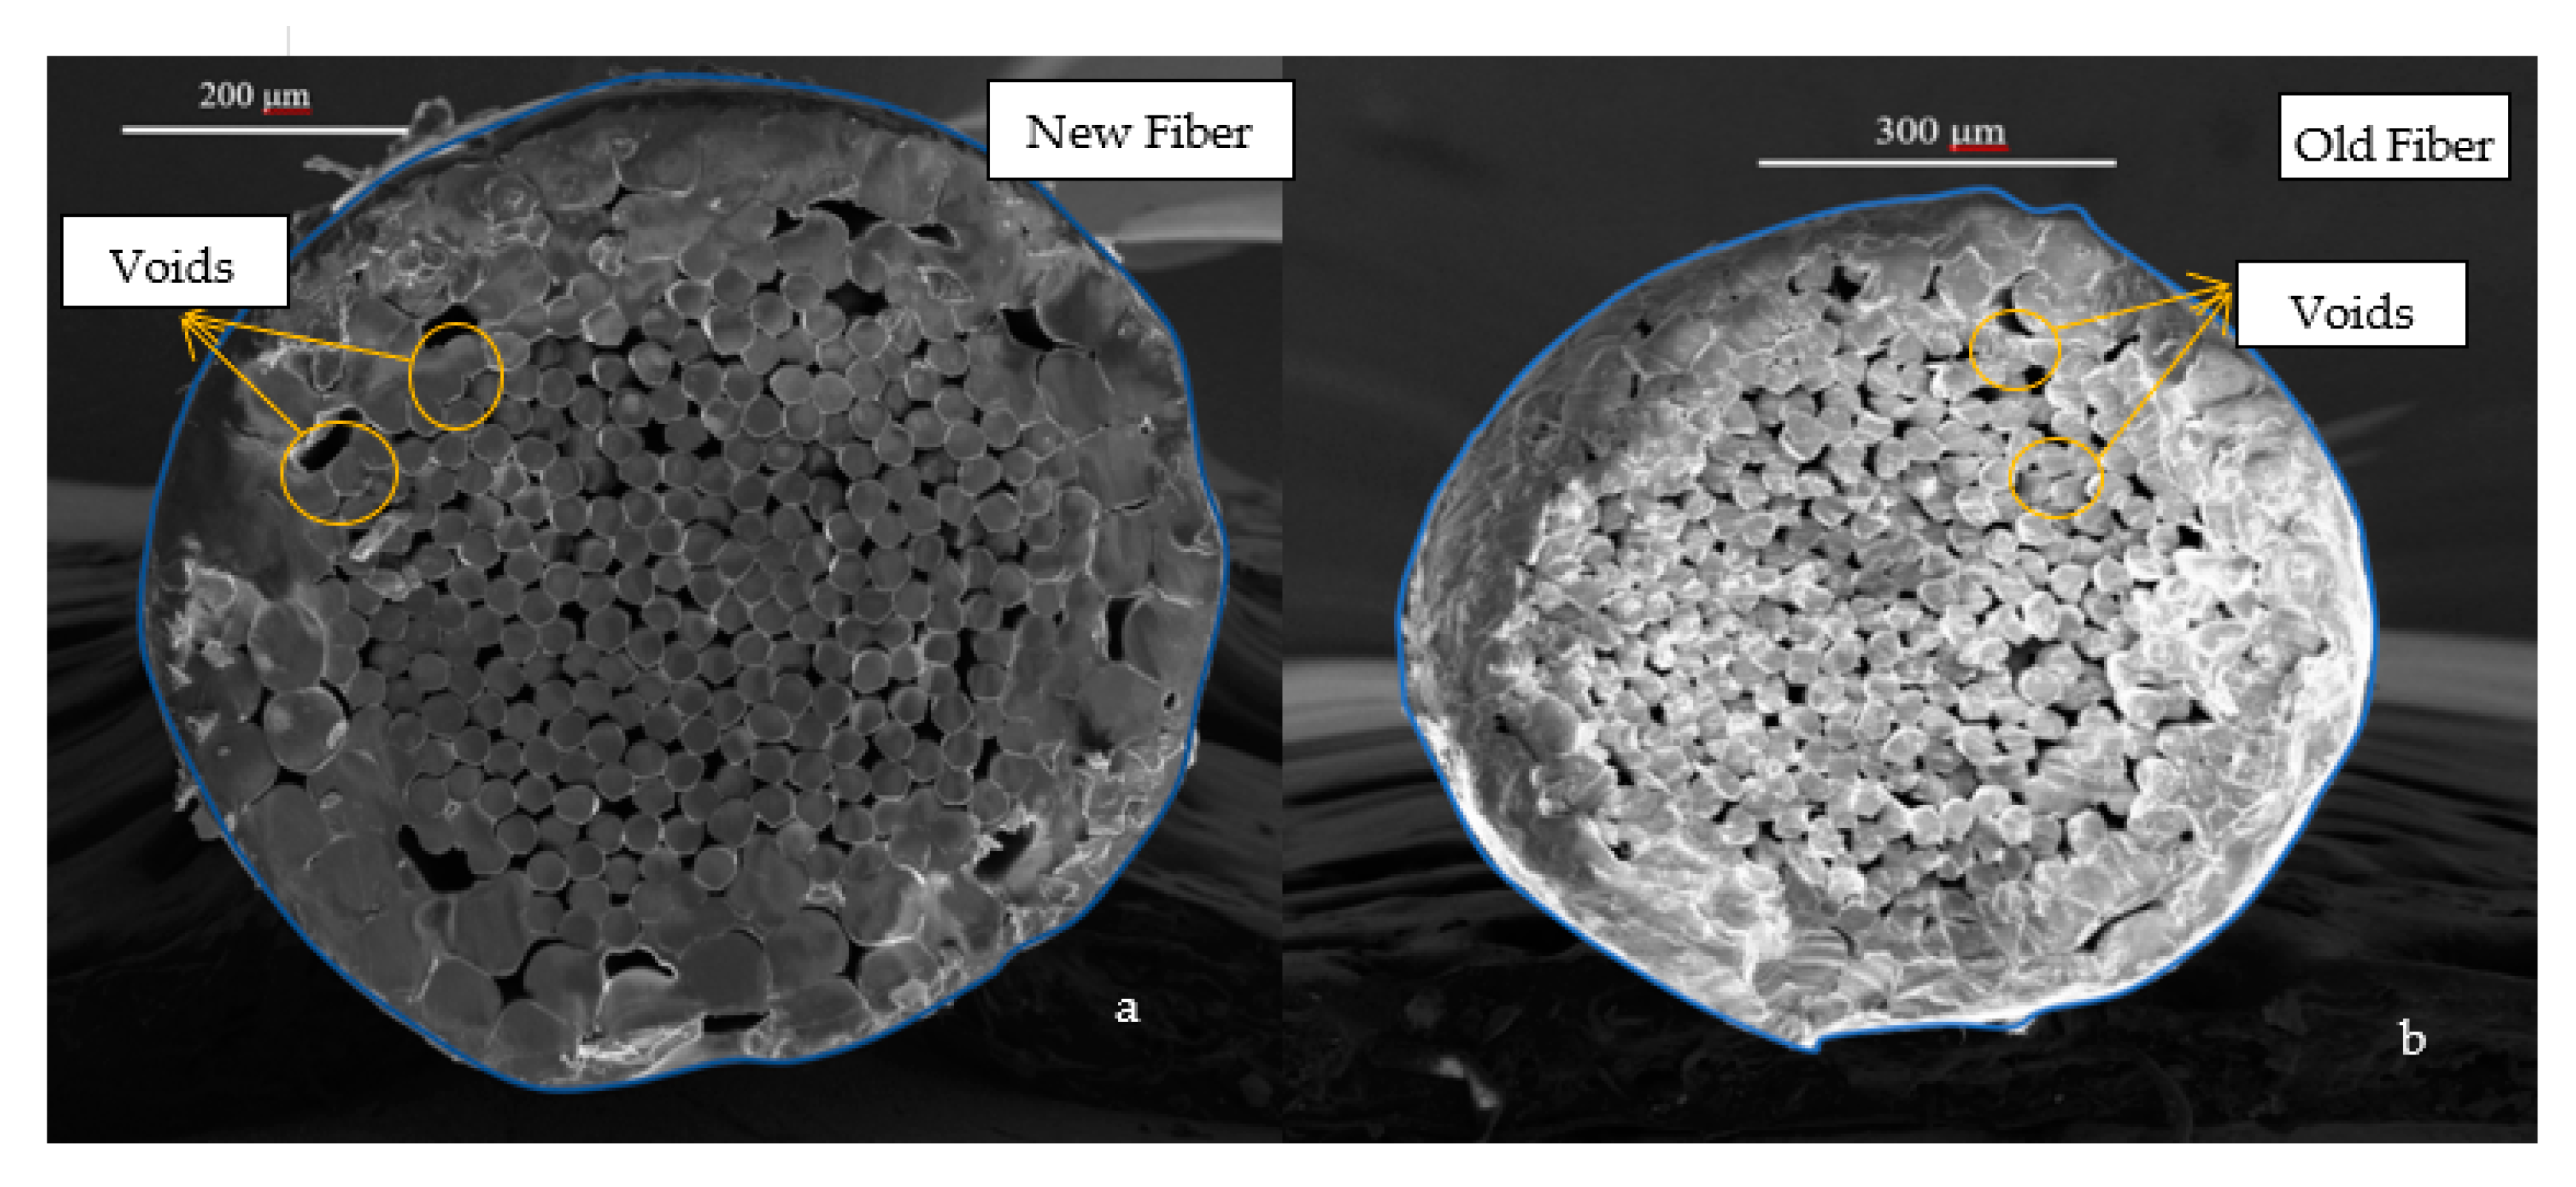
4.1.3. Scanning Electron Microscopy and Energy Dispersion Spectroscopy
4.1.4. Determination of Net Cross-Sectional Area
4.2. Mechanical Study
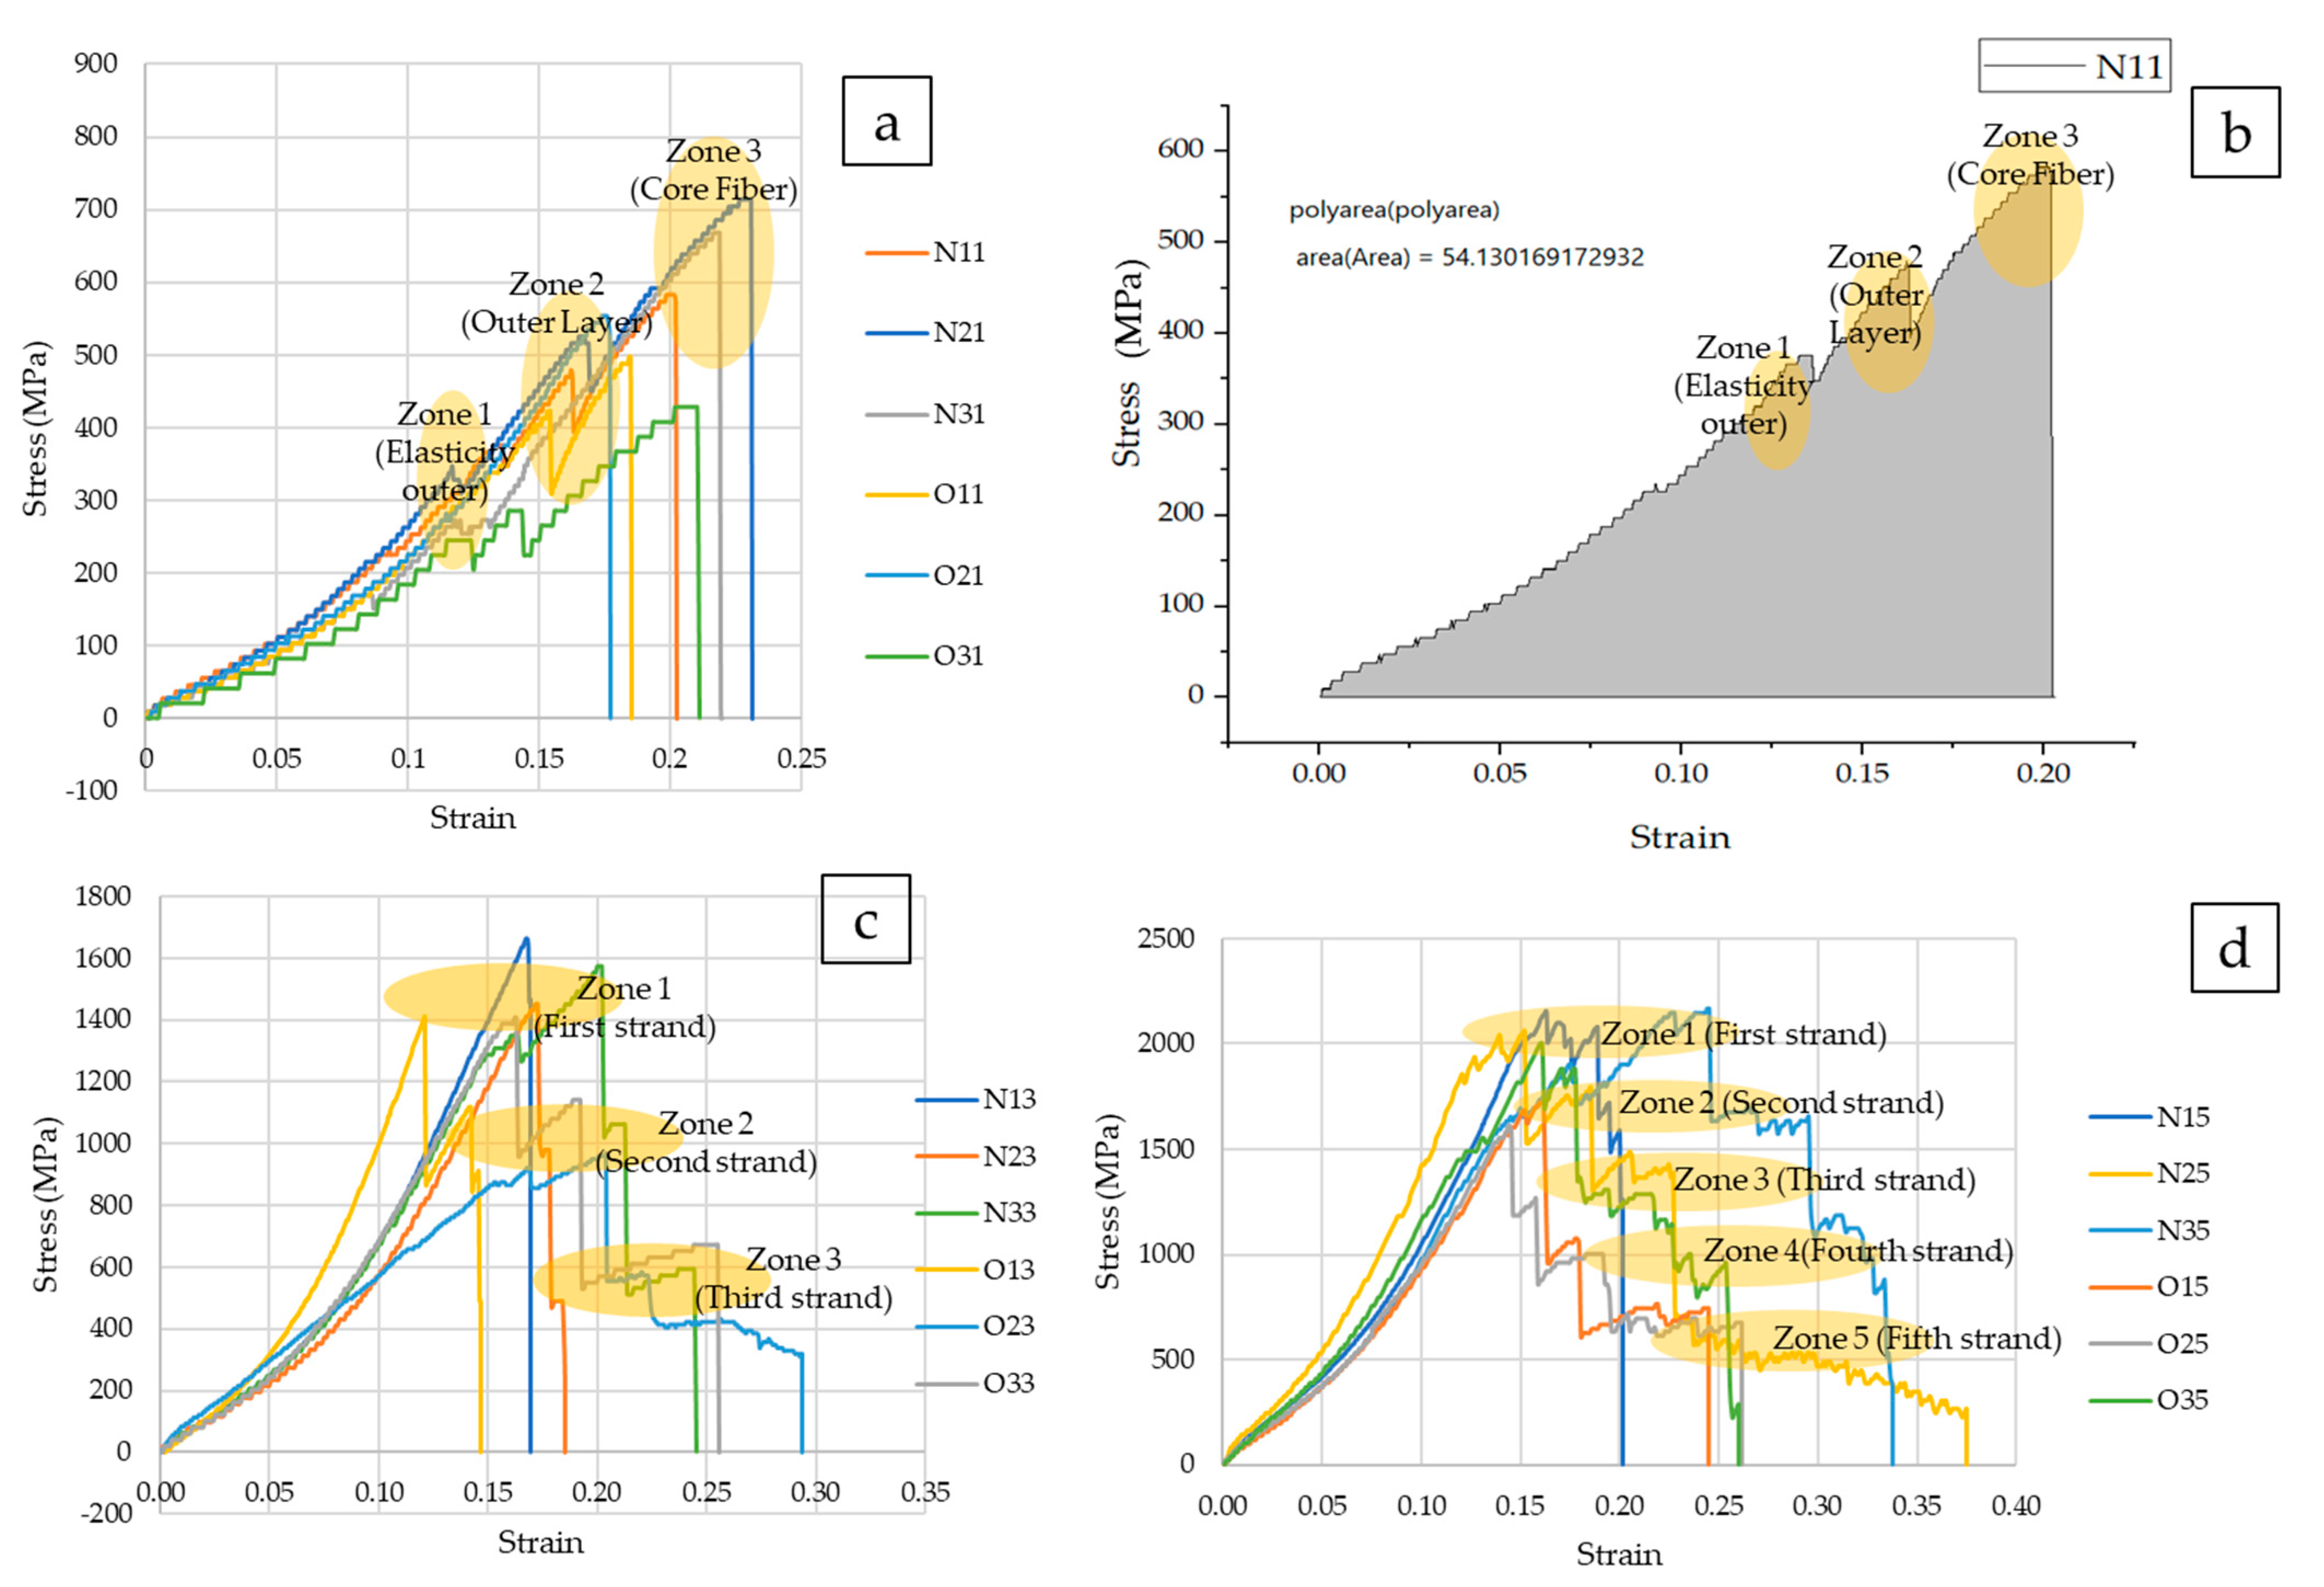
4.2.1. Results of the Fibers by Varying Strands
- (a)
- Tensile Strength of the Fiber with One Strand
- (b)
- Tensile Strength of the Fiber with Three Strands
- (c)
- Tensile Strength of the Fibers with Five Strands
- (d)
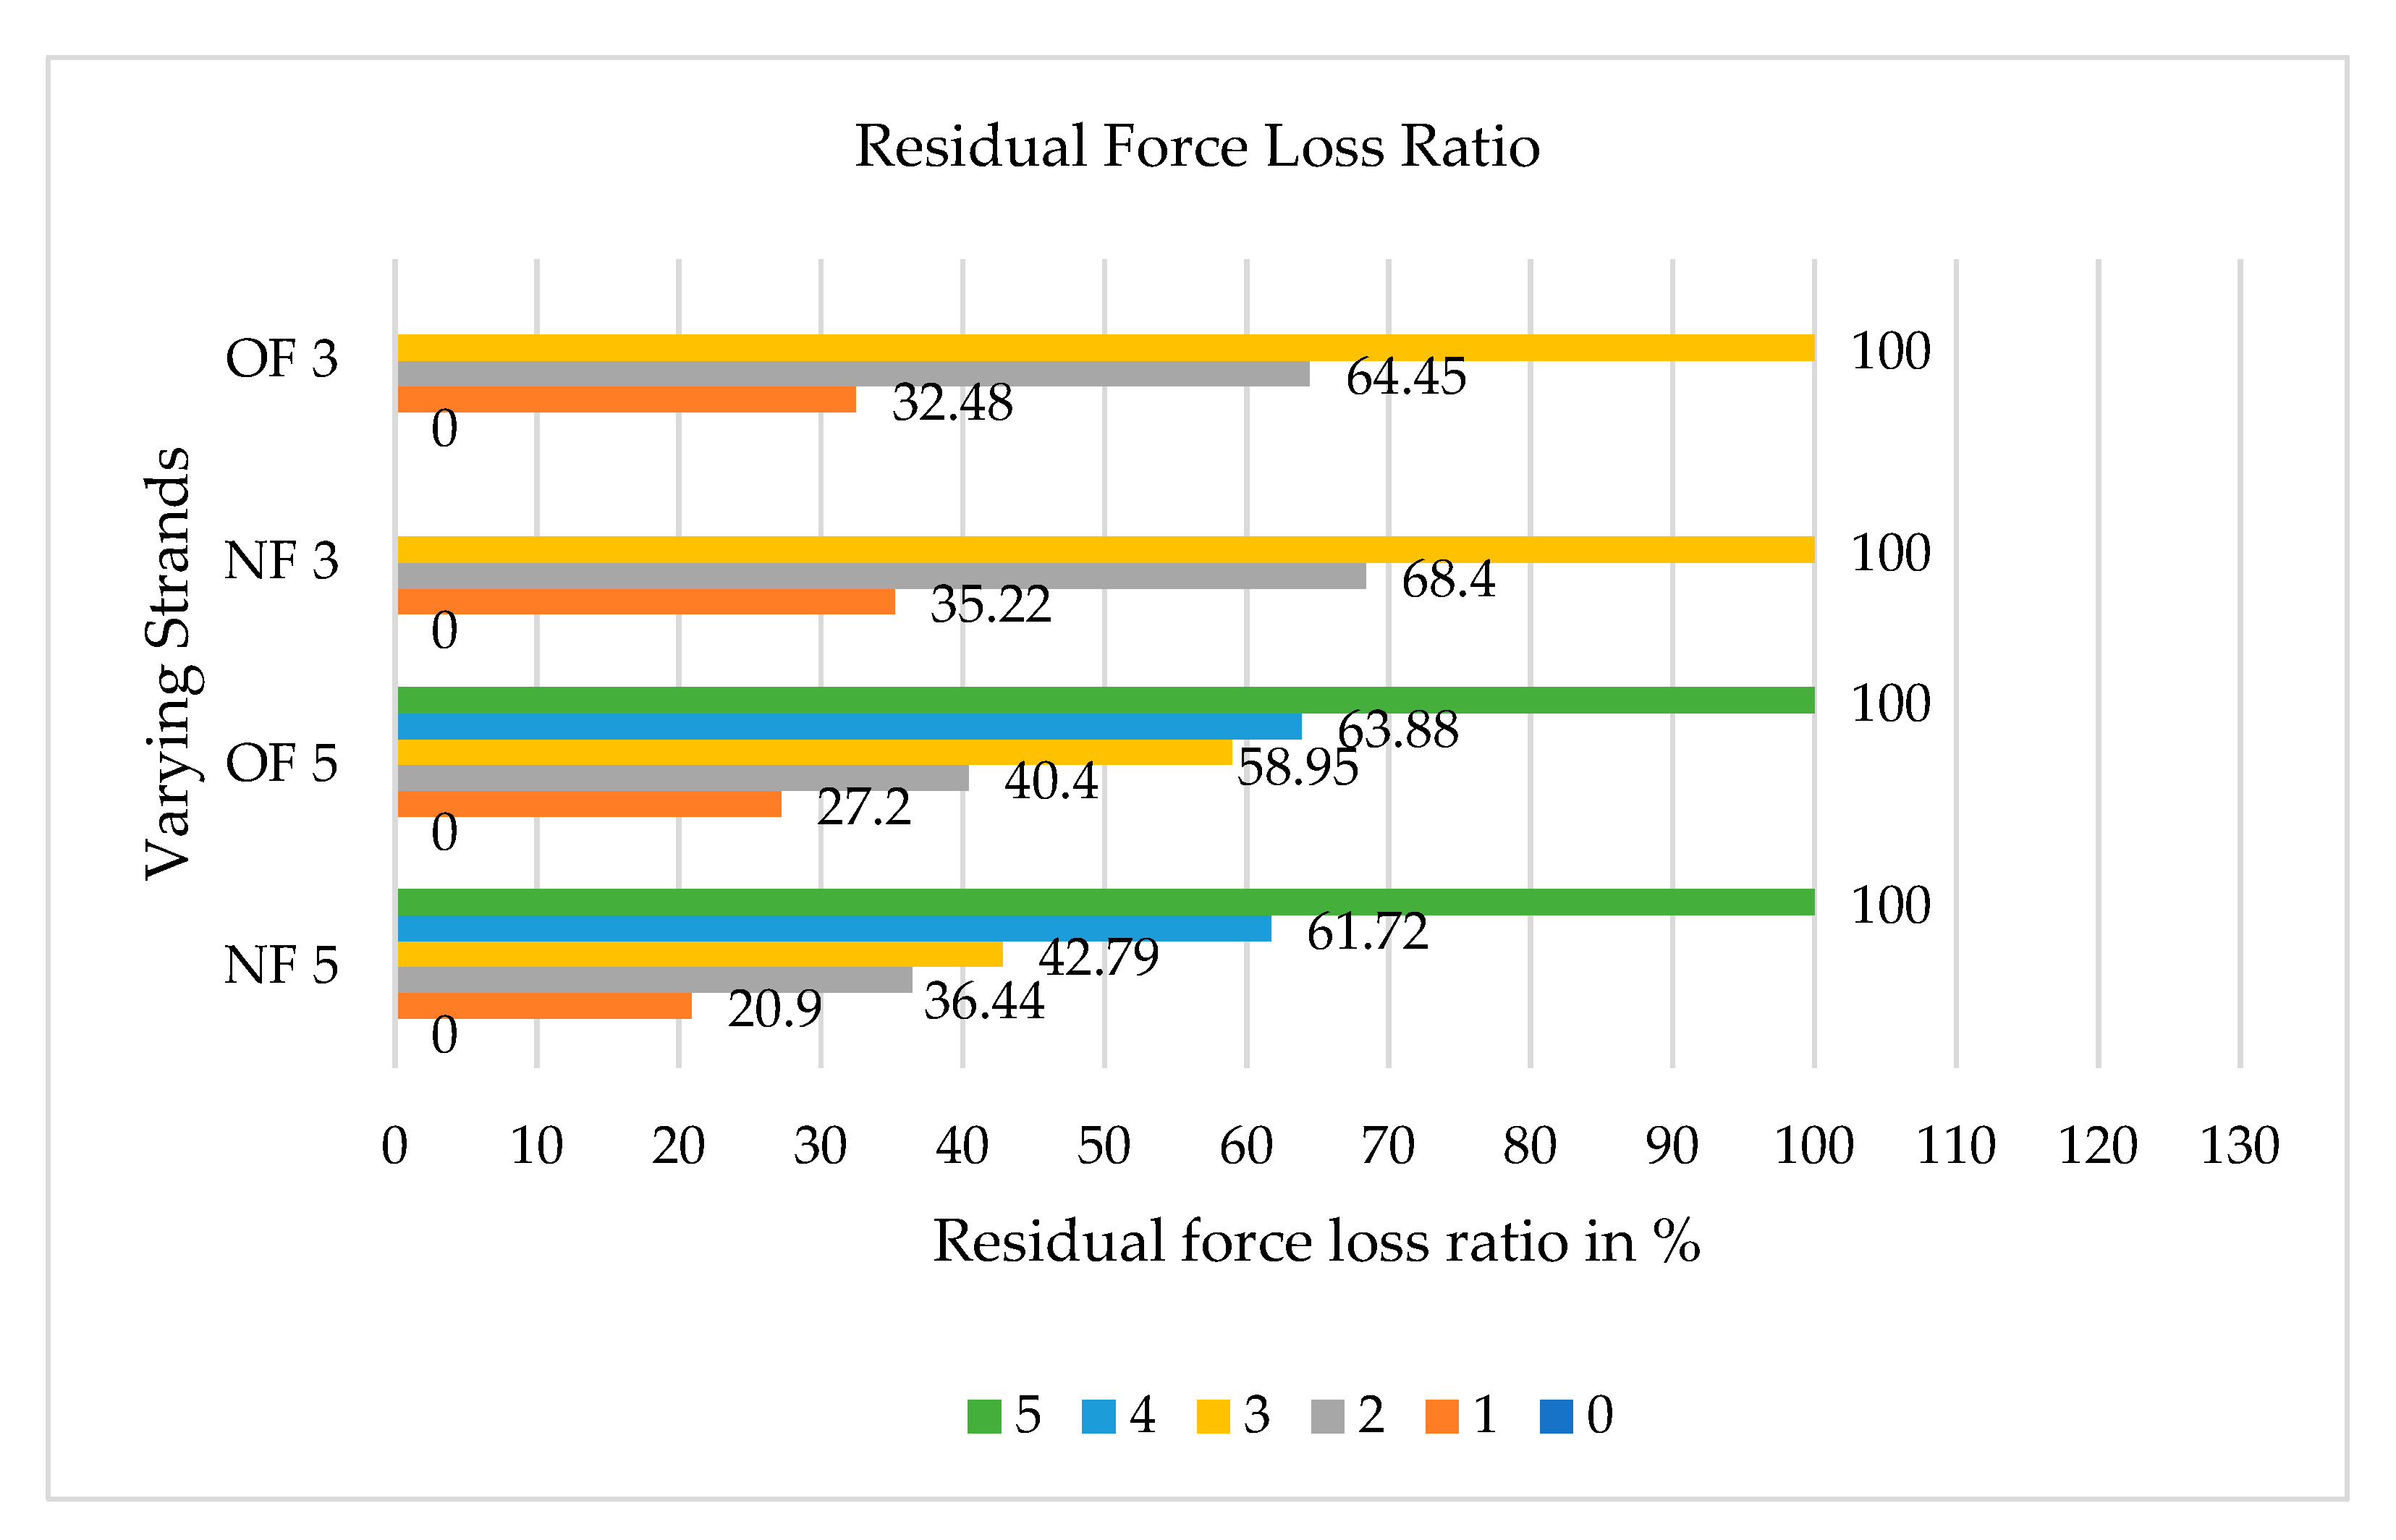
- Residual Force loss ratio
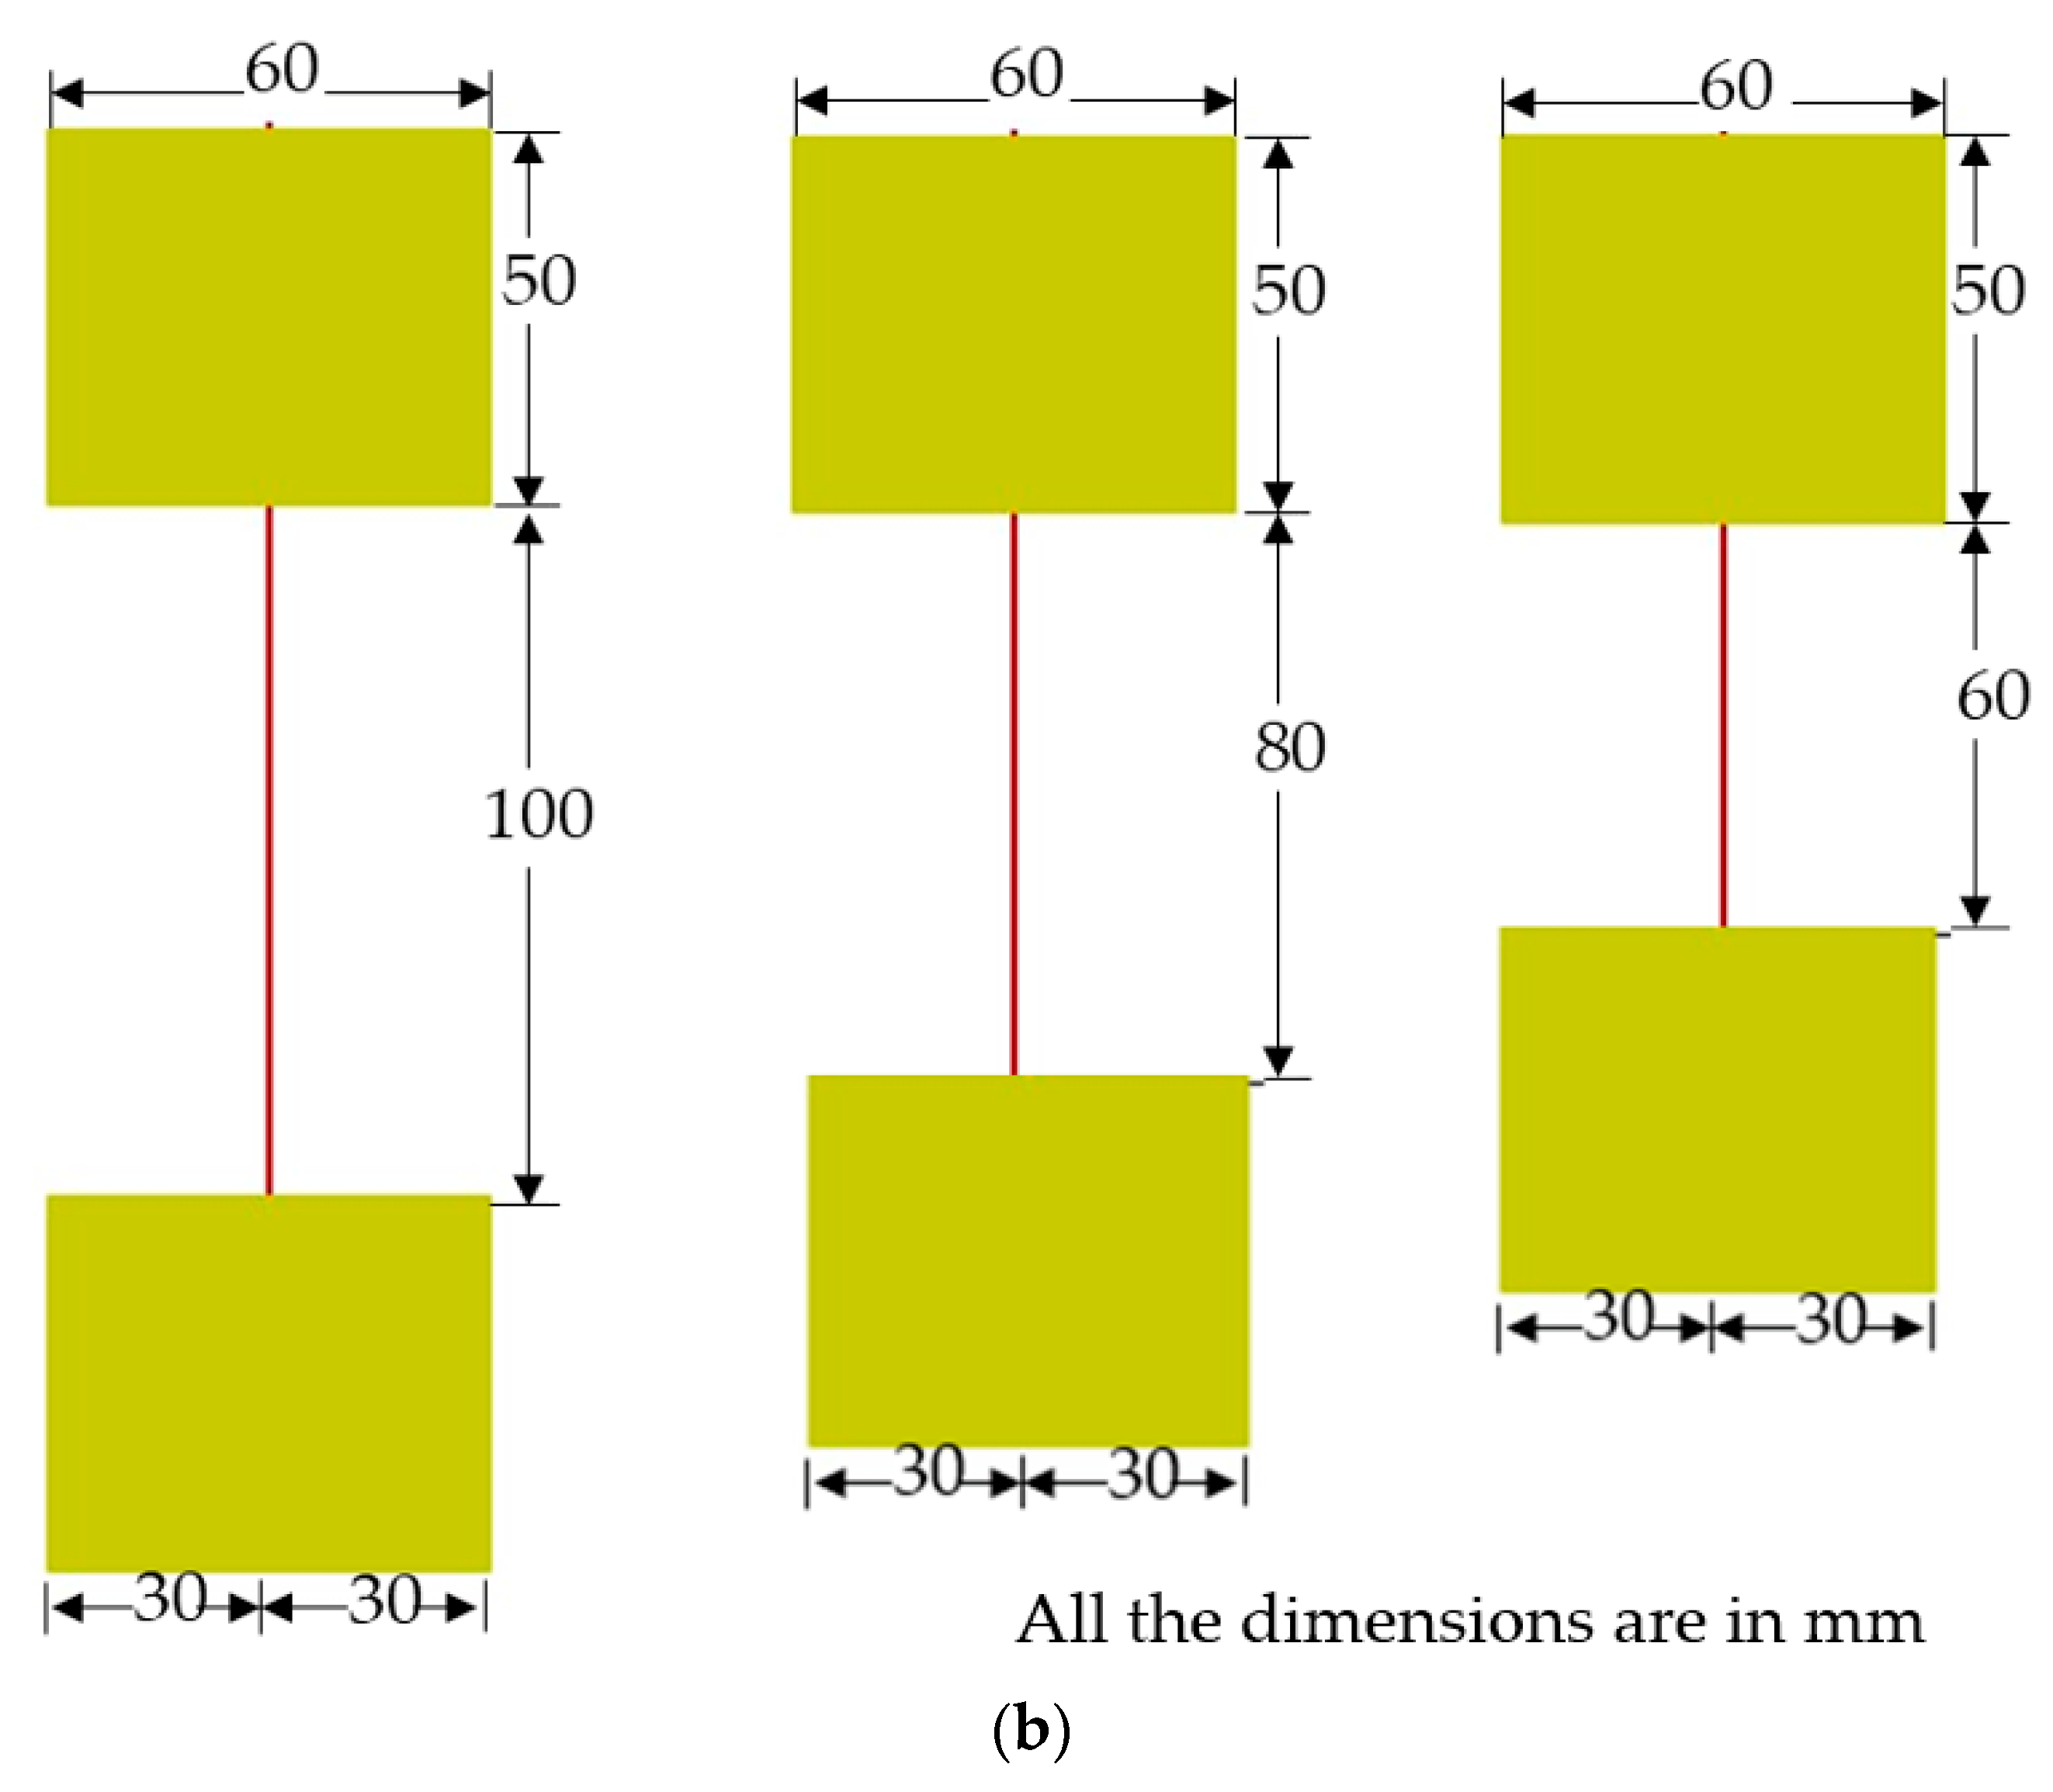
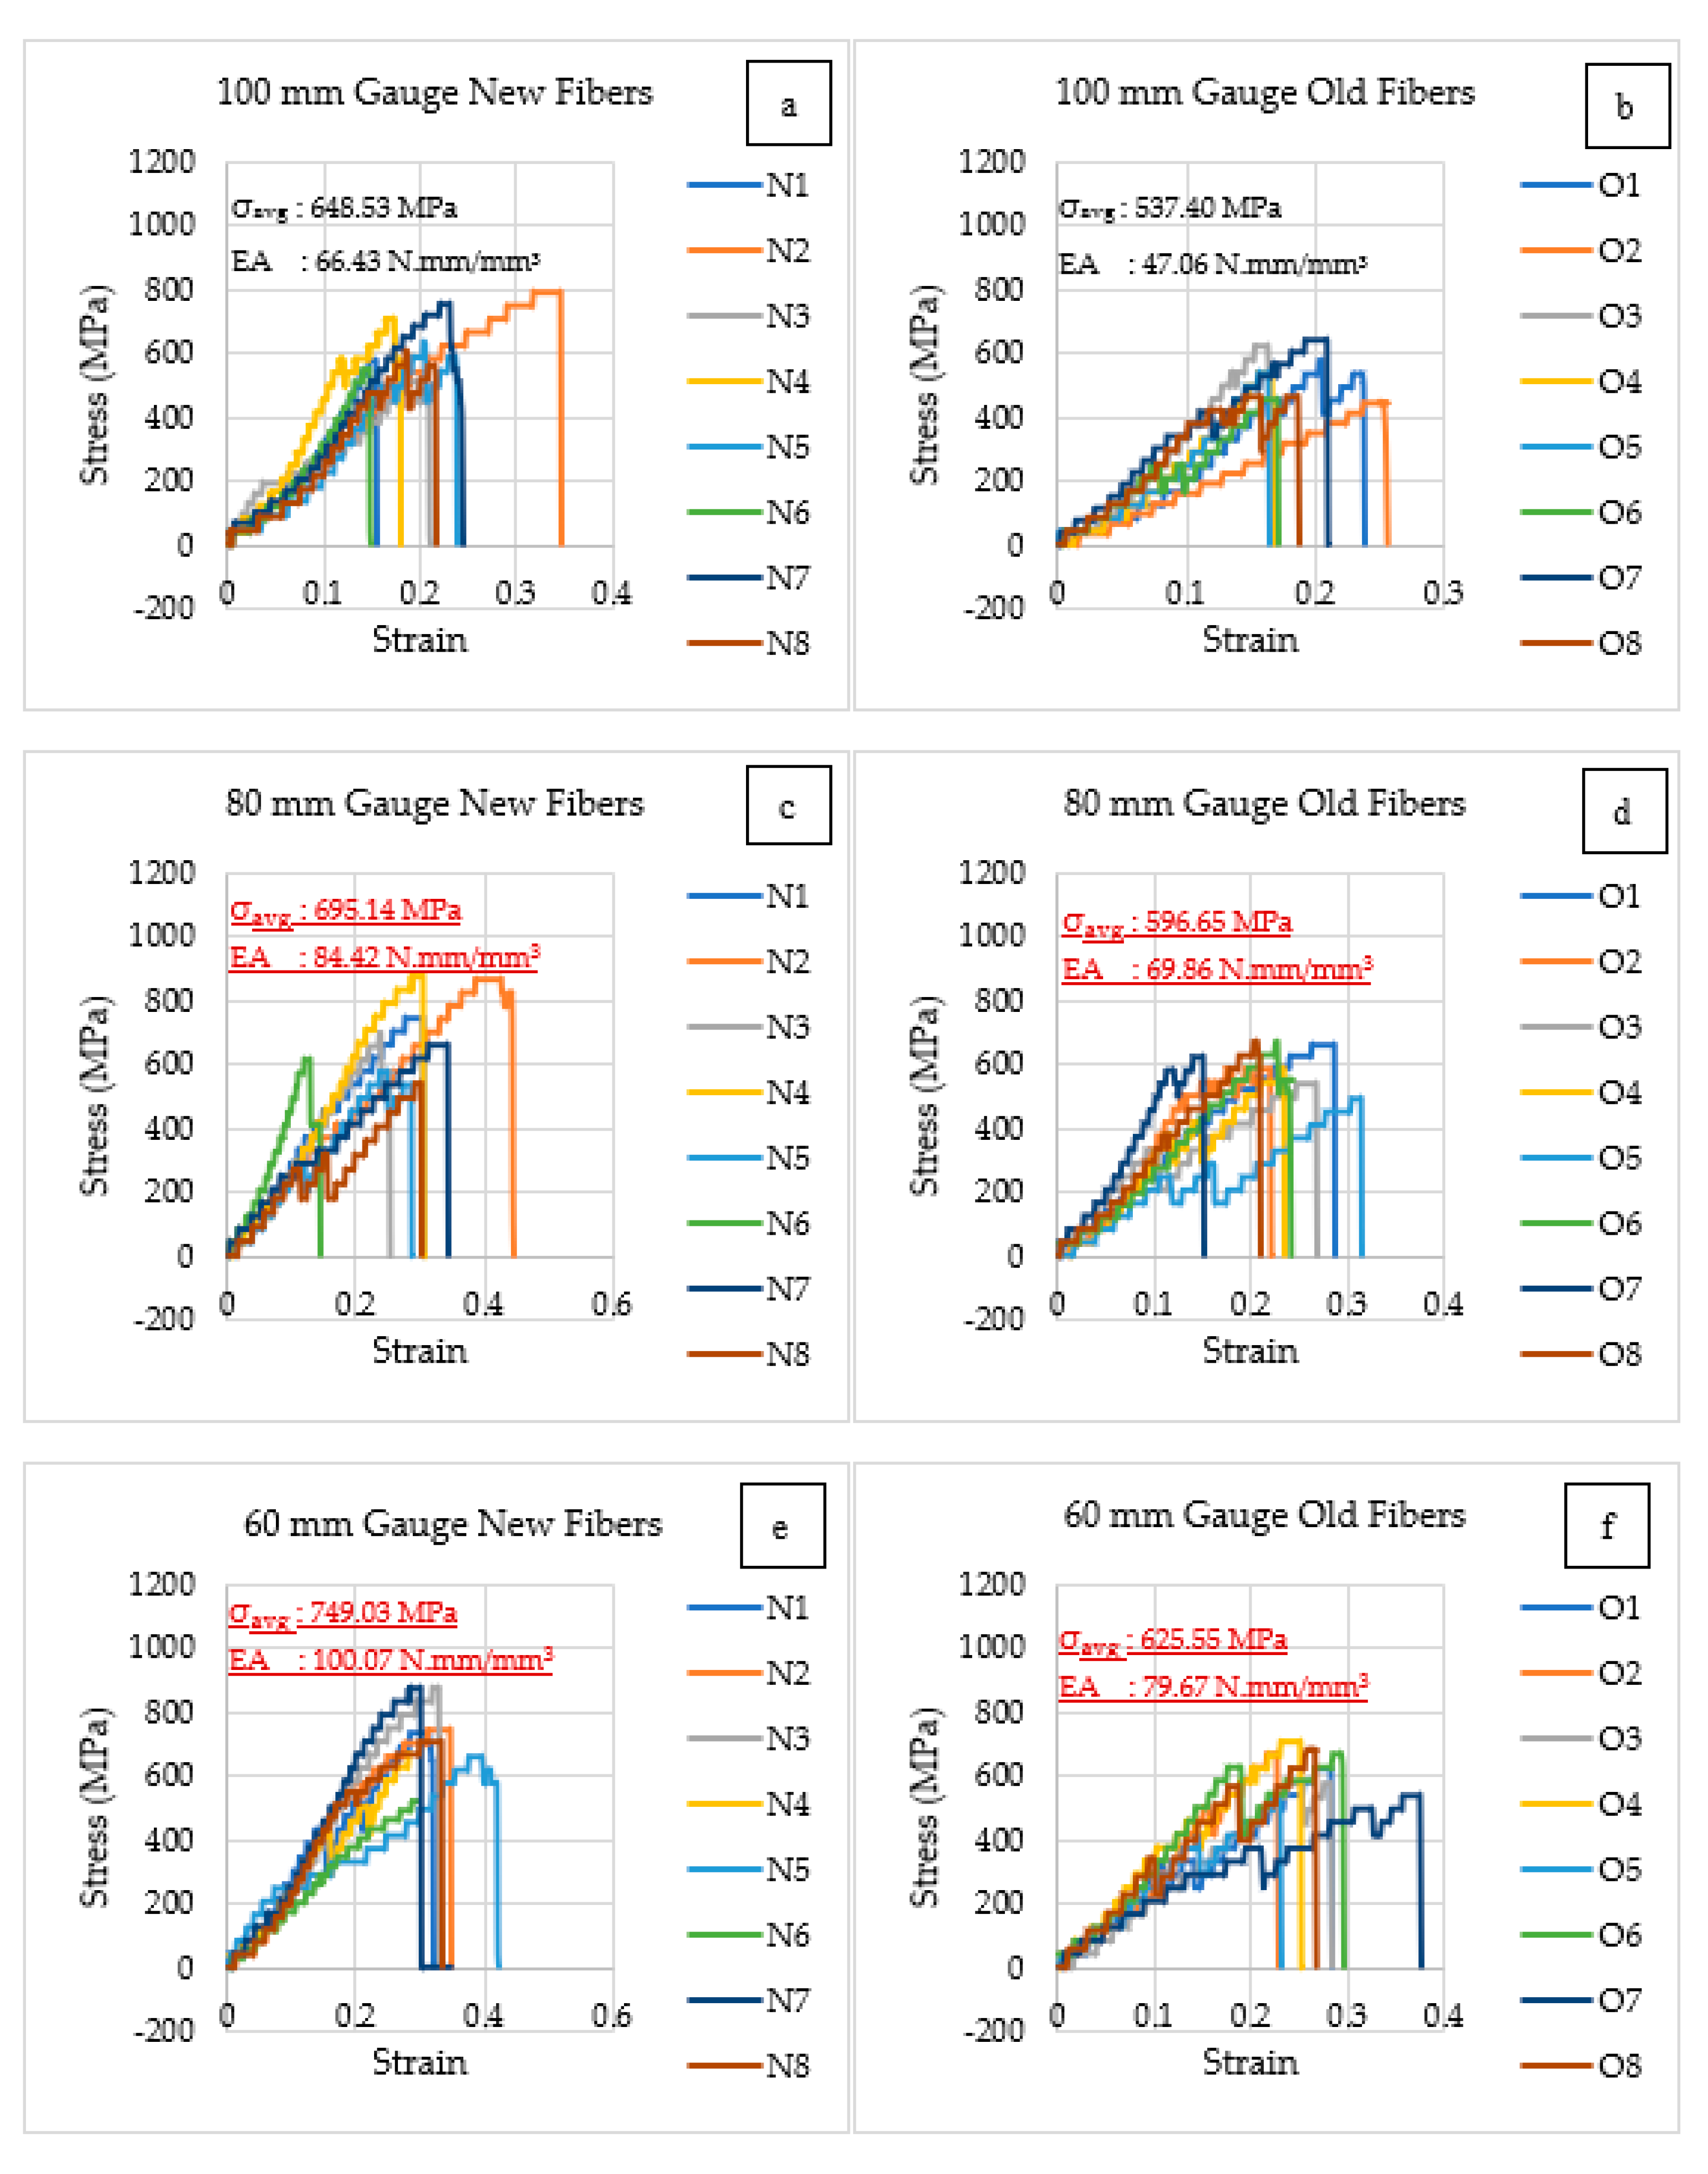
4.2.2. Results of the Fibers by Varying Gauge Lengths
Same Gauge Length with Different Fibers
- (a)
- Results of the Fiber with a 100 mm Gauge Length
- (b)
- Results of the Fiber with a 80 mm Gauge Length
- (c)
- Results of the Fiber with a 60 mm Gauge Length
Same Fibers with Different Gauge Lengths
- (a)
- Results of new fiber
- (b)
- Results of old fiber
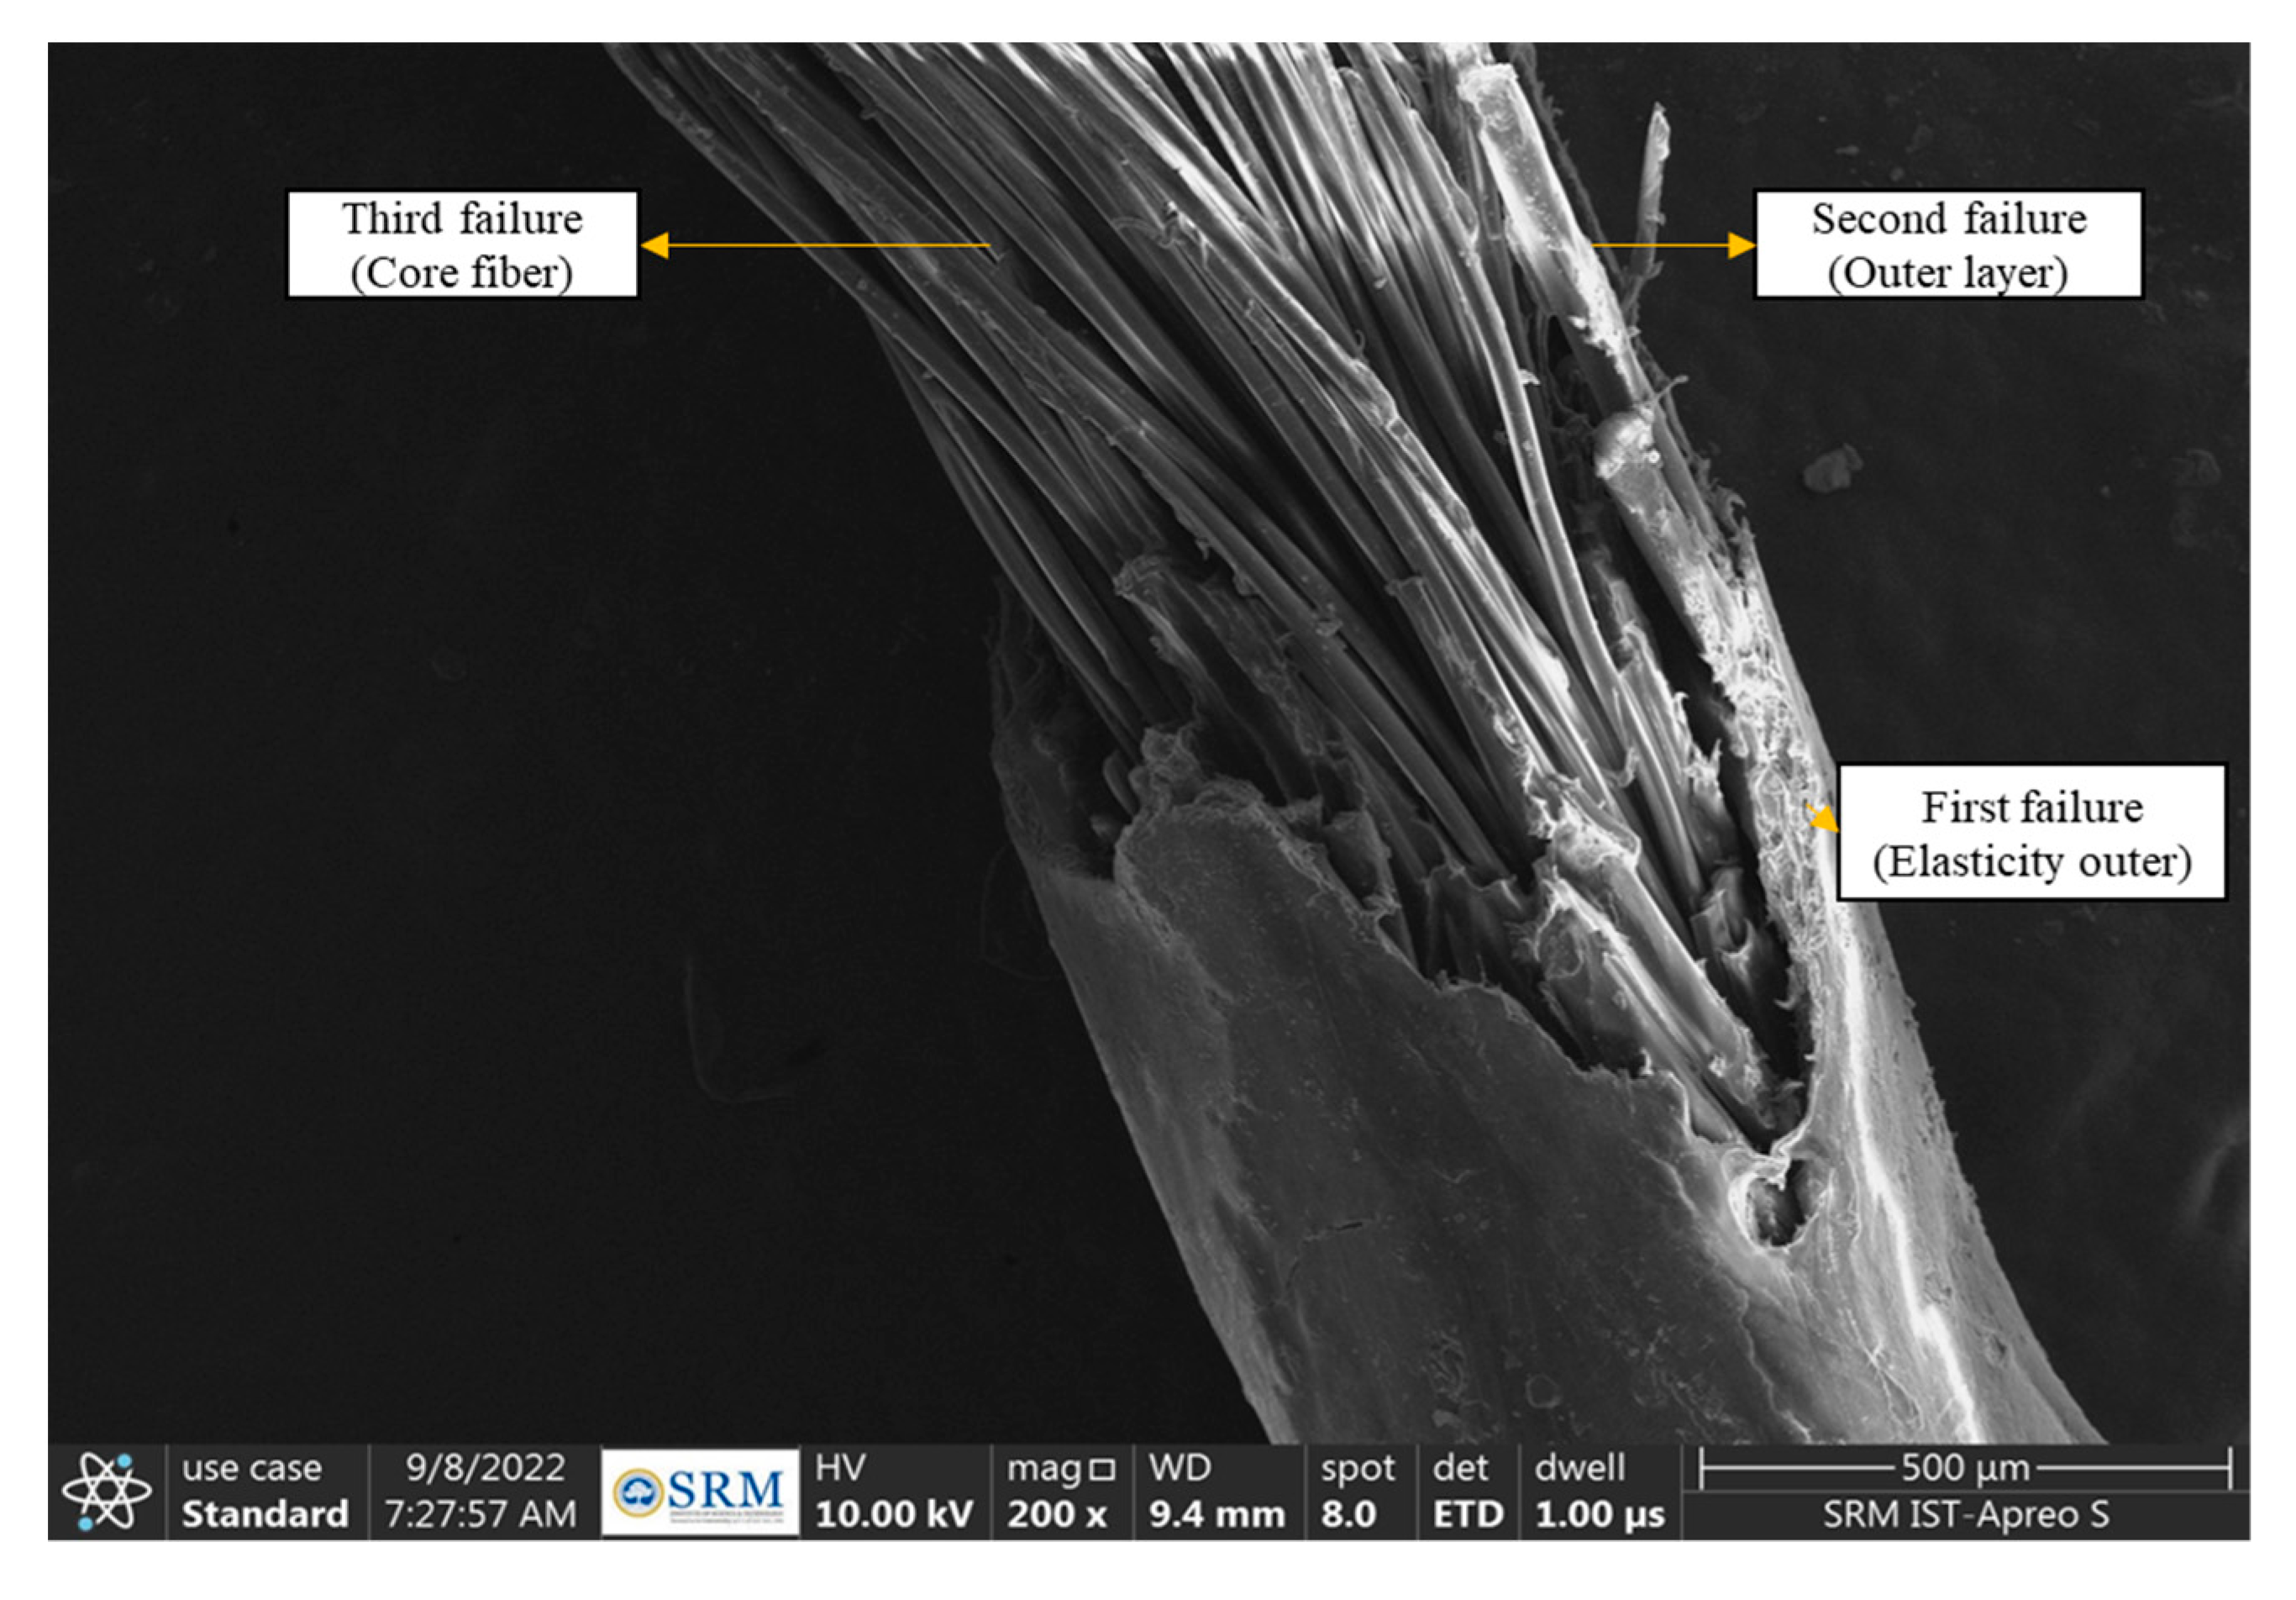
4.2.3. Failure of the Fibers after Tensile Testing
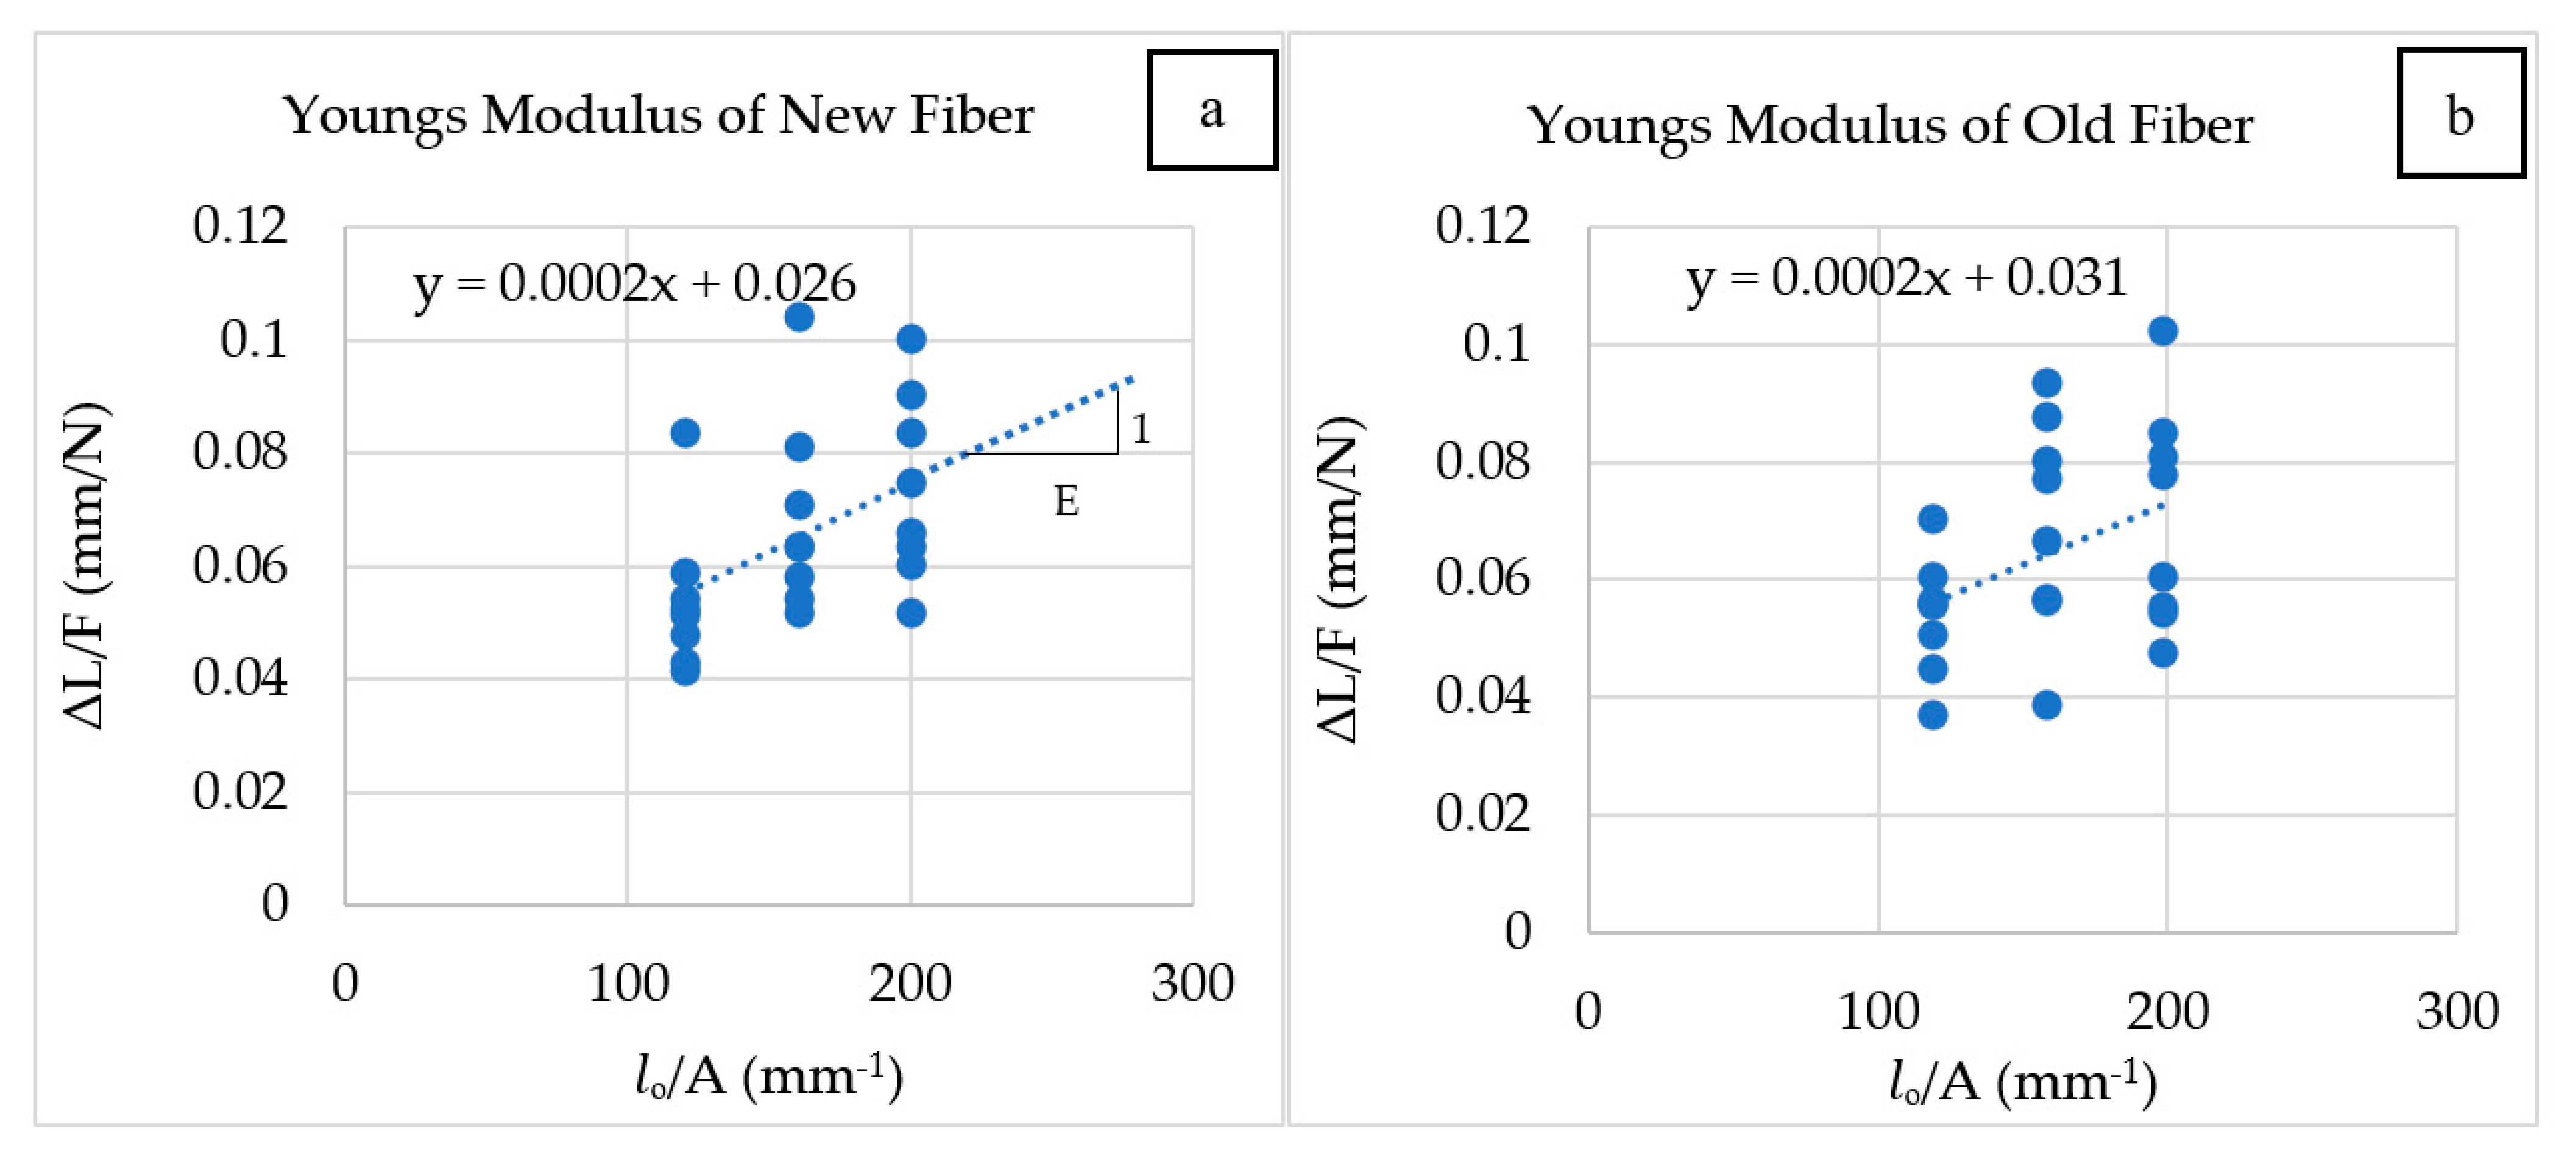
4.2.4. Young’s Modulus of Fiber
4.2.5. Validation of Results by Weibull Distribution
5. Comparison of the Tensile Strength of WBSF with Other Recycled Nylon Fibers
6. Conclusions
- Microstructural analysis using EDS, FTIR, and XRD reveals that nylon 6,6 is the purest form of the fiber.
- From the SEM imaging of the fibers, the overall diameter and the net cross-sectional area are 799.10 μm and 504,786.30 μm2, respectively, for new fibers and 776.30 μm and 498,125.00 μm2, respectively, for old fibers.
- From the various strand fibers, the average energy absorption of a single fiber ranges from 68.04 to 55.34 N.mm/mm3 for new fibers and 40.09 to 33.65 N.mm/mm3 for old fibers.
- The pattern of the residual force loss percentage for new and old fibers with three strands was similar and calculated as 0, 35.22, 68.40, 100.00 and 0, 32.48, 64.45, and 100, respectively.
- The pattern of the residual force loss percentage for new and old fibers with five strands was similar and calculated as 0, 20.90, 36.44, 42.79, 61.72, and 100.00, and 0, 27.7, 40.40, 58.95, 63.88, and 100.00, respectively.
- From the varying gauge lengths, the difference in the average stress and average energy absorption between the new and old fibers is 17.13% and 29.15% for a 100 mm gauge length, 14.16% and 17.24% for a 80 mm gauge length, and 16.48% and 20.00% for a 60 mm length, respectively.
- The Young’s modulus of new and old fibers is 4870.00 and 4843.50 MPa, respectively, and no significant difference was observed.
- The Weibull modulus (m) varies between 5.27 and 9.17, which shows a lower variability of tensile test results for both new and old fibers.
- The tensile strength of WBSF is 490.00 MPa, which is higher when compared to other recycled nylon fibers.
- Therefore, the feasibility of incorporating WBSF in polymer and cement matrices would be a better idea, which would effectively improve the toughness and impact strength.
- Furthermore, the use of recycled fibers from industrial or post-consumer waste offers additional advantages of waste reduction and resource conservation. These advantages can be realized through the incorporation of WBSF.
7. Patents
Supplementary Materials
Author Contributions
Funding
Data Availability Statement
Acknowledgments
Conflicts of Interest
References
- Kanan, M.; Wannassi, B.; Barham, A.S.; Ben Hassen, M.; Assaf, R. The Quality of Blended Cotton and Denim Waste Fibres: The Effect of Blend Ratio and Waste Category. Fibers 2022, 10, 76. [Google Scholar] [CrossRef]
- Farinha, C.B.; Silvestre, J.D.; de Brito, J.; Veiga, M.D.R. Life cycle assessment of mortars with incorporation of industrial wastes. Fibers 2019, 7, 59. [Google Scholar] [CrossRef] [Green Version]
- Signorini, C.; Volpini, V. Mechanical performance of fiber reinforced cement composites including fully-recycled plastic fibers. Fibers 2021, 9, 16. [Google Scholar] [CrossRef]
- Maia Pederneiras, C.; Veiga, R.; de Brito, J. Impact Resistance of Rendering Mortars with Natural and Textile-Acrylic Waste Fibres. Fibers 2022, 10, 44. [Google Scholar] [CrossRef]
- Pachideh, G.; Gholhaki, M. An experimental investigation into effect of temperature rise on mechanical and visual characteristics of concrete containing recycled metal spring. Struct. Concr. 2021, 22, 550–565. [Google Scholar] [CrossRef]
- Park, J.K.; Kim, M.O.; Kim, D.J. Pullout behavior of recycled waste fishing net fibers embedded in cement mortar. Materials 2020, 13, 4195. [Google Scholar] [CrossRef]
- Kowsalya, M.; Sindhu Nachiar, S.; Sekar, A.; Ravichandran, P.T. Study on Mechanical and Microstructural Properties of Concrete with Fly Ash Cenosphere as Fine Aggregate—A Sustainable Approach. Buildings 2022, 12, 1679. [Google Scholar] [CrossRef]
- Ivars, J.; Labanieh, A.R.; Soulat, D. Effect of the Fibre Orientation Distribution on the Mechanical and Preforming Behaviour of Nonwoven Preform Made of Recycled Carbon Fibres. Fibers 2021, 9, 82. [Google Scholar] [CrossRef]
- Orasutthikul, S.; Unno, D.; Yokota, H. Effectiveness of recycled nylon fiber from waste fishing net with respect to fiber reinforced mortar. Constr. Build. Mater. 2017, 146, 594–602. [Google Scholar] [CrossRef] [Green Version]
- Srimahachota, T.; Yokota, H.; Akira, Y. Recycled nylon fiber from waste fishing nets as reinforcement in polymer cement mortar for the repair of corroded RC beams. Materials 2020, 13, 4276. [Google Scholar] [CrossRef]
- Park, J.K.; Kim, D.J.; Kim, M.O. Mechanical behavior of waste fishing net fiber-reinforced cementitious composites subjected to direct tension. J. Build. Eng. 2021, 33, 101622. [Google Scholar] [CrossRef]
- Marinelli, S.; Butturi, M.A.; Rimini, B.; Gamberini, R.; Sellitto, M.A. Estimating the circularity performance of an emerging industrial symbiosis network: The case of recycled plastic fibers in reinforced concrete. Sustainability 2021, 13, 10257. [Google Scholar] [CrossRef]
- Ahmed, H.U.; Faraj, R.H.; Hilal, N.; Mohammed, A.A.; Sherwani, A.F.H. Use of recycled fibers in concrete composites: A systematic comprehensive review. Compos. Part B Eng. 2021, 215, 108769. [Google Scholar] [CrossRef]
- Ming, Y.; Chen, P.; Li, L.; Gan, G.; Pan, G. A comprehensive review on the utilization of recycled waste fibers in cement-based composites. Materials 2021, 14, 3643. [Google Scholar] [CrossRef]
- Zhang, Y.; Gao, L. Influence of tire-recycled steel fibers on strength and flexural behavior of reinforced concrete. Adv. Mater. Sci. Eng. 2020, 2020, 6363105. [Google Scholar] [CrossRef] [Green Version]
- Yang, J.; Peng, G.F.; Shui, G.S.; Zhang, G. Mechanical properties and anti-spalling behavior of ultra-high performance concrete with recycled and industrial steel fibers. Materials 2019, 12, 783. [Google Scholar] [CrossRef] [Green Version]
- Neira Medina, A.L.; Garcia, J.A.; Castellanos, N.T. Flexural behavior of environmentally friendly ultra-high-performance concrete with locally available low-cost synthetic fibers. Eur. J. Environ. Civ. Eng. 2022, 26, 6281–6304. [Google Scholar] [CrossRef]
- Yang, S.L.; Millard, S.G.; Soutsos, M.N.; Barnett, S.J.; Le, T.T. Influence of aggregate and curing regime on the mechanical properties of ultra-high performance fibre reinforced concrete (UHPFRC). Constr. Build. Mater. 2009, 23, 2291–2298. [Google Scholar] [CrossRef]
- Criado, M.; García-Díaz, I.; Bastidas, J.M.; Alguacil, F.J.; López, F.A.; Monticelli, C. Effect of recycled glass fiber on the corrosion behavior of reinforced mortar. Constr. Build. Mater. 2014, 64, 261–269. [Google Scholar] [CrossRef] [Green Version]
- Suchorab, Z.; Franus, M.; Barnat-Hunek, D. Properties of fibrous concrete made with plastic optical fibers from E-Waste. Materials 2020, 13, 2414. [Google Scholar] [CrossRef]
- Farooq, M.A.; Fahad, M.; Ali, B.; El Ouni, M.H.; Elhag, A.B. Influence of nylon fibers recycled from the scrap brushes on the properties of concrete: Valorization of plastic waste in concrete. Case Stud. Constr. Mater. 2022, 16, e01089. [Google Scholar] [CrossRef]
- Kumaresan, M.; Nachiar, S.S.; Anandh, S. Implementation of waste recycled fibers in concrete: A review. Mater. Today Proc. 2022, 68, 1988–1994. [Google Scholar] [CrossRef]
- Yin, S.-R.; Chang, H.-C.; Cheng, K.B. Impact Characteristics of a Badminton Racket with Realistic Finite Element Modeling. Multidiscip. Digit. Publ. Inst. Proc. 2020, 49, 106. [Google Scholar] [CrossRef]
- Zhu, Q. Perceiving the affordance of string tension for power strokes in badminton: Expertise allows effective use of all string tensions. J. Sport. Sci. 2013, 31, 1187–1196. [Google Scholar] [CrossRef]
- Fakhrizal, A.N.; Ardiyansyah, S.; Harun, M.N.; Kadir, M.R.A.; Omar, A.H. Finite-element study on effect of string tension toward coefficient of restitution of a badminton racket string-bed. Adv. Mater. Res. 2013, 845, 417–420. [Google Scholar] [CrossRef]
- Racquet Network. We Recycle Racquet String. 2018. Available online: https://racquetnetwork.com/we-recycle-racquet-string/ (accessed on 29 January 2023).
- Tennis Express. Inside Look at Wilson’s 2019 US Open Stringing Team. 2019. Available online: https://www.tennisexpress.com/blog/inside-look-at-wilsons-2019-us-open-stringing-team/ (accessed on 29 January 2023).
- Zainal, S.M.I.S.; Hejazi, F.; Aziz, F.N.A.A.; Jaafar, M.S. Effects of hybridized synthetic fibers on the shear properties of cement composites. Materials 2020, 13, 5055. [Google Scholar] [CrossRef]
- Nasruddin, F.A.; Harun, M.N.; Syahrom, A.; Kadir, M.R.A.; Omar, A.H.; Öchsner, A. Finite Element Analysis on Badminton Racket Design Parameters; Springer: Berlin/Heidelberg, Germany, 2015. [Google Scholar]
- Ali, M.; Chouw, N. Experimental investigations on coconut-fibre rope tensile strength and pullout from coconut fibre reinforced concrete. Constr. Build. Mater. 2013, 41, 681–690. [Google Scholar] [CrossRef]
- ASTM C1557−14; Standard Test Method for Tensile Strength and Young’s Modulus of Fibers. ASTM International: West Conshohocken, PA, USA, 2015. [CrossRef]
- Kisler-Rao, A. Comparison of nylon, polyester, and olefin fibers using FTIR and melting point analysis. J. Am. Soc. Trace Evid. Exam. 2015, 6, 3–20. [Google Scholar]
- Madhu, P.; Sanjay, M.R.; Senthamaraikannan, P.; Pradeep, S.; Saravanakumar, S.S.; Yogesha, B. A review on synthesis and characterization of commercially available natural fibers: Part II. J. Nat. Fibers 2019, 16, 25–36. [Google Scholar] [CrossRef]
- Obada, D.O.; Kuburi, L.S.; Dauda, M.; Dodoo-Arhin, D.; Iorpenda, M.J.; Hou, Y.; Balogun, M.B.; Iliyasu, I.; Umaru, S.; Bansod, N.D.; et al. Microstructural evolution and hardness properties of coir-coconut husk powder reinforced polymer composites subjected to an acidic environment. Procedia Manuf. 2019, 35, 737–742. [Google Scholar] [CrossRef]
- Khan, A.; Vijay, R.; Singaravelu, D.L.; Sanjay, M.R.; Siengchin, S.; Jawaid, M.; Alamry, K.A.; Asiri, A.M. Extraction and characterization of natural fibers from Citrullus lanatus climber. J. Nat. Fibers 2022, 19, 621–629. [Google Scholar] [CrossRef]
- Fan, C.; Huang, Y.Z.; Lin, J.N.; Li, J. Microplastic constituent identification from admixtures by Fourier-transform infrared (FTIR) spectroscopy: The use of polyethylene terephthalate (PET), polyethylene (PE), polypropylene (PP), polyvinyl chloride (PVC) and nylon (NY) as the model constituents. Environ. Technol. Innov. 2021, 23, 101798. [Google Scholar] [CrossRef]
- Nahar, S.; Hasan, M. Effect of chemical composition, anatomy and cell wall structure on tensile properties of bamboo fiber. Eng. J. 2013, 17, 61–68. [Google Scholar] [CrossRef] [Green Version]
- Rajkumar, G.R.; Krishna, M.; Narasimhamurthy, H.N.; Keshavamurthy, Y.C.; Nataraj, J.R. Investigation of tensile and bending behavior of aluminum based hybrid fiber metal laminates. Procedia Mater. Sci. 2014, 5, 60–68. [Google Scholar] [CrossRef] [Green Version]
- Vasanthan, N. Crystallinity determination of nylon 66 by density measurement and fourier transform infrared (FTIR) spectroscopy. J. Chem. Educ. 2012, 89, 387–390. [Google Scholar] [CrossRef]
- Vasanthan, N.; Salem, D.R. FTIR spectroscopic characterization of structural changes in polyamide-6 fibers during annealing and drawing. J. Polym. Sci. Part B Polym. Phys. 2001, 39, 536–547. [Google Scholar] [CrossRef]
- Zarrini, K.; Rahimi, A.A.; Alihosseini, F.; Fashandi, H. Highly efficient dye adsorbent based on polyaniline-coated nylon-6 nanofibers. J. Clean. Prod. 2017, 142, 3645–3654. [Google Scholar] [CrossRef]
- Mohammadhosseini, H.; Tahir, M.M.; Sayyed, M.I. Strength and transport properties of concrete composites incorporating waste carpet fibres and palm oil fuel ash. J. Build. Eng. 2018, 20, 156–165. [Google Scholar] [CrossRef]
- El-Newehy, M.H.; Al-Deyab, S.S.; Kenawy, E.R.; Abdel-Megeed, A. Nanospider technology for the production of nylon-6 nanofibers for biomedical applications. J. Nanomater. 2011, 2011, 626589. [Google Scholar] [CrossRef] [Green Version]
- Munawar, S.S.; Umemura, K.; Kawai, S. Characterization of the morphological, physical, and mechanical properties of seven nonwood plant fiber bundles. J. Wood Sci. 2007, 53, 108–113. [Google Scholar] [CrossRef]
- Mazzoli, A.; Monosi, S.; Plescia, E.S. Evaluation of the early-age-shrinkage of Fiber Reinforced Concrete (FRC) using image analysis methods. Constr. Build. Mater. 2015, 101, 596–601. [Google Scholar] [CrossRef]
- Cai, Z.; Chattopadhyay, N.; Liu, W.J.; Chan, C.; Pignol, J.P.; Reilly, R.M. Optimized digital counting colonies of clonogenic assays using ImageJ software and customized macros: Comparison with manual counting. Int. J. Radiat. Biol. 2011, 87, 1135–1146. [Google Scholar] [CrossRef]
- Sanusi, S.H.; Azman, A.N. Performance Analysis of Different Polymer Core for Badminton String Application. Res. Prog. Mech. Manuf. Eng. 2021, 2, 152–158. [Google Scholar]
- Mouradi, H.; El Barkany, A.; El Biyaali, A. Steel wire ropes failure analysis: Experimental study. Eng. Fail. Anal. 2018, 91, 234–242. [Google Scholar] [CrossRef]
- Bertelsen, I.M.G.; Ottosen, L.M. Engineering properties of fibres from waste fishing nets. In Proceedings of the International Conference on Materials, Systems and Structures in Civil Engineering: Conference Workshop on Cold Region Engineering, Lyngby, Denmark, 22–24 August 2016. [Google Scholar]
- Wang, F.; Shao, J. Modified Weibull distribution for analyzing the tensile strength of bamboo fibers. Polymers 2014, 6, 3005–3018. [Google Scholar] [CrossRef] [Green Version]
- Meng, C.; Li, W.; Cai, L.; Shi, X.; Jiang, C. Experimental research on durability of high-performance synthetic fibers reinforced concrete: Resistance to sulfate attack and freezing-thawing. Constr. Build. Mater. 2020, 262, 120055. [Google Scholar] [CrossRef]
- Fidelis, M.E.A.; Pereira, T.V.C.; Gomes, O.D.F.M.; de Andrade Silva, F.; Toledo Filho, R.D. The effect of fiber morphology on the tensile strength of natural fibers. J. Mater. Res. Technol. 2013, 2, 149–157. [Google Scholar] [CrossRef] [Green Version]
- Spadea, S.; Farina, I.; Carrafiello, A.; Fraternali, F. Recycled nylon fibers as cement mortar reinforcement. Constr. Build. Mater. 2015, 80, 200–209. [Google Scholar] [CrossRef] [Green Version]
- Balea, A.; Fuente, E.; Monte, M.C.; Blanco, A.; Negro, C. Recycled fibers for sustainable hybrid fiber cement based material: A review. Materials 2021, 14, 2408. [Google Scholar] [CrossRef]
- Tran, N.P.; Gunasekara, C.; Law, D.W.; Houshyar, S.; Setunge, S.; Cwirzen, A. Comprehensive review on sustainable fiber reinforced concrete incorporating recycled textile waste. J. Sustain. Cem.-Based Mater. 2022, 11, 41–61. [Google Scholar] [CrossRef]
- Pakravan, H.R.; Jeddi, A.A.A.; Jamshidi, M.; Memarian, F.; Saghafi, A.M. Properties of recycled carpet fiber reinforced concrete. In Use of Recycled Plastics in Eco-Efficient Concrete; Woodhead Publishing: Sawston, UK, 2019; pp. 411–425. [Google Scholar] [CrossRef]


| Band Position/cm−1 | Assignments |
|---|---|
| 3291 | N-H stretch |
| 2920 | Asymmetric CH2 stretch |
| 2851 | Symmetric CH2 stretch |
| 1635 | C=O stretch |
| 1545 | N-H stretch |
| 1464 | CH2 scissors |
| 1262 | CH2 twist-wagging |
| 720 | N-H deformation |
| Elements | Net Counts | Weight % | ||||
|---|---|---|---|---|---|---|
| Core Fiber | Outer Layer | Elasticity Outer | Core Fiber | Outer Layer | Elasticity Outer | |
| Carbon (C) | 19,657 | 5938 | 17,766 | 44.39 | 88.05 | 51.53 |
| Nitrogen (N) | 1259 | - | 793 | 25.80 | - | 25.05 |
| Oxygen (O) | 2144 | 83 | 1154 | 29.48 | 8.63 | 22.74 |
| Sodium (Na) | 105 | - | - | 0.32 | - | - |
| Silica (Si) | - | 271 | - | - | 3.32 | - |
| Aluminum (Al) | - | - | 264 | - | - | 0.68 |
| Layers | O1,C1,E1 | O2,C2,E2 | O3,C3,E3 | O4,C4,E4 | O5,C5,E5 | O6,C6,E6 | O7,C7,E7 | O8,C8,E8 | O9,C9,E9 | Mean | SD |
|---|---|---|---|---|---|---|---|---|---|---|---|
| Outer Layer (ϕ) µm | 53.843 | 50.500 | 51.272 | 53.171 | 52.016 | 53.334 | 51.816 | 51.150 | 53.408 | 52.278 | 1.190 |
| Core Fiber (ϕ) µm | 25.793 | 26.479 | 25.783 | 25.395 | 27.096 | 25.496 | 26.268 | 24.262 | 25.024 | 25.732 | 0.832 |
| Elasticity Outer (t) µm | 25.281 | 28.874 | 20.456 | 13.351 | 35.032 | 17.682 | 21.910 | 25.548 | 9.650 | 21.976 | 7.816 |
| Fiber Sample | Mean Diameter (μm) | Standard Deviation of Diameter (μm) | Overall Cross-Sectional Area of the Fiber (μm2) | Area of Voids (μm2) | Net Cross-Sectional Area of the Fiber (μm2) |
|---|---|---|---|---|---|
| New Fiber (N) | 799.1 | 9.8 | 509,470.3 | 4684.0 | 504,786.3 |
| Old Fiber (O) | 776.3 | 25.3 | 500,446.0 | 2321.0 | 498,125.0 |
| No of Fibers Failed | Three-Strand Fibers | Five-Strand Fibers | ||||||||||||||||||
|---|---|---|---|---|---|---|---|---|---|---|---|---|---|---|---|---|---|---|---|---|
| New Fibers (NF3) | Old Fibers (OF3) | New Fibers (NF5) | Old Fibers (OF5) | |||||||||||||||||
| 0 | 1 | 2 | 3 | 0 | 1 | 2 | 3 | 0 | 1 | 2 | 3 | 4 | 5 | 0 | 1 | 2 | 3 | 4 | 5 | |
| Fu | Fur | Fu | Fur | Fu | Fur | Fu | Fur | |||||||||||||
| Ultimate Force After Failure (in N) | 788.42 | 510.71 | 249.14 | 0 | 625.77 | 422.49 | 222.40 | 0 | 1073.77 | 849.14 | 682.41 | 614.26 | 410.96 | 0 | 882.039 | 637.63 | 525.68 | 362.00 | 318.51 | 0 |
| Residual Force loss Ratio (in %) | 0 | 35.22 | 68.40 | 100 | 0 | 32.48 | 64.45 | 100 | 0 | 20.9 | 36.44 | 42.79 | 61.72 | 100 | 0 | 27.70 | 40.40 | 58.95 | 63.88 | 100 |
| % Difference | 35.22 | 33.18 | 31.60 | - | 32.48 | 31.97 | 35.55 | - | 20.90 | 15.54 | 6.35 | 18.93 | 38.28 | - | 27.70 | 12.17 | 18.55 | 4.93 | 36.12 | - |
| Parameters | New Fiber | Old Fiber | ||||
|---|---|---|---|---|---|---|
| 100 mm | 80 mm | 60 mm | 100 mm | 80 mm | 60 mm | |
| Equation of the slope | y = 6.3462x − 41.517 | y = 5.2776x − 34.949 | y = 7.3154x − 48.858 | y = 7.2446x − 45.979 | y = 9.1796x − 59.112 | y = 8.5796x − 55.681 |
| R2 value | 0.88 | 0.93 | 0.79 | 0.89 | 0.97 | 0.94 |
| Weibull modulus (m) | 6.34 | 5.27 | 7.31 | 7.24 | 9.17 | 8.58 |
| Weibull reference strength (σₒ) | 693.68 | 751.55 | 795.35 | 570.58 | 626.09 | 658.47 |
| Average tensile strength (σAvg) of the fiber from tests conducted for this study | 648.53 | 695.14 | 749.03 | 537.40 | 596.65 | 625.55 |
| Difference in % | 6.96 | 8.11 | 6.18 | 6.17 | 4.93 | 5.26 |
| Material (Nylon Fibers) | Tensile Strength (MPa) | Elongation at Break (%) | Young’s Modulus (MPa) |
|---|---|---|---|
| Waste badminton string fiber (WBSF) | 490 | 20–33 | 4843 |
| Waste fishing net [6,10,53,9,54] | 173–440 | 15–33 | 785–3000 |
| Waste carpet fiber [21,53] | 110–402 | 15–30 | 2000–5150 |
| Waste textile fiber [55] | 285 | 19 | 5000 |
| Waste scrap brush [56] | 400 | - | - |
Disclaimer/Publisher’s Note: The statements, opinions and data contained in all publications are solely those of the individual author(s) and contributor(s) and not of MDPI and/or the editor(s). MDPI and/or the editor(s) disclaim responsibility for any injury to people or property resulting from any ideas, methods, instructions or products referred to in the content. |
© 2023 by the authors. Licensee MDPI, Basel, Switzerland. This article is an open access article distributed under the terms and conditions of the Creative Commons Attribution (CC BY) license (https://creativecommons.org/licenses/by/4.0/).
Share and Cite
M, K.; Nachiar, S.S.; Sekar, A. Engineering Properties of Waste Badminton String Fiber. Fibers 2023, 11, 25. https://doi.org/10.3390/fib11030025
M K, Nachiar SS, Sekar A. Engineering Properties of Waste Badminton String Fiber. Fibers. 2023; 11(3):25. https://doi.org/10.3390/fib11030025
Chicago/Turabian StyleM, Kumaresan, S Sindhu Nachiar, and Anandh Sekar. 2023. "Engineering Properties of Waste Badminton String Fiber" Fibers 11, no. 3: 25. https://doi.org/10.3390/fib11030025