
Corrosion Rate of Steel in Liquid Zn, Zn-Bi and Zn-Sn Baths

Department of Metallurgy and Recycling, Faculty of Materials Engineering, Silesian University of Technology, Krasińskiego 8, 40-019 Katowice, Poland
Coatings 2023, 13(6), 993; https://doi.org/10.3390/coatings13060993
Submission received: 3 May 2023
/
Revised: 22 May 2023
/
Accepted: 24 May 2023
/
Published: 26 May 2023
(This article belongs to the Special Issue Corrosion and Anticorrosion of Alloys/Metals)
Abstract
:In the hot dip galvanizing process, steel products are immersed in a liquid zinc bath. The contact of steel with liquid zinc causes the corrosion of the steel as a result of Fe dissolution processes in the liquid. If the dissolution process is carried out in a controlled manner, it results in the formation of a coating. Uncontrolled dissolution leads to the degradation of the steel surface. This article presents the results of research into the influence of Bi and Sn additions to zinc baths on the corrosion of steel in liquid zinc. Corrosion tests were carried out under conditions of kinetic dissolution using the rotating disc method. The kinetic dissolution constants of steel with different Si contents in Zn, Zn-0.5Bi and Zn-2Sn baths were determined. It was found that the addition of Bi and Sn lowers the value of the dissolution constant and may act as an inhibitor of Fe dissolution in liquid zinc. Based on the measurements and the determined value of the dissolution constant, the activation energy of kinetic dissolution was determined. It was found that in the temperature range of 440–480 °C, the addition of Bi and Sn increases the value of dissolution activation energy, which reduces the intensity of Fe transfer to the zinc bath.
1. Introduction
Zinc is a commonly used metal in various manufacturing processes. About half of the world’s zinc production is used to produce coatings in the hot dip galvanizing process [1]. The coatings obtained in this process constitute an effective and economical anti-corrosion protection, providing both a barrier and sacrificial protection to steel [2]. Therefore, the use of hot dip galvanizing is constantly growing, covering a new range of products made of iron alloys with a complex chemical composition, including iron castings [3], heat-treated high-strength steels [4] or wires intended for high-speed drawing [5].
Coatings are produced by hot dip galvanizing by immersing a steel product in liquid zinc. Contact between the steel surface with liquid zinc leads to the corrosion of the steel in the liquid zinc, the basic mechanism of which is dissolution [6]. The control of the corrosion process in liquid zinc allows the production of a coating of a certain thickness. It is largely a spontaneous process, leading to uncontrolled dissolution of iron in the liquid. This problem mainly concerns steel hot dip galvanizing kettles, whose durability is limited by corrosion in liquid zinc [7].
The nature of corrosion in liquid zinc may vary depending on whether the zinc bath is stationary or in motion relative to the entrained product and whether the substrate material is homogeneous [8]. In addition, in this case, as in other corrosion processes, the presence of alloying additives and impurities in the liquid phase may be of great importance. In industrial conditions, convective movements in the bath related to its heating, immersion and the emergence of products are inevitable. Steel is never a chemically homogeneous material. From the point of view of the hot dip galvanizing process, the most important alloying element in steel is Si [9]. In Si concentration ranges below 0.3 wt.% (low-silicon steel), coatings are formed with a layered phase structure, i.e., δ1, ζ and η, and parabolic layer growth kinetics are observed. Increasing the Si content to the range of 0.3–0.12 wt.% Si leads to a rapid increase in the thickness of the coating caused by the increase in the ζ phase and the linear course of the kinetics of the coating growth. This effect is known as the Sandelin effect [10].
At Si contents in the range of 0.12–0.22 wt.% Si, steels show lower reactivity in liquid zinc and return to the parabolic law of coating thickness growth (Sebisty’s steel) [11]. On the other hand, increasing the Si content above 0.22 wt.% (high-silicon steel) again causes a rapid, linear increase in the coating thickness [9]. Therefore, changes in the Si content have a very intensive effect on the course of the reaction between steel and liquid zinc [12]. In addition, a zinc bath always contains alloying additions that affect the processability of the bath (Al), limit the reactivity of Sandelin’s steel (Ni) and improve the conditions for forming the outer layer of the coating (Pb, Bi and Sn) [13]. While the influence of Al and Ni on the formation of coatings is described in detail in the literature, the studies on the interaction of Pb, Bi and Sn are mainly limited to determining their influence on the appearance of the coating and the castability and surface tension of liquid zinc. Pb as a toxic metal is becoming less and less important in the hot dip galvanizing process [14]. Its place is more and more commonly being taken by Bi and Sn. However, the picture of the influence of these alloy additions on the course of the reaction between Fe and liquid zinc is incomplete.
This article presents the results of research on the influence of Bi and Sn additions on the corrosion course of steel with different Si contents in liquid zinc. The dissolution rate constant and the activation energy of the dissolution process in the conditions of forced convection in the zinc bath in the temperature range of 440–480 °C were determined.
2. Views on the Mechanism of Dissolution of Solid Metals in Liquid Metals
The mechanism of the dissolution of solid metal in liquid metals is not fully explained [15]. Hypothetical mechanisms assume that the transport of solid metal atoms (ions) into liquid takes place as a result of:
- -
- The formation of intermetallic phases on the solid metal surface;
- -
- Creating solutions;
- -
- Mass transfer under the influence of a temperature gradient;
- -
- Reaction with impurities.
According to Eremenko et al. [16], the dissolution of solid metal in liquid can take place in two stages:
- -
- The transition of atoms (ions) or molecules of solid metal into the liquid;
- -
- Transferring the mass of the dissolved metal into the volume of the alloy.
The first stage of dissolution is called kinetic, while the second is called diffusion.
The rate of dissolution can be determined using the Nernst equation [17]:
where: S—surface area, cm2;
V—volume of the bath, cm3;
D—diffusion coefficient, cm2/s;
δ—diffusion Nernst layer thickness, cm;
cs—saturation concentration in the liquid, g/cm3;
c—the concentration of the metal dissolved in the liquid over time t, g/cm3.
During the hot dip galvanizing process, the products of the reaction between steel (iron) and liquid zinc are Fe-Zn intermetallic products that form the diffusion layer of the coating [9,12,13]. According to hypothetical dissolution mechanisms, it can be assumed that the transport of iron atoms (ions) into liquid zinc is mediated by Fe-Zn intermetallic compounds. According to the principles of fluid dynamics, under real conditions, dissolution depends on solid state diffusion, natural convection and mechanical mass transport (forced convection). All these phenomena occur simultaneously, causing the growth of the Fe-Zn intermetallic compound at the steel/Fe-Zn intermetallic compound interface and the simultaneous destruction of the Fe-Zn intermetallic compound at the Fe-Zn intermetallic compound/liquid zinc interface. The dissolution of Fe-Zn intermetallic compound directly adjacent to the zinc bath (ζ or δ1) occurs simultaneously with the course of the reaction diffusion, which to a greater or lesser extent changes the nature of the growth kinetics of the diffusion layer of the coating, causing deviations from the generally accepted parabolic law for diffusion processes [18].
However, the convection phenomena can be intensified so that the entire Fe-Zn intermetallic layer is dissolved in the liquid. Under such conditions, the effect of diffusion phenomena is negligibly small compared to mass transport by convection [19]. Under such conditions, it is possible to observe phenomena at the solid/liquid interface under conditions of kinetic dissolution.
Dissolution testing methods are largely subjective and do not allow for a quantitative assessment of the occurring phenomena. This is due to the large number of overlapping partial processes. It is necessary to maintain the variability of only one parameter during the tests. If the molten metal moves relative to the stationery liquid or intensive mixing of the liquid metal occurs, the formation of an intermetallic layer that affects the kinetics of the corrosion process is prevented. The process can be carried out by a disc made of solubilized material that rotates into a liquid [20].
The rotating disc technique is often used to study reactions between a solid and a liquid, and the solution of diffusion equations in such a system is well known [21]. The sample is in the shape of a cylinder with an inert vertical sidewall. The reactions take place on the disc-shaped bottom surface, which is immersed in the liquid. The sample rotates around its axis with a constant rotation speed ω. In the rotating disc method, the dissolution of solid metal in liquid metals can proceed in two stages [21,22]:
- -
- Diffusion, in which the rate of dissolution depends on the rotational speed of the disc according to the equation:
D—diffusion coefficient, cm2/s;
ν—kinematic viscosity of the dissolution medium, cm2/s;
ω—rotation speed of disc, rpm.
- -
- Kinetic, in which the rate of dissolution does not depend on the rotational speed of the disc according to the equation:
ko—pre-exponential factor of the kinetic dissolution equation, cm2/s;
E—activation energy of the kinetic dissolution stage, J/mol;
R—gas constant, J/mol∙K;
T—temperature, K.
3. Materials and Methods
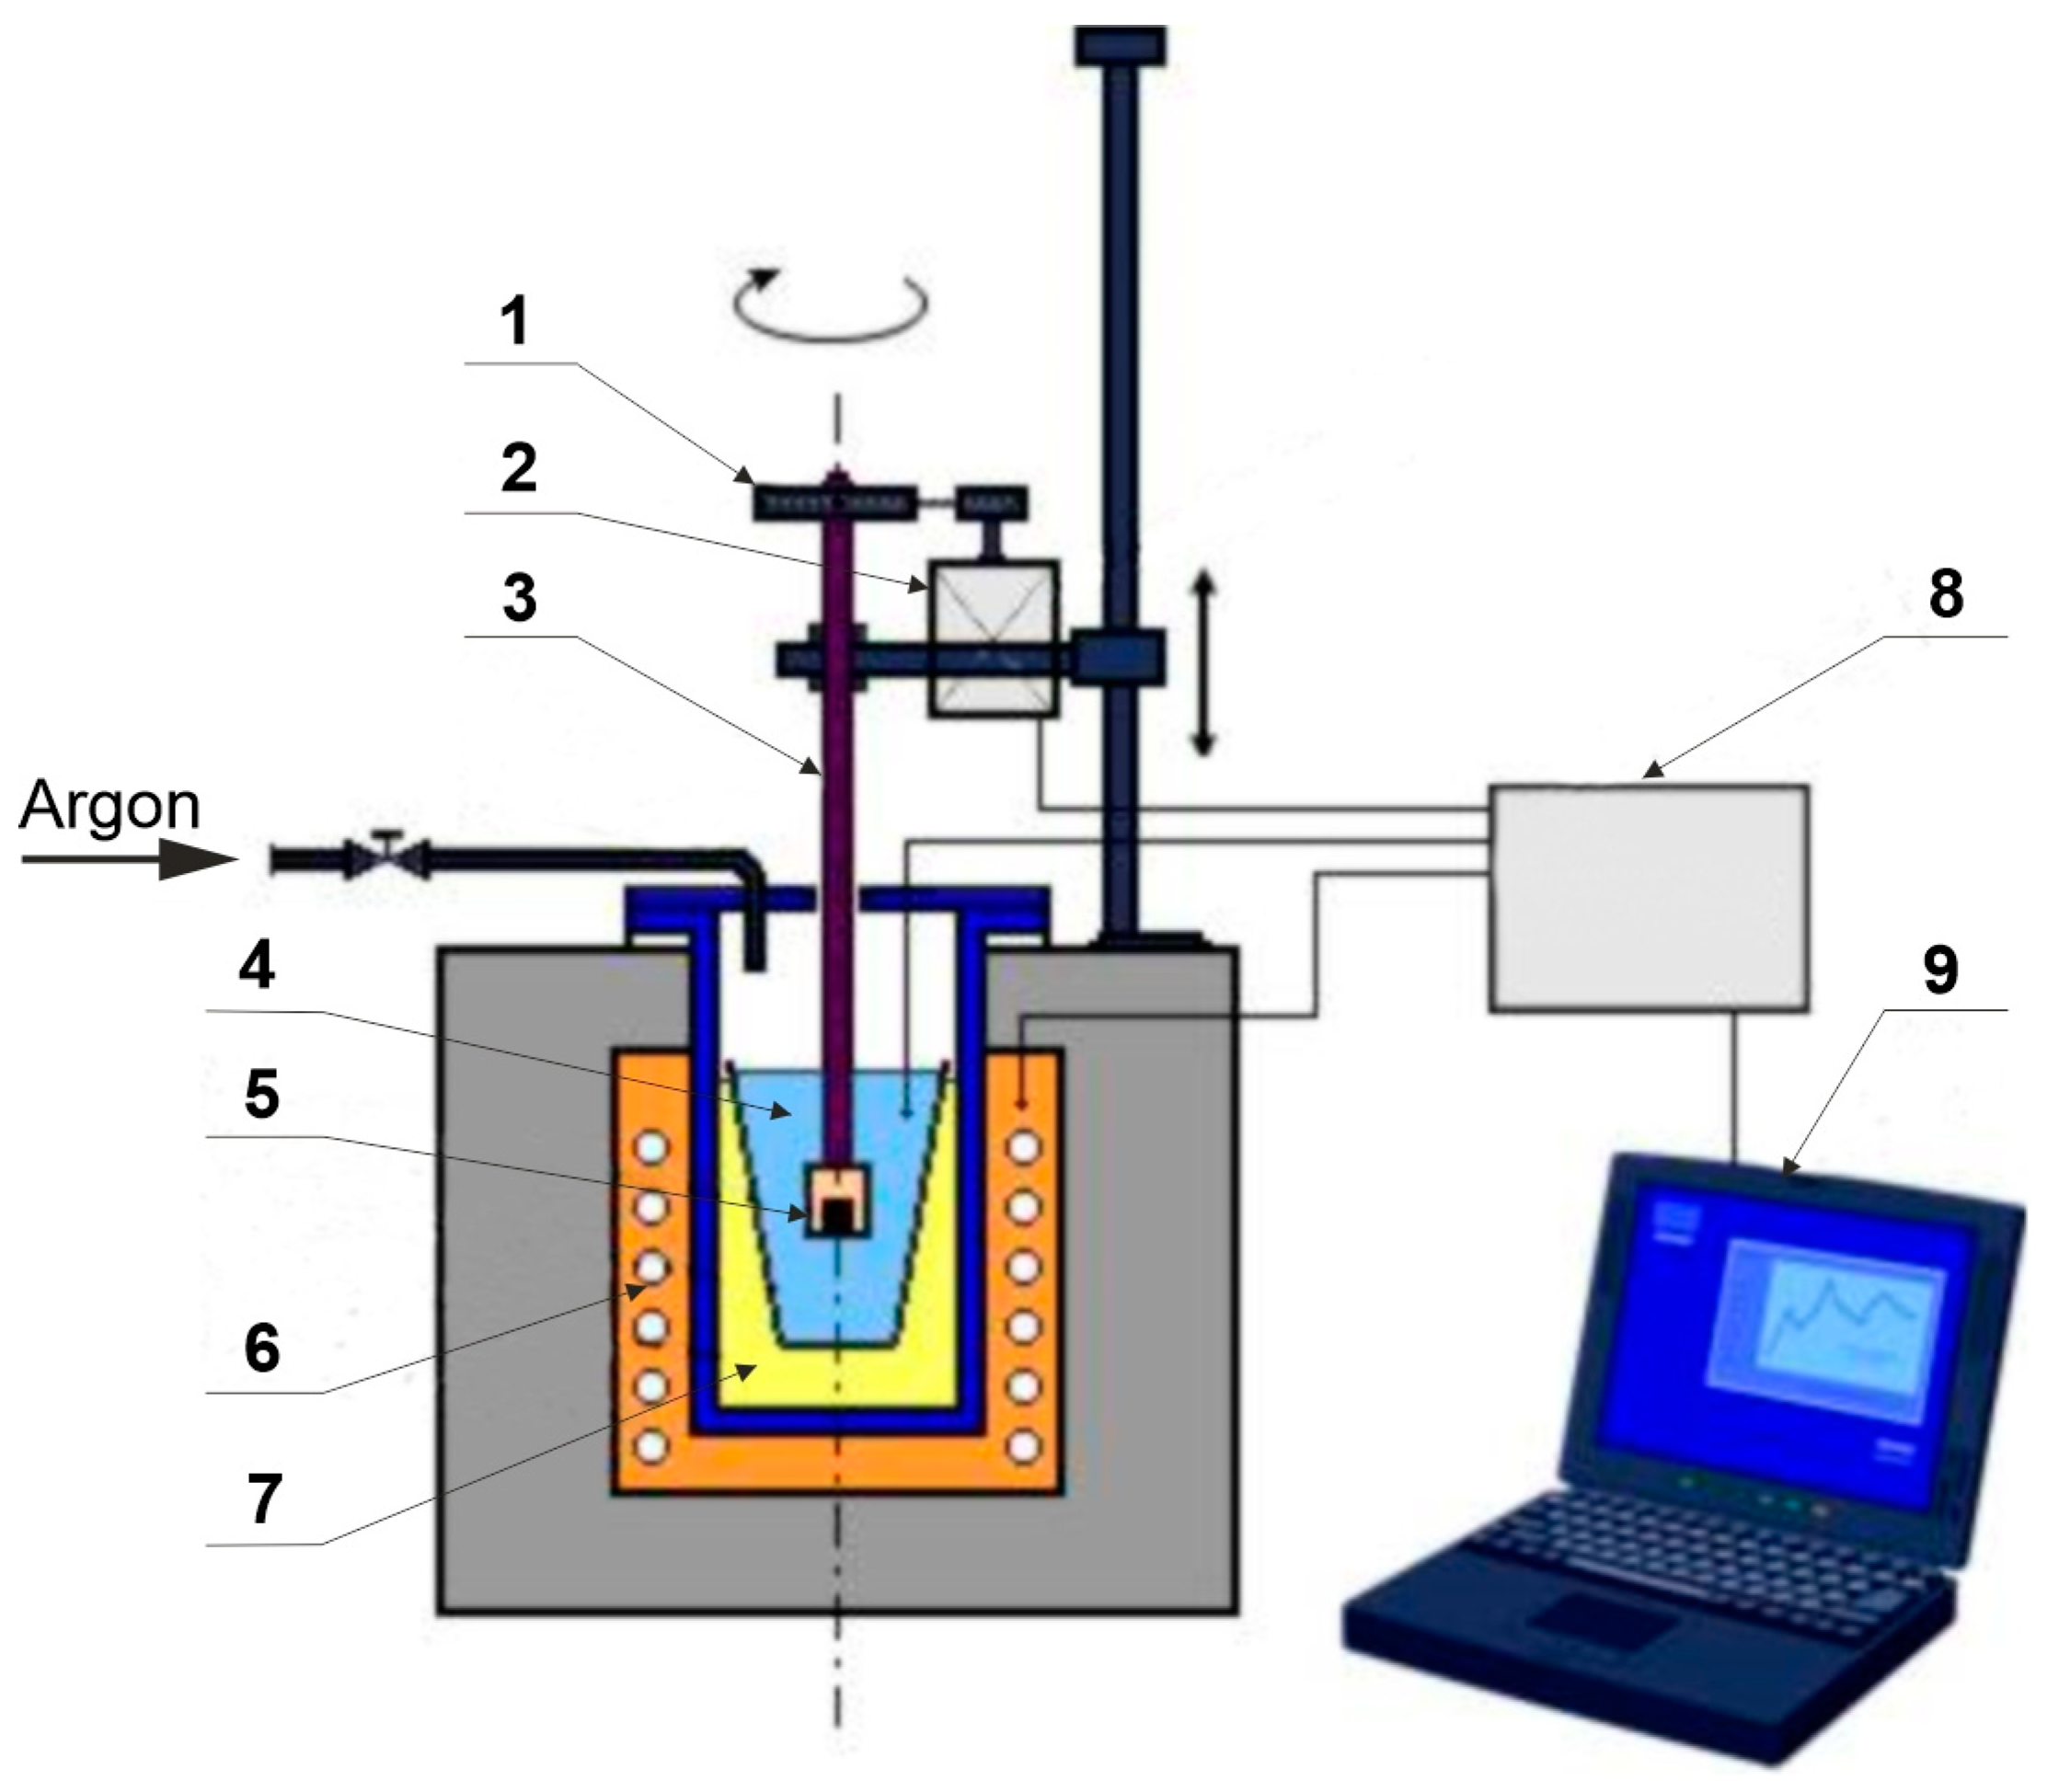
A rotating disc device was used for the dissolution tests, a diagram of which is shown in Figure 1. The rotating disc device consisted of the following components:
- -
- A resistance furnace with an alumina crucible with a capacity of 0.6 dm3 with a furnace chamber filled with quartz sand to increase the heat capacity and temperature stability;
- -
- An adjustable drive system of the sample centrifugation;
- -
- Temperature and rotation speed measurement and control systems.
Figure 1.
Schematic diagram of the rotating disc apparatus: 1—drivetrain system, 2—electrical motor, 3—molybdenum holder, 4—alumina crucible with liquid zinc bath, 5—graphite cover with steel sample, 6—resistance-heating furnace, 7—quartz sand filling, 8—control system, 9—computer PC.
Figure 1.
Schematic diagram of the rotating disc apparatus: 1—drivetrain system, 2—electrical motor, 3—molybdenum holder, 4—alumina crucible with liquid zinc bath, 5—graphite cover with steel sample, 6—resistance-heating furnace, 7—quartz sand filling, 8—control system, 9—computer PC.

Dissolution studies were carried out in a bath of “pure” Zn and in baths with the addition of 0.5 wt.% Bi and 2 wt.% Sn. The baths were prepared from the following input materials: super-high-grade zinc, pure bismuth 99.99% and pure tin 99.85%. Before starting the dissolution tests, the content of alloying additions was determined. The chemical compositions were determined using an ARL 3460 emission spectrometer (Thermo ARL, Waltham, MA, USA) and are presented in Table 1.
Four types of steel were used for the tests. The Si content was adopted as the steel selection criterion so that the tested steel was in the range of low-silicon steels, Sandelin’s steels, Sebisty’s steels and high-silicon steels. The chemical compositions of the steel were determined using a Spectro Lab M8 emission spectrometer (SPECTRO Analytical Instruments, Kleve, Germany) and are presented in Table 2.
The test specimens had the shape of a cylinder with a diameter of 11.3 ± 0.3 mm (area of 1 cm2) and a height of 10 ± 0.5 mm. The samples were subjected to chemical surface preparation. Acid degreasing was carried out in a HydronetDase solution (SOPRIN S.r.l., Maserada Sul Piave, Italy) for 5 min. Then, the samples were etched in a 12% HCl solution (Chempur, Piekary Śląskie, Poland) for 10 min, rinsed in water and dried in a stream of hot air. After drying, the samples were weighed on an analytical balance with an accuracy of ±0.00001 [g]. Then, the samples were placed in a precisely fitting graphite casing so that only the base of the sample was dissolved. The base surface of the sample was fluxed with TegoFlux60 (Dipl. Ing. Herwig GmbH, Hagen, Germany) and dried with a stream of hot air. Then, the samples were immersed at nominal rotations in a zinc bath. An inert gas (argon) was continuously supplied over the zinc bath mirror to eliminate oxidation of the bath surface. Dissolution tests were carried out at rotational speeds of 200, 300, 400, 500 and 600 rpm, with immersion times of 10, 20, 40 and 60 min and at temperatures of 440, 460 and 480 °C. After the assumed time, the samples were removed from the bath without interrupting the rotation and then cooled in air. After removal from the graphite casing, the samples were subjected to pickling in order to remove the solidified layer of the bath from its surface. A one-molar HCl solution with the addition of 4 g/dm3 C6H12N4 (Urotropine) as an iron dissolution inhibitor was used for the pickling. The samples were etched for 10 min. After pickling, the samples were weighed again with an accuracy of ±0.00001 [g].
From the obtained gravimetric test results, the unit mass loss was determined as a function of the bath rotation time Δm = f(t). The dissolution rate constant “k” was read each time from the graph of the function Δm = f(t) as tg of the slope angle of the experimental data trend line, assuming a linear model. The determined values of the dissolution constant “k” made it possible to calculate the activation energy of the kinetic dissolution process of the tested steels in the temperature range of 440–480 °C.
4. Results and Discussion
4.1. Calculation of the Error of the Weight Measurements
The uncertainty of dissolved iron weight measurements is related to the solubility of the substrate during pickling in hydrochloric acid and the effect of the disc rotation speed.
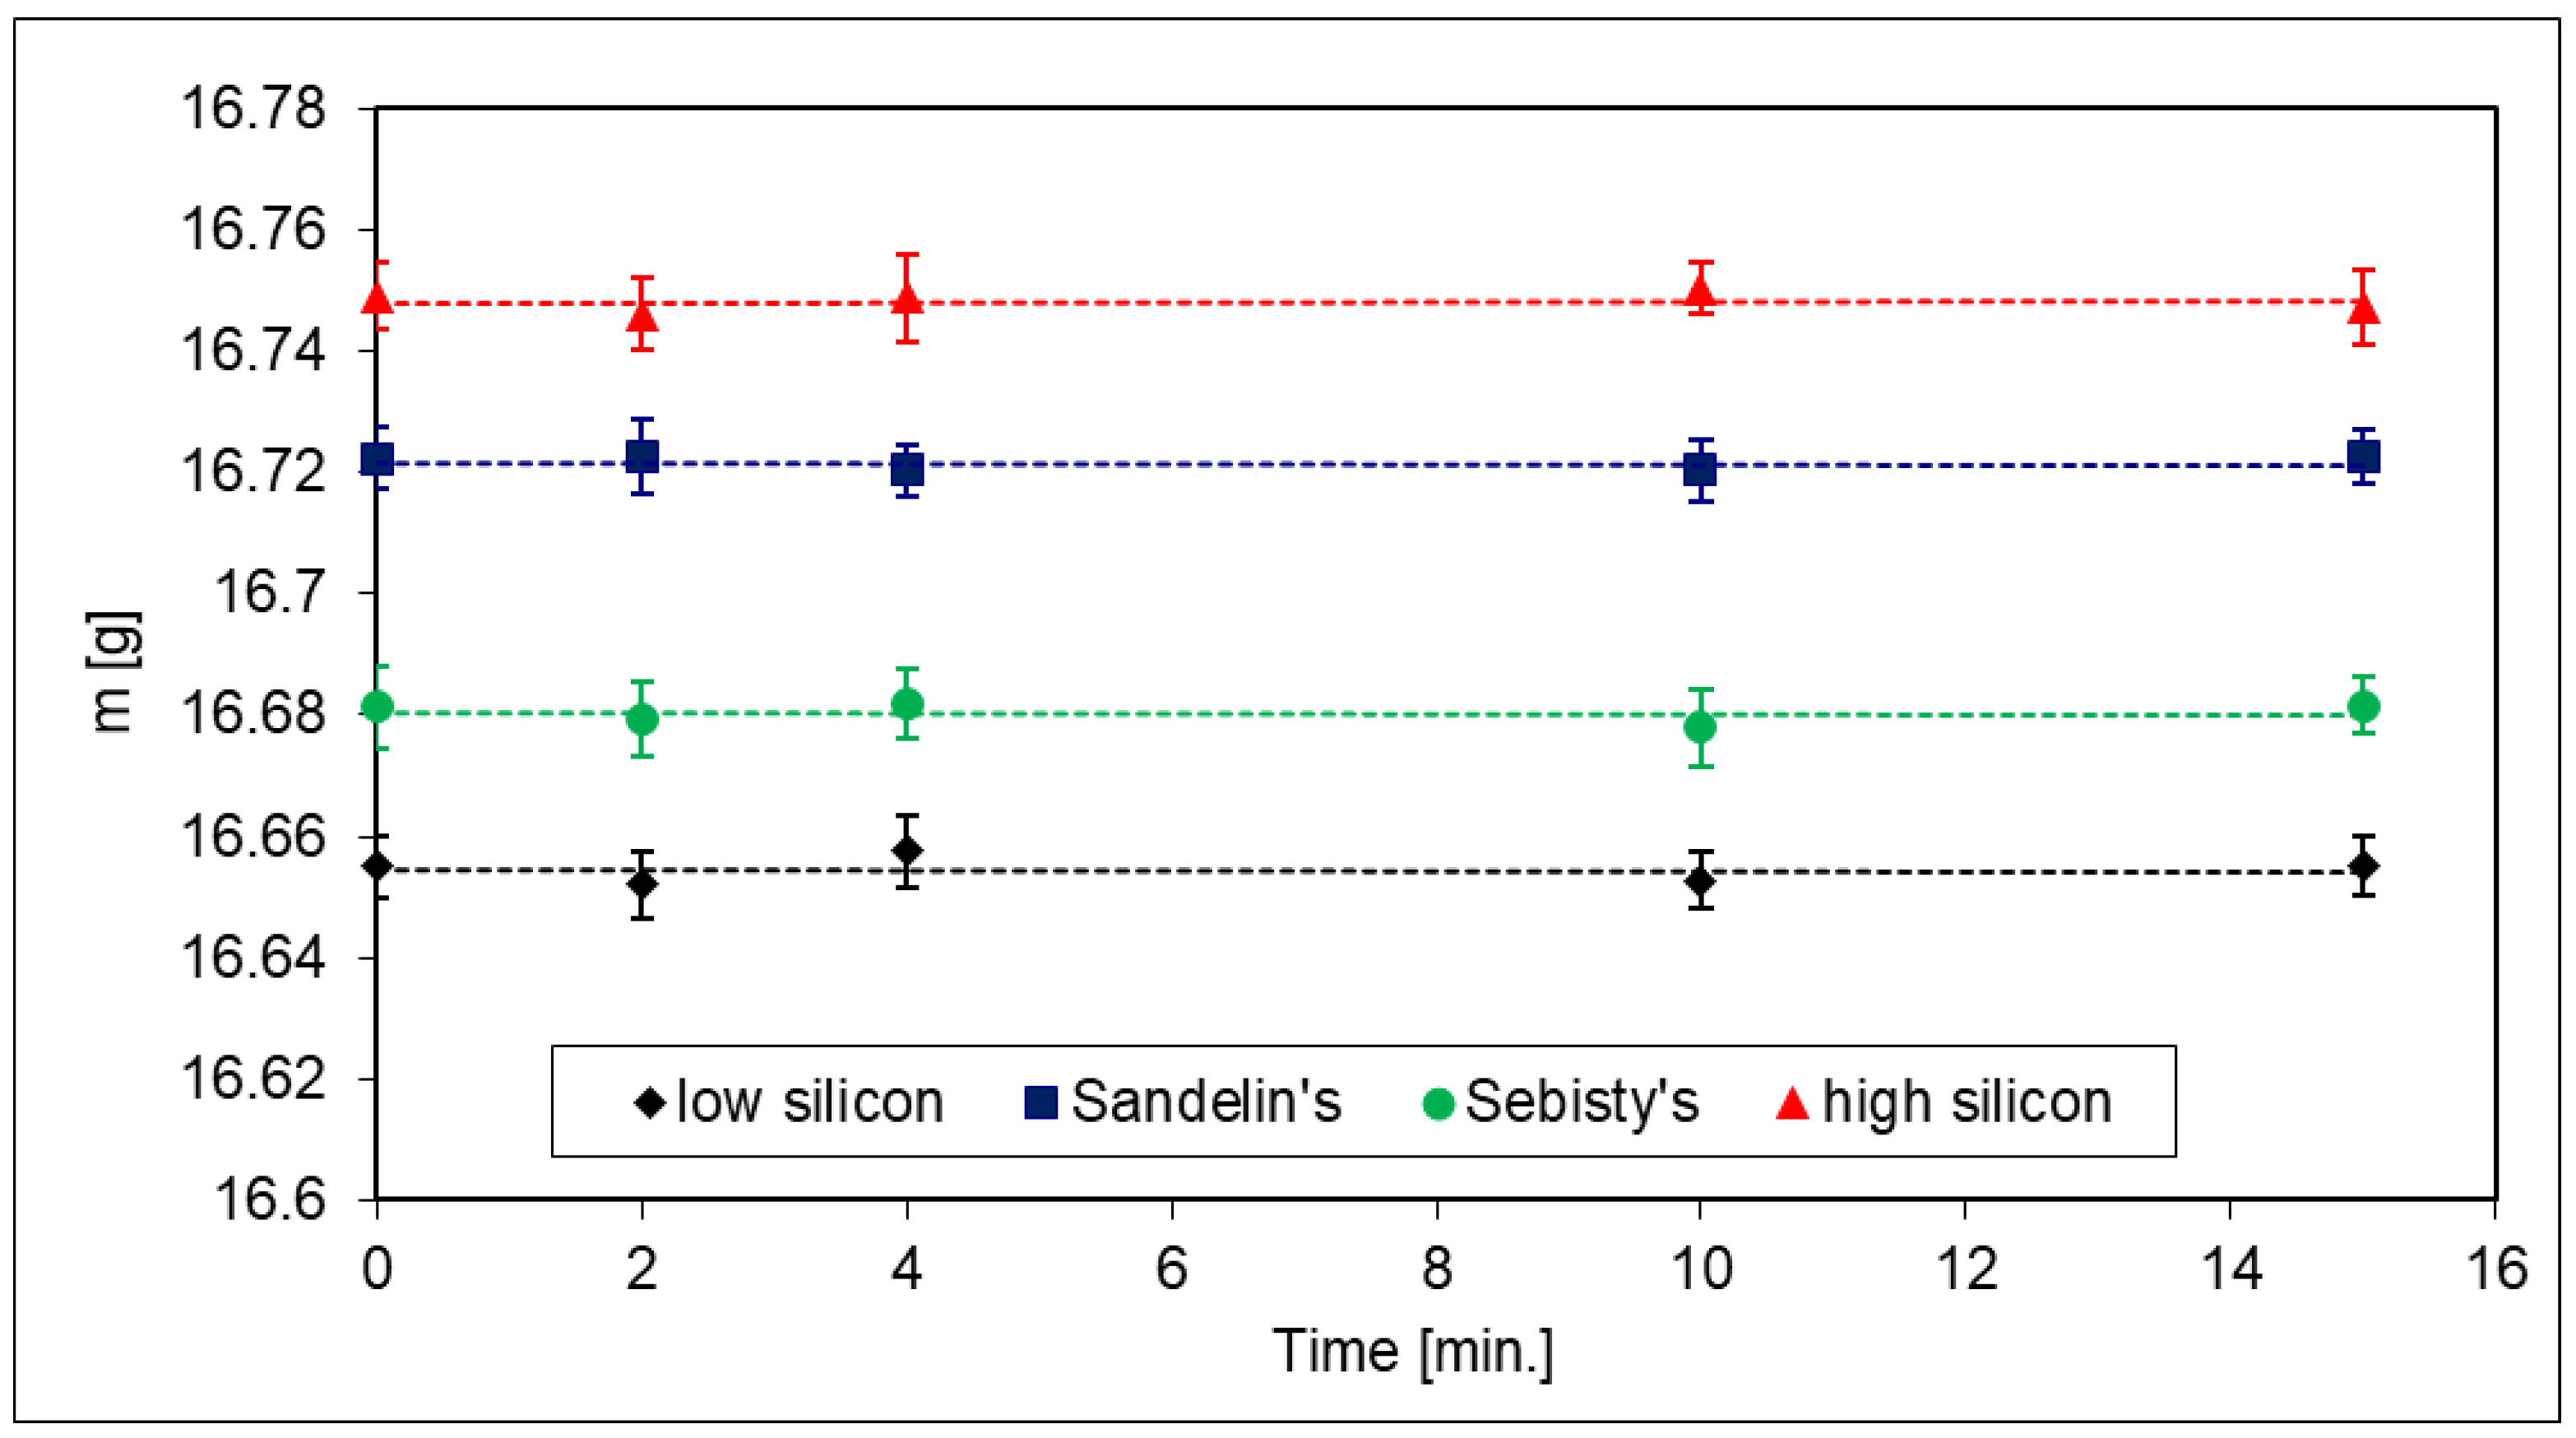
In order to determine the mass loss of iron in the process of dissolving steel in a zinc bath, it is necessary to remove the layer of zinc solidified on the surface of the sample after the experiment. Before starting the dissolution tests, pickling tests were carried out for all the tested steels in a solution of hydrochloric acid with the addition of a corrosion inhibitor. The changes in the mass of the samples during the pickling in a solution of 1 mol/dm3 HCl + 4 g/dm3 C6H12N4 are shown in Figure 2. With a pickling time of up to 15 min, no significant changes in the weight of the samples were observed. The equation of the trend line of the experimental data and the angle of its inclination to the pickling time axis close to 180° testifies to the small changes in the weight of the steel samples (Table 3). After 10 min of pickling time, the maximum weight loss was approx. 0.00003 g.
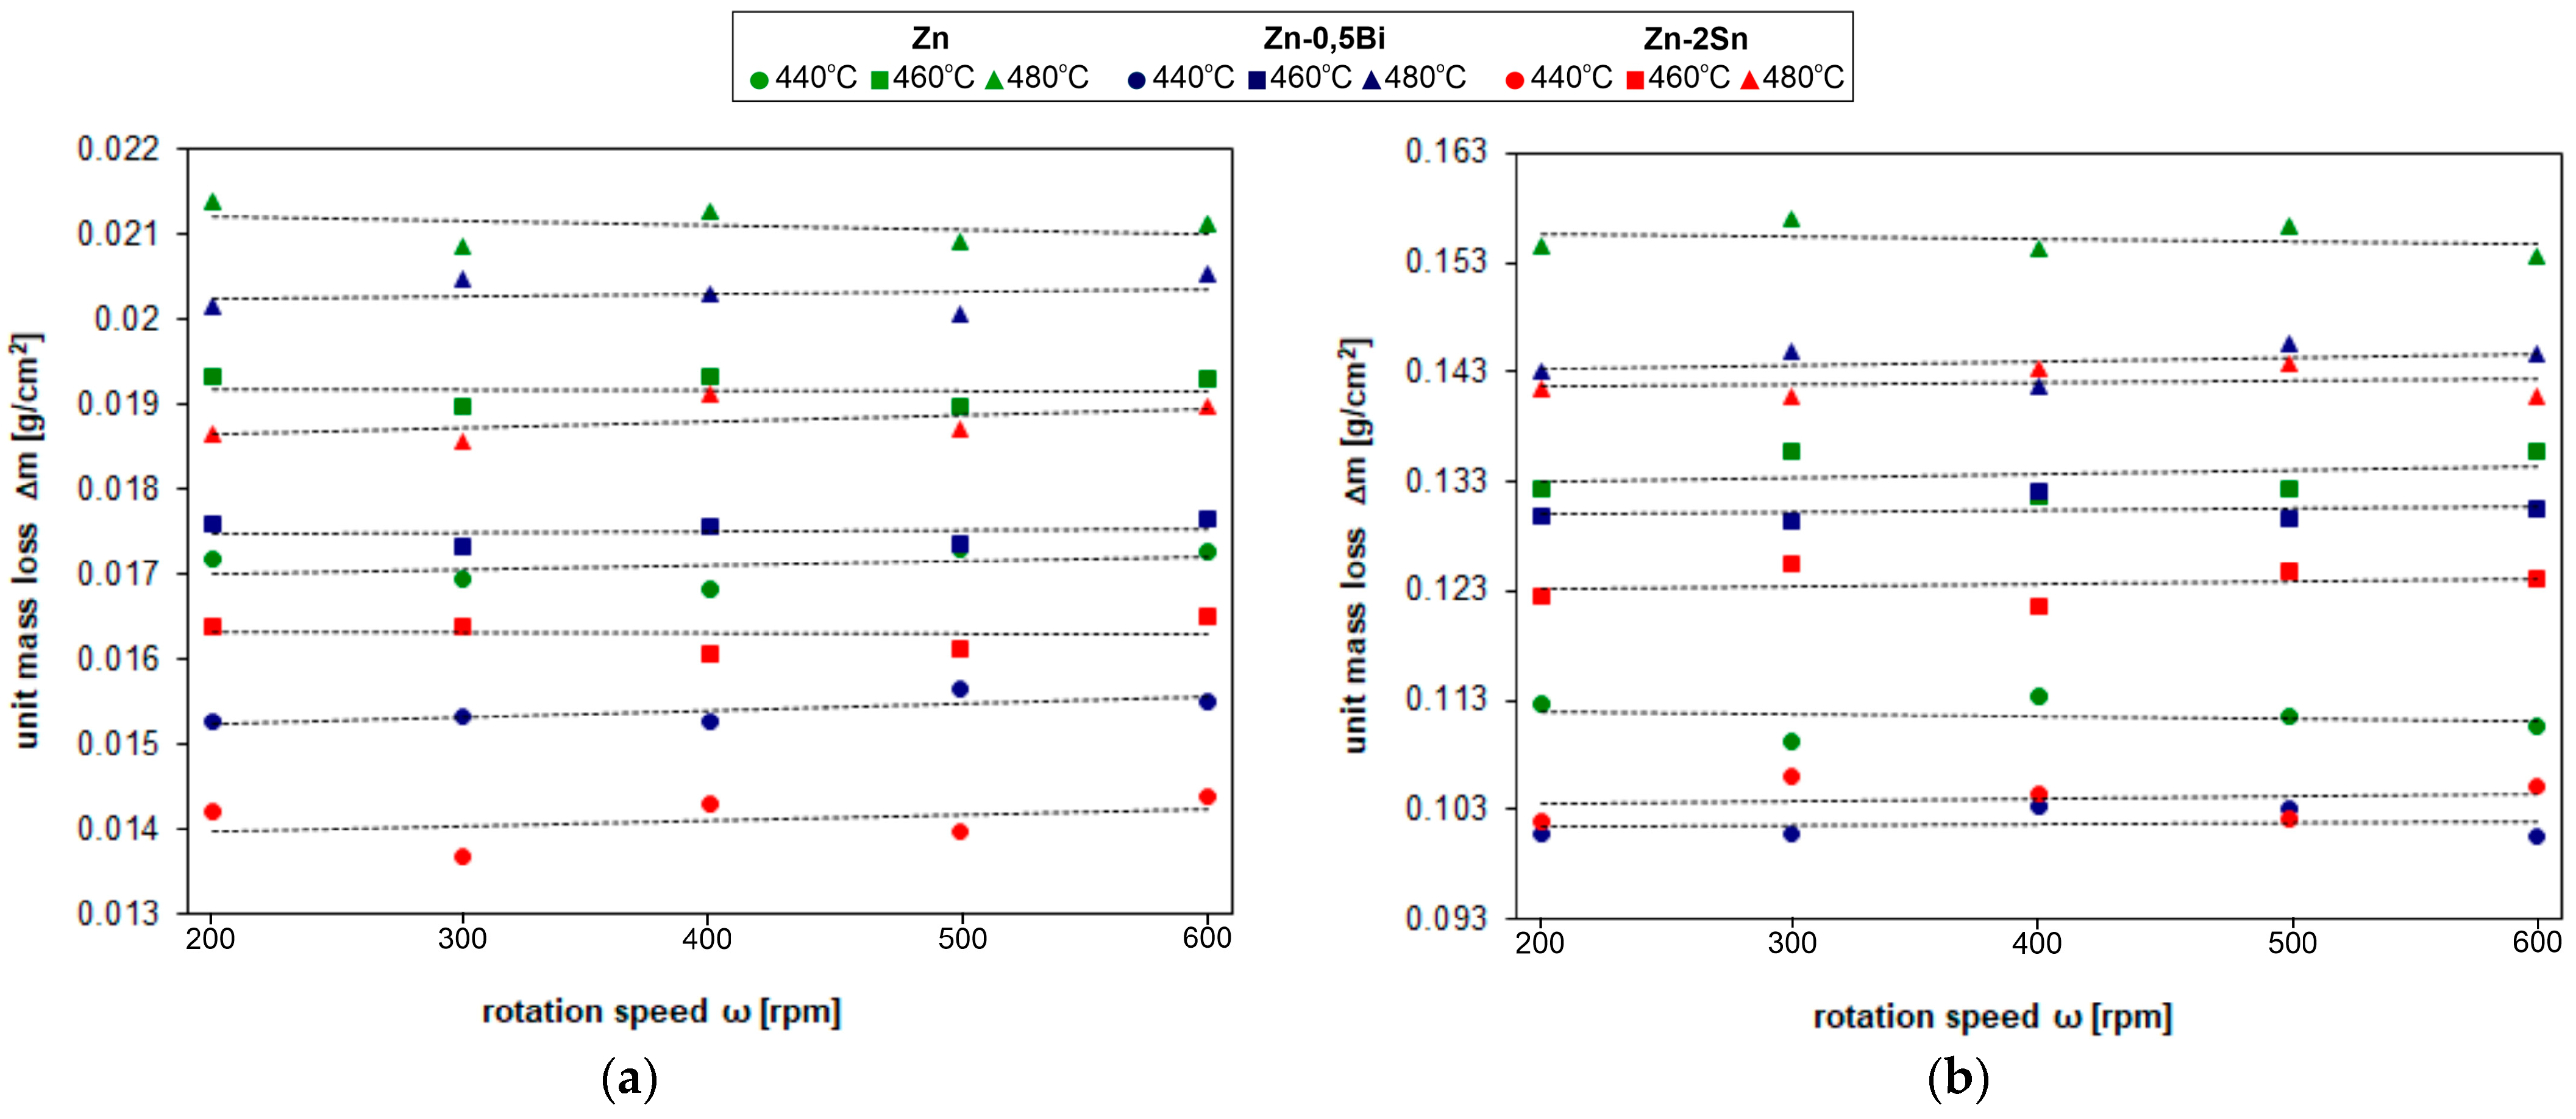
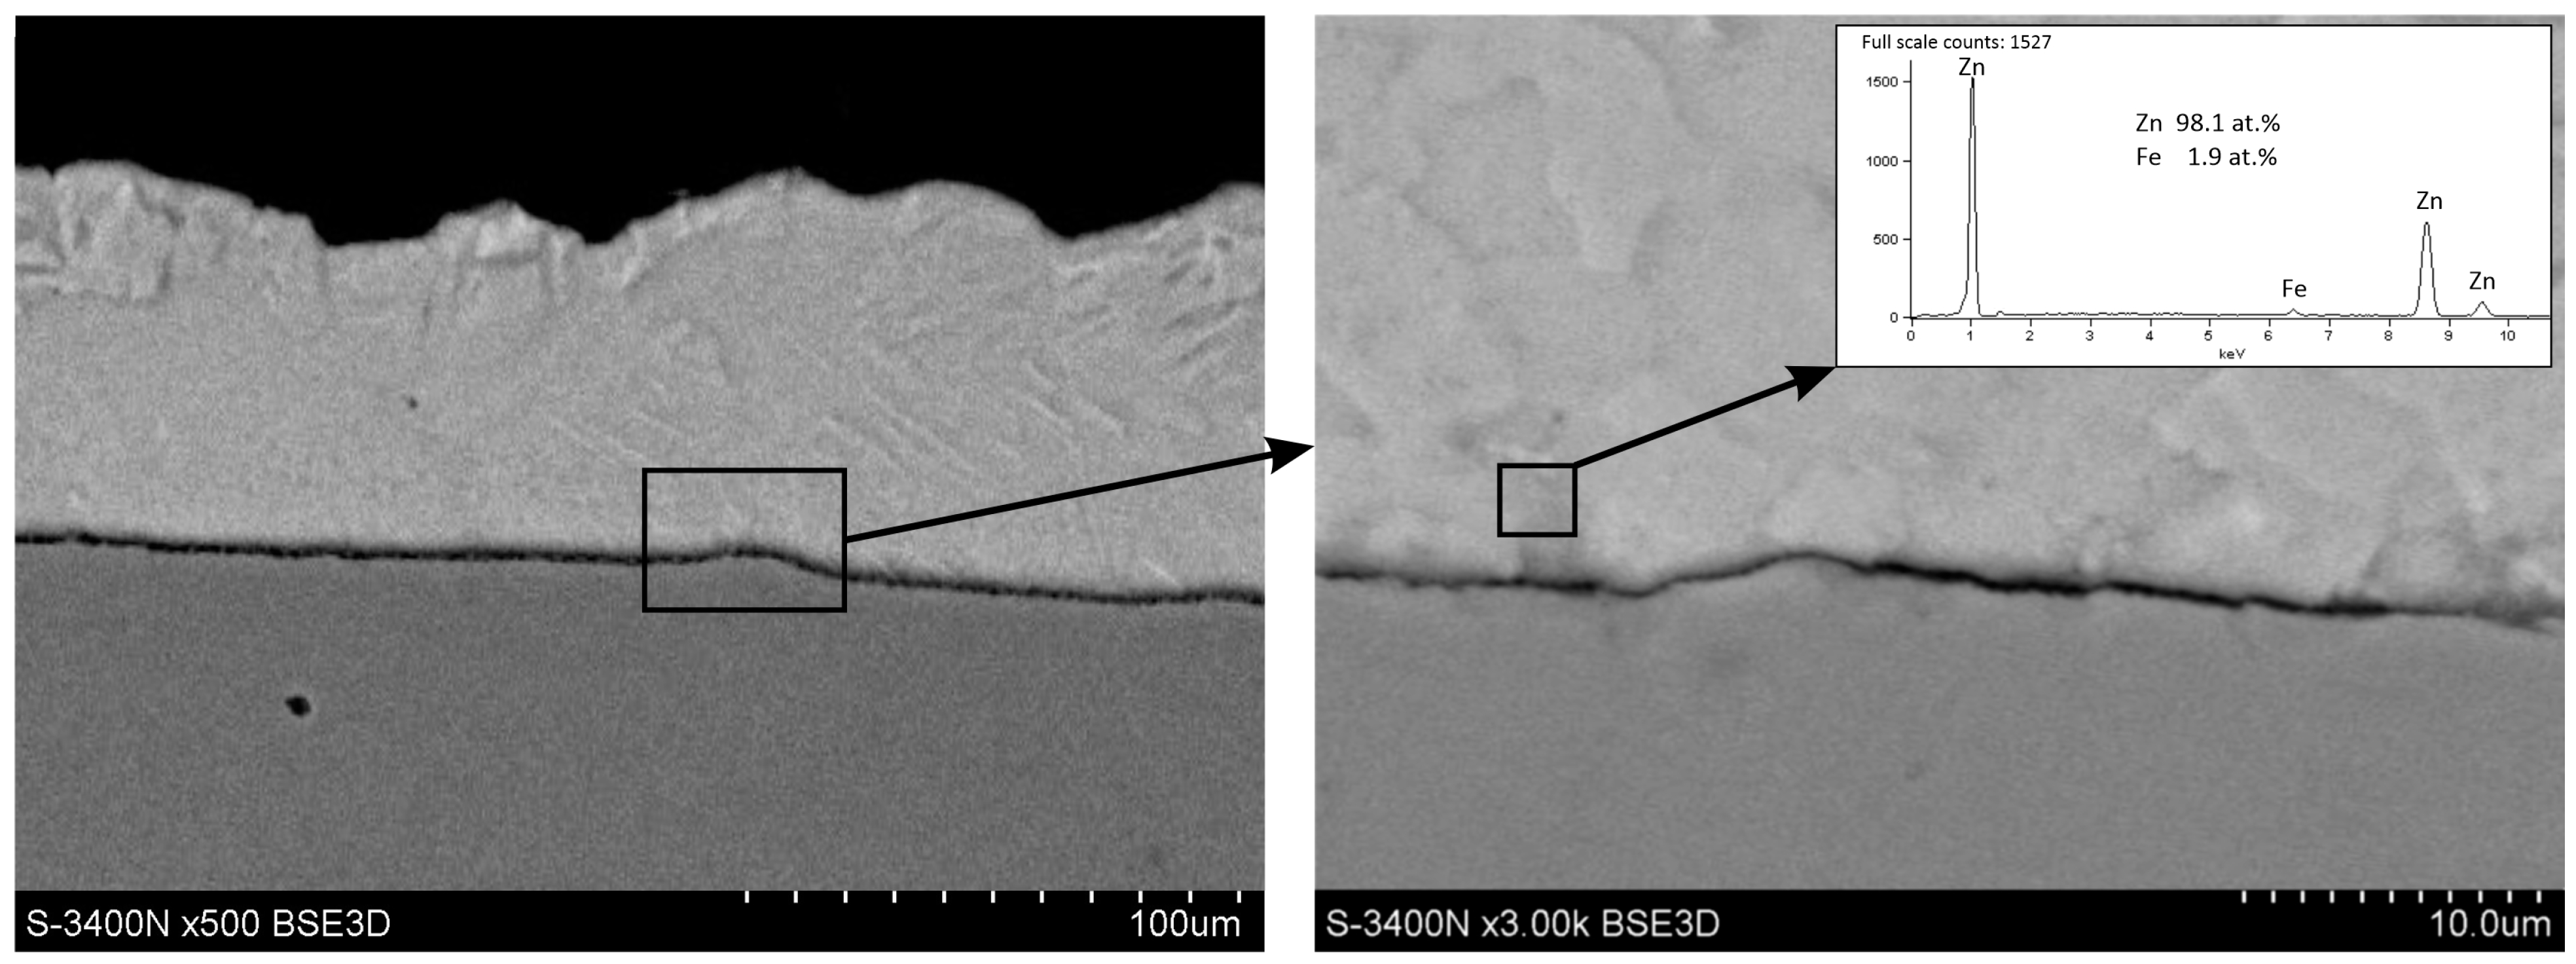
Figure 3 shows the variability in the mass of the low-silicon steel samples dissolved at different disc rotation speeds for extreme rotation times of 10 and 60 min. The equation of experimental data trend line for rotation speeds from 200 to 600 rpm indicated a linear waveform (Table 4). Small changes in the angle of inclination of the trend line to the rotation speed axis, oscillating around 180 °C, allowed us to claim that the unit mass losses of the steel samples did not depend on the disc rotation speed in the tested range of rotation speeds. On the other hand, an increase in the size of mass losses was observed with an increase in the bath temperature and rotation time. Since the unit mass losses did not depend on the rotation speed, it can be claimed that the dissolution process took place in the kinetic stage. It can therefore be assumed that no Fe-Zn intermetallic layer was formed at the contact point between the steel and the zinc bath, which affected the rate of the corrosion processes. This assumption was confirmed by SEM images at the steel/liquid interface after removing the sample from the bath (Figure 4). The SEM images show that there was a layer of solidified zinc on the surface. The EDS analysis showed a relatively high Fe content in this layer.
The presented graphical picture of the dependence of the unit mass losses on the rotation rate provided the basis for presenting the average mass loss in the examined range of rotation speeds as a function of the dissolution time. The values of the average mass losses of the low-silicon steel samples are presented in Table 4. For the experimental results for this steel, the value of the standard deviation ranged from 0.00013–0.00024 g/cm2 for a rotation time of 10 min and 0.00290–0.00648 g/cm2 for a 60 min rotation time. The average weight losses of the Sandelin’s steel, Sebisty’s steel and high-silicon steel, which are shown in Figure 4, Figure 5, Figure 6 and Figure 7, were within similar limits of measurement error.
Figure 3.
The dependence of unit mass loss of low-silicon steel on rotation speed for bath immersion times of (a) 10 min and (b) 60 min.
Figure 3.
The dependence of unit mass loss of low-silicon steel on rotation speed for bath immersion times of (a) 10 min and (b) 60 min.

Figure 4.
SEM images and EDS analysis (inset) of low-silicon steel/liquid interface after removing the sample from the Zn bath after 60 min of rotation at 480 °C and at 200 rpm.
Figure 4.
SEM images and EDS analysis (inset) of low-silicon steel/liquid interface after removing the sample from the Zn bath after 60 min of rotation at 480 °C and at 200 rpm.

4.2. Kinetics of Dissolution Steel in Zinc Bath
4.2.1. Low-Silicon Steel
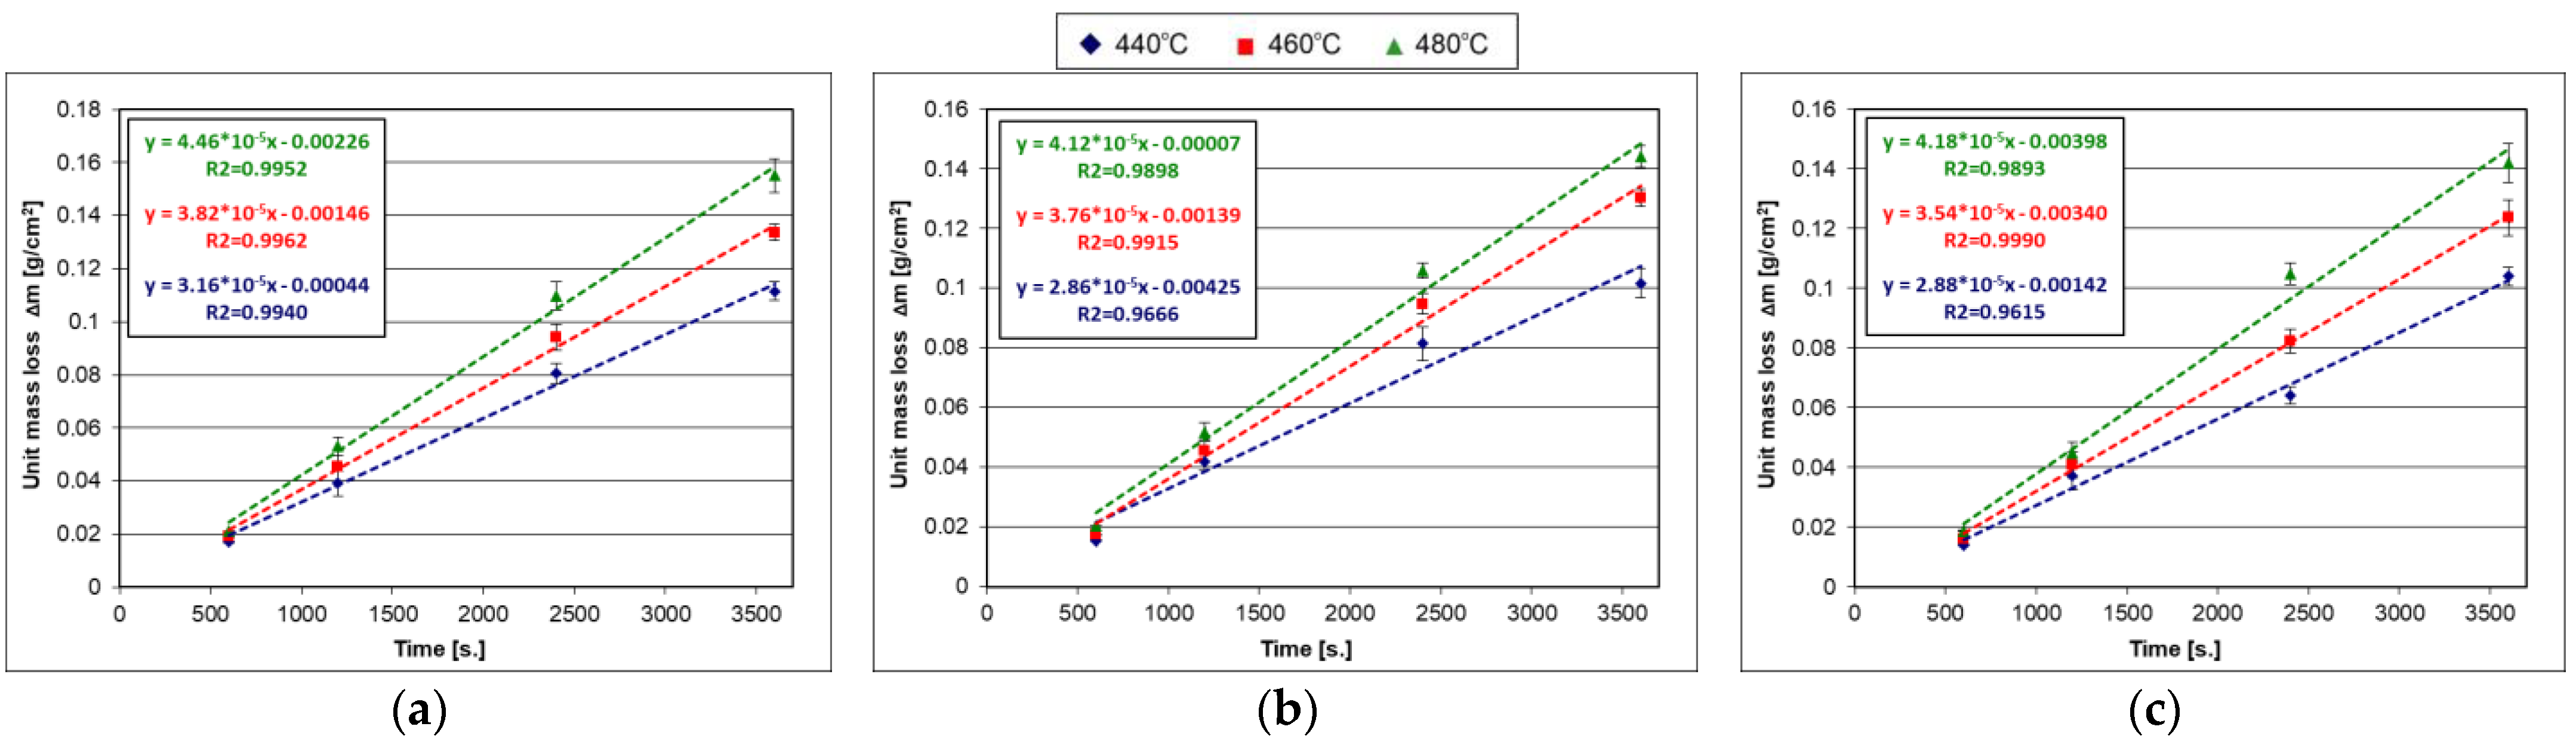
Figure 5 shows the changes in the average unit mass losses of the low-silicon steel samples during dissolution in the Zn, Zn-0.5Bi and Zn-2Sn baths. The dissolution kinetics of the low-silicon steel showed that the value of the unit mass loss increased with the increase in the time and temperature. A decrease in the unit mass loss in the baths containing Bi and Sn was also observed. Under the most extreme dissolution conditions (temp. 480 °C and time 60 min), the unit mass loss in the Zn bath was 0.155 g/cm2, while in the Zn-0.5Bi and Zn-2Sn baths it was 0.144 g/cm2 and 0.142, respectively g/cm2. The low-silicon steel dissolution experimental data showed a good fit to the linear function. The graphs (Figure 5) show the equations of the experimental data trend lines and the value of the fit coefficient, R2. The graphical presentation of the dissolution kinetics was the basis for determining the dissolution rate constant, k, in g/m2*s, which was then converted to mol/m2*s. The values of the dissolution rate constant in the tested zinc baths in the temperature range of 440–480 °C are presented in Table 5. These data show that the value of the dissolution rate constant k increased with the increase in the temperature. At the same time, the presence of Bi and Sn in the bath reduced the dissolution rate constant. For example, at 480 °C, the dissolution rate constant in the Zn bath was 0.00799 mol/m2∙s, while in the Zn-0.5Bi and Zn-2Sn baths it was 0.00739 mol/m2·s and 0.00750 mol/m2·s, respectively.
Figure 5.
Dependence of average unit mass losses on the dissolution time of low−silicon steel in (a) Zn, (b) Zn−0.5Bi and (c) Zn−2Sn baths.
Figure 5.
Dependence of average unit mass losses on the dissolution time of low−silicon steel in (a) Zn, (b) Zn−0.5Bi and (c) Zn−2Sn baths.

4.2.2. Sandelin’s Steel
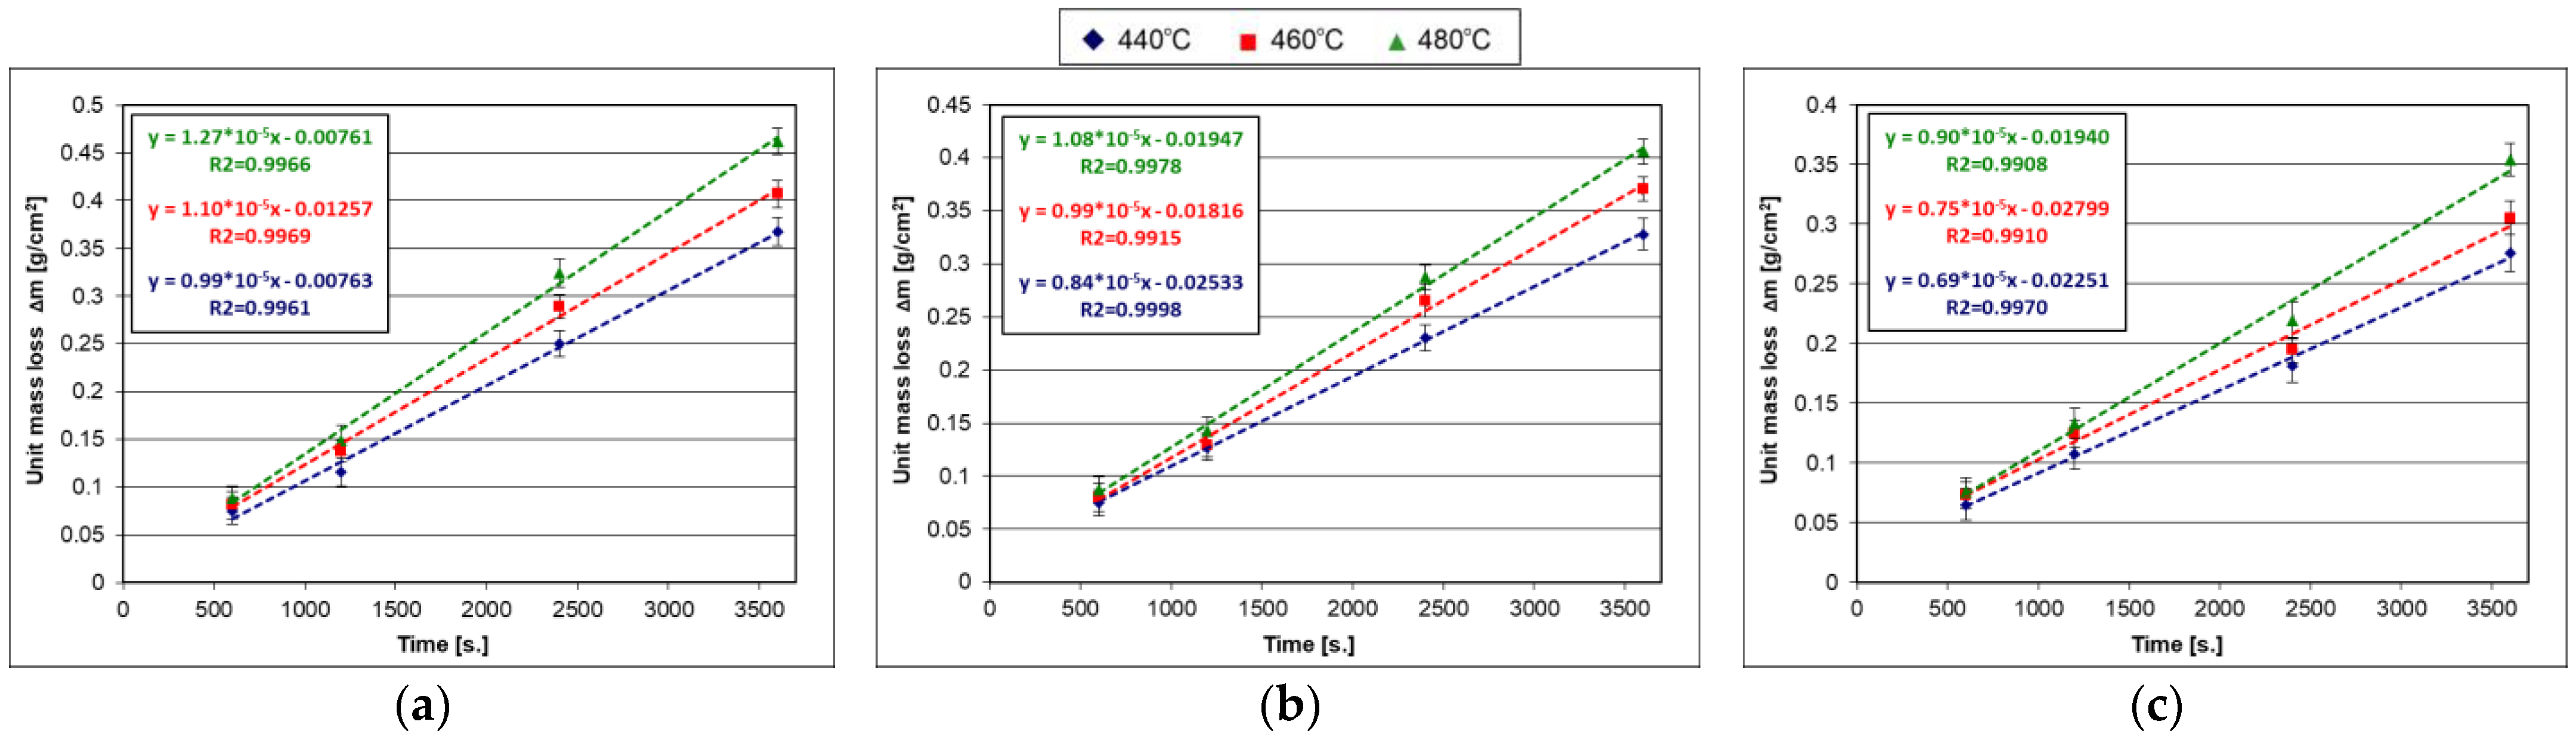
Figure 6 shows changes in the average unit mass losses of the Sandelin’s steel samples during dissolution in the Zn, Zn-0.5Bi and Zn-2Sn baths. The trend line equations of the experimental data for this steel showed a good fit to the linear model, as evidenced by the correlation coefficient being close to 1 (Table 6). The obtained values of the dissolution constant of the Sandelin’s steel showed similar tendencies to that of the low-silicon steel samples depending on the temperature and composition of the zinc bath. The obtained values of the dissolution constant of the Sandelin’s steel, however, had significantly higher values compared to the low-silicon steel. For example, at 480 °C, the dissolution rate constant of the Sandelin’s steel in the Zn bath was 0.02281 mol/m2·s, while in the Zn-0.5Bi and Zn-2Sn baths it was 0.01939 mol/m2·s and 0.01619 mol/m2·s, respectively.
Figure 6.
Dependence of average unit mass losses on the dissolution time of Sandelin’s steel in (a) Zn, (b) Zn−0.5Bi and (c) Zn−2Sn baths.
Figure 6.
Dependence of average unit mass losses on the dissolution time of Sandelin’s steel in (a) Zn, (b) Zn−0.5Bi and (c) Zn−2Sn baths.

4.2.3. Sebisty’s Steel
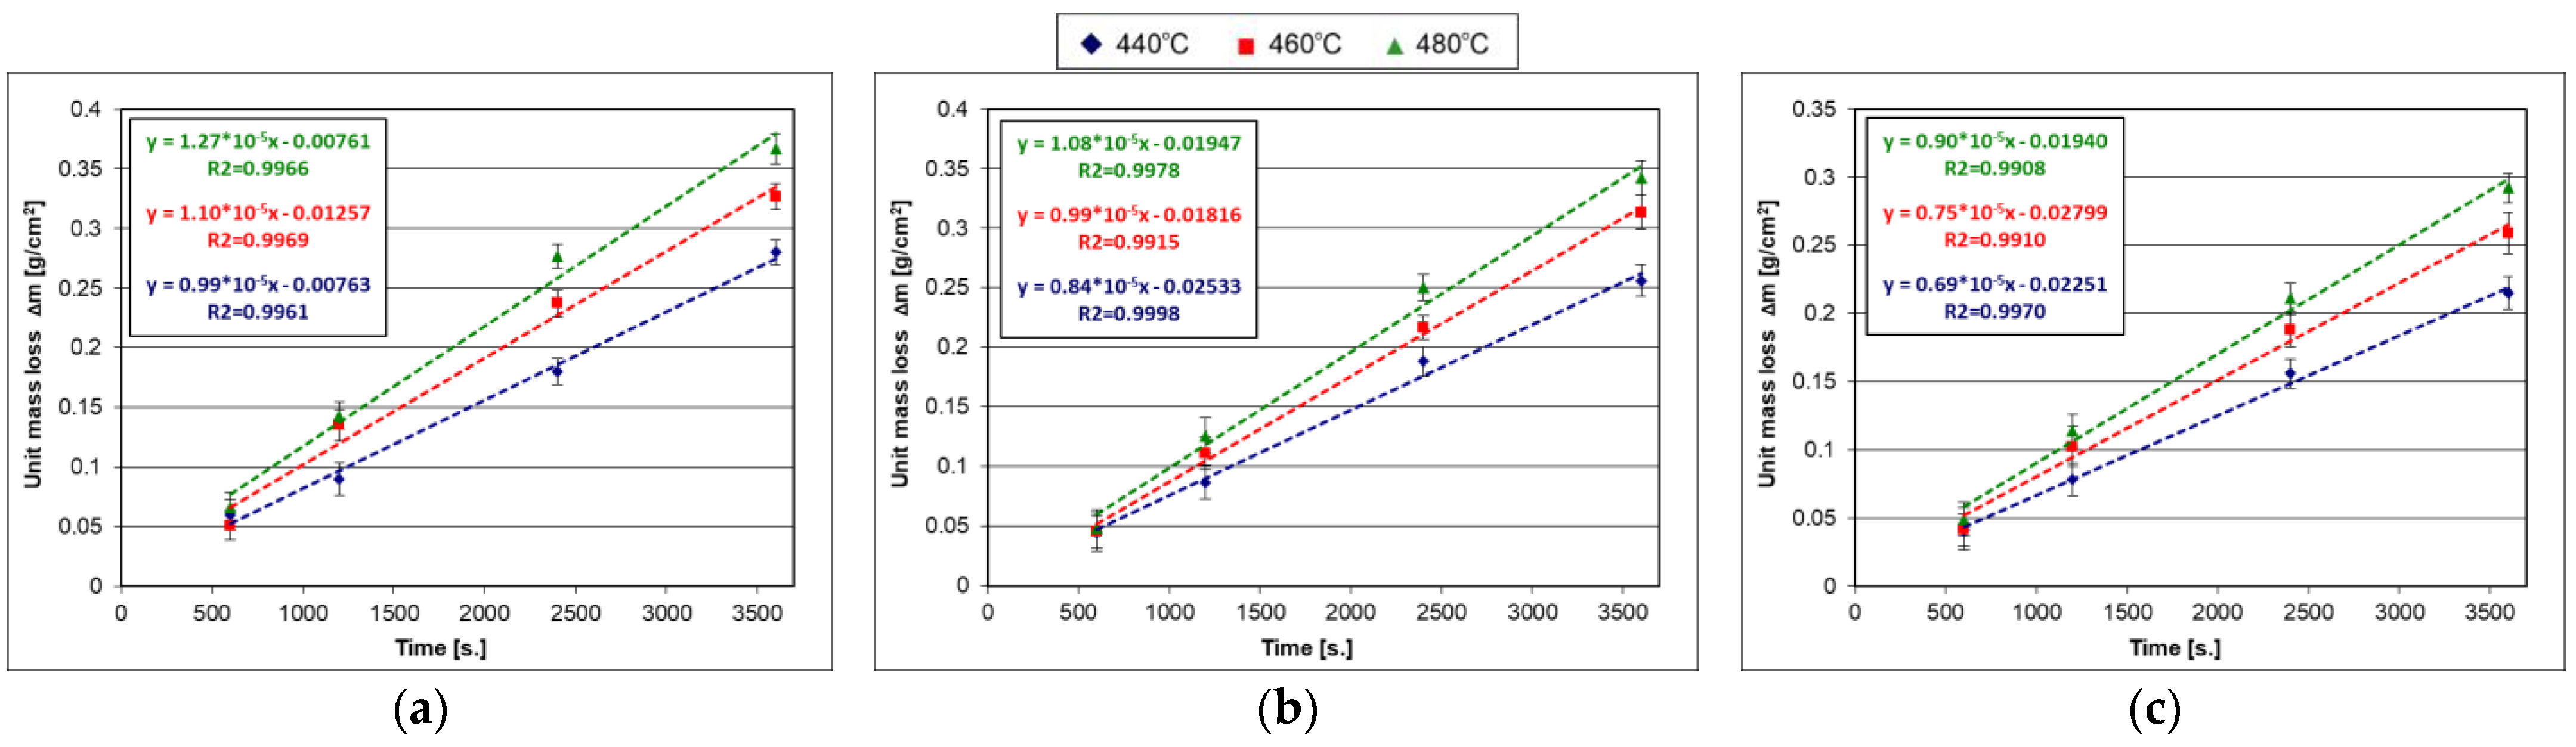
Figure 7 shows changes in the average unit mass losses of the Sebisty’s steel samples during dissolution in the Zn, Zn-0.5Bi and Zn-2Sn baths. The experimental data trendline equations for this steel showed a good fit to the linear model (Table 7). The obtained values of the dissolution constant of the Sebisty’s steel showed similar tendencies to those of the low-silicon steel and the Sandelin’s steel depending on the temperature and composition of the zinc bath. The obtained values of the dissolution constant of the Sebisty’s steel, however, showed lower values compared to the Sandelin’s steel, but they were higher than the low-silicon steel. For example, at 480 °C, the dissolution rate constant of the Sebisty’s steel in the Zn bath was 0.01800 mol/m2·s, while in Zn-0.5Bi and Zn-2Sn baths it was 0.01745 mol/m2·s and 0.01434 mol/m2·s, respectively.
Figure 7.
The dependence of the average unit mass losses on the dissolution time of Sebisty’s steel in (a) Zn, (b) Zn−0.5Bi and (c) Zn−2Sn baths.
Figure 7.
The dependence of the average unit mass losses on the dissolution time of Sebisty’s steel in (a) Zn, (b) Zn−0.5Bi and (c) Zn−2Sn baths.

4.2.4. High-Silicon Steel
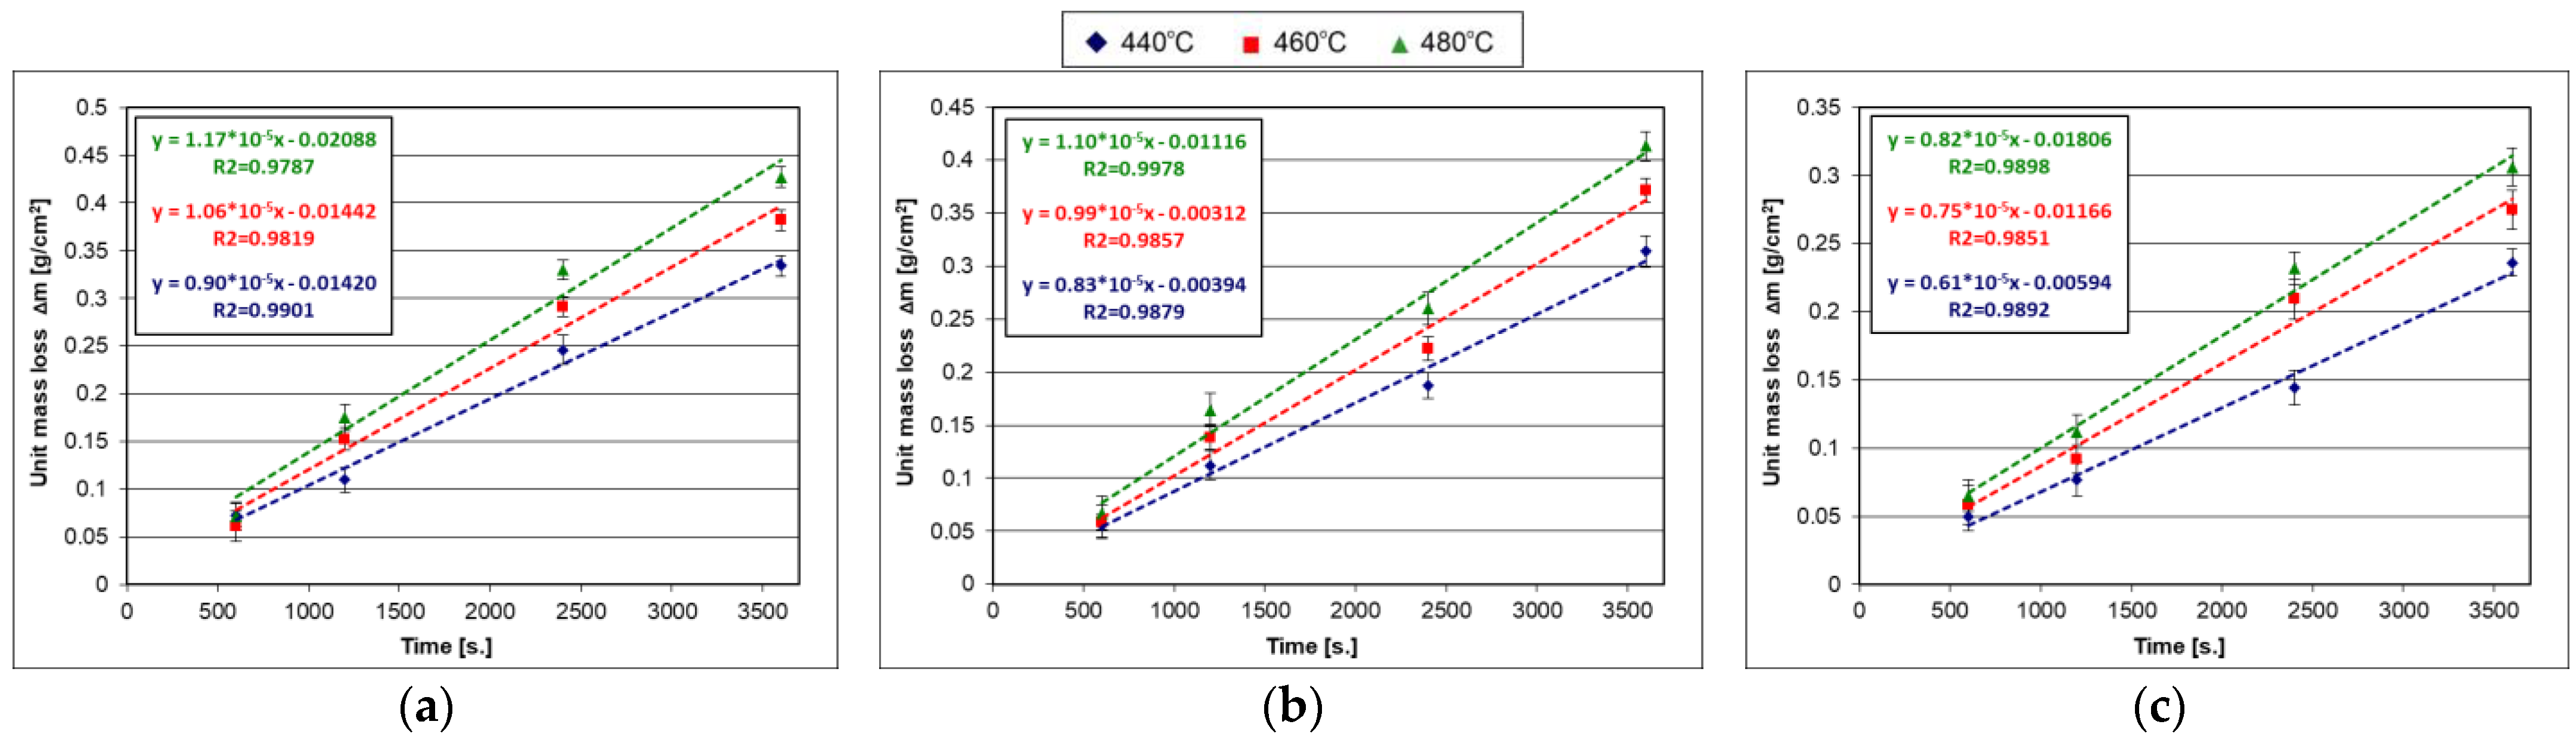
Figure 8 shows changes in the average unit mass losses of the high-silicon steel samples during dissolution in the Zn, Zn-0.5Bi and Zn-2Sn baths. The trend line equations of the experimental data for this steel showed a good fit to the linear model (Table 8). The obtained values of the dissolution constant of the high-silicon steel also showed trends that were similar to those of the low-silicon steel, Sandelin’s steel and Sebisty’s steel depending on the temperature and composition of the zinc bath. The obtained dissolution constant values for the high-silicon steel were relatively high and only slightly lower than the dissolution constant values for the Sandelin’s steel. For example, at 480 °C, the dissolution rate constant of the high-silicon steel in the Zn bath was 0.02111 mol/m2·s, while in the Zn-0.5Bi and Zn-2Sn baths it was 0.01973 mol/m2·s and 0.01476 mol/m2·s, respectively.
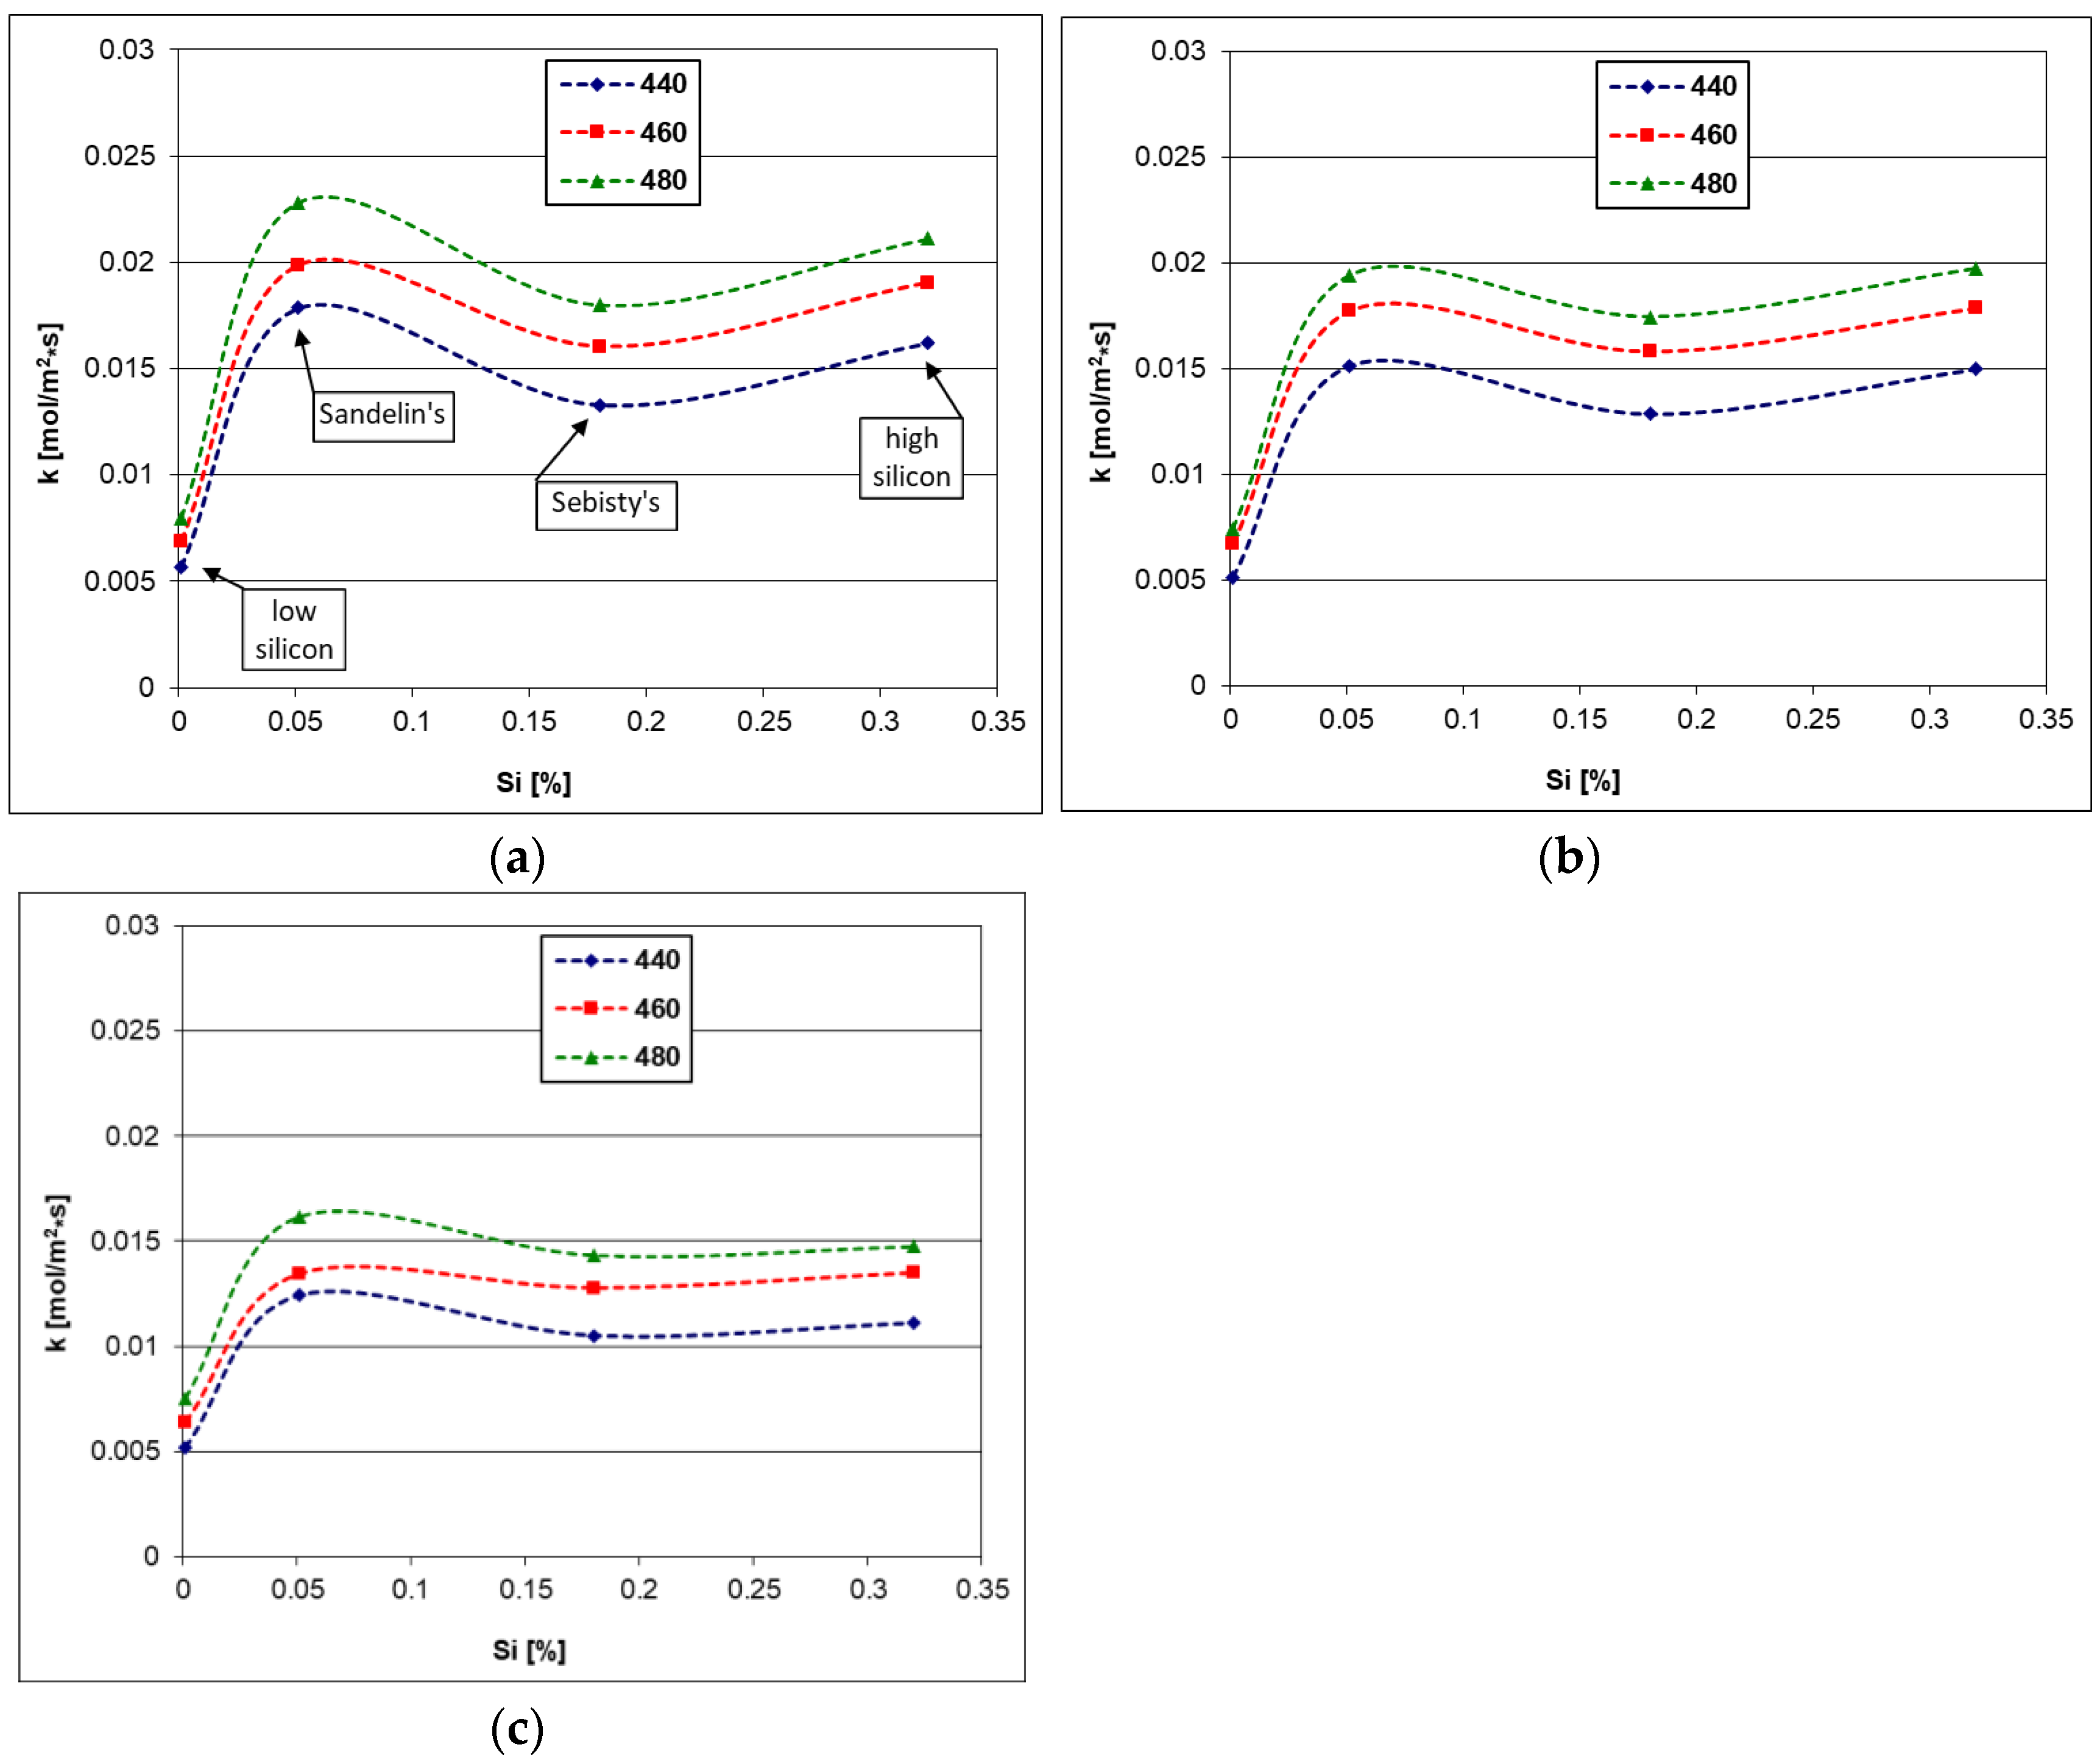
For comparison, Figure 9 presents the values of the dissolution rate constants of the tested steels depending on the Si content. The dissolution rate for the low-Si-content steels was the slowest. The dissolution rate constant of the low-silicon steel in the Zn bath (Figure 9a) was in the range of 0.00566–0.00799 mol/m2·s. In the Si content range corresponding to the increased reactivity associated with the occurrence of the Sandelin phenomenon, there was a rapid increase in the dissolution rate constant, “k”, up to values in the range of 0.01785–0.02281 mol/m2·s. Another increase in the reaction rate at the steel/liquid zinc interface was observed for the high-silicon steel, where the dissolution rate constant was in the range of 0.01621–0.02111 mol/m2∙s.
A reduction in the dissolution constant was observed for the Sebisty’s steel, where it was in the range of 0.01330–0.01800 mol/m2s. However, these values were much higher than those of the low-silicon steel. In addition, it can be seen that the presence of Si in the steel significantly increased the effect of the temperature on the dissolution rate. The temperature growth from 440 °C to 480 °C increased the value of the dissolution constant “k” for the low-silicon steel by 0.0023 mol/m2∙s. For all the steels with a higher content of Si, the increase in the value of the dissolution constant in this temperature range was more than two times higher and was within the range of 0.0047–0.0049 mol/m2·s. Therefore, the values of the constant “k” in the Zn bath reflect the increased reactivity in the Fe-Zn system due to the presence of Si [10,11]. Thus, despite conducting the research in model conditions with the maximum impact on the dissolution process by forced convection, similar tendencies were observed that are generally observed when constituting hot dip galvanizing coatings on steels with different Si contents [9,12].
Figure 9.
Influence of Si content on steel dissolution rate in (a) Zn, (b) Zn-0.5Bi and (c) Zn-2Sn baths.
Figure 9.
Influence of Si content on steel dissolution rate in (a) Zn, (b) Zn-0.5Bi and (c) Zn-2Sn baths.

The introduction of the addition of Bi (Figure 9b) or Sn (Figure 9c) into the bath resulted in a significant reduction in the value of the dissolution constant, k, of the Si-containing steels. It was especially visible in the Zn-2Sn bath, where the dissolution constant values of the high-silicon steel (0.01109–0.01476 mol/m2∙s) were close to those of Sebisty’s steel (0.01049–0.01434 mol/m2·s). This behavior of the high-silicon steel was also a reflection of the process of constituting hot dip galvanizing coatings in a bath containing Sn. From previous research of the practice of hot dip galvanizing, it is known to shape coatings in baths containing the addition of Sn and Bi [23], in which the presence of Sn and Bi makes it possible to limit the excessive thickness of the diffusion layer of coatings formed on high-silicon steel. The decrease in the reactivity of the high-silicon steel was explained by the precipitation of Sn and Bi on the surface of the ζ-phase layer in the coating. Sn precipitates are supposed to hinder further diffusion of Fe into zinc baths and Zn towards the diffusion layer of the coating [24]. The intermetallic phases δ1 and ζ formed in this area do not dissolve Sn [25] and Bi [26], which leads to the release of Sn and Bi. In addition, the crystallization of the outer layer itself and the decrease in the solubility of Sn and Bi in Zn in the solid state [27,28] can lead to the release of these metals from the solution. The described mechanism of the inhibition of the diffusion processes by precipitating Sn and Bi therefore seems probable. Stationary diffusion dissolution studies conducted by Tatarek et.al. [29] showed that the addition of Sn to a bath caused a decrease in the thickness of the layer that was supersaturated with dissolved iron, which resulted in a decrease in the thickness of the Fe-Zn intermetallic layer. A similar effect was also observed in a bath containing a Bi additive [30]. In the baths containing Sn and Bi, a decrease in the value of the diffusion coefficient D = f(c Fe) was also observed in the ranges of the intermetallic phases of the Fe-Zn system. The greatest reduction in the diffusion coefficient was observed in the ζ phase [29,30]. The layer of this phase was in direct contact with the zinc bath. Its thickness was therefore determined, apart from the diffusion growth process, by the dissolution process at the ζ intermetallic/liquid zinc boundary. In the tests carried out in this study, the forced movement of the bath prevented the formation of layers of Fe-Zn intermetallic phases, as a result of which the Sn and Bi could be released. Tin and bismuth could not separate at the steel/liquid interface either, as the bath was constantly stirred. Therefore, blocking the diffusion processes by precipitating these metals was not the only possible mechanism to reduce the reactivity of the steel in the liquid zinc. It should be assumed that after reaching the finite thickness of the ζ-phase layer, the course of the reaction will also be inhibited by limiting the dissolution of Fe in the Zn liquid. The Sn and Bi additions can therefore act as inhibitors to reduce the activity of liquid zinc in dissolving Fe.
4.3. Activation Energy of Dissolution
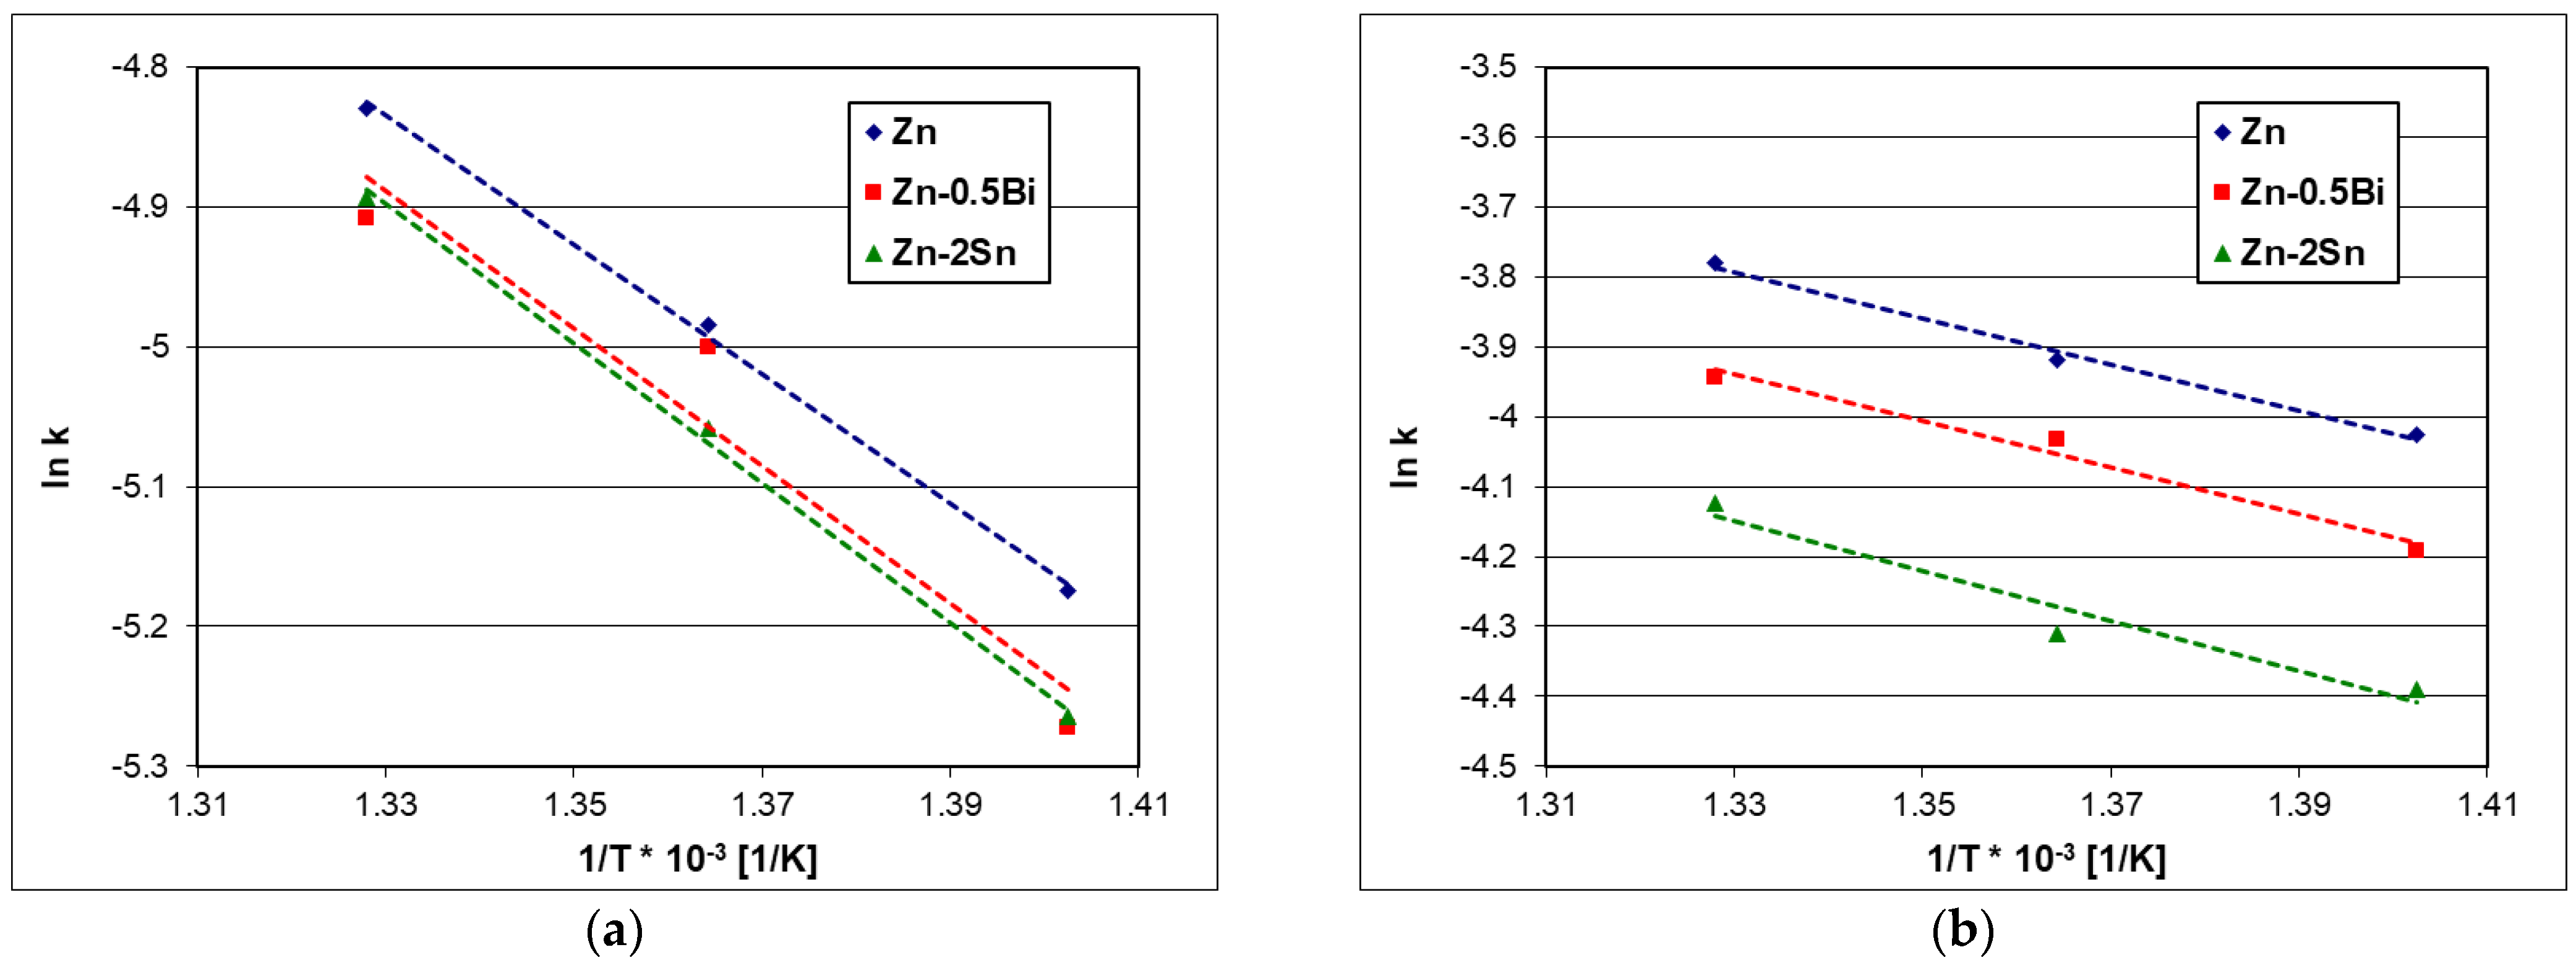
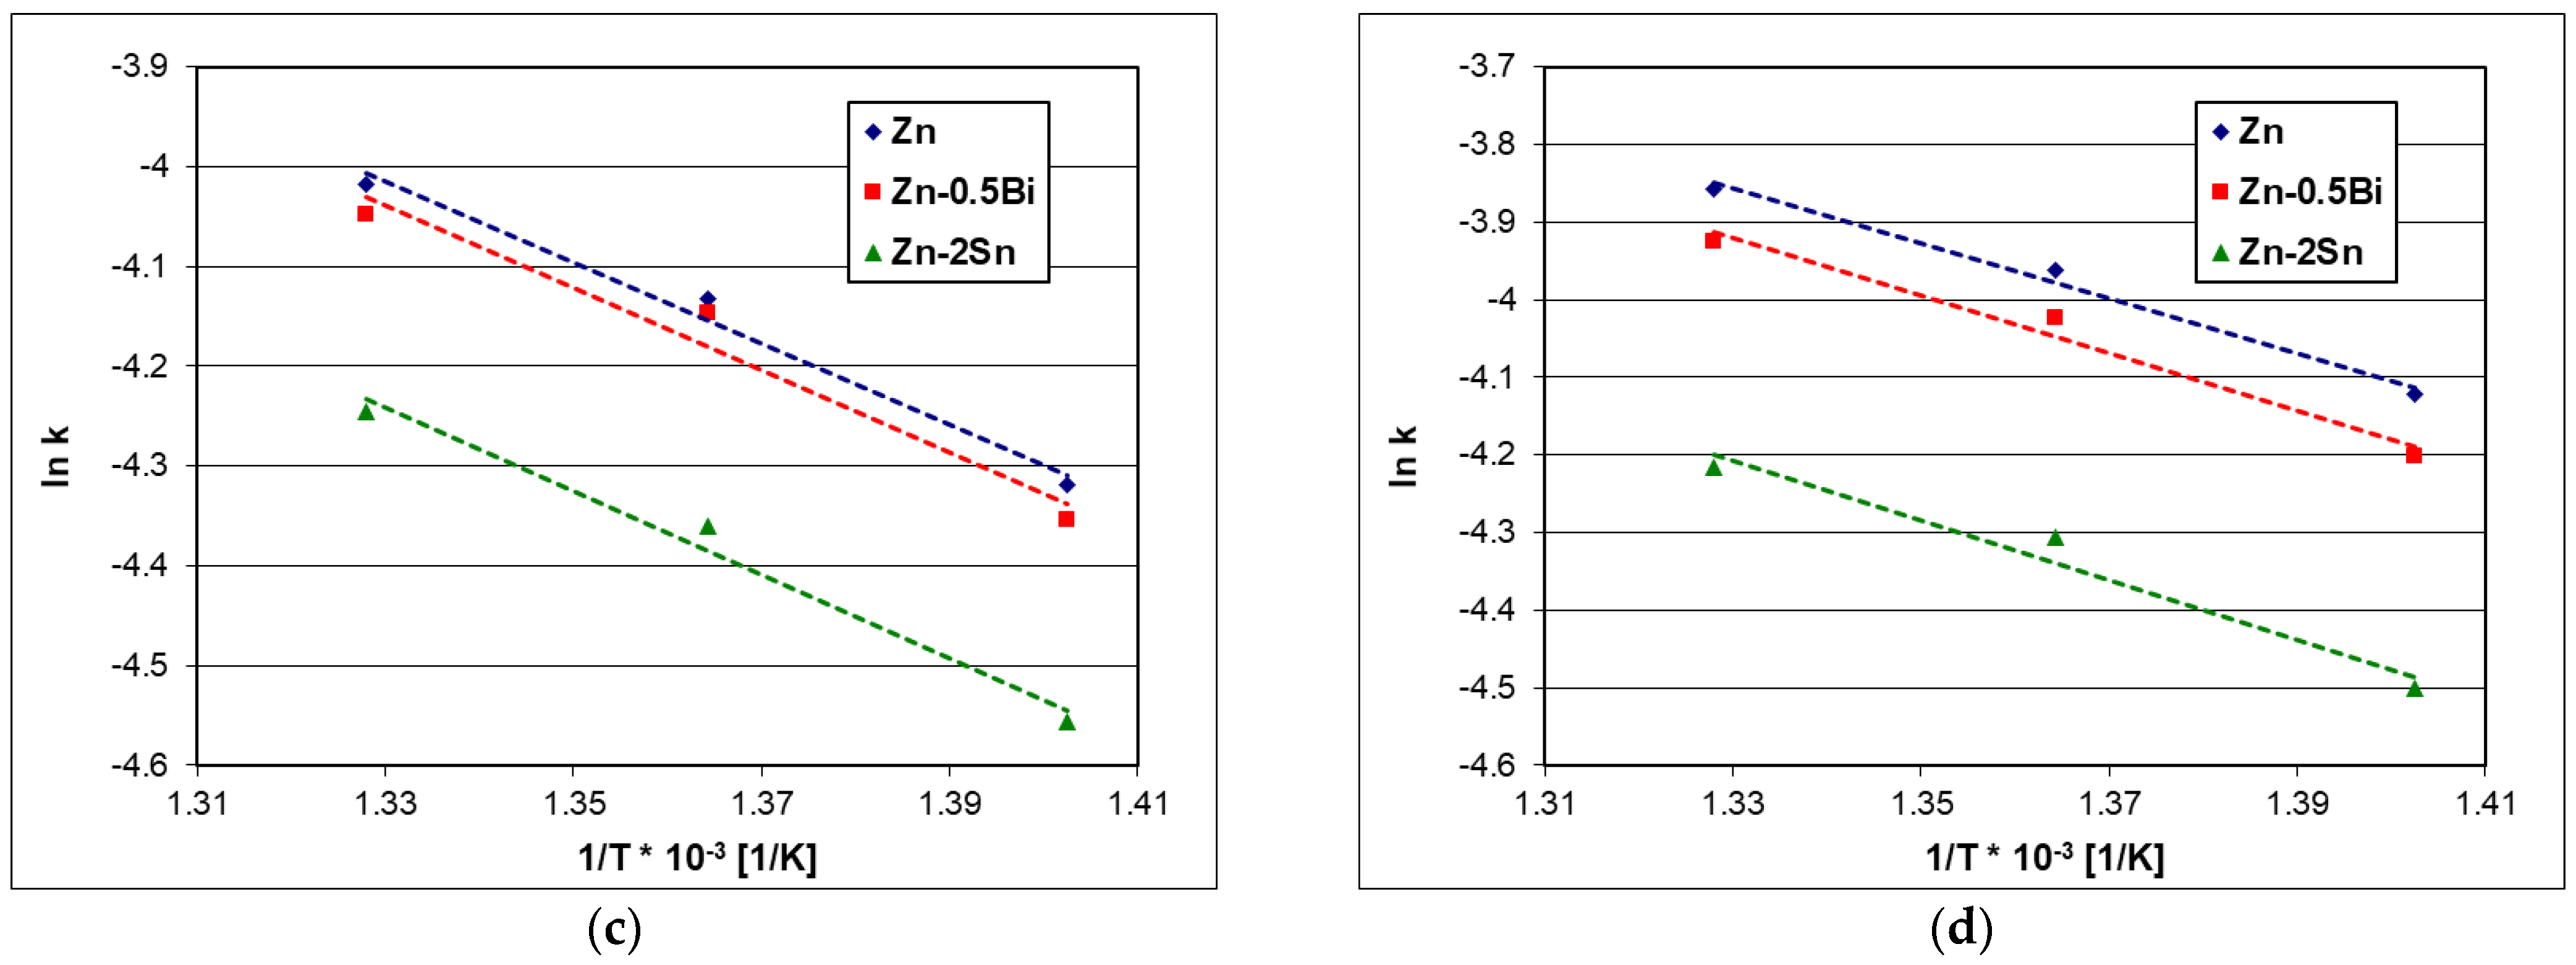
The assumptions made and confirmed by the test results (Figure 1), i.e., that the dissolution process took place in the kinetic stage, allows it to be described by dependence (3). The activation energy of the kinetic dissolution process was calculated on the basis of the determined values of the dissolution constant “k” for the tested temperature range of 440–480 °C. The transformation of Equation (3) allows us to write the dependence of the value of the dissolution constant as a function of ln k = f(1/T) according to the equation:
The dependence of ln k on 1/T is shown in Figure 10. The high matching factor, R2, to the linear trend line model allows to describe the changes in the experimental data as a linear function:
where , , , .
The equations of the trend line presented in Table 8 provided the basis for determining the value of the activation energy, E, in accordance with the equation:
Figure 10.
The dependence of the natural logarithm of the dissolution constant “k” on the reciprocal of the temperature 1/T for (a) low−silicon steel, (b) Sandelin’s steel, (c) Sebisty’s steel and (d) high−silicon steel.
Figure 10.
The dependence of the natural logarithm of the dissolution constant “k” on the reciprocal of the temperature 1/T for (a) low−silicon steel, (b) Sandelin’s steel, (c) Sebisty’s steel and (d) high−silicon steel.


The values of the activation energy of the kinetic dissolution of the steel are presented in Table 9. In the temperature range of 440–480 °C, the highest activation energy values were shown by the dissolution process of the low-silicon steel. The activation energy of the dissolution of this steel in the Zn bath was 38.54 kJ/mol. However, after adding Bi and Sn to the bath, its value increased to 40.82 kJ/mol and 41.52 kJ/mol, respectively. A higher activation energy value indicates a decrease in dissolution intensity. Thus, the addition of Bi and Sn to the Zn bath reduced the rate of the dissolution of this steel in the liquid zinc. The Si content in the steel reduced the value of the activation energy. The lowest value of the dissolution activation energy was shown by the Sandelin’s steel, where it was 27.30 kJ/mol, which was followed by the high-silicon steel, where it was 29.50 kJ/mol, and the Sebisty’s steel, where it was 33.82 kJ/mol. This means that all the Si-containing steels dissolved more intensively than the low-silicon steel. The Sandelin’ steel showed the highest dissolution intensity. An increase in the Si content in the steel caused a decrease in the intensity of dissolution of the Sebisty steel and a further increase in the intensity of dissolution for the high-silicon steel.
In the Si-containing steels, an increase in the activation energy of the dissolution was also observed after adding Bi and Sn to the bath. The activation energy of dissolution in the bath containing 0.5 wt.% Bi increased by about 1%–4%, while in the bath containing 2 wt.%Sn, it increased by about 3%–8%. Thus, the addition of Bi and Sn caused a decrease in the dissolution intensity of the steels containing Si.
The conducted studies of steel dissolution under kinetic conditions showed that the dissolution process may be an important partial process that determines the mechanism of coating growth and shaping the thickness of the final Fe-Zn intermetallic layer. The nature of changes in the Fe dissolution intensity in kinetic conditions depending on the Si content in steel correlates with changes in the Fe dissolution intensity in diffusion conditions. Tatarek [31] studied the thickness of the Fe-saturated zone on modelling alloys with Si contents up to 0.42 wt.%. After minimizing the convection of the bath, he showed that the thickness of the Fe-supersaturated zone was the smallest for low-silicon steel and Sebisty’s steel. However, it reached its maximum values in the range of Sandelin’s steel and high-silicon steel. The formation of the coating thickness depending on the Si content in the steel shows a similar nature of changes. Coatings with the greatest thickness of the diffusion layer are obtained with Sandelin’s steel and high-silicon steel [9]. Studies have also shown that the addition of Bi [32] and Sn [33] can also reduce the thickness of the diffusion layer of coatings on reactive steels. However, the mechanism of this interaction has not been elucidated. Fe dissolution processes, both diffusive and kinetic, however, have a significant impact on the constitution of zinc coatings. The interaction of Bi and Sn as an inhibitor of the dissolution of Fe in liquid zinc may explain the limitation of excessive growth of Fe-Zn intermetallic on reactive steels. For this reason, the influence of these alloying additions on the corrosion of the steel hot dip galvanizing kettle in contact with the zinc bath is also beneficial, which should contribute to extending their service life.
5. Conclusions
The rotating disc experiments made it possible to analyze the phenomena occurring in extreme model conditions of the kinetic dissolution of steel with different Si contents in zinc baths containing Bi and Sn additions. The following main conclusions can be drawn from the results of these studies:
- The process of steel dissolution under the conditions of kinetic tests using the rotating-disc method was characterized by a linear law, and in the tested range of 200–600 rpm, it did not depend on the rotation speed of disc. This allowed for the determining of the kinetic dissolution constant, which characterizes the dissolution rate of steel in liquid zinc.
- In the tested temperature range of 440–480 °C, the value of the kinetic dissolution constant increased with increasing the temperature, reaching the highest values in the Zn bath. The additions of Bi and Sn to the zinc bath lowered the value of the kinetic dissolution constant and may have acted as an inhibitor of Fe dissolution in the liquid zinc.
- In the temperature range of 440–480 °C, the additions of Bi and Sn increased the value of the activation energy of the dissolution, which reduced the intensity of Fe transfer to the zinc bath.
- The values of the dissolution constant “k” and the activation energy of the kinetic dissolution reflected the increased reactivity in the Fe-Zn system due to the presence of Si. The Sandelin’s steel had the highest solubility in the Zn, Zn-0.5Bi and Zn-2Sn baths.
Funding
This research received no external funding.
Institutional Review Board Statement
Not applicable.
Informed Consent Statement
Not applicable.
Data Availability Statement
Not applicable.
Conflicts of Interest
The author declares no conflict of interest.
References
- Kania, H.; Saternus, M. Evaluation and Current State of Primary and Secondary Zinc Production—A Review. Appl. Sci. 2023, 13, 2003. [Google Scholar] [CrossRef]
- Liberski, P. Anticorrosive Hot Dip Coatings; Silesian University of Technology: Gliwice, Poland, 2013. (In Polish) [Google Scholar]
- Jędrzejczyk, D. Effect of High Temperature Oxidation on Structure and Corrosion Resistance of the Zinc Coating Deposited on Cast Iron. Arch. Metall. Mater. 2012, 57, 145–154. [Google Scholar] [CrossRef]
- Šmak, M.; Kubíček, J.; Kala, J.; Podaný, K.; Vaněrek, J. The Influence of Hot-Dip Galvanizing on the Mechanical Properties of High-Strength Steels. Materials 2021, 14, 5219. [Google Scholar] [CrossRef] [PubMed]
- Suliga, M.; Wartacz, R.; Hawryluk, M. Evolution of zinc coatings during drawing process of steel wires. Arch. Civ. Mech. 2023, 23, 120. [Google Scholar] [CrossRef]
- Courouau, J.-L.; Feron, D. Corrosion of structural materials by liquid metals used fusion, fission and spallation. In Proceedings of the 1st IAEA Workshop on Challenges for Coolants in Fast Spectrum System, Vienne, Austria, 5–7 July 2017. [Google Scholar]
- Blakey, S.G.; Beck, S.B.M. The effect of combined radiation and convection on hot dip galvanizing kettle wear. Appl. Therm. Eng. 2004, 24, 1301–1319. [Google Scholar] [CrossRef]
- Borishansky, V.M. Liquid Metal Coolants; Atomizdat: Moscow, Russia, 1967. [Google Scholar]
- Schulz, W.D.; Thiele, M. Feuerverzinken von Stückgut; Eugen Leuze Verlag: Bad Saulgau, Germany, 2008. [Google Scholar]
- Sandelin, R.W. Galvanizing Characteristics of Dierent Types of Steels. Wire Wire Prod. 1940, 15, 655–676. [Google Scholar]
- Sebisty, J.J.; Palmer, R.H. Hot dip galvanizing with less common bath additions. In 7th International Conference on Hot Dip Galvanizing, Paris, 1964; ILZRO: Durham, NC, USA, 1964; pp. 235–265. [Google Scholar]
- Kuklik, V.; Kudláček, J. Hot-Dip Galvanizing of Steel Structures; Elsevier Ltd.: Boston, MA, USA, 2016. [Google Scholar]
- Kania, H.; Mendala, J.; Kozuba, J.; Saternus, M. Development of bath chemical composition for batch hot-dip galvanizing-A Review. Materials 2020, 13, 4168. [Google Scholar] [CrossRef] [PubMed]
- Reumont, G.; Perrot, P. Fundamental study of lead additions in industrial zinc. In Proceedings of the 18th International Galvanizing Conference, Birmingham, UK, 8–11 June 1997. [Google Scholar]
- Zhang, J.; Hosemann, P.; Maloy, S. Models of liquid metal corrosion. J. Nucl. Mater. 2010, 404, 82–96. [Google Scholar] [CrossRef]
- Eremenko, V.N.; Natanzon, Y.V. Kinetics of External Dissolution of Metals in Metallic Melts—Review. Sov. Powder Metall. Met. Ceram. 1970, 8, 39–54. [Google Scholar] [CrossRef]
- Dybkov, V.I. Reaction Diffusion and Solid State Chemical Kinetics; IPMS Publications: Kyiv, Ukraine, 2002. [Google Scholar]
- Liberski, P. Physicochemical Basic of Rational Shaping of Aluminium Dip Coatings on Iron; Silesian University of Technology: Gliwice, Poland, 2002. [Google Scholar]
- Eremenko, V.N.; Natanzon, Y.V.; Dybkov, V.I. The effect of dissolution on the growth of the Fe2Al5 interlayer in the solid iron-liquid aluminium system. J. Mater. Sci. 1981, 16, 1748–1756. [Google Scholar] [CrossRef]
- Eremenko, V.N.; Natanzon, Y.V.; Ryabov, V.R. Investigation of the kinetics of Dissolution of solid metals in metal melts by the rotating disc method iron-aluminium system. Phys.-Chem. Mech. Mater. 1968, 4, 286–290. [Google Scholar]
- Levich, V.G. Physicochemical Hydrodynamics; Prentice-Hall, Inc.: Englewood Cliffs, NJ, USA, 1962. [Google Scholar]
- Chuchmarev, S.K.; Pokhmurskii, V.I.; Raevskii, Y.A.; Dmitriev, Y.G.; Lizun, O.Y. Kinetics of iron dissolution in liquid zinc. Sov. Mater. Sci. 1985, 21, 17–19. [Google Scholar]
- Beguin, P.; Bosschaerts, M.; Dhaussy, D.; Pankert, R.; Gilles, M. Galveco a Solution for Galvanizing Reactive Steel. In Proceedings of the 19th International Galvanizing Conference, Berlin, German, 1–8 March 2000. [Google Scholar]
- Pankert, R.; Dhaussy, D.; Beguin, P.; Gilles, M. Three years industrial experience with the Galveco alloy. In Proceedings of the 20th International Galvanizing Conference Intergalva 2003, Amsterdam, The Netherlands, 1–4 June 2003. [Google Scholar]
- Kania, H.; Saternus, M.; Kudláček, J. Impact of Bi and Sn on microstructure and corrosion resistance of zinc coatings obtained in Zn-AlNi bath. Materials 2020, 13, 3788. [Google Scholar] [CrossRef]
- Kania, H.; Saternus, M.; Kudláček, J.; Svoboda, J. Microstructure characterization and corrosion resistance of zinc coating obtained in a Zn-AlNiBi galvanizing bath. Coatings 2020, 10, 758. [Google Scholar] [CrossRef]
- Fries, S.G.; Lukas, H.L. System Sn–Zn. In Thermochemical Database for Light Metal Alloys; Ansara, I., Dinsdale, A.T., Rand, M.H., Eds.; Ocial Publications of the European Communitie: Luxemburg, 1998; Volume 2, p. 288. [Google Scholar]
- Malakhov, D.V. Thermodynamic assessment of the Bi-Zn system. Calphad 2000, 24, 1–14. [Google Scholar] [CrossRef]
- Tatarek, A.; Kania, H.; Liberski, P.; Podolski, P. Diffusion dissolution of reactive steels in a zinc bath with the addition of tin. Inżynieria Mater. 2010, 5, 1362–1365. [Google Scholar]
- Tatarek, A.; Saternus, M. Investigation of the Diffusion Dissolution of Reactive Steels in a Zinc Bath with the Addition of Bismuth. Ochr. Przed Koroz. 2018, 7, 186–190. [Google Scholar]
- Tatarek, A. Analysis of Physicochemical Phenomena at the Solid-Liquid Interface during the Hot-Dip Galvanizing Process. Ph.D. Thesis, Silesian University of Technology, Gliwice, Poland, 2007. [Google Scholar]
- Pistofidis, N.; Vourlias, G.; Konidaris, S.; Stergioudis, G. The effect of bismuth on the structure of zinc hot-dip galvanized coatings. Mater. Lett. 2007, 61, 994–997. [Google Scholar] [CrossRef]
- Avettand-Fènoël, M.-N.; Reumont, G.; Perrot, P. The effect of tin on the reactivity of silicon-containing steels. In Proceedings of the 21st International Galvanizing Conference Intergalva 2006, Naples, Italy, 12–14 June 2006. [Google Scholar]
Figure 2.
Weight changes in steel samples during pickling in 1 mol/dm3 HCl + 4 g/dm3 C6H12N4 solution.
Figure 2.
Weight changes in steel samples during pickling in 1 mol/dm3 HCl + 4 g/dm3 C6H12N4 solution.

Figure 8.
Dependence of average unit mass losses on dissolution time of high-silicon steel in (a) Zn, (b) Zn−0.5Bi and (c) Zn−2Sn baths.
Figure 8.
Dependence of average unit mass losses on dissolution time of high-silicon steel in (a) Zn, (b) Zn−0.5Bi and (c) Zn−2Sn baths.


Table 1.
Chemical compositions of studied baths.
| Bath | Content [wt.%] | ||||||
|---|---|---|---|---|---|---|---|
| Cd | Fe | Al | Cu | Bi | Sn | Zn and Others | |
| Zn | 0.003 | 0.0004 | 0.001 | 0.0001 | 0.001 | 0.001 | balance |
| Zn-0.5Bi | 0.002 | 0.0003 | 0.001 | 0.0001 | 0.54 | 0.001 | balance |
| Zn-2Sn | 0.003 | 0.0004 | 0.002 | 0.0004 | 0.001 | 1.97 | balance |
Table 2.
Chemical compositions of studied steels.
| Grade | Steel Type | Content [wt.%] | |||||
|---|---|---|---|---|---|---|---|
| C | Si | Mn | S | P | Fe and Others | ||
| 04 | Low silicon | 0.03 | 0.001 | 0.14 | 0.010 | 0.013 | balance |
| S250 GD | Sandelin’s | 0.06 | 0.052 | 0.71 | 0.0074 | 0.0057 | balance |
| B500SP | Sebisty’s | 0.19 | 0.18 | 0.65 | 0.021 | 0.072 | balance |
| S355JR | High silicon | 0.13 | 0.34 | 1.12 | 0.013 | 0.015 | balance |
Table 3.
Parameters of steel dissolution in 1 mol/dm3 HCl + 4 g/dm3 C6H12N4 solution.
| Steel | Trend Line Equation | tg α * | ~α * [°] | Mass Loss [g/cm2] | Relative Mass Loss [%] |
|---|---|---|---|---|---|
| After 10 min Pickling Time | |||||
| Low silicon | y = −1.47 × 10⁻⁵x + 16.65 | −0.0000147 | ~179.9992 | 0.0000273 | 0.00016 |
| Sandelin’s | y = −1.27 × 10⁻⁵x + 16.72 | −0.0000127 | ~179.9993 | 0.0000225 | 0.00013 |
| Sebisty’s | y = −1.51 × 10⁻⁵x + 16.68 | −0.0000151 | ~179.9991 | 0.0000275 | 0.00016 |
| High silicon | y = −1.35 × 10⁻⁵x + 16.74 | −0.0000135 | ~179.9992 | 0.0000237 | 0.00014 |
* The angle of the trendline to the x-axis.
Table 4.
Parameters of steel dissolution in 1 mol/dm3 HCl + 4 g/dm3 C6H12N4 solution.
| Bath | Temp. [°C] | Trend Line Equation | tg α * | ~α * [°] | Average Mass Loss [g/cm2] | Standard Deviation [g/cm2] |
|---|---|---|---|---|---|---|
| Dissolution Time 10 min | ||||||
| 440 | y = 0.5 × 10⁻⁶ + 0.016 | 0.0000005 | ~0.00001 | 0.017 | 0.00021 | |
| Zn | 460 | y = −0.2 × 10⁻⁷ + 0.019 | −0.00000002 | ~1,799,999 | 0.019 | 0.00019 |
| 480 | y = −0.5 × 10⁻⁶ + 0.021 | −0.0000005 | ~1,799,999 | 0.021 | 0.00023 | |
| 440 | y = 0.8 × 10⁻⁶ + 0.015 | 0.0000008 | ~0.00001 | 0.015 | 0.00016 | |
| Zn-0.5Bi | 460 | y = 0.1 × 10⁻⁶ + 0.017 | 0.0000001 | ~0.00001 | 0.018 | 0.00013 |
| 480 | y = 0.3 × 10⁻⁶ + 0.020 | 0.0000003 | ~0.00001 | 0.020 | 0.00020 | |
| 440 | y = 0.6 × 10⁻⁶ + 0.013 | 0.0000006 | ~0.00001 | 0.014 | 0.00024 | |
| Zn-2Sn | 460 | y = −0.7 × 10⁻⁷ + 0.016 | −0.00000007 | ~1,799,999 | 0.016 | 0.00018 |
| 480 | y = 0.7 × 10⁻⁷ + 0.018 | 0.00000007 | ~0.00001 | 0.019 | 0.00023 | |
| Dissolution Time 60 min | ||||||
| 440 | y = −1.9 × 10⁻⁶ + 0.112 | −0.0000019 | ~1,799,999 | 0.112 | 0.00357 | |
| Zn | 460 | y = 3.4 × 10⁻⁶ + 0.132 | 0.0000034 | ~0.00001 | 0.134 | 0.00303 |
| 480 | y = −2.3 × 10⁻⁶ + 0.158 | −0.0000023 | ~1,799,999 | 0.155 | 0.00648 | |
| 440 | y = 1.6 × 10⁻⁶ + 0.101 | 0.0000016 | ~0.00001 | 0.102 | 0.00503 | |
| Zn-0.5Bi | 460 | y = −1.6 × 10⁻⁶ + 0.129 | −0.0000016 | ~1,799,999 | 0.130 | 0.00290 |
| 480 | y = 3.8 × 10⁻⁶ + 0.142 | 0.0000038 | ~0.00001 | 0.144 | 0.00355 | |
| 440 | y = 2.5 × 10⁻⁶ + 0.103 | 0.0000025 | ~0.00001 | 0.104 | 0.00320 | |
| Zn-2Sn | 460 | y = 2.4 × 10⁻⁶ + 0.122 | 0.00000024 | ~1,799,999 | 0.124 | 0.00593 |
| 480 | y = 1.7 × 10⁻⁶ + 0.141 | 0.00000017 | ~0.00001 | 0.142 | 0.00644 | |
* The angle of the trendline to the x-axis.
Table 5.
Dissolution rate constant of low-silicon steel in studied zinc baths.
| Bath | Temp. [°C] | tg α (1) | k [g/m2*s] | k [mol/m2*s] |
|---|---|---|---|---|
| 440 | 0.00003161 | 0.316 | 0.00566 | |
| Zn | 460 | 0.00003824 | 0.382 | 0.00685 |
| 480 | 0.00004464 | 0.446 | 0.00799 | |
| 440 | 0.00002865 | 0.287 | 0.00513 | |
| Zn-0.5Bi | 460 | 0.00003764 | 0.376 | 0.00674 |
| 480 | 0.00004124 | 0.412 | 0.00739 | |
| 440 | 0.00002887 | 0.289 | 0.00517 | |
| Zn-2Sn | 460 | 0.00003549 | 0.355 | 0.00636 |
| 480 | 0.00004188 | 0.419 | 0.00750 |
(1) The angle of the trendline to the x-axis.
Table 6.
Dissolution rate constant of Sandelin’s steel in studied zinc baths.
| Bath | Temp. [°C] | tg α (1) | k [g/m2*s] | k [mol/m2*s] |
|---|---|---|---|---|
| 440 | 0.00009970 | 0.997 | 0.01785 | |
| Zn | 460 | 0.00011085 | 1.109 | 0.01985 |
| 480 | 0.00012738 | 1.274 | 0.02281 | |
| 440 | 0.00008443 | 0.844 | 0.01512 | |
| Zn-0.5Bi | 460 | 0.00009900 | 0.990 | 0.01773 |
| 480 | 0.00010827 | 1.083 | 0.01939 | |
| 440 | 0.00006931 | 0.693 | 0.01241 | |
| Zn-2Sn | 460 | 0.00007506 | 0.751 | 0.01344 |
| 480 | 0.00009044 | 0.904 | 0.01619 |
(1) The angle of the trendline to the x-axis.
Table 7.
Dissolution rate constant for Sebisty’s steel in studied zinc baths.
| Bath | Temp. [°C] | tg α (1) | k [g/m2*s] | k [mol/m2*s] |
|---|---|---|---|---|
| 440 | 0.00007429 | 0.743 | 0.01330 | |
| Zn | 460 | 0.00008958 | 0.896 | 0.01604 |
| 480 | 0.00010054 | 1.005 | 0.01800 | |
| 440 | 0.00007175 | 0.718 | 0.01285 | |
| Zn-0.5Bi | 460 | 0.00008838 | 0.884 | 0.01583 |
| 480 | 0.00009746 | 0.975 | 0.01745 | |
| 440 | 0.00005859 | 0.586 | 0.01049 | |
| Zn-2Sn | 460 | 0.00007131 | 0.713 | 0.01277 |
| 480 | 0.00008006 | 0.801 | 0.01434 |
(1) The angle of the trendline to the x-axis.
Table 8.
Dissolution rate constant for high-silicon steel in studied zinc baths.
| Bath | Temp. [°C] | tg α (1) | k [g/m2*s] | k [mol/m2*s] |
|---|---|---|---|---|
| 440 | 0.00009054 | 0.905 | 0.01621 | |
| Zn | 460 | 0.00010632 | 1.063 | 0.01904 |
| 480 | 0.00011788 | 1.179 | 0.02111 | |
| 440 | 0.00008362 | 0.836 | 0.01497 | |
| Zn-0.5Bi | 460 | 0.00009981 | 0.998 | 0.01787 |
| 480 | 0.00011017 | 1.102 | 0.01973 | |
| 440 | 0.00006195 | 0.619 | 0.01109 | |
| Zn-2Sn | 460 | 0.00007531 | 0.753 | 0.01349 |
| 480 | 0.00008240 | 0.824 | 0.01476 |
(1) The angle of the trendline to the x-axis.
Table 9.
Activation energy of steel dissolution in tested zinc baths.
| Steel | Bath | Trend Line Equation | R2 | E [kJ/mol] |
|---|---|---|---|---|
| Zn | y = −4635.8x + 1.33 | 0.9981 | 38.54 | |
| Low silicon | Zn-0.5Bi | y = −4909.8x + 1.64 | 0.9318 | 40.82 |
| Zn-2Sn | y = −4994.3x + 1.74 | 0.9977 | 41.52 | |
| Zn | y = −3283.5x + 0.57 | 0.9913 | 27.30 | |
| Sandelin’s | Zn-0.5Bi | y = −3345.7x + 0.51 | 0.9792 | 27.81 |
| Zn-2Sn | y = −3556.3x + 0.58 | 0.9420 | 29.56 | |
| Zn | y = −4067.9x + 1.39 | 0.9856 | 33.82 | |
| Sebisty’s | Zn-0.5Bi | y = −4122.5x + 1.44 | 0.9644 | 34.27 |
| Zn-2Sn | y = −4199.4x + 1.34 | 0.9825 | 34.91 | |
| Zn | y = −3548.6x + 0.86 | 0.9881 | 29.50 | |
| High silicon | Zn-0.5Bi | y = −3710.3x + 1.01 | 0.9786 | 30.84 |
| Zn-2Sn | y = −3841.0x + 0.90 | 0.9628 | 31.93 |
Disclaimer/Publisher’s Note: The statements, opinions and data contained in all publications are solely those of the individual author(s) and contributor(s) and not of MDPI and/or the editor(s). MDPI and/or the editor(s) disclaim responsibility for any injury to people or property resulting from any ideas, methods, instructions or products referred to in the content. |
© 2023 by the author. Licensee MDPI, Basel, Switzerland. This article is an open access article distributed under the terms and conditions of the Creative Commons Attribution (CC BY) license (https://creativecommons.org/licenses/by/4.0/).
Share and Cite
MDPI and ACS Style
Kania, H. Corrosion Rate of Steel in Liquid Zn, Zn-Bi and Zn-Sn Baths. Coatings 2023, 13, 993. https://doi.org/10.3390/coatings13060993
AMA Style
Kania H. Corrosion Rate of Steel in Liquid Zn, Zn-Bi and Zn-Sn Baths. Coatings. 2023; 13(6):993. https://doi.org/10.3390/coatings13060993
Chicago/Turabian StyleKania, Henryk. 2023. "Corrosion Rate of Steel in Liquid Zn, Zn-Bi and Zn-Sn Baths" Coatings 13, no. 6: 993. https://doi.org/10.3390/coatings13060993
Note that from the first issue of 2016, this journal uses article numbers instead of page numbers. See further details here.