
Very High Cycle Fatigue Properties of 18CrNiMo7-6 Carburized Steel with Gradient Hardness Distribution

Abstract
:1. Introduction
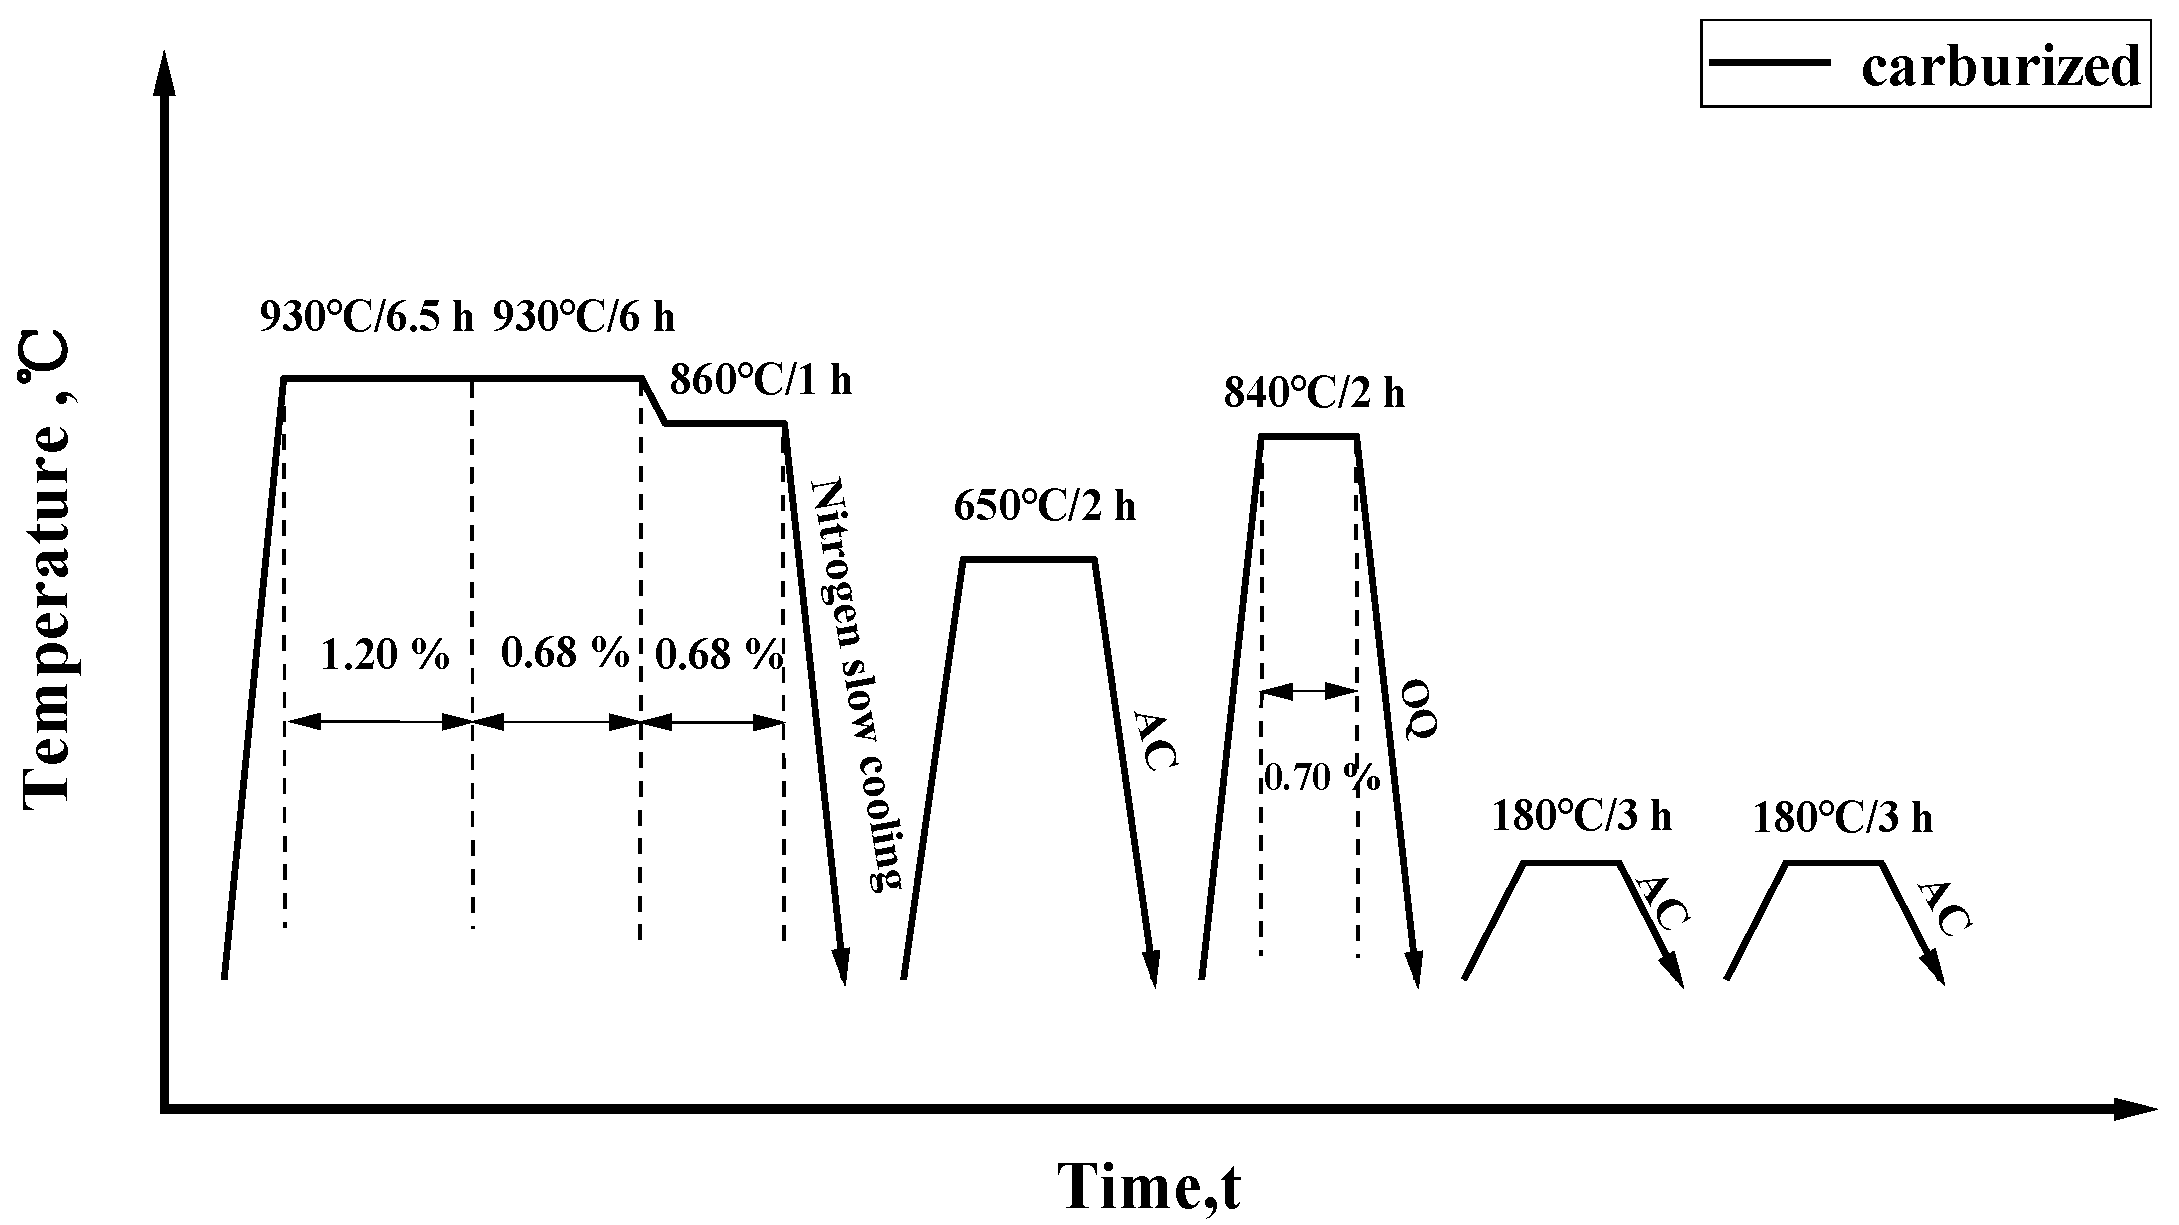
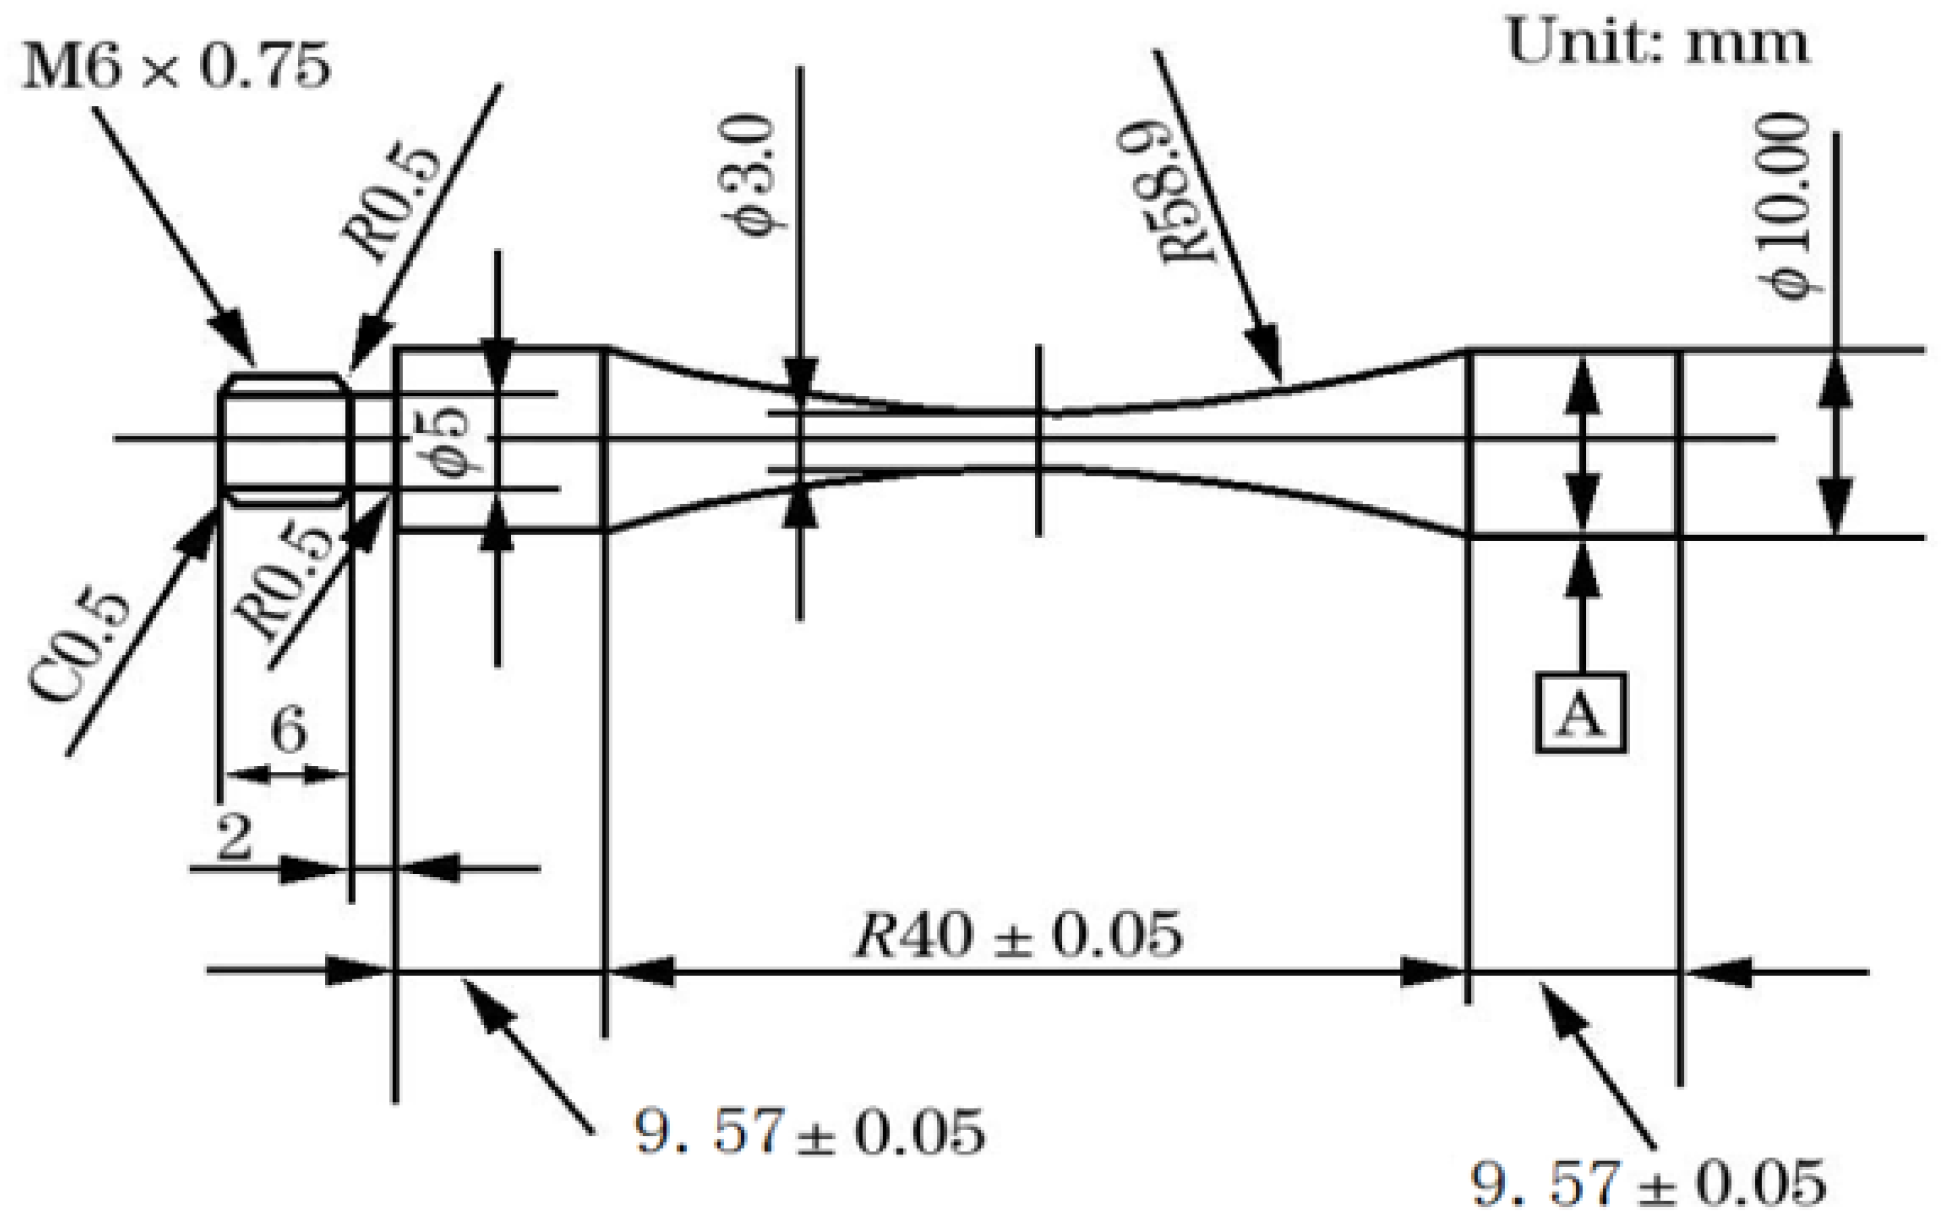
2. Materials and Methods

| Element | C | Si | Mn | P | S | Cr | Ni | Mo |
|---|---|---|---|---|---|---|---|---|
| 18CrNiMo7-6 | 0.16~0.19 | 0.15~0.35 | 0.45~0.65 | ≤0.0015 | ≤0.0020 | 1.50~1.80 | 1.40~1.70 | 0.20~0.30 |


3. Results and Discussion
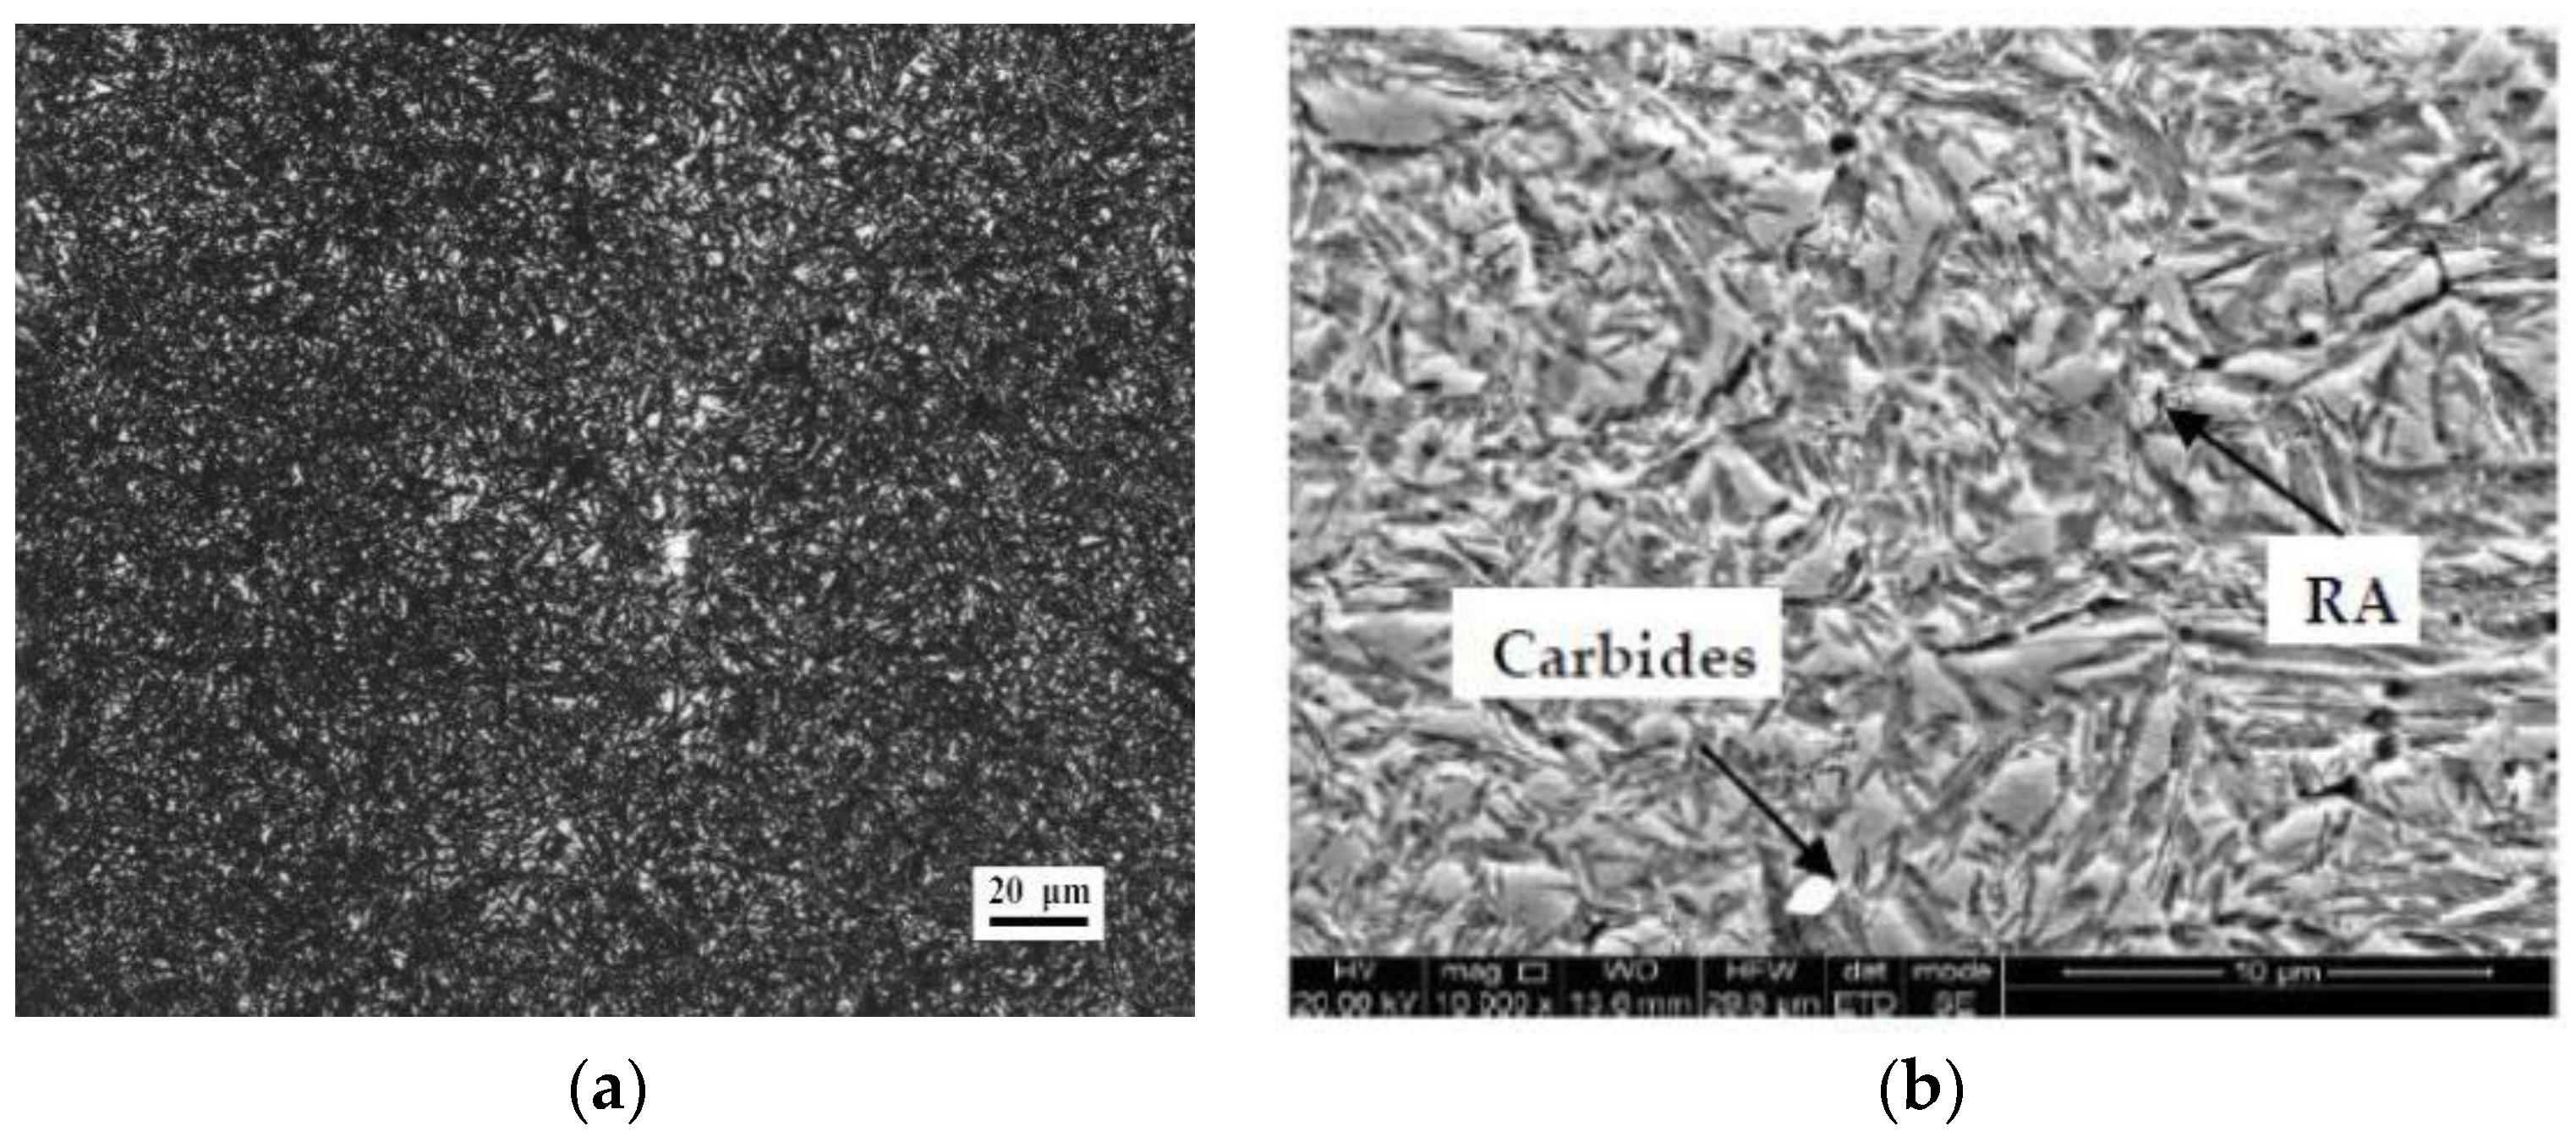
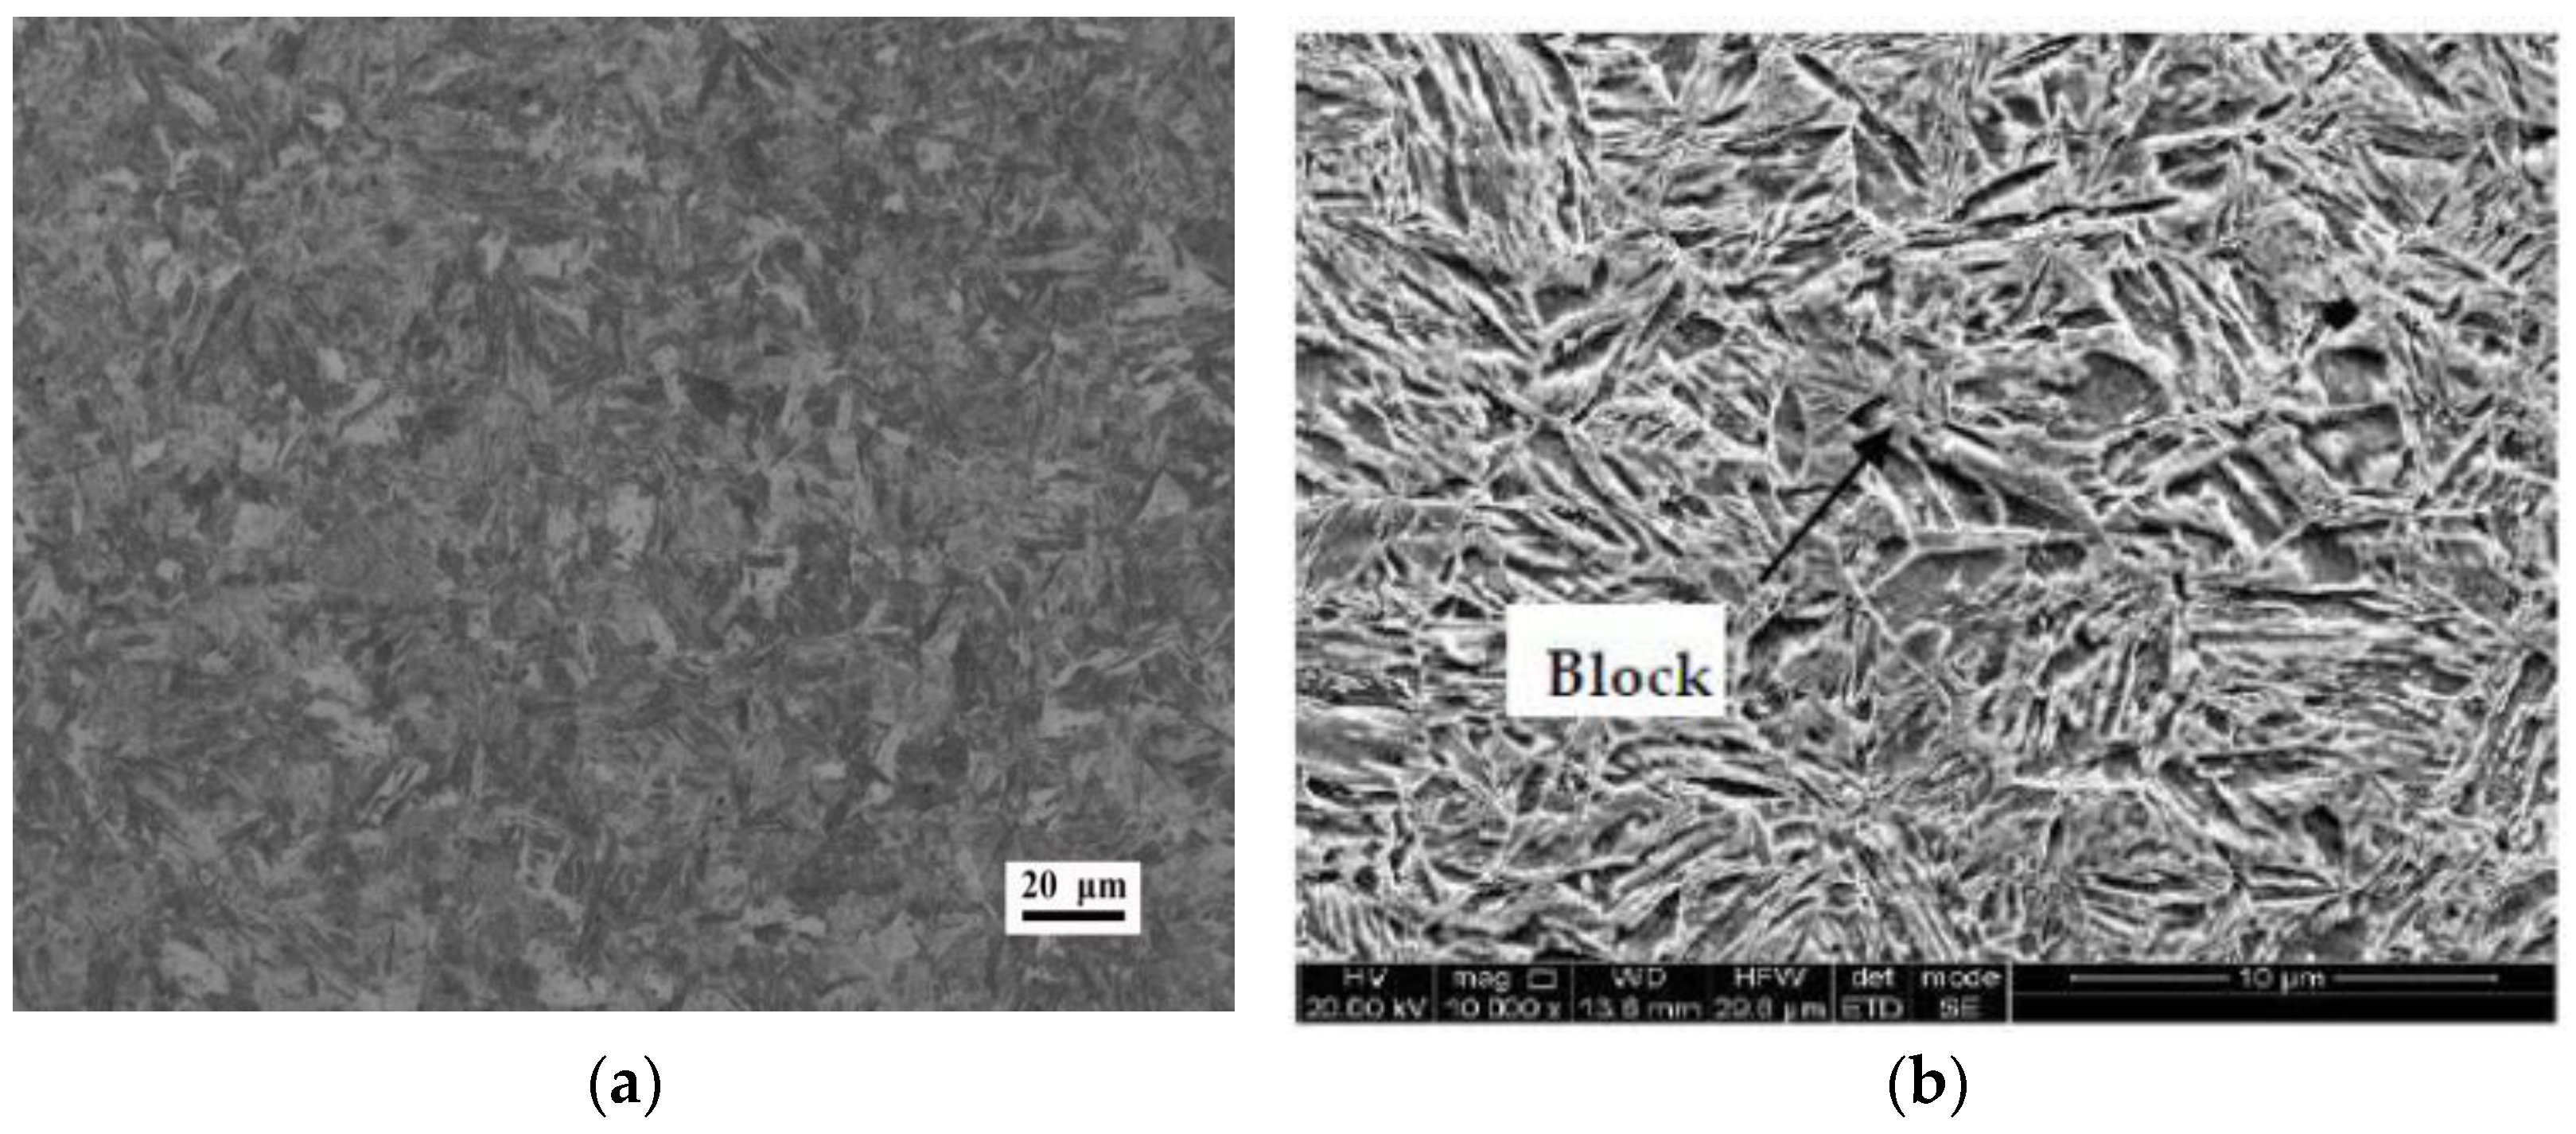
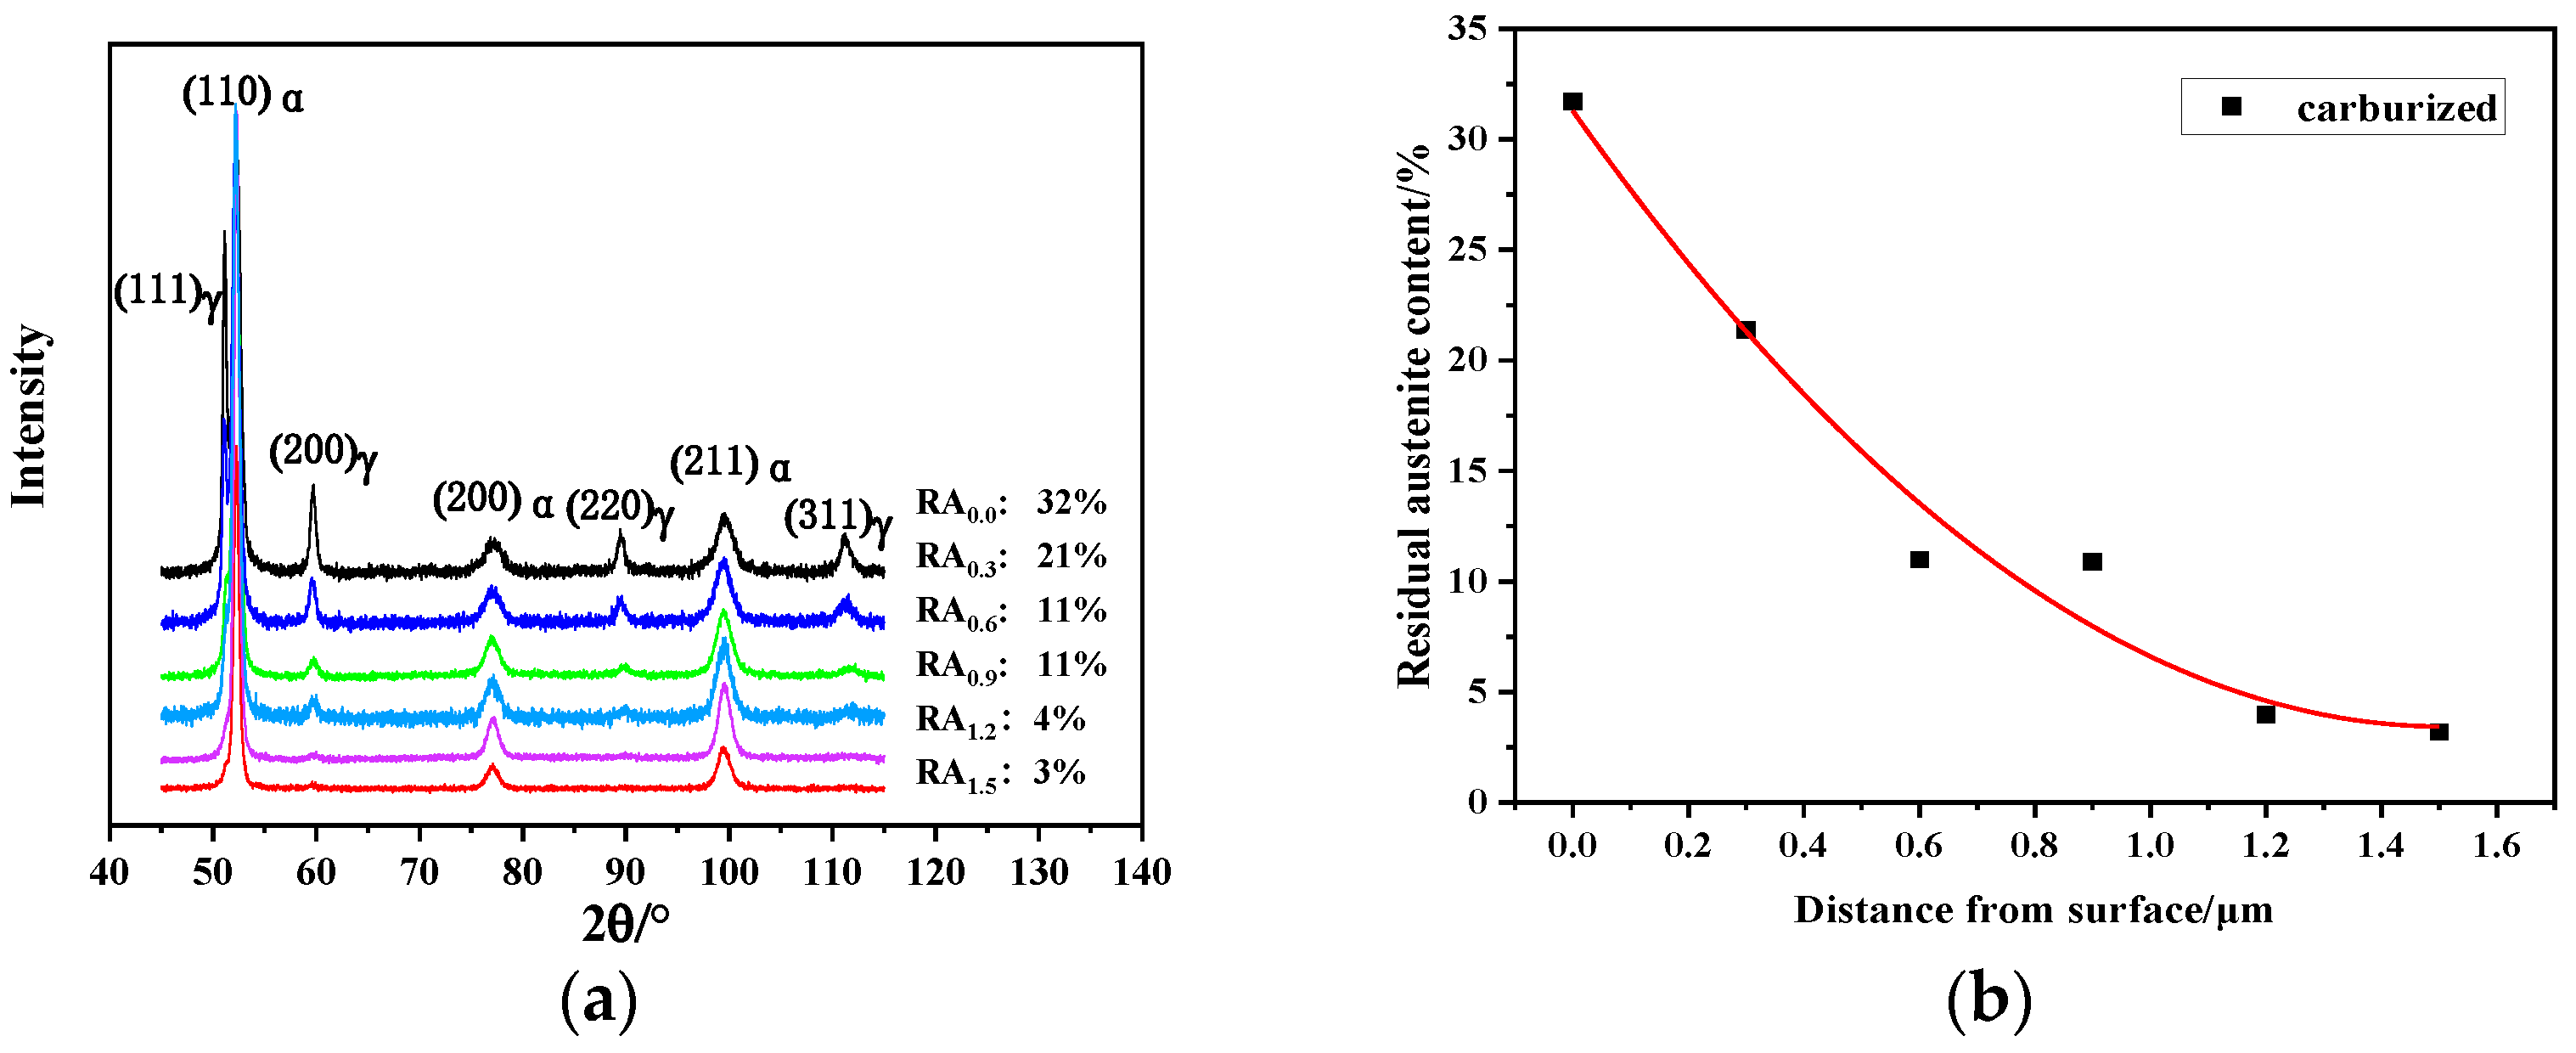
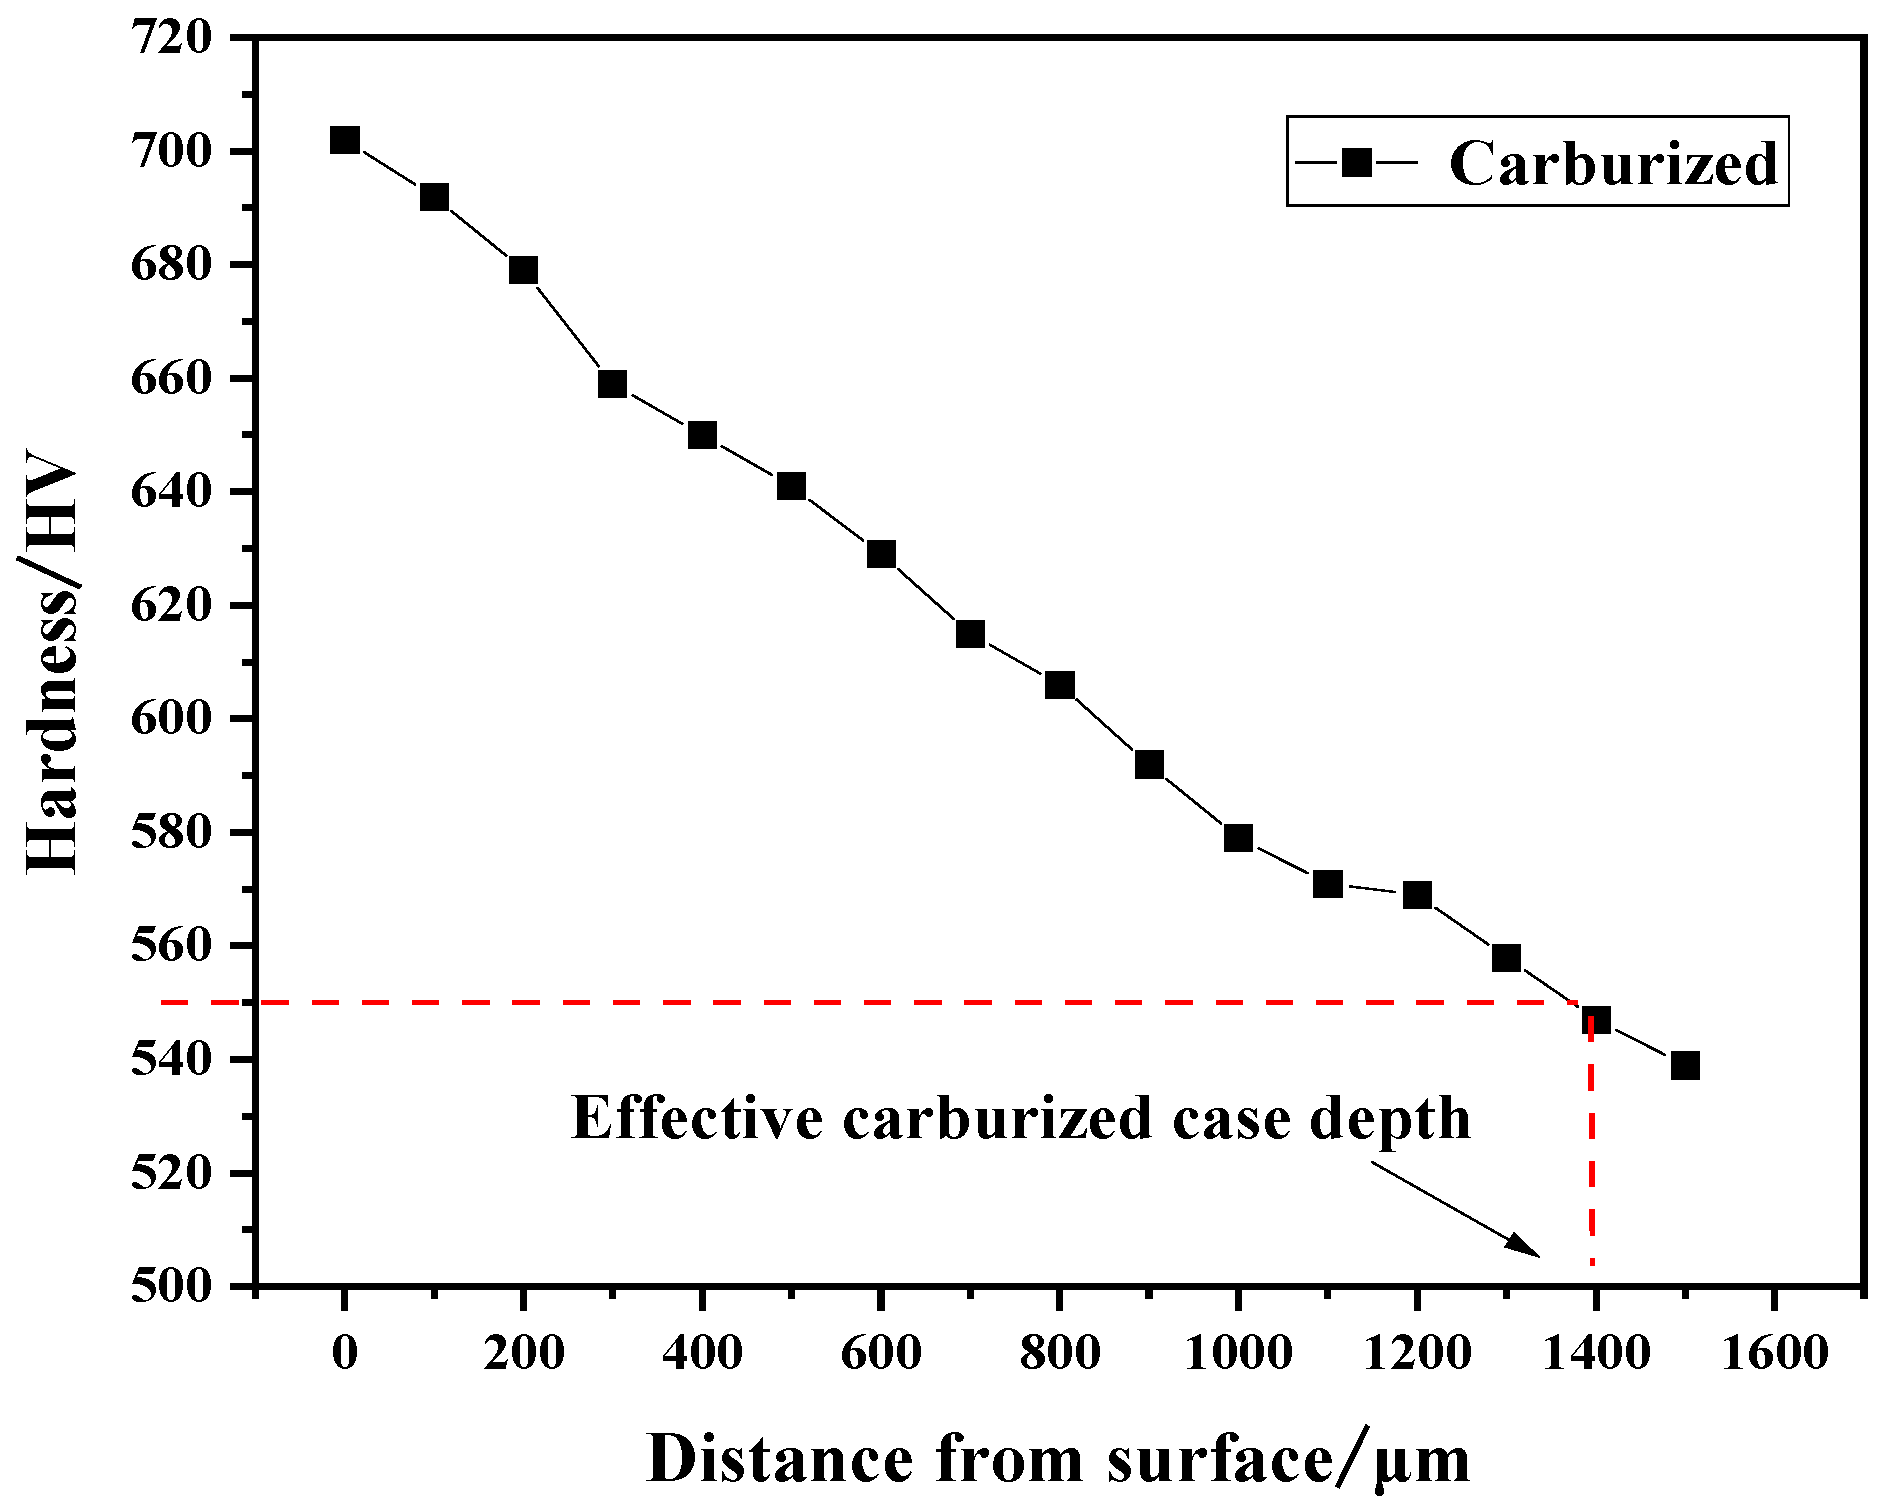
3.1. Microstructure and Hardness


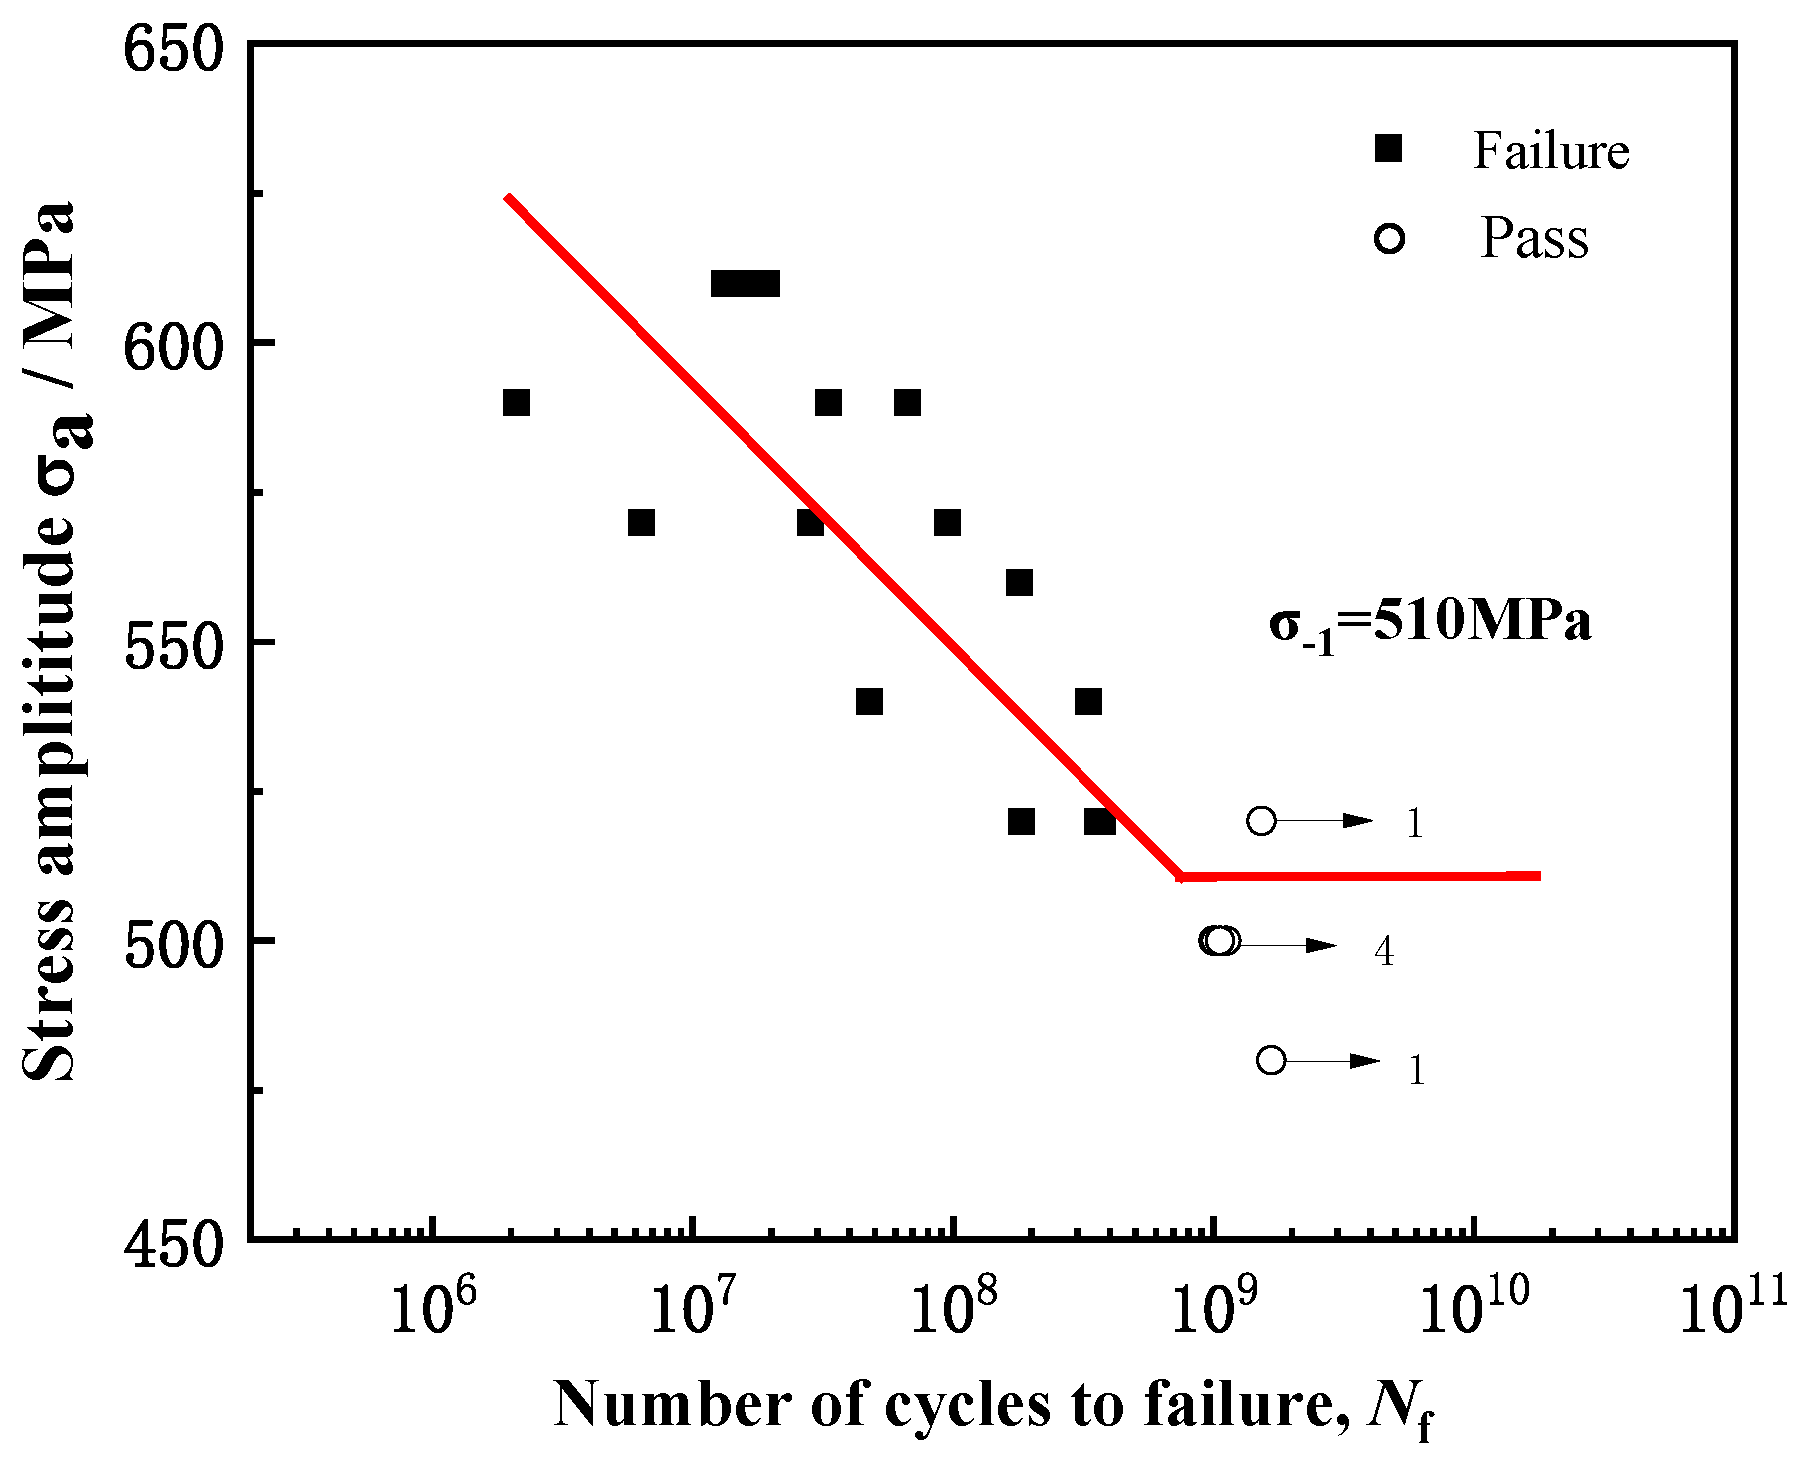
3.2. S-N Curve
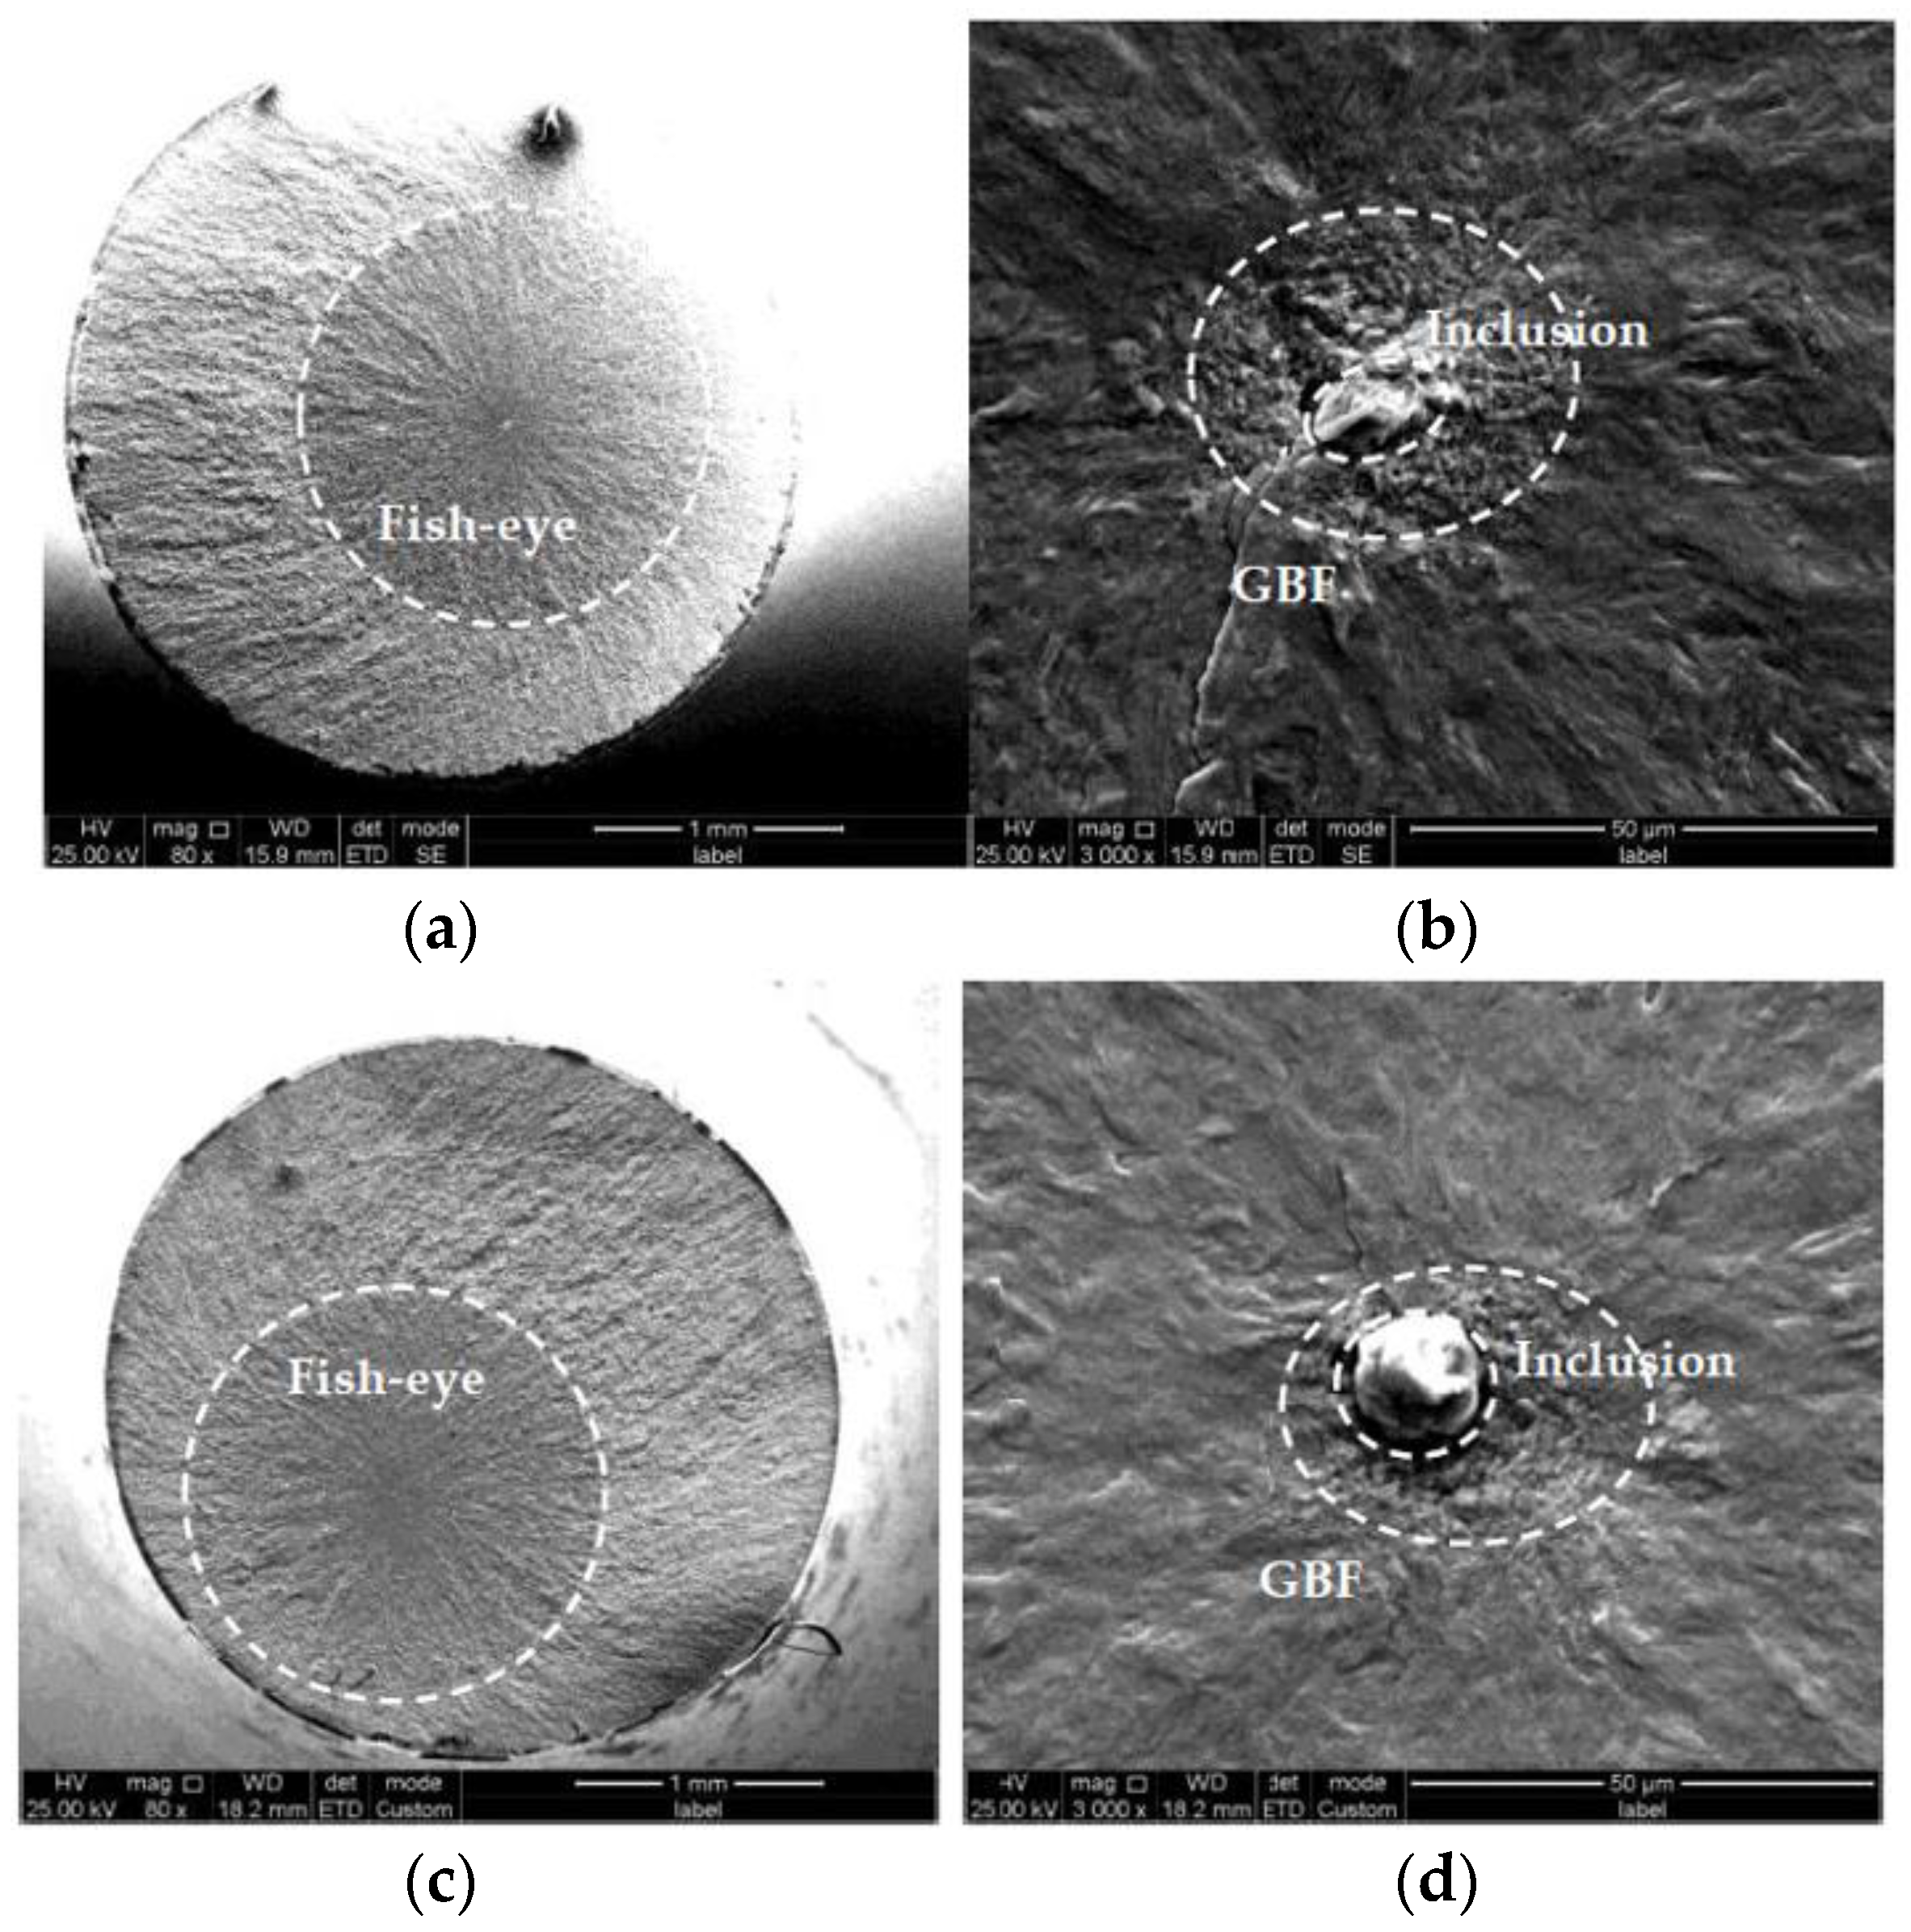
3.3. Fractography


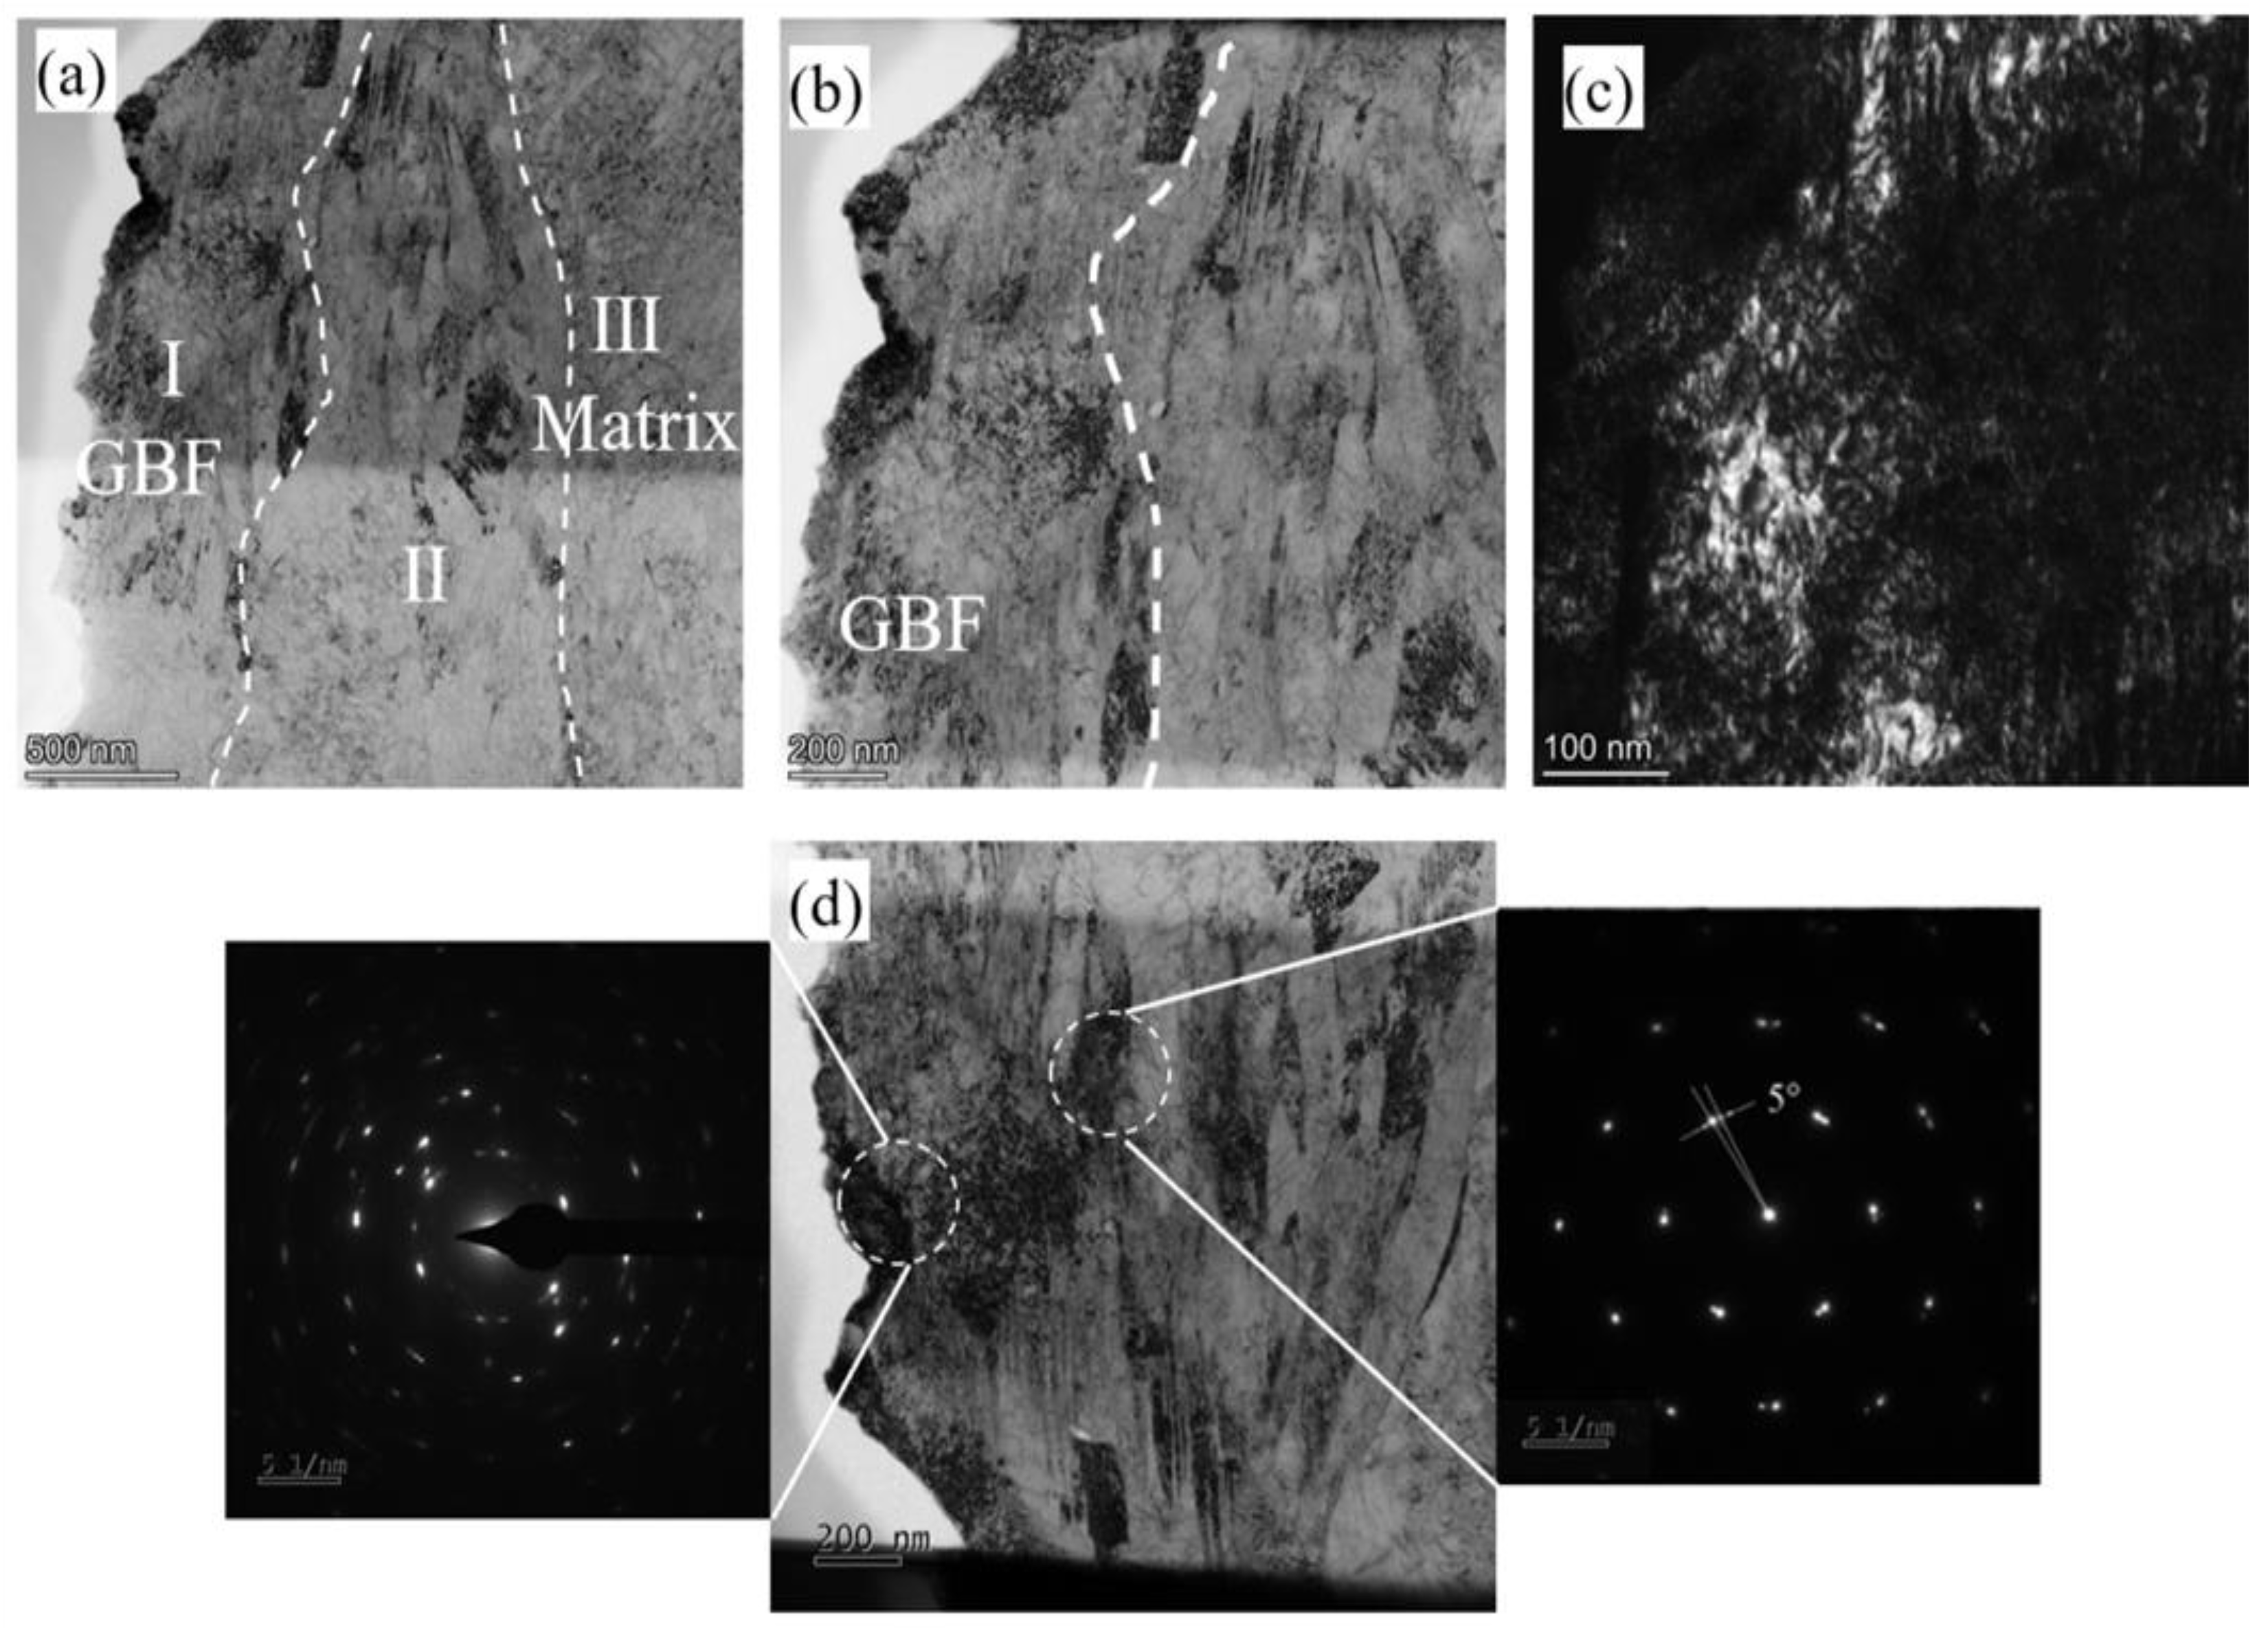
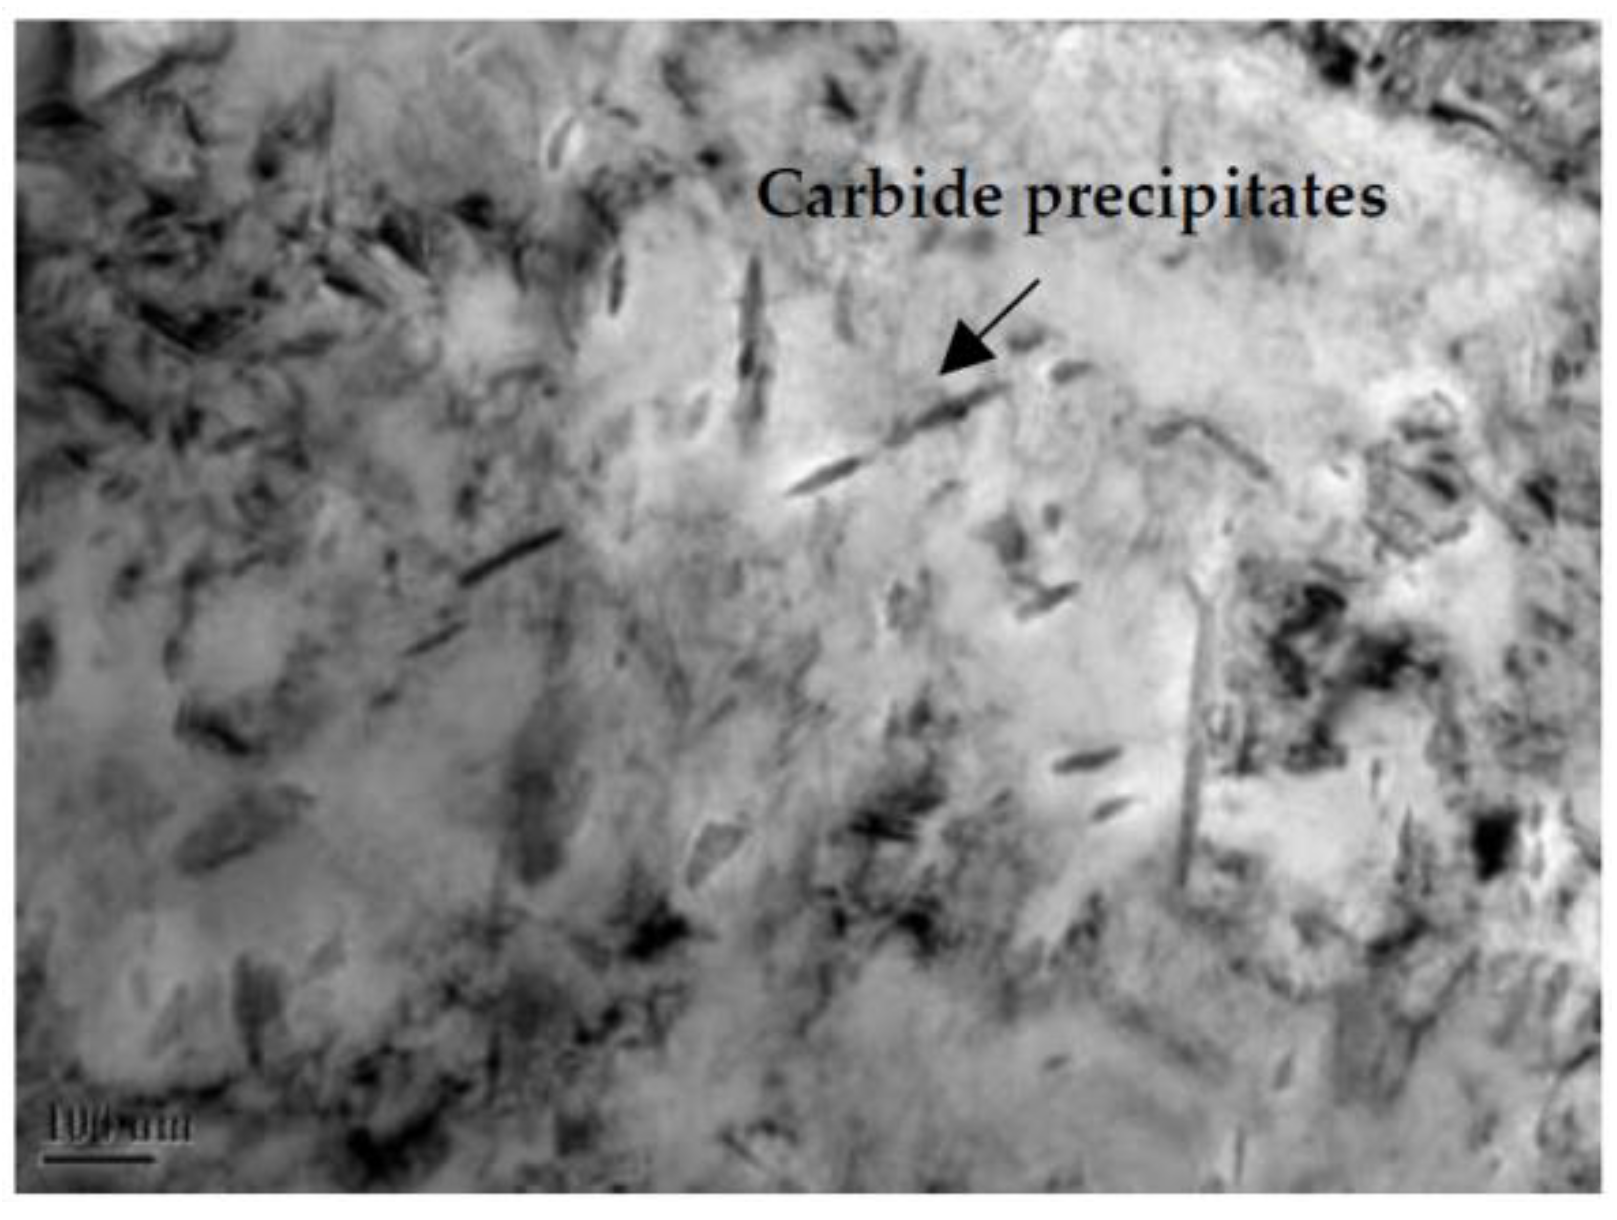
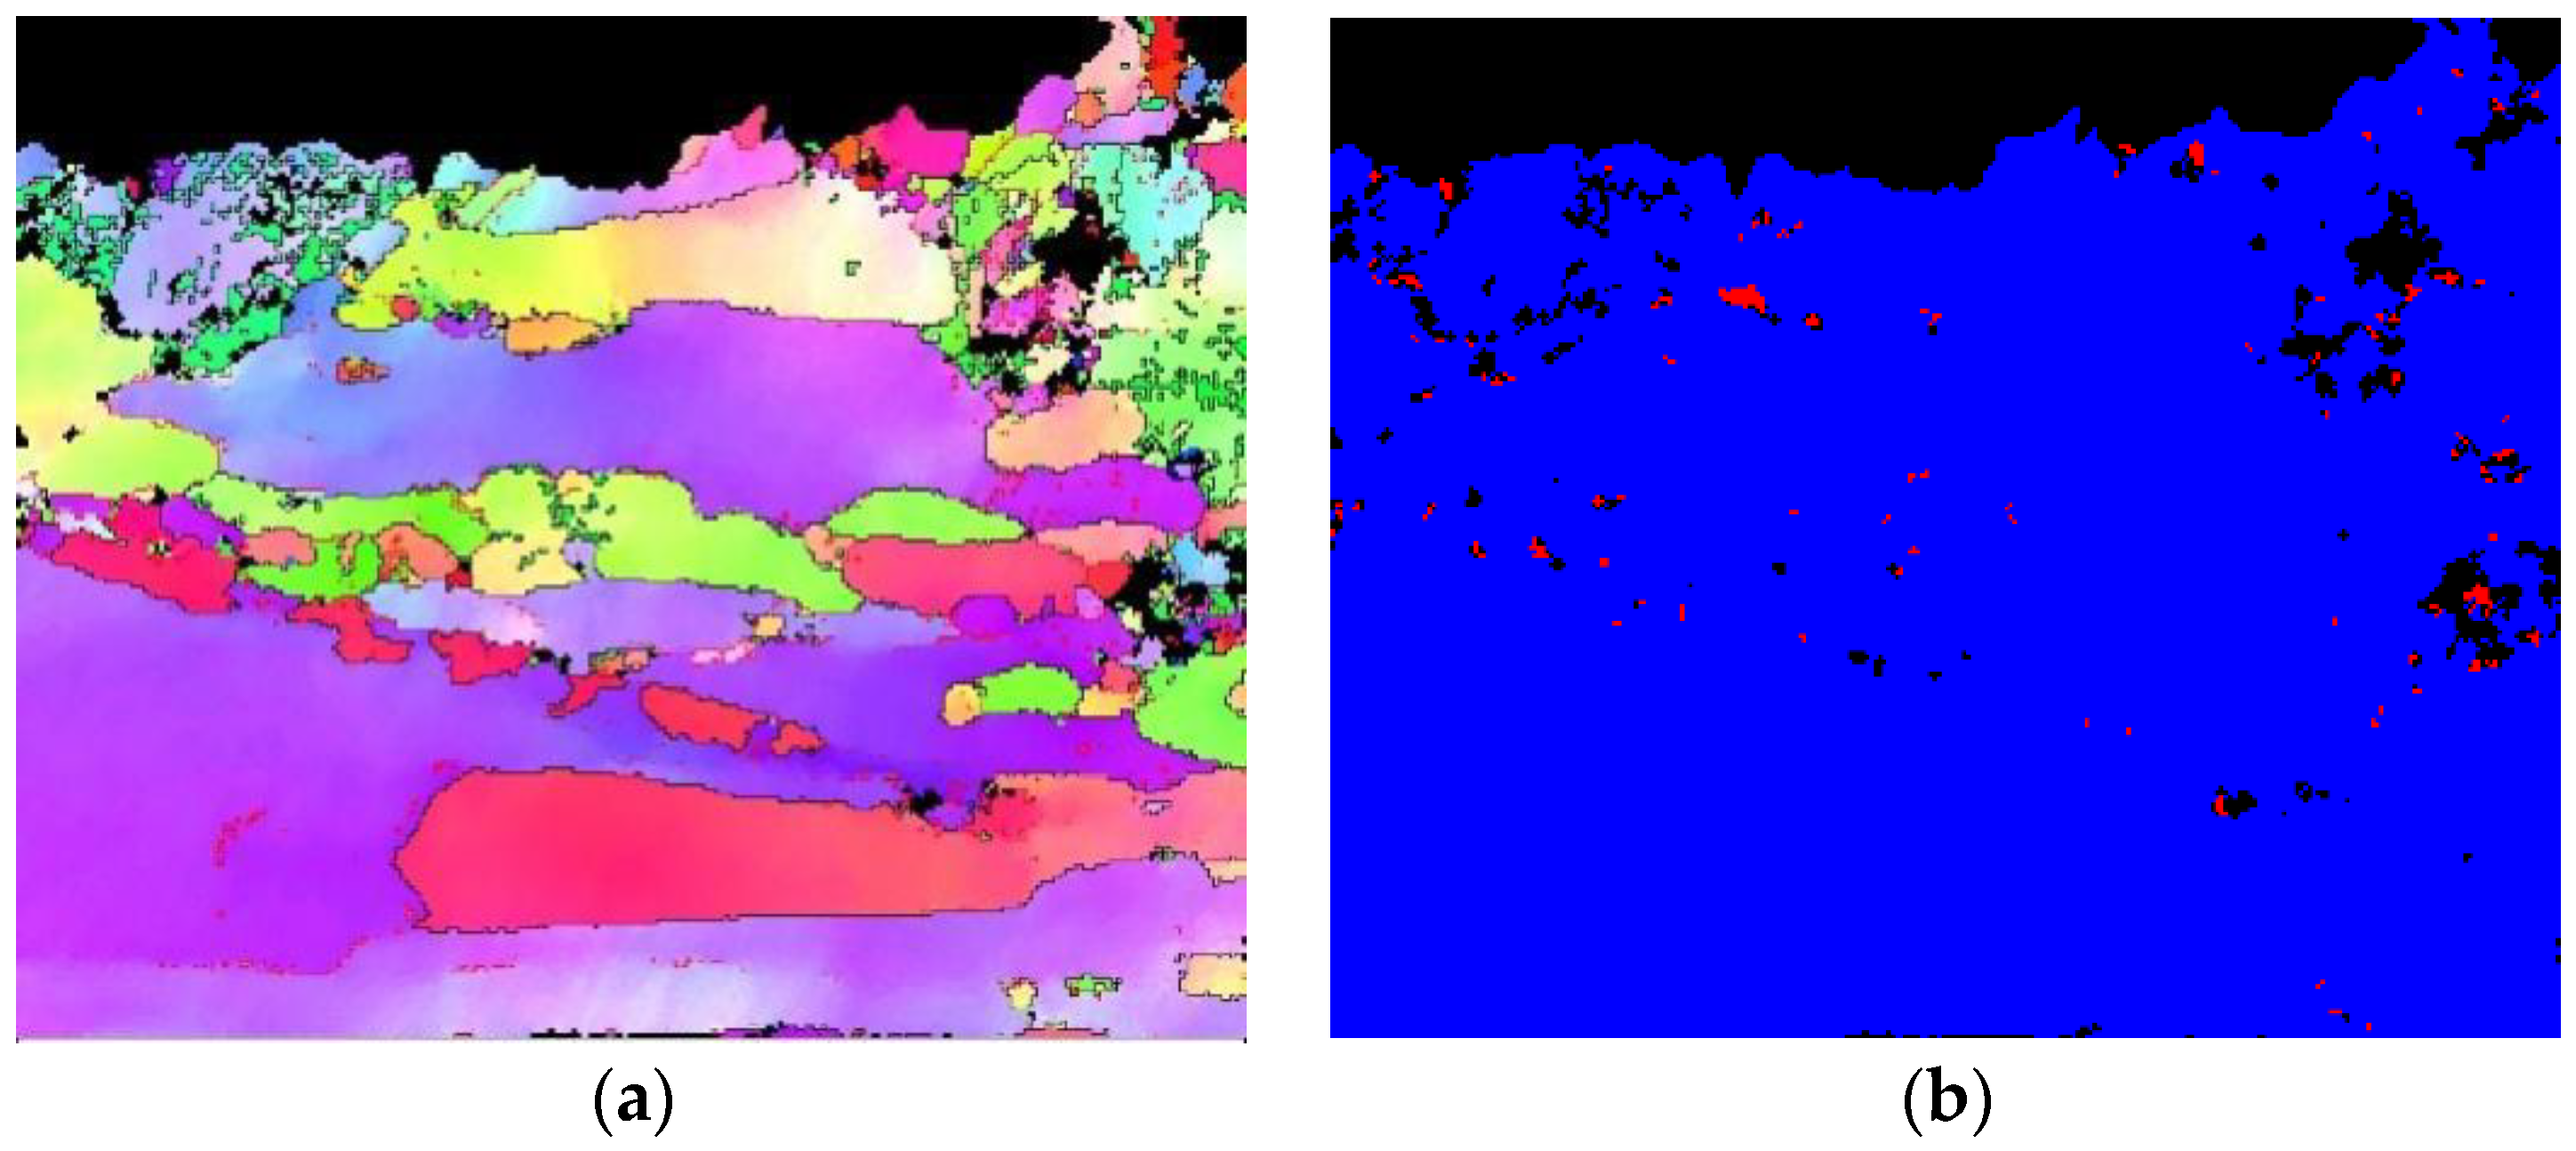
3.4. Detailed Characterization of GBF and Discussion

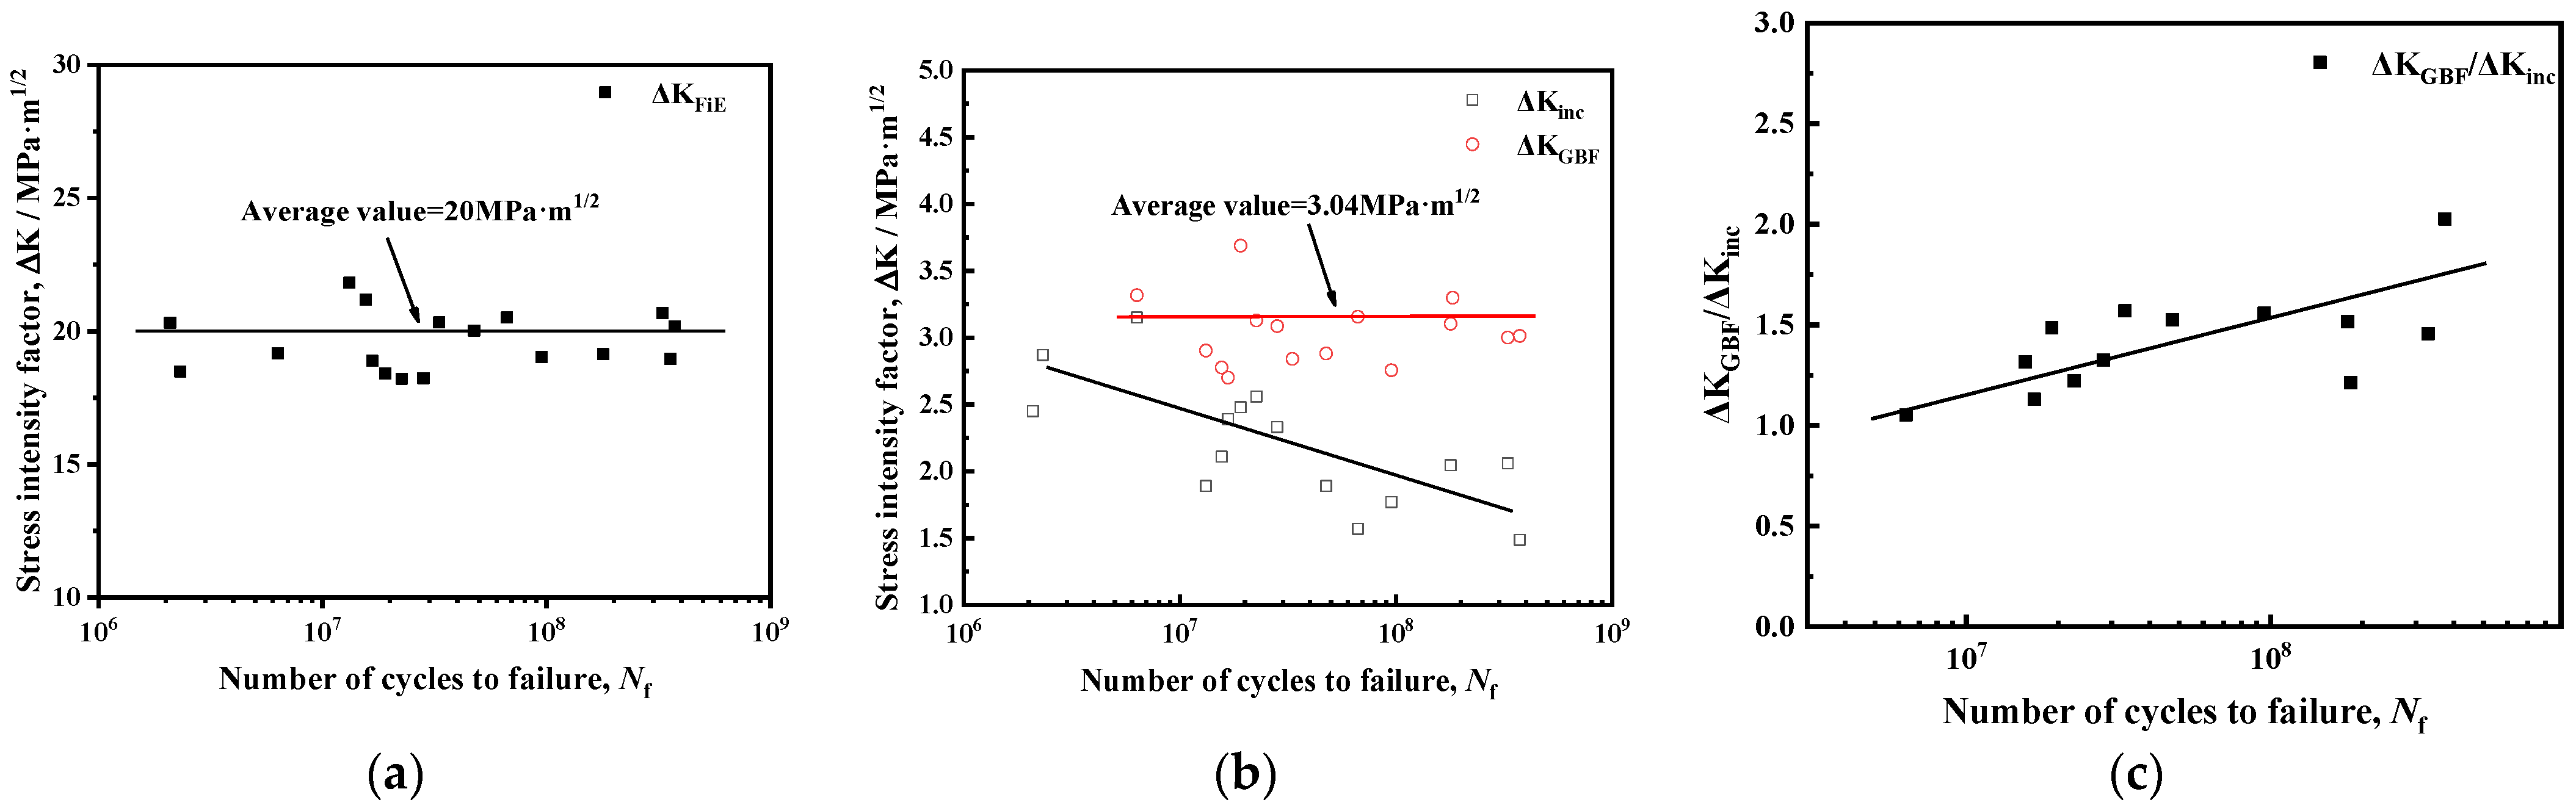
3.5. Stress Intensity Factor

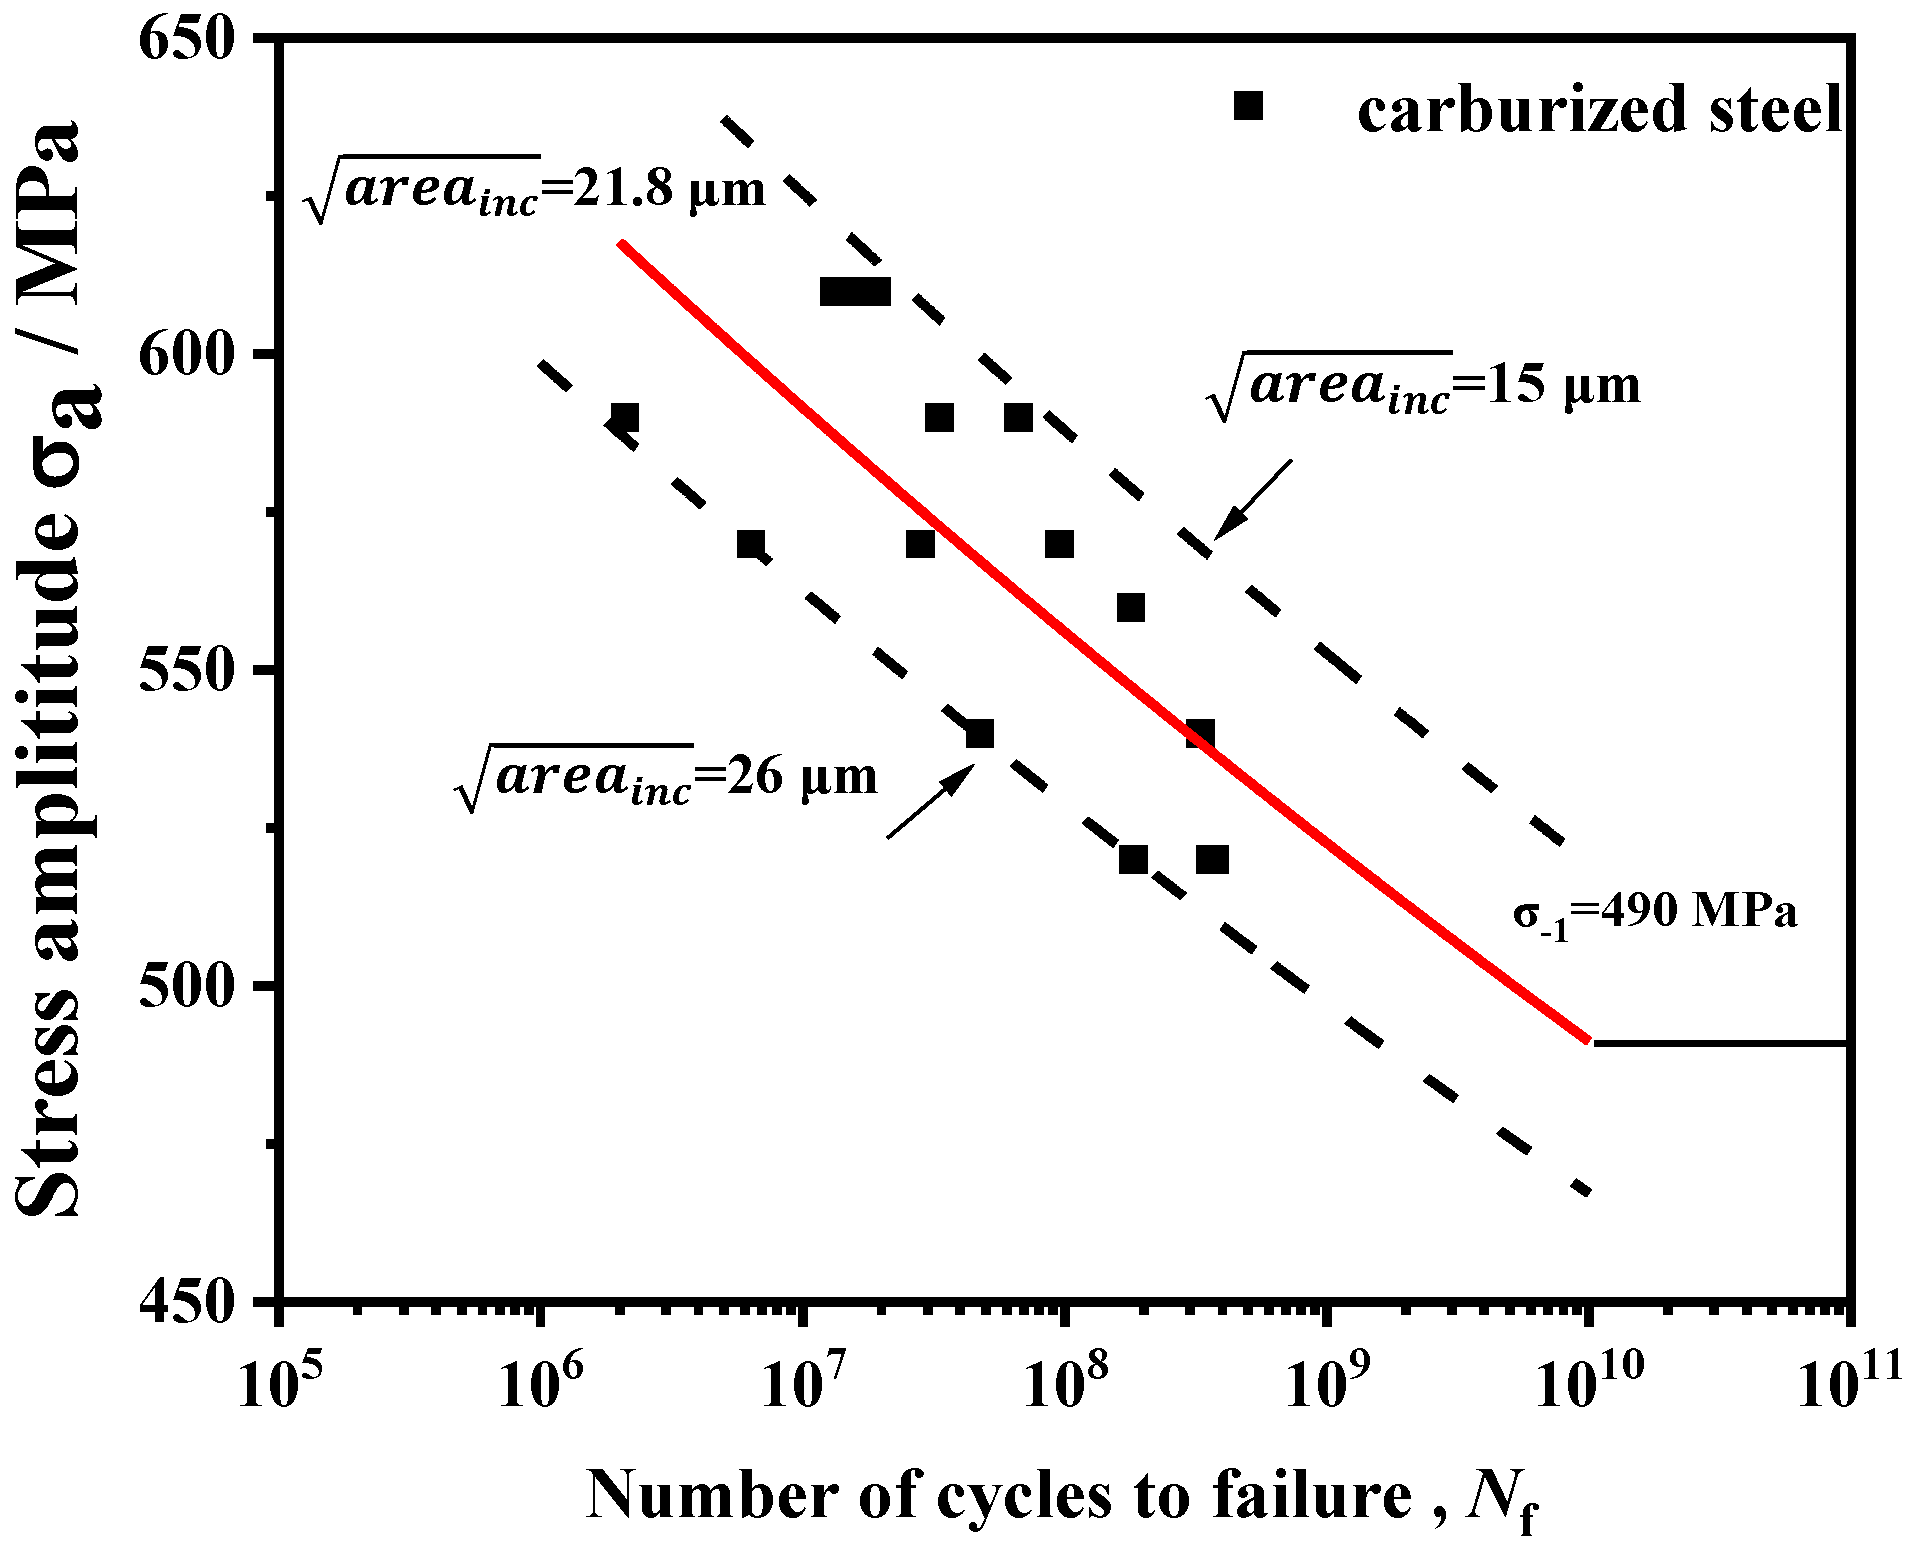
3.6. Fatigue Life Prediction
4. Conclusions
Author Contributions
Funding
Institutional Review Board Statement
Informed Consent Statement
Data Availability Statement
Conflicts of Interest
References
- Sakai, T.; Lian, B.; Takeda, M.; Shiozawa, K.; Oguma, N.; Ochi, Y.; Nakajima, M.; Nakamura, T. Statistical duplex S–N characteristics of high carbon chromium bearing steel in rotating bending in very high cycle regime. Int. J. Fatigue 2010, 32, 497. [Google Scholar] [CrossRef]
- Li, W.; Sakai, T.; Wakita, M.; Mimura, S. Influence of microstructure and surface defect on very high cycle fatigue properties of clean spring steel. Int. J. Fatigue 2014, 60, 48. [Google Scholar] [CrossRef]
- Furuya, Y. Gigacycle fatigue properties of double-melted SCM440 steel and size effects. ISIJ Int. 2014, 52, 1436. [Google Scholar] [CrossRef] [Green Version]
- Yang, Z.G.; Li, S.X.; Zhang, J.M.; Zhang, J.F.; Li, G.Y.; Li, Z.B.; Hui, W.J.; Weng, Y.Q. On the critical inclusion size of high strength steels under ultra-high cycle fatigue. Acta Mater. 2004, 52, 5235. [Google Scholar] [CrossRef]
- Bathias, C.; Drouillac, L.; le Francois, P. How and why the fatigue S–N curve does not approach a horizontal asymptote. Int. J. Fatigue 2001, 23, 143–151. [Google Scholar] [CrossRef]
- Sakai, T.; Takeda, M.; Shiozawa, K.; Ochi, Y.; Nakajima, M.; Nakamura, T. Experimental reconfirmation of characteristic S-N property for high carbon chromium bearing steel in wide life region in rotating bending. J. Soc. Mater. Sci. 2000, 49, 779–785. [Google Scholar] [CrossRef] [Green Version]
- Sakai, T.; Sato, Y.; Oguma, N. Characteristic S-N property of high carbon chromium bearing steel under axial loading in long life fatigue. Mater. Struct. 2002, 25, 765–773. [Google Scholar] [CrossRef]
- Murakami, Y.; Yokoyama, N.N.; Nagata, J. Mechanism of fatigue failure in ultralong life regime. Fatigue Fract. Eng. Mater. Struct. 2002, 25, 735–746. [Google Scholar] [CrossRef]
- Hong, Y.; Zhao, A.; Qian, G.; Zhou, C. Fatigue strength and crack initiation mechanism of very-high-cycle fatigue for low alloy steels. Mater. Trans. A 2012, 43, 2753–2762. [Google Scholar] [CrossRef]
- Hong, Y.; Lei, Z.; Sun, C.; Zhao, A. Propensities of crack interior initiation and early growth for very-high-cycle fatigue of high strength steels. Int. J. Fatigue 2014, 58, 144–151. [Google Scholar] [CrossRef] [Green Version]
- Tanaka, K.; Akiniwa, Y. Fatigue crack propagation behaviour derived from S–N data in very high cycle regime. Fatigue Fract. Eng. Mater. Struct. 2002, 25, 775–784. [Google Scholar] [CrossRef]
- Liu, X.; Sun, C.; Hong, Y.S. Effects of stress ratio on high-cycle and very-high cycle fatigue behavior of a Ti–6Al–4V alloy. Hong Mater. Sci. Eng. A 2015, 622, 228–235. [Google Scholar] [CrossRef]
- Hong, Y.; Liu, X.; Lei, Z.; Sun, C. The formation mechanism of characteristic region at crack initiation for very-high-cycle fatigue of high-strength steels. Int. J. Fatigue 2016, 89, 108–118. [Google Scholar] [CrossRef] [Green Version]
- Yukun, C.; Xiangnan, P.; Liang, Z. Microstructure refinement and grain size distribution in crack initiation region of very-high-cycle fatigue regime for high-strength alloys. Int. J. Fatigue 2020, 134, 105473. [Google Scholar]
- Krauss, G. The microstructure and fracture of a carburized steel. Metall. Mater. Trans. A 1978, 9, 1527. [Google Scholar] [CrossRef]
- Erdogan, M.; Tekeli, S. The effect of martensite volume fraction and particle size on the tensile properties of a surface-carburized AISI 8620 steel with a dual-phase core microstructure. Mater. Charact. 2003, 49, 445. [Google Scholar] [CrossRef]
- Liu, Y.; Wang, M.Q.; Shi, J.; Hui, W.J.; Fan, G.; Dong, H. Fatigue properties of two case hardening steels after carburization. Int. J. Fatigue 2009, 31, 292. [Google Scholar] [CrossRef]
- Naito, T.; Ueda, H.; Kikuchi, M. Fatigue behavior of carburized steel with internal oxides and nonmartensitic microstructure near the surface. Metall. Mater. Trans. 1984, 15, 1431. [Google Scholar] [CrossRef]
- Nehila, A.; Li, W.; Gao, N.; Xing, X.; Zhao, H.; Wang, P.; Sakai, T. Very high cycle fatigue of surface carburized CrNi steel at variable stress ratio: Failure analysis and life prediction. Int. J. Fatigue 2018, 111, 112. [Google Scholar] [CrossRef]
- Marines-Garcia, I.; Paris Paul, C.; Tada, H. Fatigue crack growth from small to long cracks in VHCF with surface initiations. Mater. Sci. Eng. A 2007, 468–470, 120–128. [Google Scholar] [CrossRef]
- Li, W.; Sun, Z.; Zhang, Z.; Deng, H. Tatsuo Sakai. Influence of case-carburizing and micro-defect on competing failure behaviors of Ni–Cr–W steel under gigacycle fatigue. J. Mater. Res. 2015, 30, 2247–2257. [Google Scholar] [CrossRef]
- Cheng, P.F.; Li, Y.K.; Yu, W.C.; Yang, S.P.; Hu, F.Z.; Shi, J.; Wang, M.Q.; Li, L. Comparison of very high cycle fatigue properties of 18CrNiMo7-6 steel after carburizing and pseudo-carburizing. Mater. J. Eng. Perform. 2020, 29, 8340. [Google Scholar] [CrossRef]
- Sun, C.; Xie, J.; Zhao, A.; Lei, Z.; Hong, Y.A. cumulative damage model for fatigue life estimation of high-strength steels in high-cycle and very-high-cycle fatigue regimes. Fatigue Fract. Eng. Mater. Struct. 2012, 35, 638–647. [Google Scholar] [CrossRef] [Green Version]
- Mayer, H. Recent developments in ultrasonic fatigue. Fatigue Fract. Eng. Mater. Struct. 2016, 39, 3–29. [Google Scholar] [CrossRef]
- Wang, C.F.; Wang, M.Q.; Shi, J.; Hui, W.J.; Dong, H. Effect of microstructural refinement on the toughness of low carbon martensitic steel. Scr. Mater. 2008, 58, 492. [Google Scholar] [CrossRef]
- Chen, W.; He, X.F.; Yu, W.C.; Shi, J.; Wang, M.Q.; Yao, K.F.; Mater, J. Nano and microhardness distribution in the carburized case of nb microalloyed gear steel. Eng. Perform. 2020, 29, 4626. [Google Scholar] [CrossRef]
- Liu, H.; Wang, W.; Zhu, C. A microstructure sensitive contact fatigue model of a carburized gear. Wear 2019, 436–437, 203035. [Google Scholar] [CrossRef]
- Shen, Y.; Moghadam, S.; Mobasher, S.F. Effect of retained austenite—Compressive residual stresses on rolling contact fatigue life of carburized AISI 8620 steel. Int. J. Fatigue 2015, 75, 135–144. [Google Scholar] [CrossRef]
- Roy, S.; Sundararajan, S. The effect of heat treatment routes on the retained austenite and tribomechanical properties of carburized AISI 8620 steel. Surf. Coat. Technol. 2016, 308, 236. [Google Scholar] [CrossRef]
- Zhao, M.H.; Han, X.C.; Wang, G. Determination of the mechanical properties of surface-modified layer of 18CrNiMo7-6 steel alloys after carburizing heat treatment. Int. J. Mech. Sci. 2018, 148, 84–93. [Google Scholar] [CrossRef]
- Hong, Y.; Sun, C. The nature and the mechanism of crack initiation and early growth forvery-high-cycle fatigue of metallic materials—An overview. Theor. Appl. Fract. Mech. 2017, 92, 331–350. [Google Scholar] [CrossRef] [Green Version]
- Li, W.; Yuan, H.; Sun, Z. Surface vs. interior failure behaviors in a structural steel under gigacycle fatigue: Failure analysis and life prediction. Int. J. Fatigue 2014, 64, 42–53. [Google Scholar] [CrossRef]
- Pippan, R.; Hohenwarter, A. Fatigue crack closure: A review of the physical phenomena. Fatigue Fract. Eng. Mater. Struct. 2017, 40, 471–495. [Google Scholar] [CrossRef] [PubMed]
- Sattari-Far, I.; Akbari, D.; Alderliesten, R. Effect of residual stresses on crack behaviour in single edge bending specimens. Mater. Struct. 2013, 36, 115–126. [Google Scholar]
- Shiozawa, K.; Murai, M.; Shimatani, Y.; Yoshimoto, T. Transition of fatigue failure mode of Ni–Cr–Mo low-alloy steel in very high cycle regime. Int. J. Fatigue 2010, 32, 541. [Google Scholar] [CrossRef]
- Li, Y.D.; Xu, N.; Ma, H.; Li, Y.Z. Granular bright fact crack propagating under very high cycle fatigue. Mater. Sci. Technol. 2016, 31, 1894. [Google Scholar] [CrossRef]
- Sakai, T.; Oguma, N.; Morikawa, A. Microscopic and nanoscopic observations of metallurgical structures around inclusions at interior crack initiation site for a bearing steel in very high-cycle fatigue. Fatigue Fract. Eng. Mater. Struct. 2015, 38, 1305. [Google Scholar] [CrossRef]
- Lei, Z.Q.; Hong, Y.S.; Xie, J.; Sun, C.Q.; Zhao, A.G. Effects of inclusion size and location on very-high-cycle fatigue behavior for high strength steels. J. Mater. Sci. Eng. A 2012, 558, 234. [Google Scholar] [CrossRef] [Green Version]
- Furuya, Y. A New model for predicting the gigacycle fatigue strength of high-strength. J. Mater. Sci. Eng. 2019, 743, 445. [Google Scholar] [CrossRef]


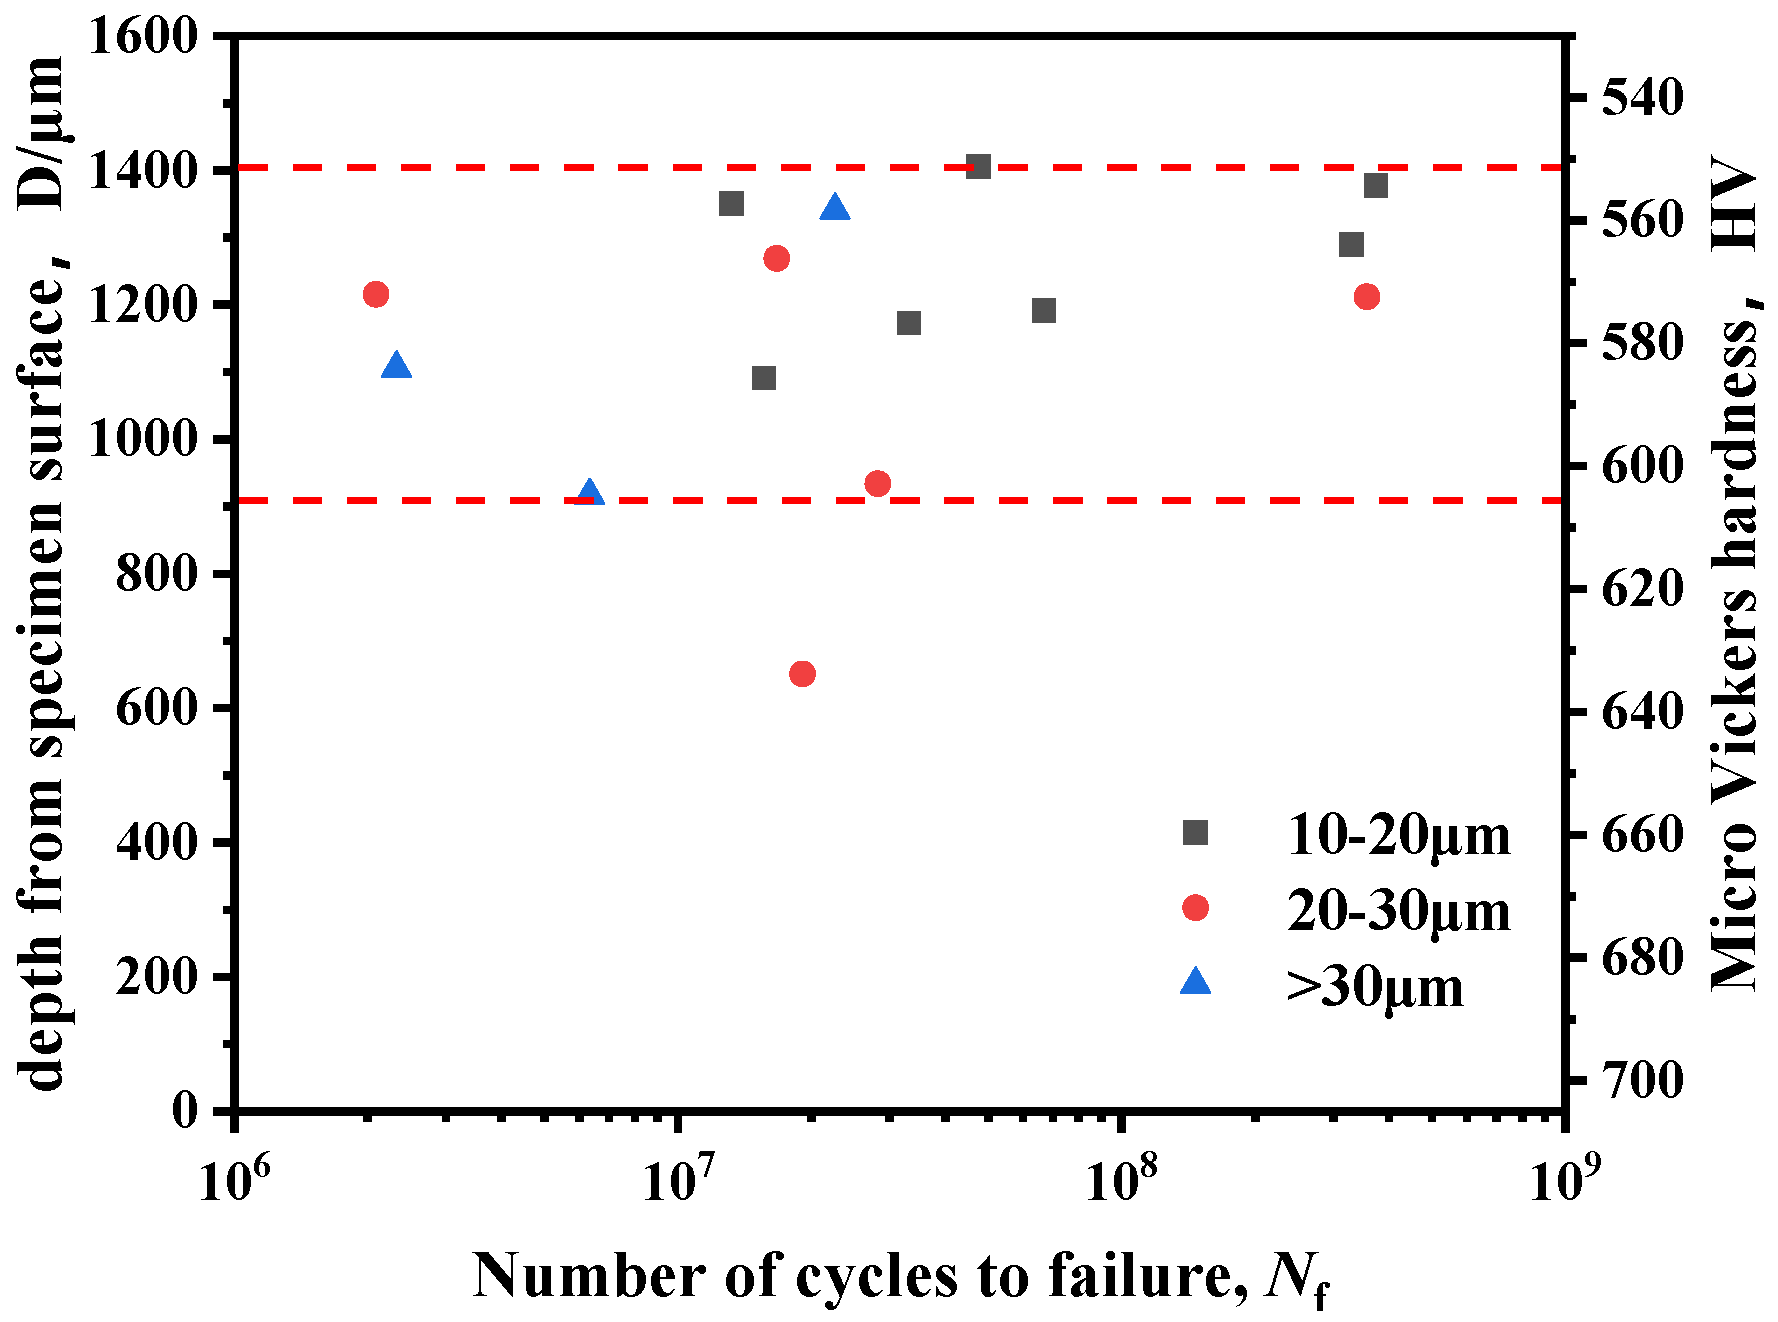
| No. | Stress /MPa | /Cycle | /μm | /μm | /μm | Depth /μm |
|---|---|---|---|---|---|---|
| 1 | 560 | 1.79 × 10⁸ | 17.00 | 39.12 | 1488 | 947 |
| 2 | 540 | 4.75 × 10⁷ | 15.60 | 36.29 | 1751 | 1406 |
| 3 | 520 | 3.57 × 10⁸ | 29.46 | 29.85 | 1693 | 1212 |
| 4 | 520 | 3.74 × 10⁸ | 10.42 | 42.76 | 1918 | 1378 |
| 5 | 540 | 3.29 × 10⁸ | 37.99 | 86.52 | 1869 | 1290 |
| 6 | 520 | 1.83 × 10⁸ | 34.85 | 51.25 | 1138 | 646 |
| 7 | 500 | 2.26 × 10⁷ | 33.52 | 49.87 | 1690 | 1340 |
| 8 | 520 | 2.32 × 10⁶ | 38.84 | 38.84 | 1610 | 1106 |
| 9 | 520 | 1.67 × 10⁷ | 26.85 | 34.37 | 1680 | 1269 |
| 10 | 570 | 2.82 × 10⁷ | 21.21 | 37.36 | 1304 | 933 |
| 11 | 570 | 6.33 × 10⁶ | 38.95 | 43.15 | 1440 | 916 |
| 12 | 570 | 9.53 × 10⁷ | 12.35 | 29.79 | 1420 | 953 |
| 13 | 590 | 6.66 × 10⁷ | 9.01 | 36.47 | 1540 | 1192 |
| 14 | 590 | 2.09 × 10⁶ | 22.01 | 22.01 | 1510 | 1215 |
| 15 | 590 | 3.32 × 10⁷ | 12.02 | 29.53 | 1512 | 1173 |
| 16 | 610 | 1.91 × 10⁷ | 21.05 | 46.55 | 1160 | 650 |
| 17 | 610 | 1.56 × 10⁷ | 15.25 | 26.40 | 1536 | 1091 |
| 18 | 610 | 1.32 × 10⁷ | 12.19 | 28.86 | 1629 | 1350 |
Publisher’s Note: MDPI stays neutral with regard to jurisdictional claims in published maps and institutional affiliations. |
© 2021 by the authors. Licensee MDPI, Basel, Switzerland. This article is an open access article distributed under the terms and conditions of the Creative Commons Attribution (CC BY) license (https://creativecommons.org/licenses/by/4.0/).
Share and Cite
Yang, S.; Cheng, P.; Hu, F.; Yu, W.; Zhang, C.; Wang, K.; Wang, M. Very High Cycle Fatigue Properties of 18CrNiMo7-6 Carburized Steel with Gradient Hardness Distribution. Coatings 2021, 11, 1482. https://doi.org/10.3390/coatings11121482
Yang S, Cheng P, Hu F, Yu W, Zhang C, Wang K, Wang M. Very High Cycle Fatigue Properties of 18CrNiMo7-6 Carburized Steel with Gradient Hardness Distribution. Coatings. 2021; 11(12):1482. https://doi.org/10.3390/coatings11121482
Chicago/Turabian StyleYang, Shaopeng, Peifeng Cheng, Fangzhong Hu, Wenchao Yu, Chi Zhang, Kaizhong Wang, and Maoqiu Wang. 2021. "Very High Cycle Fatigue Properties of 18CrNiMo7-6 Carburized Steel with Gradient Hardness Distribution" Coatings 11, no. 12: 1482. https://doi.org/10.3390/coatings11121482