Brief Report

Point-of-Care Diagnostic Test for Beta-Thalassemia

1
Department of Mechanical and Aerospace Engineering, Case Western Reserve University, Cleveland, OH 44106, USA
2
Department of Biomedical Engineering, University of Houston, Houston, TX 77004, USA
3
Department of Biomedical Sciences, University of Houston, Houston, TX 77004, USA
4
HemexHealth, Inc., Portland, OR 97239, USA
5
Plasma Lab, Jalgaon 425001, India
6
Apple Diagnostics Lab, Ghatkopar, Mumbai 400077, India
7
Department of Biomedical Engineering, Case Western Reserve University, Cleveland, OH 44106, USA
8
Case Comprehensive Cancer Center, Case Western Reserve University, Cleveland, OH 44106, USA
*
Authors to whom correspondence should be addressed.
Biosensors 2024, 14(2), 83; https://doi.org/10.3390/bios14020083
Submission received: 6 October 2023 / Revised: 15 January 2024 / Accepted: 16 January 2024 / Published: 2 February 2024
(This article belongs to the Special Issue Microfluidic-Based Biosensors for Point-of-Care Diagnostics)

Abstract

:
Hemoglobin (Hb) disorders are among the most common monogenic diseases affecting nearly 7% of the world population. Among various Hb disorders, approximately 1.5% of the world population carries β-thalassemia (β-Thal), affecting 40,000 newborns every year. Early screening and a timely diagnosis are essential for β-thalassemia patients for the prevention and management of later clinical complications. However, in Africa, Southern Europe, the Middle East, and Southeast Asia, where β-thalassemia is most prevalent, the diagnosis and screening for β-thalassemia are still challenging due to the cost and logistical burden of laboratory diagnostic tests. Here, we present Gazelle, which is a paper-based microchip electrophoresis platform that enables the first point-of-care diagnostic test for β-thalassemia. We evaluated the accuracy of Gazelle for the β-Thal screening across 372 subjects in the age range of 4–63 years at Apple Diagnostics lab in Mumbai, India. Additionally, 30 blood samples were prepared to mimic β-Thal intermediate and β-Thal major samples. Gazelle-detected levels of Hb A, Hb F, and Hb A2 demonstrated high levels of correlation with the results reported through laboratory gold standard high-performance liquid chromatography (HPLC), yielding a Pearson correlation coefficient = 0.99. This ability to obtain rapid and accurate results suggests that Gazelle may be suitable for the large-scale screening and diagnosis of β-Thal.

1. Introduction

Hemoglobin (Hb) disorders are among the world’s most common monogenic diseases [1]. β-thalassemia (β-Thal) is caused by single mutations resulting in small deletions or insertions within either the β-globin gene or its immediate flanking sequence or by gross deletions resulting in a reduced production of normal hemoglobin (Hb A). Globally, approximately 1.5% of the world population carries β-Thal, which affects 40,000 newborns every year [2,3]. It is estimated that over 90% of patients with β-Thal live in low-and middle-resource settings, including those found in Africa, the Middle East, Southeast Asia, and Southern Europe [4].
The early detection and screening for β-Thal are crucial for enabling timely interventions [5], preventing complications [5], facilitating informed family planning through genetic counseling [6], supporting public health strategies in high-prevalence areas [7], improving patients’ quality of life [8], and enhancing education and awareness [9]. Successful screening and prevention programs have reduced the number of persons affected by β-Thal in countries such as Cyprus, Greece, and Italy [10]. However, such programs have not been widely implemented in other areas due in large part to the cost and logistical burden of laboratory diagnostic tests [10].
There are many β-Thal syndromes. The most common ones are as follows: β-Thal major, β-Thal intermedia, and β-Thal trait [11,12,13]. β-Thal major and β-Thal intermedia are characterized by an elevated fetal hemoglobin percentage (HbF%.) They are associated with severe, moderate, or mild anemia requiring repeated transfusions resulting in a risk of iron overload. β-Thal trait is characterized by a high HbA% along with increased levels of hemoglobin A2 (HbA2% > 3.5%) and is associated with mild or no anemia and with variable microcytosis [14]. The current centralized test used for screening and diagnosing β-Thal is high-performance liquid chromatography (HPLC). This test relies on often unaffordable (USD 15 k–35 k or GHS 90 k–210 k) specialized instruments, state-of-the-art laboratory facilities, and highly trained personnel, which are lacking in the low-resource settings where β-Thal is most prevalent [2]. As a result, there is a need for affordable, portable, easy-to-use, and accurate point-of-care (POC) tests to facilitate decentralized β-Thal testing in low-resource settings [15,16,17,18].
Several POC diagnostic systems for several hemoglobin variants such as Hb S have been described [15,16,17,18,19,20,21] based on testing methods such as the sickle cell solubility test and antibody-based lateral flow assays such as Sickle SCANTM and HemoType SCTM [22,23,24]. However, there is currently no POC test available for β-Thal detection. In a 2019 report, the World Health Organization (WHO) listed hemoglobin testing as one of the most essential for in vitro diagnostic (IVD) tests for primary care use in low- and middle-income countries [25,26]. Furthermore, hemoglobin electrophoresis has recently been added to the WHO’s essential list of IVDs for diagnosing sickle cell disease (SCD) and sickle cell trait [27]. Leveraging the WHO-recognized Hb electrophoresis test, we developed a paper-based, affordable (~$2/test and <$1000 for GazelleTM reader), and miniaturized Hb electrophoresis platform: GazelleTM (Figure 1) [28,29,30]. GazelleTM leverages an injection-molded, single-use, plastic microcartridge that can be mass-produced. This microcartridge embodies a pair of biomedical-grade stainless steel electrodes, a pair of blotting pads for maintaining current continuity, and cellulose acetate paper as a separation medium for electrophoresis (Figure 1B,C).
The fundamental principle behind GazelleTM is hemoglobin electrophoresis in which different hemoglobin variants can be separated based on mobility differences under an electric field (Figure 1D). Gazelle has been tested in clinical studies in four different countries with more than 700 subjects and demonstrated a capability of identifying major Hb variants, including HbA, HbE, HbS, and HbF, in adults as well as in newborns with SCD, sickle cell trait, hemoglobin C disorder, and hemoglobin E disorder [28,30,31,32].
Here, we implemented a customized image analysis algorithm for the accurate quantification of HbA2 for the first time in addition to HbA, HbF, and Hb C/E. Additionally, we described a test for evaluating the diagnostic performance of this platform in identifying β-Thal major, β-Thal intermedia, and β-Thal trait across 372 subjects in the age range of 4–63 years at Apple Diagnostics lab in Ghatkopar, Mumbai, India. Additionally, 32 blood samples were prepared to mimic β-thalassemia intermediate and β-thalassemia major samples. Gazelle-detected levels of Hb A, Hb F, and Hb A2 demonstrated high correlations with the results reported through laboratory gold standard high-performance liquid chromatography (HPLC) yielding a Pearson correlation coefficient of 0.99. These results suggest that Gazelle-Multispectral is potentially suitable for large-scale β-Thal testing.

2. Methods

2.1. Study Design and Oversight

We conducted a prospective diagnostic accuracy study on the use of Gazelle in detecting Hb variants including HbA, Hb, and HbA2 at Apple Diagnostics lab in Ghatkopar, Mumbai, India, adhering to an IRB-approved study protocol (IEC@IISS (International Institute of Sleep Sciences IRB number); Reg No.: ECR/177/Indt/MH-2014/RR-19). The results obtained from Gazelle were compared with the results reported through the reference (“Gold-standard [33]”) tests using HPLC in India. All samples were tested within 7 days of collection. All authors have reviewed and analyzed the data and attest to their accuracy and completeness as well as the fidelity of adherence to the study protocol.

2.2. Study Populations and Procedures

This test was conducted at Apple Diagnostics in Mumbai, India. Blood samples were collected from subjects at screening camps and education and awareness programs conducted by Plasma Labs in Jalgaon district, Maharashtra, India. All these subjects had consented to participate in the study. Subjects were excluded only if they had undergone a blood transfusion in the preceding 3 months or if they were unable to give informed consent. The study was approved by the IRB of the International Institute of Sleep Sciences (IISS), and informed consent was obtained from each participant’s parent or guardian if required. All the blood samples were collected on-site in EDTA blood collection tubes and stored at 4 C until they were tested through Gazelle. Blood samples were tested within one week of collection. The leftover blood was stored at 4C for HPLC testing using a D-10 HPLC system (Bio-Rad Laboratories, Hercules, CA, USA). The laboratory technician who conducted the tests through Gazelle had basic laboratory skills, such as pipetting and vortexing, and was able to independently perform the tests with less than 2 h of training.

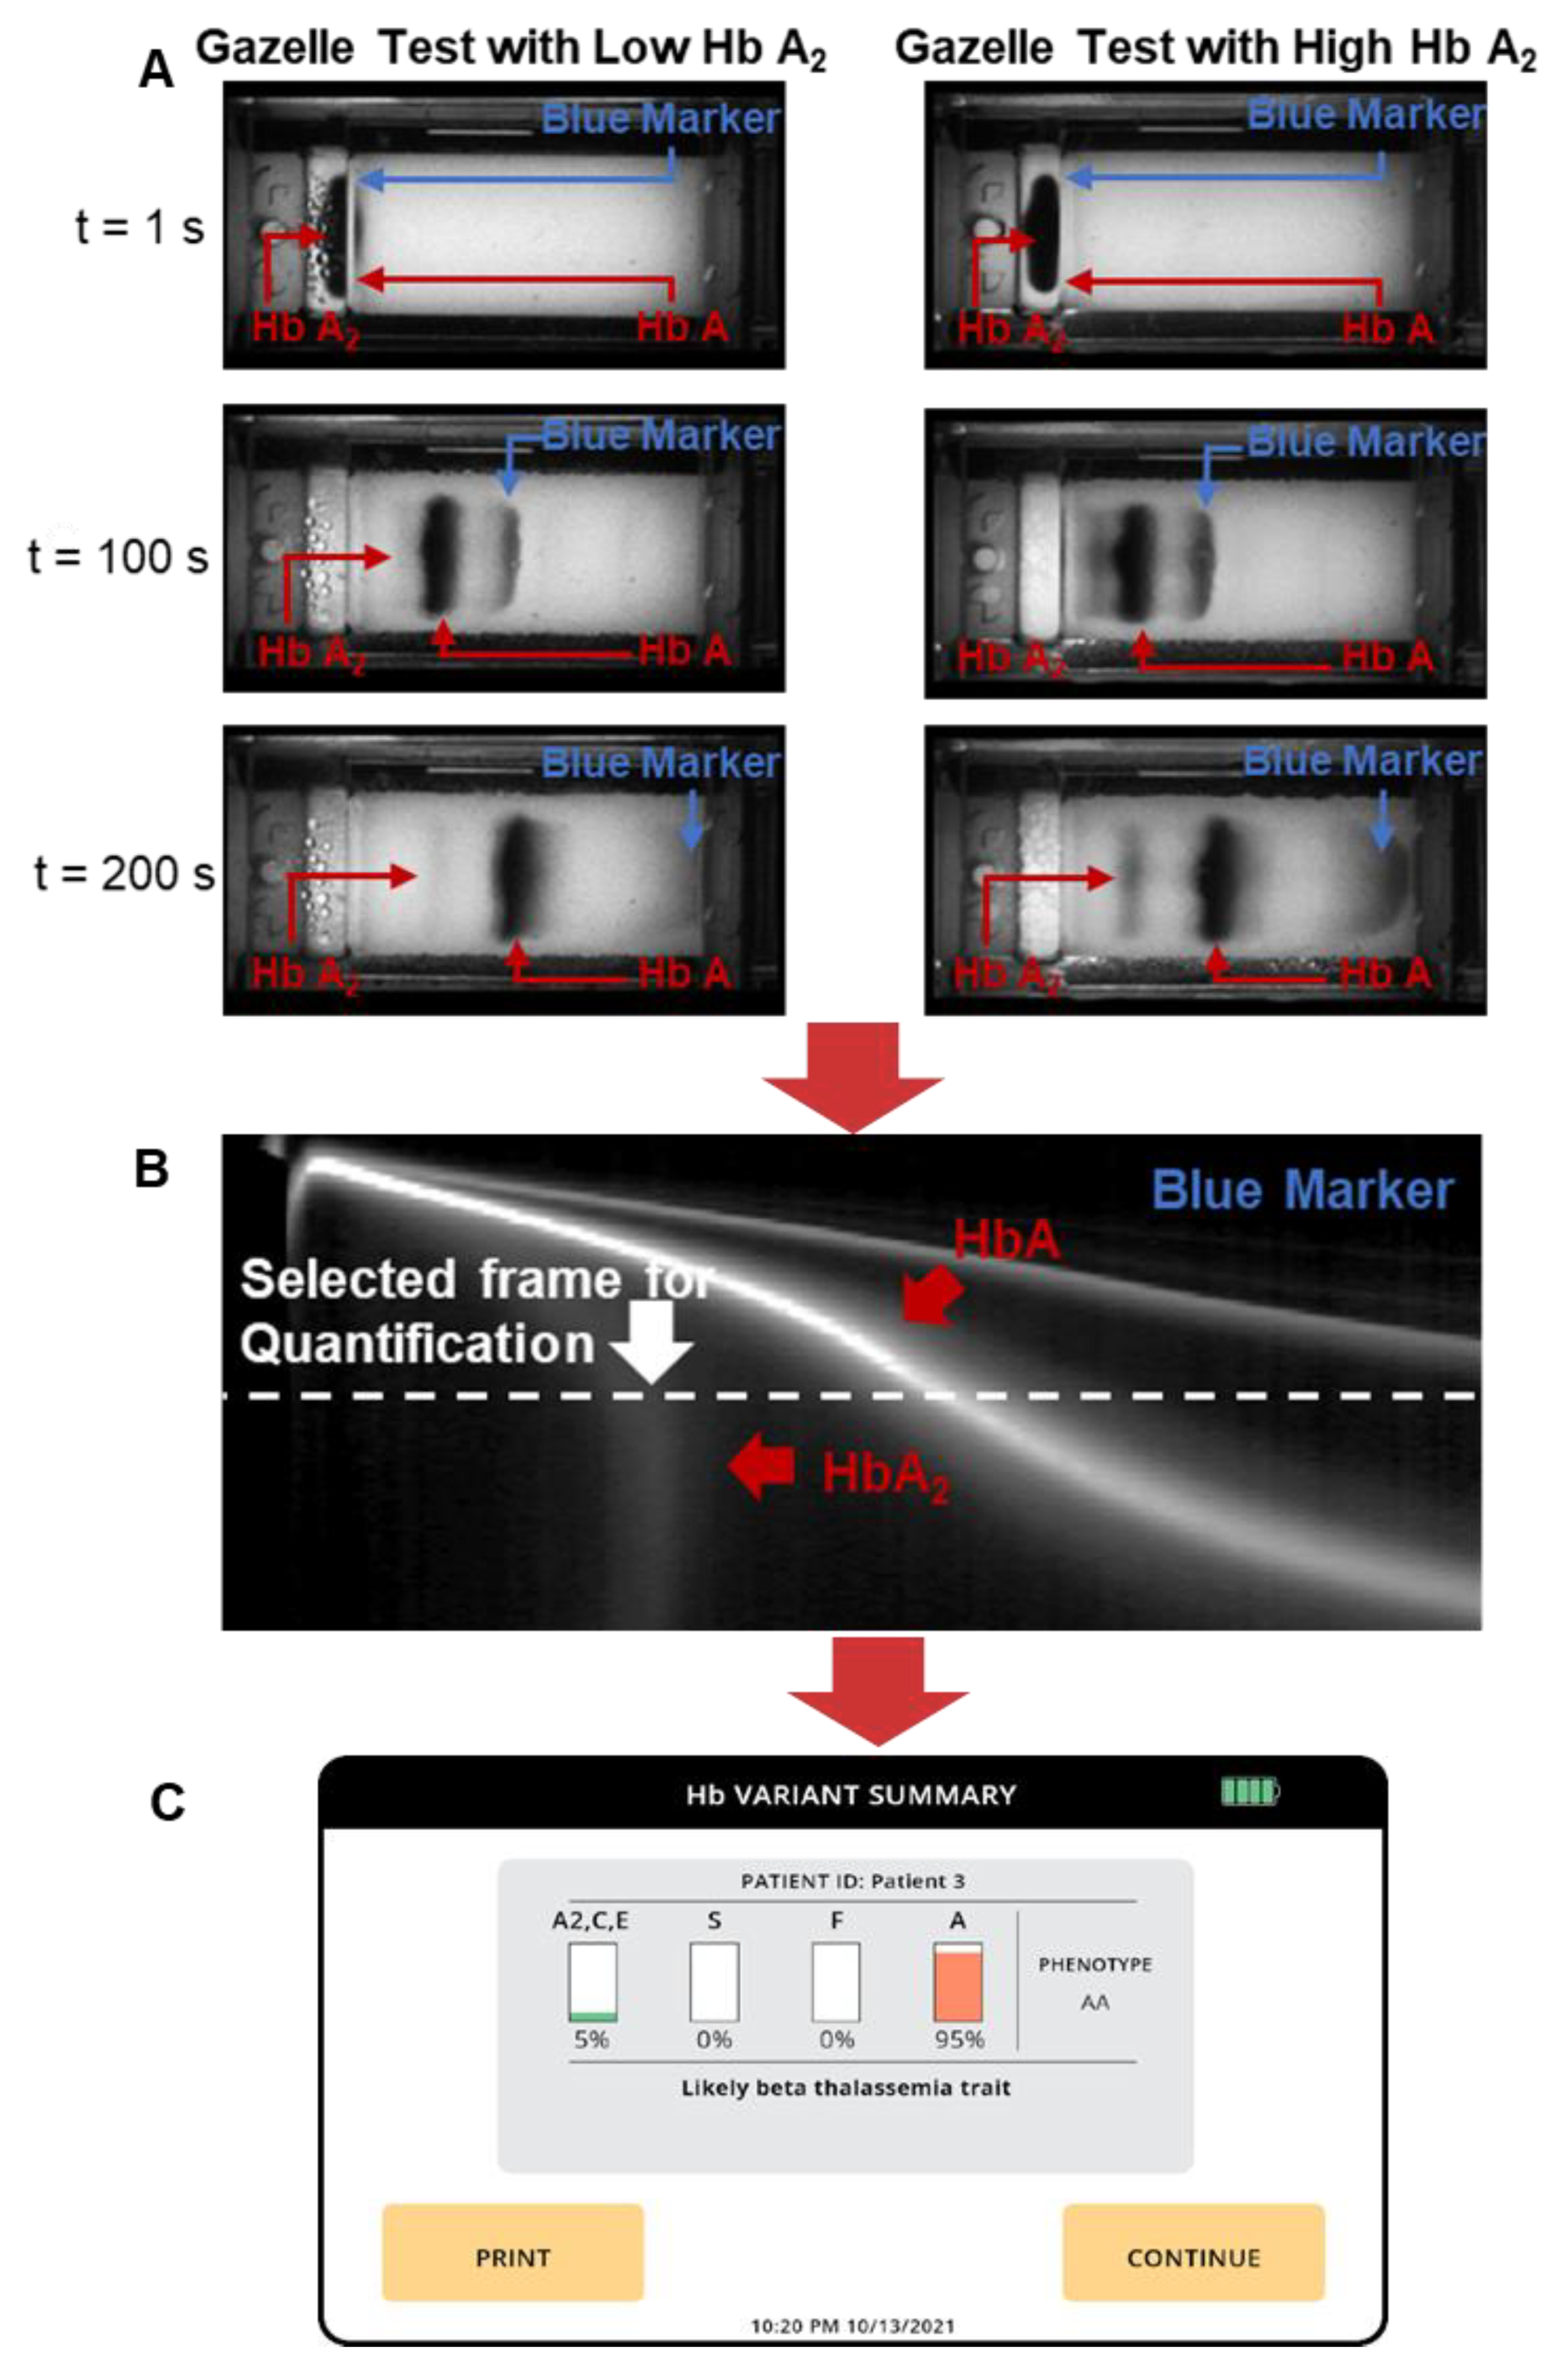
2.3. Gazelle Test Procedure

The GazelleTM system design, including the microcartridge structure, paper-based electrophoresis principle, instrument design, and optical path structure, can be found in our previous publications [30,32]. The technicians performed the tests according to the Gazelle-Multispectral instructions for use as published previously [30]. Similarly, all buffer compositions have been published previously [30]. At the conclusion of the 8 min test, Gazelle automatically reports the percentages of each hemoglobin type present in the blood samples as well as an interpretative statement.

2.4. Confirmatory Laboratory Procedures

Samples that were stored at 4 °C degrees were retrieved. A total of 5 microliters of the sample were pipetted and diluted using 1500 microliters of distilled water. Diluted hemolysates were arranged on racks and loaded into a Bio-Rad D-10 HPLC system. The barcoded sample IDs were then edited to the match sample IDs. Each sample was run for approximately 6 min.

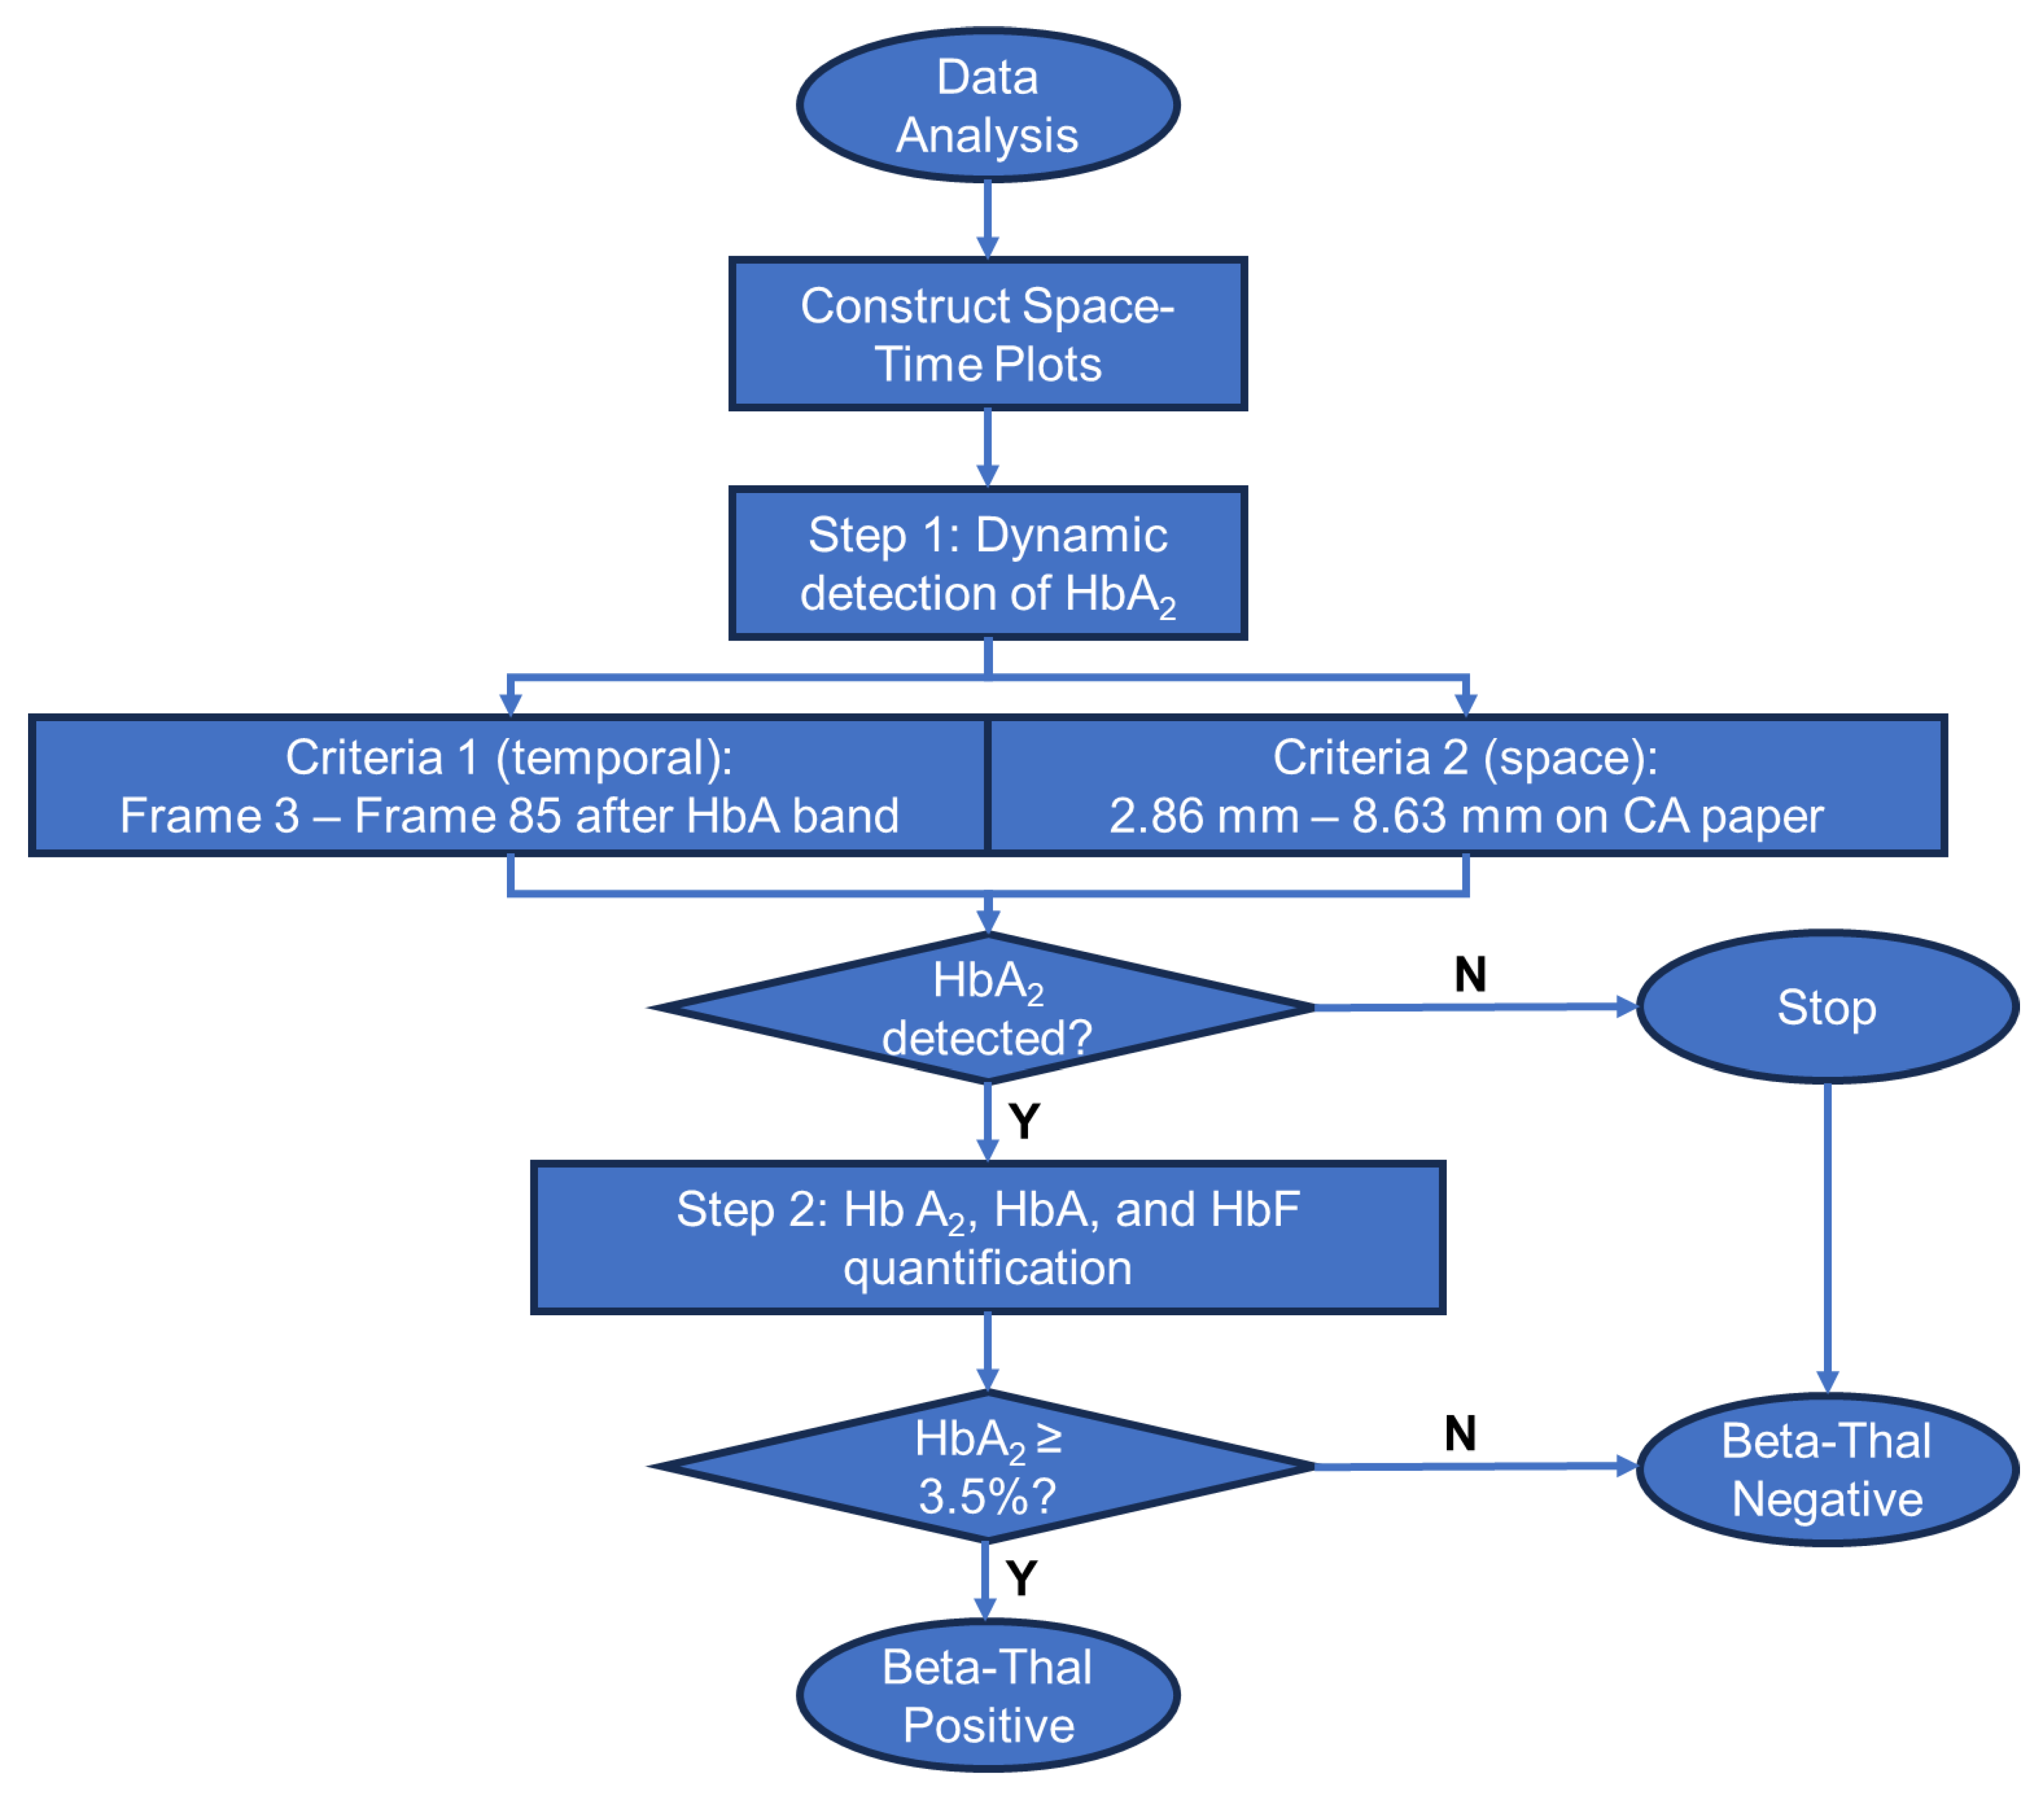
2.5. Gazelle-Multispectral Image Acquisition and Data Analysis

A customized image acquisition system and data analysis algorithm are integrated into the Gazelle system. The image acquisition system illuminates the microcartridge using a 410 nm wavelength ultra-violet (UV) LED. The imaging camera is positioned on the opposite side of the microcartridge from the UV light source and records electrophoresis progression at a rate of 0.25 frames per second. The GazelleTM image acquisition system allows us to acquire real-time images to track the separation and migration of hemoglobin bands on the cellulose acetate paper within the microcartridge (Figure 1B–D).
The GazelleTM data analysis algorithm automatically identifies β-Thal major, β-Thal intermedia, and β-Thal trait based on the Hb band migration pattern as described previously [30,34]. To put it briefly, the images acquired under 410 nm illumination are used to construct a space-time plot demonstrating the entire band electromigration process during each electrophoresis test (Figure 2B, x-axis: distance along the x-axis of the cellulose acetate paper; y-axis: time (from 0 to 480 s from top to bottom). Each point on the x-axis contains an averaged pixel intensity along the y-axis of the cellulose paper. β-thal detection requires the accurate quantification of HbA2. Our previously developed algorithms allowed for the detection and quantification of HbS, HbA, and HbF but not of HbA2; therefore, they are not suited for β-thal detection. Here, we developed a new algorithm for HbA2 quantification. This new algorithm includes two steps. In step one, the algorithm implements a matched filter in which it searches for the maximum signal-to-noise ratio of the imaged Hb band within a dynamic area in the space-time diagram (Figure 2B). The dynamic region is defined by two criteria used to track the sample loading position and HbA migration. Criterion one defines the time period (y-axis on the space-time diagram) within which the matched filter searches. This criterion is defined by how it starts upon 3–5 frames (0.25 fps, 12–20 s) after the HbA band and how it ends upon the 85th frame (340 s). Criterion two defines the position of the band along the length of the cellulose acetate paper (x-axis on the space-time diagram). This criterion is defined between column 73 (2.86 mm) and column 220 (8.63 mm) after the sample loading location. If the HbA2 signal is not identified in step one, then the algorithm stops. When HbA2 signals are identified in step one, the algorithm moves to step one. In step two, the algorithm calculates the amplitude of the HbA2 peak and the area underneath it using the electropherogram. The peak amplitude and area, along with the amplitudes of the non-A2 Hb variant peaks, are input into a regression algorithm that has been previously trained using HbA2 levels reported through HPLC. The algorithm then provides a quantitative estimation of HbA2. If the estimated HbA2 is above 3.5%, the algorithm will report a positive detection result for β-thal. At the end of each test, the Gazelle algorithm automatically reports the identified and quantified Hb variant results as well as the patient phenotype (Figure 2C).
In addition to HbA2, the data analysis algorithm also automatically quantifies the relative percentages of HbA and HbF alongside other types of hemoglobin as previously reported. Gazelle’s reported results on Hb variant identification and quantification were compared with the ones reported through HPLC using Pearson correlation and Bland–Altman analysis. Gazelle-Multispectral sensitivity and specificity in the identification of β-Thal major, β-Thal intermedia, and β-Thal trait were calculated for the study population compared with the HPLC-reported results (Figure 3).

3. Results

3.1. Test Population and Result Reporting

In this study, we conducted clinical testing across 372 subjects in the age range of 4–63 years at Apple Diagnostics lab in Ghatkopar, Mumbai, India, adhering to the local IRB-approved study protocol. Additionally, 32 blood samples were artificially prepared to mimic β-Thal major and β-Thal intermedia samples.
The Gazelle algorithm verifies the quality of test results according to the internally embedded data quality control (QC) method. According to the QC method, Gazelle-Multispectral organizes test results under one of the three categories of (1) “valid” test; (2) “uninterpretable” test; and (3) “inconclusive” test. The “valid”, “uninterpretable”, and “inconclusive” tests were defined according to the published recommendations in a previous publication [35] and the STARD guidelines [36]. If a test is performed as expected according to objective standards, the data analysis algorithm recognizes the test as a “valid” test and reports the test result. If a test includes poor migration of the blue control marker, an electrical connectivity issue, or faulty cartridges, the data analysis algorithm recognizes the test as an “uninterpretable” test. If a test is performed adequately according to an objective set of standards but has a quantification confidence value that is lower than the preset threshold value, then the data analysis algorithm recognizes the test as an “inconclusive” test. Reasons for “inconclusive” tests include the appearance of a Hb variant band or bands at or close to the borderline region between two adjacent detection windows. In this study, 394 out of 404 (97.5%) tests were recognized as “valid”, while 10 out of 404 (2.5%) tests were recognized as “inconclusive”.

3.2. Gazelle Result Interpretation Criteria

The Gazelle result interpretation criteria were established according to the clinical recommendations from key opinion leaders and using a large training dataset collected from field studies. The Gazelle β-Thal algorithm defines β-Thal major, β-Thal intermedia, and β-Thal trait according to the detected HbA, HbF, and HbA2 levels. The algorithm reads and interprets the data in the following sequences: (1) First, the algorithm checks if HbF ≥ 60% and HbA < 40% with no other hemoglobins over 10%. If true, the algorithm calls the sample β-Thal major or β-Thal intermedia. (2) When HbF < 60% and HbA ≥ 40% with no other hemoglobins over 10%, the algorithm measures the HbA2 level and then calls the sample β-Thal trait if HbA2 > 3.5%.

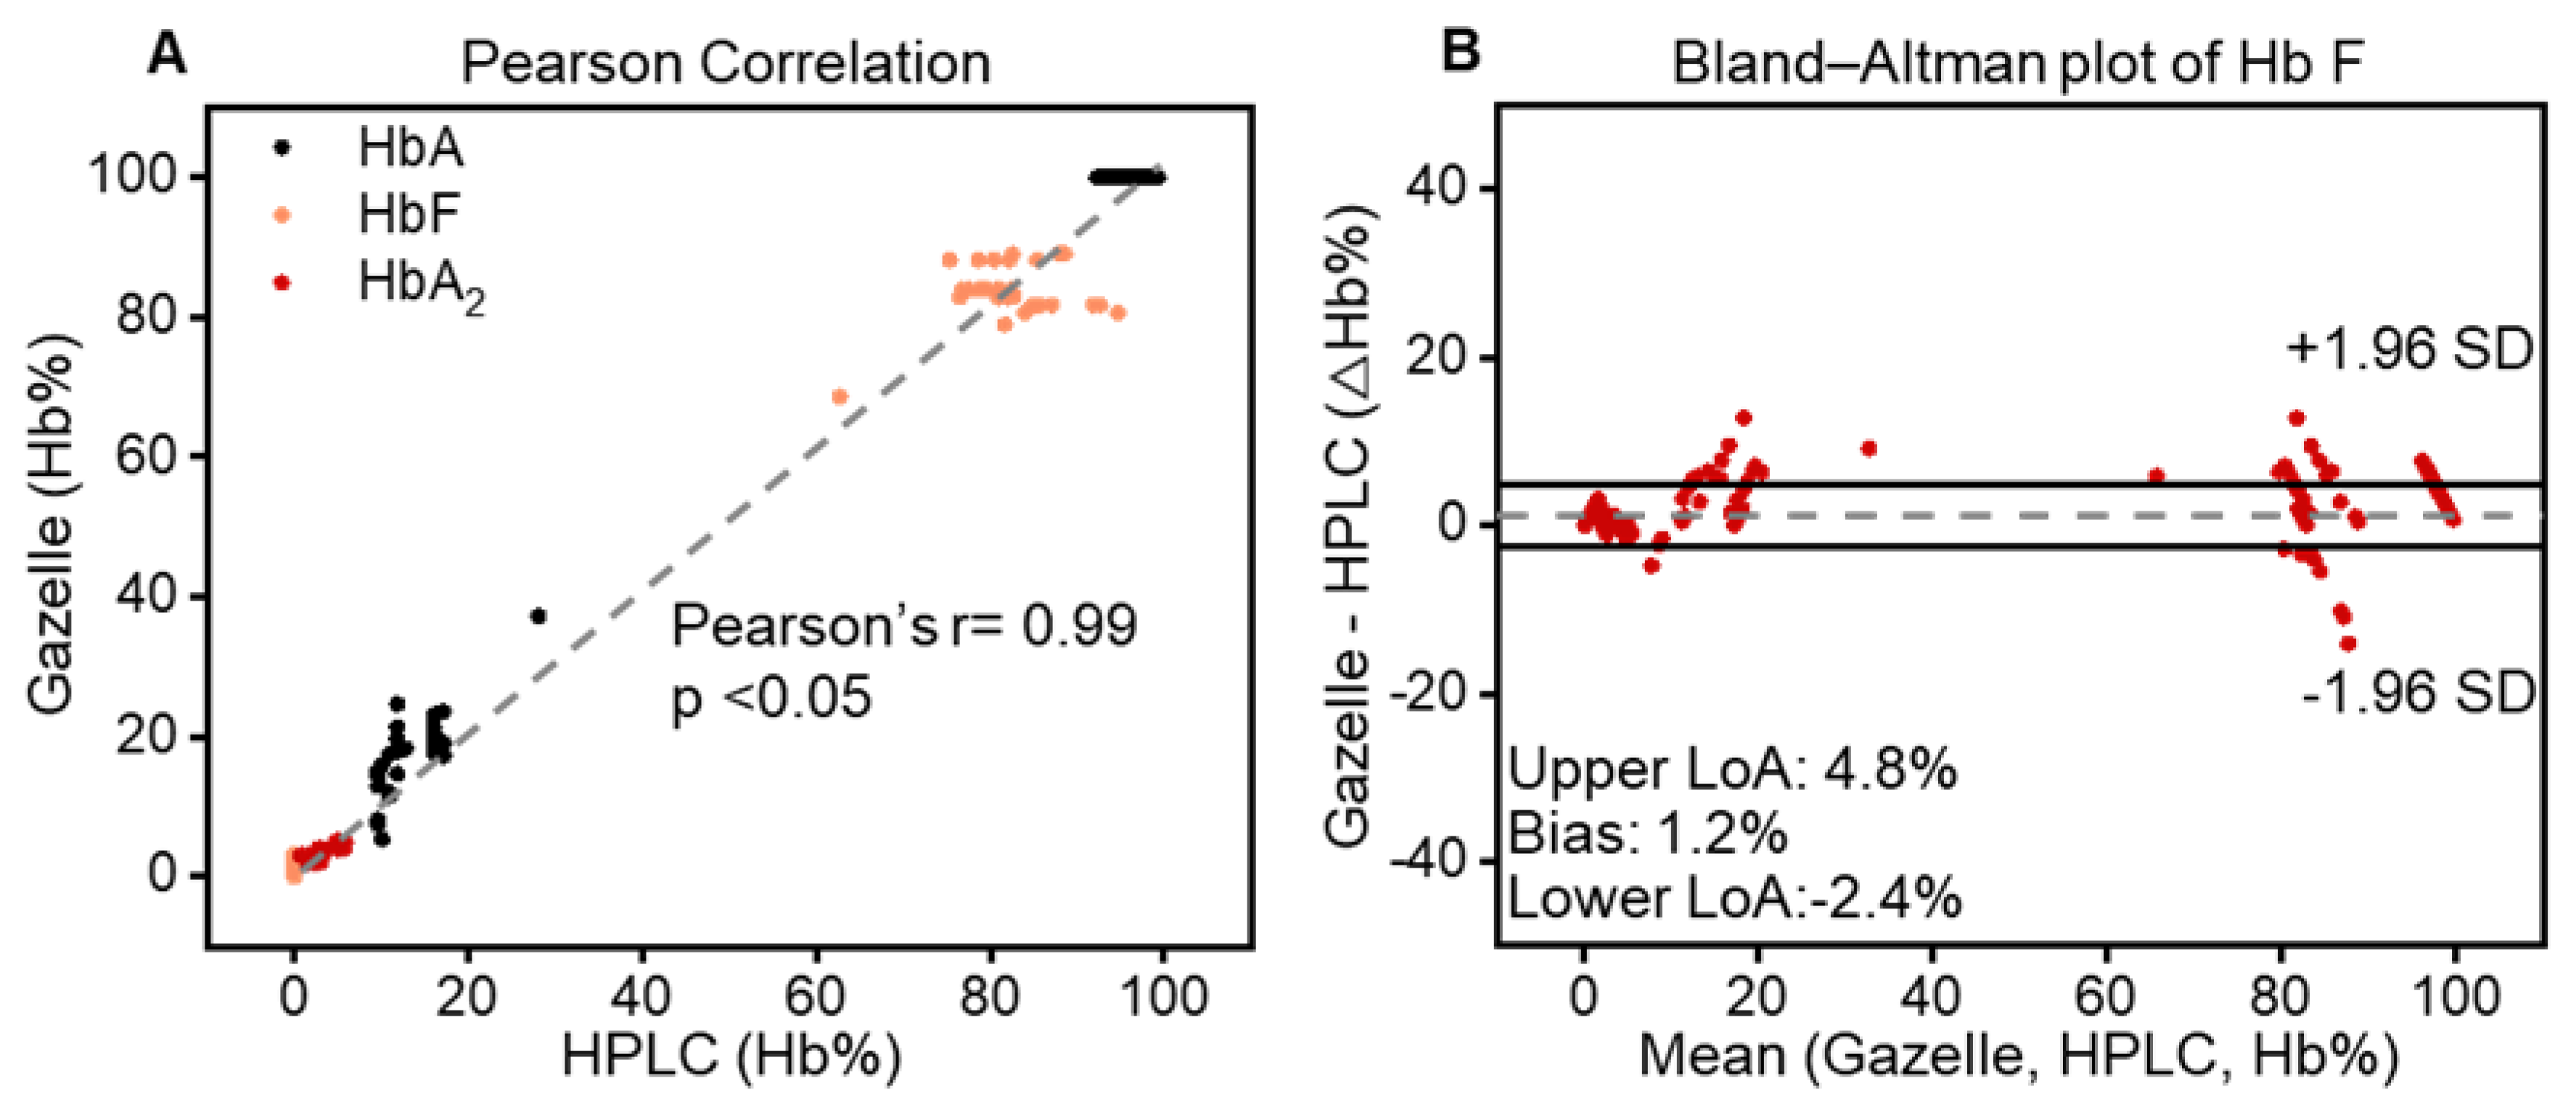
3.3. Gazelle-Multispectral Hb Variant Quantification Demonstrated a High Correlation with HPLC

Pearson correlation analysis and Bland–Altman analysis were performed on the 394 tests recognized as “valid”. The correlation plots include the Gazelle-determined Hb variant levels (y-axis) versus the Hb variant levels reported through the HPLC (x-axis), including HbA (black), HbF (orange), and HbA2 (red, Figure 4A). The Bland–Altman analysis includes the difference between the Gazelle-quantified levels of HbA, HbF, and HbA2 and the ones determined through HPLC (y-axis) over the entire range of Hb levels detected (x-axis, Figure 4B). The result from the Pearson correlation analysis was a Pearson correlation coefficient (PCC) of 0.99 for all three Hb variants. Bland–Altman analysis results indicate that Gazelle determines blood Hb variant levels with a mean bias of +1.2%, with upper and lower limits of agreement at 4.8% and −2.4%, respectively. Taken together, these results demonstrated a good agreement between the Hb variant levels determined using Gazelle and the ones reported through HPLC (Figure 4).

3.4. Sensitivity and Specificity of Gazelle β-Thalassemia Testing

In this clinical study, Gazelle test results included disease (β-Thal major and β-Thal intermedia), trait (β-Thal trait), and normal (categorized using data interpretation criteria described above). Comparing the results reported from the laboratory standard test HPLC, Gazelle identified subjects with the disease, β-Thal major and β-Thal intermedia, from normal subjects and subjects with the β-Thal trait with 100% sensitivity and specificity (Table 1), 6 normal subjects were identified as β-Thal trait. Sensitivity and specificity for identifying subjects with β-Thal trait from normal subjects (Trait vs. Normal) were 100% and 98.3%, respectively.

4. Conclusions

β-Thal major and β-Thal intermedia are characterized by an elevated fetal hemoglobin percentage (HbF%), and β-Thal trait is characterized by a high HbA% with increased levels of HbA2% [14]. Proper and timely management of β-Thal relies on early and accurate detection. The quantification of HbA and key Hb variants, including HbF and HbA2, are essential for the accurate detection of β-Thal. The previous Gazelle system has demonstrated its utility in detecting anemia [34] and hemoglobinopathies including SCD, sickle cell trait, Hemoglobin C disorder, and Hemoglobin E Disorder [28,29,30]. Here, we report the updated version of Gazelle that enables, for the first time, POC detection of β-Thal.
In this clinical study conducted among 404 subjects in Ghatkopar, Mumbai, India, Gazelle demonstrated 100% sensitivity and specificity for identifying β-Thal major/intermedia vs. healthy subjects as well as subjects with β-Thal major/intermedia vs. β-Thal trait. Additionally, Gazelle demonstrated 100% sensitivity and 98.3% specificity for identifying β-Thal trait vs. healthy subjects. A recommended practice in Hb testing is that all positive test results are confirmed through a secondary method prior to final diagnostic decision making and treatment initiation [37]. Therefore, all disease-positive tests would likely result in a secondary confirmatory test that should eliminate potential false positives if there are any.
In summary, Gazelle provides an affordable and rapid POC solution for detecting β-Thal for the first time. The Gazelle reader provides (1) animated on-screen instructions with step-by-step guidance for test operation procedures to minimize user errors and (2) a data analysis algorithm that automatically reports Hb variant levels and the predicted disease status. Overall, the results reported in this study suggest that Gazelle is potentially suitable for large-scale β-Thal testing in low-resource regions where the prevalence of β-Thal is high.

Author Contributions

R.A. and A.A. contributed to the proof-of-concept experiments and initial development. P.T., S.N. and A.M. helped with the planning and execution of clinical testing, including human subject research protocol development, subject recruitment, blood sample collection, and testing. R.A. and A.A. performed the data analysis and prepared the tables, figures, figure captions, and supplementary information. R.A. drafted the manuscript. R.A., A.A., P.T., S.N., A.M. and U.A.G. reviewed and edited the manuscript. All authors have read and agreed to the published version of the manuscript.

Funding

Authors acknowledge the National Heart, Lung, and Blood Institute Small Business Innovation Research Program (R44HL140739, R41HL151015), the National Center for Complementary & Integrative Health (NCCIH) (1U54HL143541), the National Institute of Diabetes and Digestive and Kidney Diseases Small Business Innovation Research Program (R41DK119048, R42DK119048), and the NHLBI (R01HL133574 and K25HL159358).

Institutional Review Board Statement

This study was conducted in accordance with the Declaration of Helsinki, and according to the IRB-approved study protocol (IEC@IISS (International Institute of Sleep Sciences IRB number); Reg No.: ECR/177/Indt/MH-2014/RR-19).

Informed Consent Statement

Informed consent was obtained from all subjects involved in the study.

Data Availability Statement

All reasonable requests for materials and data will be fulfilled by the corresponding author of this publication.

Conflicts of Interest

RA, UAG, and Case Western Reserve University have financial interests in Hemex Health Inc. UAG and Case Western Reserve University have financial interests in BioChip Labs Inc. UAG and Case Western Reserve University have financial interests in Xatek Inc. UAG has financial interests in DxNow Inc. Financial interests include licensed intellectual property, stock ownership, research funding, employment, and consulting. Hemex Health Inc. offers point-of-care diagnostics for hemoglobin disorders, anemia, and malaria. BioChip Labs Inc. offers commercial clinical microfluidic biomarker assays for inherited or acquired blood disorders. Xatek Inc. offers point-of-care global assays to evaluate the hemostatic process. DxNow Inc. offers microfluidic and bio-imaging technologies for in vitro fertilization, forensics, and diagnostics. The competing interests of Case Western Reserve University employees are overseen and managed through the conflict of interests committee according to a conflict-of-interest management plan. This article’s contents are solely the responsibility of the authors and do not necessarily represent the official views of the National Institutes of Health.

References

  1. WHO. Newborn Health in the Western Pacific. 2022. Available online: https://www.who.int/westernpacific/health-topics/newborn-health (accessed on 11 January 2022).
  2. Taher, A.T.; Musallam, K.M.; Cappellini, M.D. β-Thalassemias. N. Engl. J. Med. 2021, 384, 727–743. [Google Scholar] [CrossRef]
  3. Modell, B.; Darlison, M. Global epidemiology of haemoglobin disorders and derived service indicators. Bull. World Health Organ. 2008, 86, 480–487. [Google Scholar] [CrossRef]
  4. Somervaille, T. Disorders of Hemoglobin: Genetics, Pathophysiology, and Clinical Management. J. R. Soc. Med. 2001, 94, 602–603. [Google Scholar] [CrossRef]
  5. Bender, M.A.; Hulihan, M.; Dorley, M.C.; del Pilar Aguinaga, M.; Ojodu, J.; Yusuf, C. Newborn Screening Practices for Beta-Thalassemia in the United States. Int. J. Neonatal Screen. 2021, 7, 83. [Google Scholar] [CrossRef]
  6. Cao, A. Carrier screening and genetic counselling in beta-thalassemia. Int. J. Hematol. 2002, 76 (Suppl. S2), 105–113. [Google Scholar] [CrossRef] [PubMed]
  7. Bhattacharya, S.; Thiyagarajan, A.; Sharma, N.; Srivastava, A.; Dhar, D.K. Need for a universal thalassemia screening programme in India? A public health perspective. J. Fam. Med. Prim. Care 2019, 8, 1528–1532. [Google Scholar]
  8. Taher, A.T.; Bou-Fakhredin, R.; Kattamis, A.; Viprakasit, V.; Cappellini, M.D. Improving outcomes and quality of life for patients with transfusion-dependent β-thalassemia: Recommendations for best clinical practice and the use of novel treatment strategies. Expert Rev. Hematol. 2021, 14, 897–909. [Google Scholar] [CrossRef] [PubMed]
  9. Arif, F.; Fayyaz, J.; Hamid, A. Awareness among parents of children with thalassemia major. J. Pak. Med. Assoc. 2008, 58, 621–624. [Google Scholar] [PubMed]
  10. Kattamis, A.; Forni, G.L.; Aydinok, Y.; Viprakasit, V. Changing patterns in the epidemiology of β-thalassemia. Eur. J. Haematol. 2020, 105, 692–703. [Google Scholar] [CrossRef] [PubMed]
  11. Danjou, F.; Anni, F.; Galanello, R. Beta-thalassemia: From genotype to phenotype. Haematologica 2011, 96, 1573–1575. [Google Scholar] [CrossRef] [PubMed]
  12. Origa, R. Beta-Thalassemia; University of Washington: Seattle, WA, USA, 1993. [Google Scholar]
  13. Origa, R. β-Thalassemia. Genet. Med. 2017, 19, 609–619. [Google Scholar] [CrossRef]
  14. Rund, D.; Rachmilewitz, E. Beta-thalassemia. N. Engl. J. Med. 2005, 353, 1135–1146. [Google Scholar] [CrossRef] [PubMed]
  15. Kawooya, I.; Kayongo, E.; Munube, D.; Mijumbi-Deve, R.; Elliott, S.; Vandermeer, B.; Sewankambo, N. Point-of-care diagnostic tests for sickle cell disease. Cochrane Database Syst. Rev. 2022, 2022, CD014584. [Google Scholar] [CrossRef]
  16. Clemente, F.; Antonacci, A.; Giardi, M.T.; Frisulli, V.; Tambaro, F.P.; Scognamiglio, V. Last Trends in Point-of-Care (POC) Diagnostics for the Management of Hematological Indices in Home Care Patients. Biosensors 2023, 13, 345. [Google Scholar] [CrossRef] [PubMed]
  17. Bond, M.; Hunt, B.; Flynn, B.; Huhtinen, P.; Ware, R.; Richards-Kortum, R. Towards a point-of-care strip test to diagnose sickle cell anemia. PLoS ONE 2017, 12, e0177732. [Google Scholar] [CrossRef] [PubMed]
  18. McGann, P.T.; Hoppe, C. The pressing need for point-of-care diagnostics for sickle cell disease: A review of current and future technologies. Blood Cells Mol. Dis. 2017, 67, 104–113. [Google Scholar] [CrossRef] [PubMed]
  19. Arishi, W.A.; Alhadrami, H.A.; Zourob, M. Techniques for the Detection of Sickle Cell Disease: A Review. Micromachines 2021, 12, 519. [Google Scholar] [CrossRef]
  20. Ilyas, S.; Simonson, A.E.; Asghar, W. Emerging point-of-care technologies for sickle cell disease diagnostics. Clin. Chim. Acta 2020, 501, 85–91. [Google Scholar] [CrossRef] [PubMed]
  21. Jaja, C.; Edem-Hotah, J.; Shepherd, J.; Patel, N.; Xu, H.; Gibson, R.W. Analytic Characteristics and Performance of Novel Immunoassay Point-of-Care Tests for Early Diagnosis of Sickle Cell Disease a Systematic Review. Point Care 2020, 19, 84–94. [Google Scholar] [CrossRef]
  22. Canning, D.M.; Huntsman, R.G. An assessment of Sickledex as an alternative to the sickling test. J. Clin. Pathol. 1970, 23, 736–737. [Google Scholar] [CrossRef]
  23. Steele, C.; Sinski, A.; Asibey, J.; Hardy-Dessources, M.D.; Elana, G.; Brennan, C. Point-of-care screening for sickle cell disease in low-resource settings: A multi-center evaluation of HemoTypeSC, a novel rapid test. Am. J. Hematol. 2019, 94, 39–45. [Google Scholar] [CrossRef] [PubMed]
  24. Kanter, J.; Telen, M.J.; Hoppe, C.; Roberts, C.L.; Kim, J.S.; Yang, X. Validation of a novel point of care testing device for sickle cell disease. BMC Med. 2015, 13, 225. [Google Scholar] [CrossRef] [PubMed]
  25. WHO World Health Organization. First WHO Model List of Essential In Vitro Diagnostics; WHO Technical Report Series, No. 1017; WHO: Geneva, Switzerland, 2019. [Google Scholar]
  26. An, R.; Huang, Y.; Man, Y.; Valentine, R.W.; Kucukal, E.; Goreke, U.; Sekyonda, Z.; Piccone, C.; Owusu-Ansah, A.; Ahuja, S.; et al. Emerging point-of-care technologies for anemia detection. Lab A Chip 2021, 21, 1843–1865. [Google Scholar] [CrossRef] [PubMed]
  27. WHO. Second WHO Model List of Essential In Vitro Diagnostics; WHO/MVP/EMP/2019.05; WHO: Geneva, Switzerland, 2019. [Google Scholar]
  28. Qua, K.; Swiatkowski, S.M.; Gurkan, U.A.; Pelfrey, C.M. A retrospective case study of successful translational research: Gazelle Hb variant point-of-care diagnostic device for sickle cell disease. J. Clin. Transl. Sci. 2021, 5, e207. [Google Scholar] [CrossRef] [PubMed]
  29. An, R.; Hasan, M.N.; Man, Y.; Gurkan, U.A. Integrated Point-of-Care Device for Anemia Detection and Hemoglobin Variant Identification. In Proceedings of the 2019 IEEE Healthcare Innovations and Point of Care Technologies, (HI-POCT), Bethesda, ML, USA, 20–22 November 2019. [Google Scholar]
  30. Hasan, M.N.; Fraiwan, A.; An, R.; Alapan, Y.; Ung, R.; Akkus, A.; Xu, J.Z.; Rezac, A.J.; Kocmich, N.J.; Creary, M.S.; et al. Paper-based microchip electrophoresis for point-of-care hemoglobin testing. Analyst 2020, 145, 2525–2542. [Google Scholar] [CrossRef]
  31. Hasan, M.N.; An, R.; Akkus, A.; Akkaynak, D.; Minerick, A.R.; Kharangate, C.R.; Gurkan, U.A. Dynamic pH and Thermal Analysis of Paper-Based Microchip Electrophoresis. Micromachines 2021, 12, 1433. [Google Scholar] [CrossRef]
  32. An, R.; Huang, Y.; Rocheleau, A.; Avanaki, A.; Thota, P.; Zhang, Q.; Man, Y.; Sekyonda, Z.; Segbefia, C.I.; Dei-Adomakoh, Y.; et al. Multispectral imaging for MicroChip electrophoresis enables point-of-care newborn hemoglobin variant screening. Heliyon 2022, 8, e11778. [Google Scholar] [CrossRef]
  33. Centers for Disease Control and Prevention. Hemoglobinopathies: Current Practices for Screening, Confirmation and Follow-Up; Association of Public Health Laboratories: Silver Spring, MD, USA, 2015.
  34. An, R.; Man, Y.; Iram, S.; Kucukal, E.; Hasan, M.N.; Huang, Y.; Goreke, U.; Bode, A.; Hill, A.; Cheng, K.; et al. Point-of-care microchip electrophoresis for integrated anemia and hemoglobin variant testing. Lab A Chip 2021, 21, 3863–3875. [Google Scholar] [CrossRef]
  35. Shinkins, B.; Thompson, M.; Mallett, S.; Perera, R. Diagnostic accuracy studies: How to report and analyse inconclusive test results. BMJ Br. Med. J. 2013, 346, f2778. [Google Scholar] [CrossRef]
  36. Bossuyt, P.M.; Reitsma, J.B.; E Bruns, D.; A Gatsonis, C.; Glasziou, P.P.; Irwig, L.; Lijmer, J.G.; Moher, D.; Rennie, D.; de Vet, H.C.; et al. STARD 2015: An Updated List of Essential Items for Reporting Diagnostic Accuracy Studies. Clin. Chem. 2015, 61, 1446–1452. [Google Scholar] [CrossRef]
  37. Ryan, K.; Bain, B.J.; Worthington, D.; James, J.; Plews, D.; Mason, A.; Roper, D.; Rees, D.C.; De La Salle, B.; Streetly, A.; et al. Significant haemoglobinopathies: Guidelines for screening and diagnosis. Br. J. Haematol. 2010, 149, 35–49. [Google Scholar] [CrossRef] [PubMed]
Figure 1. Gazelle paper-based microchip electrophoresis. (A) Gazelle paper-based microchip electrophoresis using a disposable cartridge (red boxed area, (B)) at the point of need. (C) The microcartridge is composed of a cartridge top, cellulose acetate paper, two blotting pads, a pair of stainless steel electrodes, and a cartridge bottom. (D) A detailed schematic illustrating the separation process of hemoglobin variants using the Gazelle system. Initially, lysed whole blood (red color), marked with a control blue dye (blue color) for visualization, is applied to the cellulose acetate paper housed within the microcartridge. Following this, an electric field is applied, thereby facilitating the separation of different hemoglobin variants based on their distinct electrophoretic mobilities.
Biosensors 14 00083 g001
Figure 2. Gazelle tests for screening beta-thalassemia. (A) GazelleTM allows for real-time image acquisition for tracking hemoglobin migration and separation. Left: example of a Gazelle test of a blood sample with a low Hb A2 level. Right: example of a Gazelle test of a blood sample with a high Hb A2 level. (B) Applying an internally integrated data analysis algorithm, the generated space-time plots based on the captured images are used for the identification and quantification of Hb variants in real time. (C) At the end of each test, the Gazelle algorithm automatically reports the identified and quantified Hb variant results as well as the patient phenotype.
Biosensors 14 00083 g002
Figure 3. Process flow diagram of the GazelleTM data analysis algorithm for beta-thalassemia detection and quantification.
Biosensors 14 00083 g003
Figure 4. Gazelle accurately identifies and quantifies HbA, HbF, and HbA2. (A) Pearson correlation showed that Gazelle identified and quantified HbA (black), HbF (orange), and HbA2 (red), which demonstrated a strong correlation with the results reported through laboratory gold standard HPLC testing [33] at a Person coefficient correlation (PCC) of 0.99, p < 0.05). (B) Bland–Altman analysis demonstrated that Gazelle tests had an overall mean bias of 1.2% (doted gray line), with upper and lower limits of agreement (LoA) at 4.8% and −2.4%, respectively).
Biosensors 14 00083 g004
Table 1. Gazelle-Multispectral screening sensitivity, specificity, positive predictive value (PPV), and negative predictive value (NPV) in comparison with reference standard method a.
Disease vs. Normal NormalDisease vs. TraitTrait vs. Normal
True positive, TP323218
True negative, TN34418338
False Positive, FP006 b
False negative, FN000
Sensitivity, TP/(TP + FN)100.0%100.0%100%
Specificity, TN/(TN + FP)100.0%100.0%98.3%
a 394 “valid” tests. Seven tests were recognized as “inconclusive” due to a failed quality control test; two tests were recognized as “inconclusive” due to an unknown result reported through HPLC; and one test was recognized as “inconclusive” due to an unknown result reported through Gazelle. “Inconclusive” tests did not generate a result that could be included in the sensitivity and specificity analysis [35,36]. b 6 normal subjects with HbA were recognized as having β-Thal trait.
Disclaimer/Publisher’s Note: The statements, opinions and data contained in all publications are solely those of the individual author(s) and contributor(s) and not of MDPI and/or the editor(s). MDPI and/or the editor(s) disclaim responsibility for any injury to people or property resulting from any ideas, methods, instructions or products referred to in the content.

