Article

Plasmonic Biosensor on the End-Facet of a Dual-Core Single-Mode Optical Fiber

by
Fatemeh Fouladi Mahani
1,
Arash Mokhtari
1 and
Pierre Berini
2,*
1
Optical and RF Communication Systems (ORCS) Lab, Electrical Engineering Department, Shahid Bahonar University of Kerman, Kerman 7616913439, Iran
2
Department of Physics, School of Electrical Engineering and Computer Science, University of Ottawa, Ottawa, ON K1N 6N5, Canada
*
Author to whom correspondence should be addressed.
Biosensors 2023, 13(5), 558; https://doi.org/10.3390/bios13050558
Submission received: 22 April 2023 / Revised: 10 May 2023 / Accepted: 17 May 2023 / Published: 19 May 2023
(This article belongs to the Special Issue Optical Biosensors for Health, Food and Environment (Bio)markers)

Abstract

:
Optical biosensors target widespread applications, such as drug discovery, medical diagnostics, food quality control, and environmental monitoring. Here, we propose a novel plasmonic biosensor on the end-facet of a dual-core single-mode optical fiber. The concept uses slanted metal gratings on each core, interconnected by a metal stripe biosensing waveguide to couple the cores via the propagation of surface plasmons along the end facet. The scheme enables operation in transmission (core-to-core), thereby eliminating the need to separate the reflected light from the incident light. Importantly, this simplifies and reduces the cost of the interrogation setup because a broadband polarization-maintaining optical fiber coupler or circulator is not required. The proposed biosensor enables remote sensing because the interrogation optoelectronics can be located remotely. In vivo biosensing and brain studies are also enabled because the end-facet can be inserted into a living body, once properly packaged. It can also be dipped into a vial, precluding the need for microfluidic channels or pumps. Bulk sensitivities of 880 nm/RIU and surface sensitivities of 1 nm/nm are predicted under spectral interrogation using cross-correlation analysis. The configuration is embodied by robust and experimentally realizable designs that can be fabricated, e.g., using metal evaporation and focused ion beam milling.

1. Introduction

Optical fiber biosensors have found widespread application in many fields, such as drug discovery, medical diagnostics, food quality control, environmental monitoring, and agriculture [1]. Increasing attention has been drawn towards revolutionizing health care by designing biosensors with robust, fast, and real-time detection capabilities [2]. Exploiting the high surface sensitivity of surface plasmons on planar or resonant nanostructures to sense the binding interaction between a bio-specific pair has enabled many biosensing applications [3]. The most common plasmonic approach uses a Au film deposited on a prism (Kretschmann–Raether configuration) in contact with the sensing fluid, where the angle of surface plasmon excitation is monitored by measuring a dip in the reflectance—such systems are widely referred to as surface plasmon resonance (SPR) systems [4]. Alternatively, the use of optical fibers enables lab-on-a-fiber (LOF) platforms, which benefit from the superior waveguiding ability of optical fibers, allowing optoelectronic interrogation systems to be efficiently coupled and located remotely [5]. In this regard, various optical-fiber-based sensors have been presented by integrating different functional nanostructures within or around the holey structures of microstructured optical fibers [6], on the optical fiber’s outer curved surfaces (e.g., by means of tapered/unclad fibers [7] or diffraction gratings inscribed in the fiber core [8]), or on the tip of optical fibers [9]. Integrating plasmonic nanostructures on the tip (end-facet) of an optical fiber enables highly sensitive label-free biosensors that are robust, lightweight, and miniaturized [10].
Biosensors on the tip of an optical fiber usually operate in reflection [11]. For instance, in vivo monitoring of target analytes requires the insertion of the fiber end-facet into a living organism (as in an endoscope) such that the transmitted light is not accessible, which implies the need for interrogation in reflection [12]. Consequently, separating the reflected light from the incident light at the input is required. Furthermore, in the case of spectral interrogation, a tunable laser with a power sensor or a broadband optical source with a spectrometer is needed. Thus, separation of the reflected light from the incident light over a broad spectral range, usually while preserving polarization, is required. This is not trivial, as it requires the interrogation system to include high-cost ancillary optical components, such as a broadband polarization-maintaining optical fiber coupler or circulator.
A dual-core single-mode optical fiber (DCSMF), with a biosensor structure formed on its end-facet that also couples the cores, could overcome this challenge [13]. Employing a DCSMF facilitates optical interrogation as one core can be used to launch the incident light to the fiber tip, and the other core can be used to receive the light emerging from the biosensor. Such a system operates in transmission, which is advantageous, as it simplifies the interrogation setup, especially for polarization-resolved spectral interrogation. The idea was explored in a previous work, where the biosensor consisted of a Si3N4 grating-coupled Fabry–Pérot waveguide resonator, in which spectral interrogation in transmission was verified, but the design produced a bulk sensitivity of only 50–100 nm/RIU [13].
Here, we exploit surface plasmon polaritons (SPPs) in a high-sensitivity biosensor located on the end-facet of a DCSMF. This configuration requires coupling of normally incident light from the first core of the fiber to SPPs propagating along a metal stripe sensing waveguide connected to the second core ~40 µm away, then coupling SPPs to normally propagating light along the second core. Both couplers should be unidirectional, if possible, to improve the power efficiency. Furthermore, high sensitivity requires that the SPPs interact with the analyte, which implies that they should be excited and localized along the top metal surface, i.e., along the metal–analyte interface.
The challenge of efficient out-of-plane unidirectional coupling to SPPs has stimulated extensive studies. The structures used can be categorized mainly into slits [14], grooves [15], slit–grooves [16], ridge (grating) couplers [17], Bragg mirrors [18], and nano-antennas [19]. Unidirectional coupling requires that, for example, grating couplers have an asymmetric profile for perpendicular illumination [20,21].
In this paper, we propose a novel high-sensitivity plasmonic biosensor on the end-facet of a DCSMF. The structure comprises slanted metal gratings for unidirectional coupling and a metal sensing waveguide interconnecting the cores. Section 2 describes the concept as well as the proposed interrogation setup. Section 3 explains the design approach on the basis of intuitive vector geometry accompanied by modal calculations to attain the design parameters. Section 4 discusses the prospective fabrication steps and the design robustness relative to fabrication imperfections. Section 5 presents sensitivity computations, relying on cross-correlation analysis of the computed transmittance curves, aiming to evaluate the behavior of the biosensor. Concluding remarks are provided in Section 6.

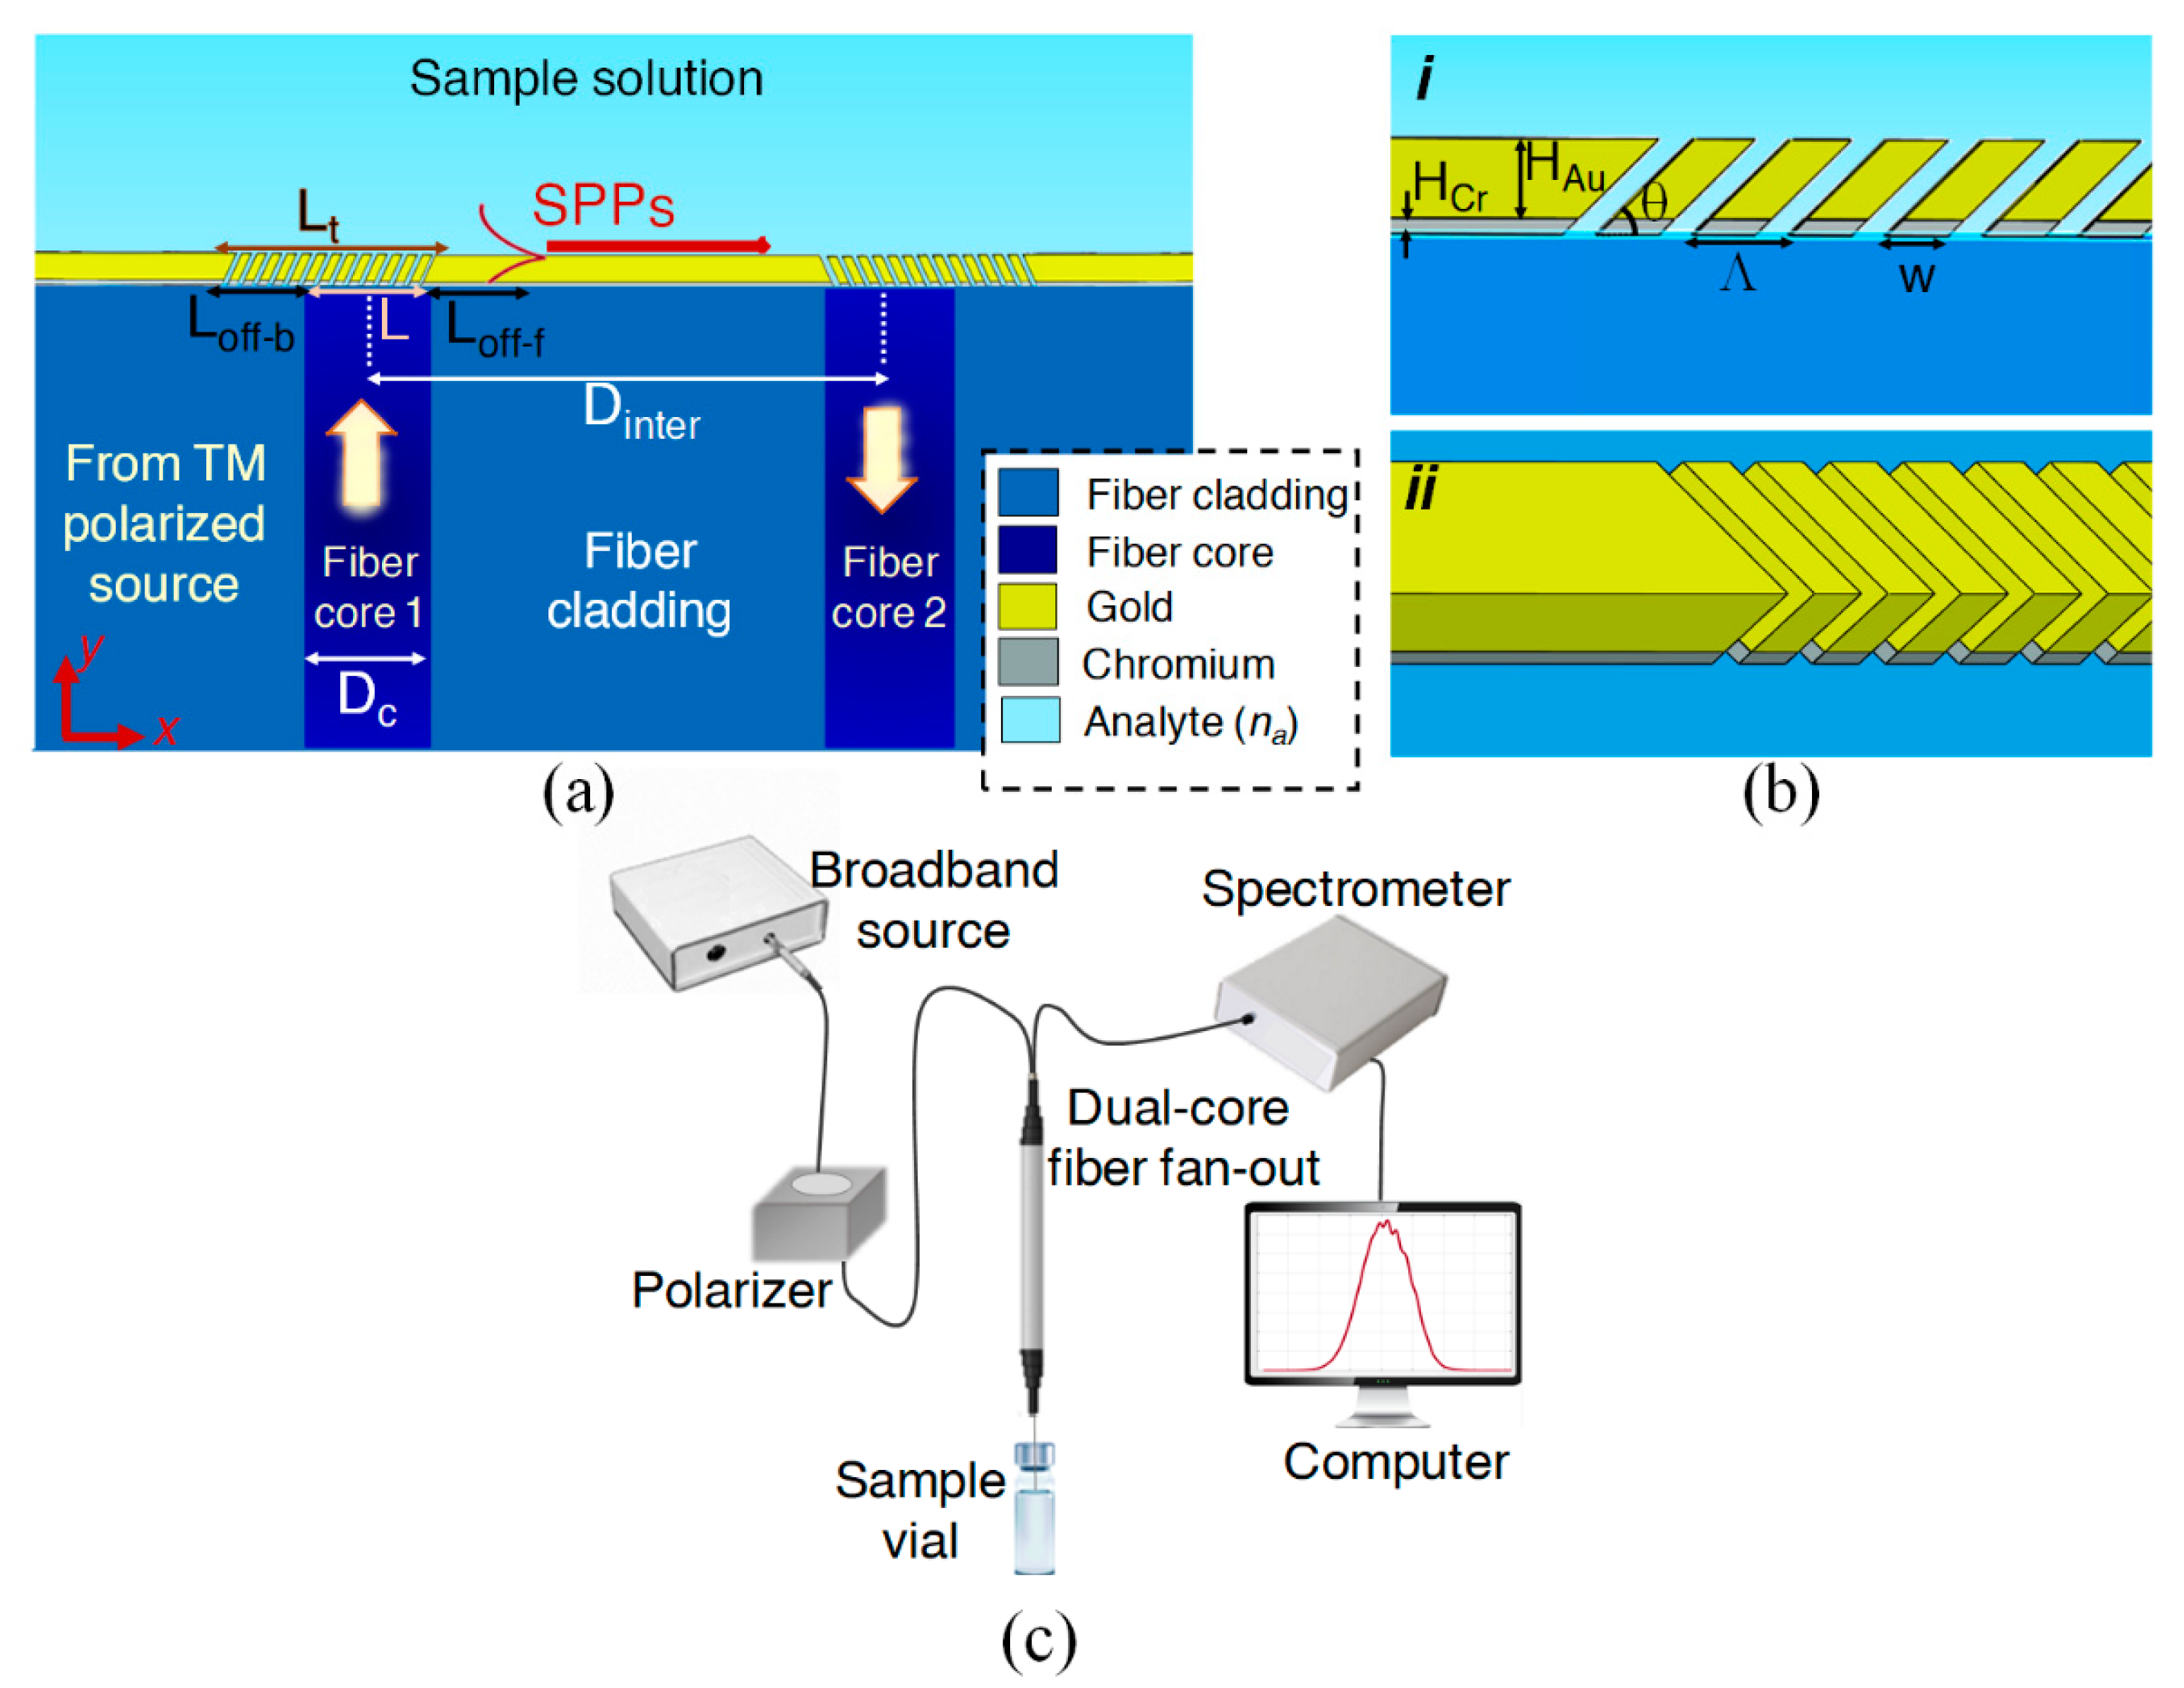
2. Sensor Structure and Proposed Interrogation Setup

A cross-sectional view of the proposed biosensor on the end-facet of a DCSMF is illustrated in Figure 1a, showing Au/Cr plasmonic slanted grating couplers (PSGCs) aligned with the cores, interconnected by a Au/Cr biosensing waveguide. Figure 1b provides sketches in expanded views of the input PSGC, defining important design dimensions. Transverse magnetic (TM)-polarized light is coupled to the input of the first core, emerging on the first PSGC, which couples the light to SPPs propagating along the top surface of the biosensing waveguide. The second PSGC then couples the SPPs into light propagating along the second core, emerging therefrom for detection. Au is used as the main material for the biosensor design since it is stable and easy to functionalize for a target biosensing application. Using a relatively thick Cr layer at the bottom of the Au layer promotes adhesion to the end-facet while eliminating undesired SPPs that may couple and propagate along the bottom of the biosensing waveguide [22].
Operating with a single-mode optical fiber is advantageous over a multi-mode one since the field distribution in the latter is much more complex and very sensitive to even weak external perturbations, such as displacement [23]. Here, the dimensions of a commercial DCSMF are assumed, for which low-loss fiber fan-outs are available [24]. The biosensor is designed to work at the operating wavelength of λ0 = 1.31 μm, for which high-quality and low-cost optoelectronics are available and because the absorption of water is small at this wavelength (biosensing fluids are mostly aqueous in nature) [25].
Although our design remains theoretical, to better understand the sensor operation, we show a sketch of the proposed interrogation setup in Figure 1c. A broadband source can be employed to excite the first core. Light emerging from the source is transmitted through a polarizer, ensuring operation with TM-polarized light, and a spectrometer is employed to capture the output power of the second core in a transmission arrangement. A polarization-maintaining DCSMF could be used, if available, to further simplify the setup. The biosensing sample is assumed to be in a vial, and the DCSMF end-facet bearing the biosensor is dipped therein, precluding the need for microfluidic channels or pumps. Properly packaged, the scheme has the potential for in vivo biosensing or brain studies.

3. Theoretical Design

We use finite element method (FEM) simulations in 2D with boundary mode analysis (BMA) to analyze the device and accurately investigate the sensor behavior [26].
The main challenge in the design of the biosensor is achieving an appropriate scheme for unidirectional coupling of the input TM0 mode (propagation constant β1) in the first core to SPPs propagating along the top of the biosensing waveguide (propagation constant βSPP), followed by unidirectional coupling of the SPPs to the output TM0 mode (propagation constant β2) in the second core. The signal path is sketched in Figure 2a.
As mentioned earlier, the operating wavelength selected is 1.31 μm. The physical core/cladding dimensions of the optical fiber are set on the basis of a commercial DCSMF for which high-precision low-loss fiber fan-outs are available [24]. The fiber core and cladding diameters are 8 μm and 125 μm, respectively [24], and their refractive indices are 1.457 and 1.453, respectively, for single-mode operation near 1.31 μm. The length of the PSGCs should match the mode size of the fiber cores. So, very short PSGCs having a strong index modulation are required [27]. For this purpose, we propose using Au/Cr PSGCs comprising parallelogram-shaped ridges. To model the end-facet dipped into a sensing solution, we assume a refractive index (RI) of 1.333 for the region above the PSGCs and the biosensing waveguide (na = 1.333), which is typical for aqueous buffer solutions near our operating wavelength range. The sensing solution is assumed to infiltrate the slits of the PSGCs, ensuring a high material contrast with the metal ridges.
Contrary to low-contrast gratings for which the grating design can be determined from the phase-matching condition, the design of high-contrast grating couplers is more complex, as the coupling efficiency and (undesired) scattering into radiative modes depend on parameters such as slant angle, fill factor, and pitch. To overcome this challenge, we propose a straightforward but efficient design approach derived from an intuitive vector geometry accompanied by 1D modal calculations to attain initial design parameters, following a similar method adopted to design Si3N4 slanted gratings [13]. It will be shown that the initial design parameters are in good agreement with the optimized parameters obtained through numerical modeling.
Figure 2a outlines the proposed design steps. We design the PSGC on the first core, then use the same grating mirrored on the second core. The DCSMF is single-mode, so TM0-to-TM0 coupling between the cores is taken to define the core-to-core coupling efficiency. In the first step, we calculate the effective index and the propagation constant of the TM0 mode in the core by modeling the fiber as a slab waveguide, as shown in Part i of Figure 2b, yielding neff-1 = 1.4548 and β1 = 6.9778 × 10⁶ rad/m.
For the biosensing waveguide, we assume a 300 nm thick Au layer on a 50 nm Cr layer such that SPPs may propagate along the top Au–solution interface only (the bottom Cr-SiO2 interface does not effectively support SPPs) while also ensuring fabrication robustness, as discussed in the following section. The optical constants of Au and Cr are taken from experimental data [28,29]. The SPP mode on the top Au surface is also determined from modal analysis, as shown in Part ii of Figure 2b, resulting in neff-SPP = 1.3482 − 0.0013821i and βSPP = 6.4664 × 10⁶ − 6629.1i rad/m. We use only the real parts of neff-SPP and βSPP in our coupling estimates. The Au film is thick enough for the SPP mode to be taken as that of a single metal–dielectric interface, with its complex effective index given by the SPP dispersion formula [30]:
n e f f S P P = ε r , a ε r , m ε r , a + ε r , m
where εr,a = na2, and εr,m is taken as the relative permittivity of Au. This formula yields the same result as the modal calculation described above.
As shown in the simple vector diagram of Figure 2a, the wavevector of the first PSGC, KPSGC 1, which is perpendicular to the slanted ridges [31], can be approximated by the vector difference between the propagation constant of the TM0 mode in the fiber core and the propagation constant of the SPP excitation (β1 and βSPP, respectively). Thus, using the ensuing geometric equations, the PSGC wavevector (KPSGC), slant angle (θ), propagation constant (βPSGC), and period (Λ) can be estimated:
K P S G C = β 1 2 + β S P P 2
θ = sin 1 ( β S P P K P S G C )
β P S G C = K P S G C sin ( θ )
Λ = 2 π β P S G C
n P S G C = β P S G C k 0
where the free-space wavenumber is k0 = 2π/λ0. The initial value of Λ is then scaled to place the coupling wavelength at 1.31 μm. The effective index of the PSGCs, nPSGC, is set equal to the real part of neff-SPP, which is 1.3482 (i.e., βPSGC = βSPP). Then, we use the extracted period and slant angle to calculate the effective index of the PSGC, aiming to obtain a physical SPP mode (with field enhancement mostly along the top side of the slanted ridges), having a real part of the effective index close to 1.3482 (Part iii of Figure 2b). To achieve this goal, we alter the fill factor (ff = w/Λ) and the gold thickness (HAu) of the PSGC, obtaining ff = 60% and HAu = 300 nm for our design. Table 1 summarizes our design.
The design summarized in Table 1 is validated via 2D FEM-based BMA of the entire system. In doing so, we set up two ports, one excitation port at the input of the first core and one receiving port at the output of the second core. Two BMA steps at the ports accompanied by a frequency response analysis of the full structure are carried out. The distance between the centers of the two cores is taken as Dinter = 46.6 μm [24]. The gratings are offset slightly from the cores to decrease undesired coupling in the opposite direction (Loff-b > Loff-f in Figure 1a). Perfectly matched layers (PMLs) and scattering boundary conditions are employed to avoid spurious reflections from the outer boundaries of the simulation domain.
Figure 3a shows the transmittance of our design, defined as the ratio of power transmitted to the TM0 mode of the second core, Pout, to the power carried by the input TM0 mode in the first core, Pin. Despite the large distance between the two cores, the scheme provides a transmittance of up to −21.13 dB, ensuring that reasonable power will be received at the output. Directional grating coupling is evident from the computed on-resonance electric field profile of Figure 3b, especially when compared with the computed electric field profiles off-resonance, as shown in Figure 3c,d.

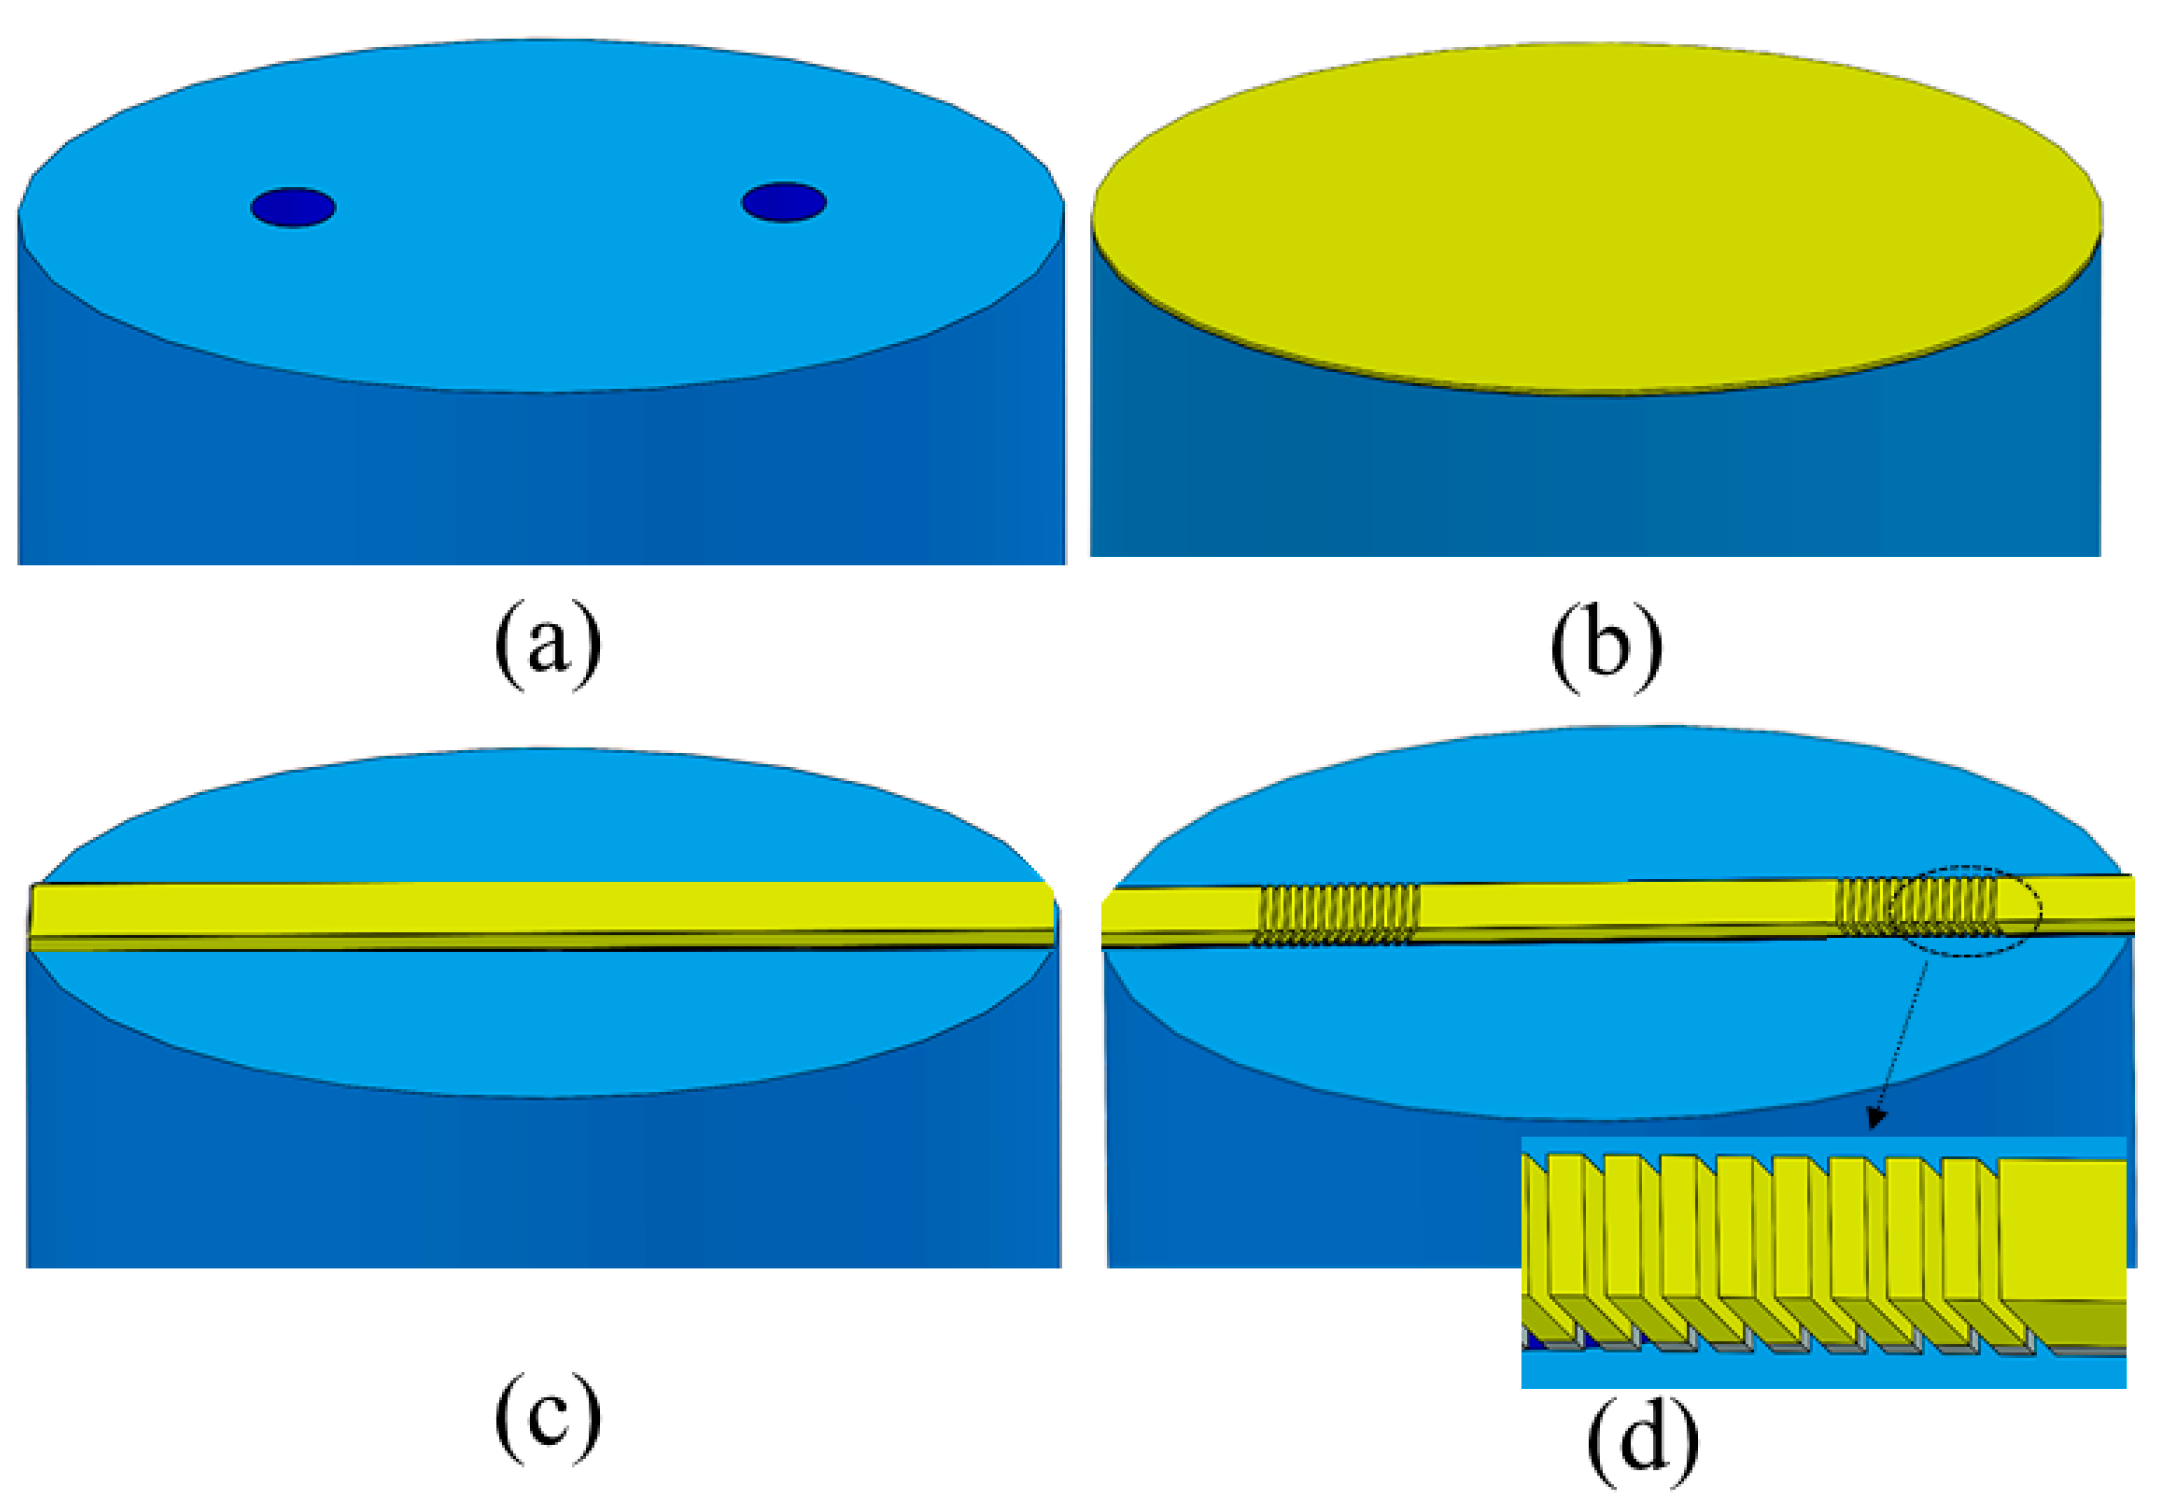
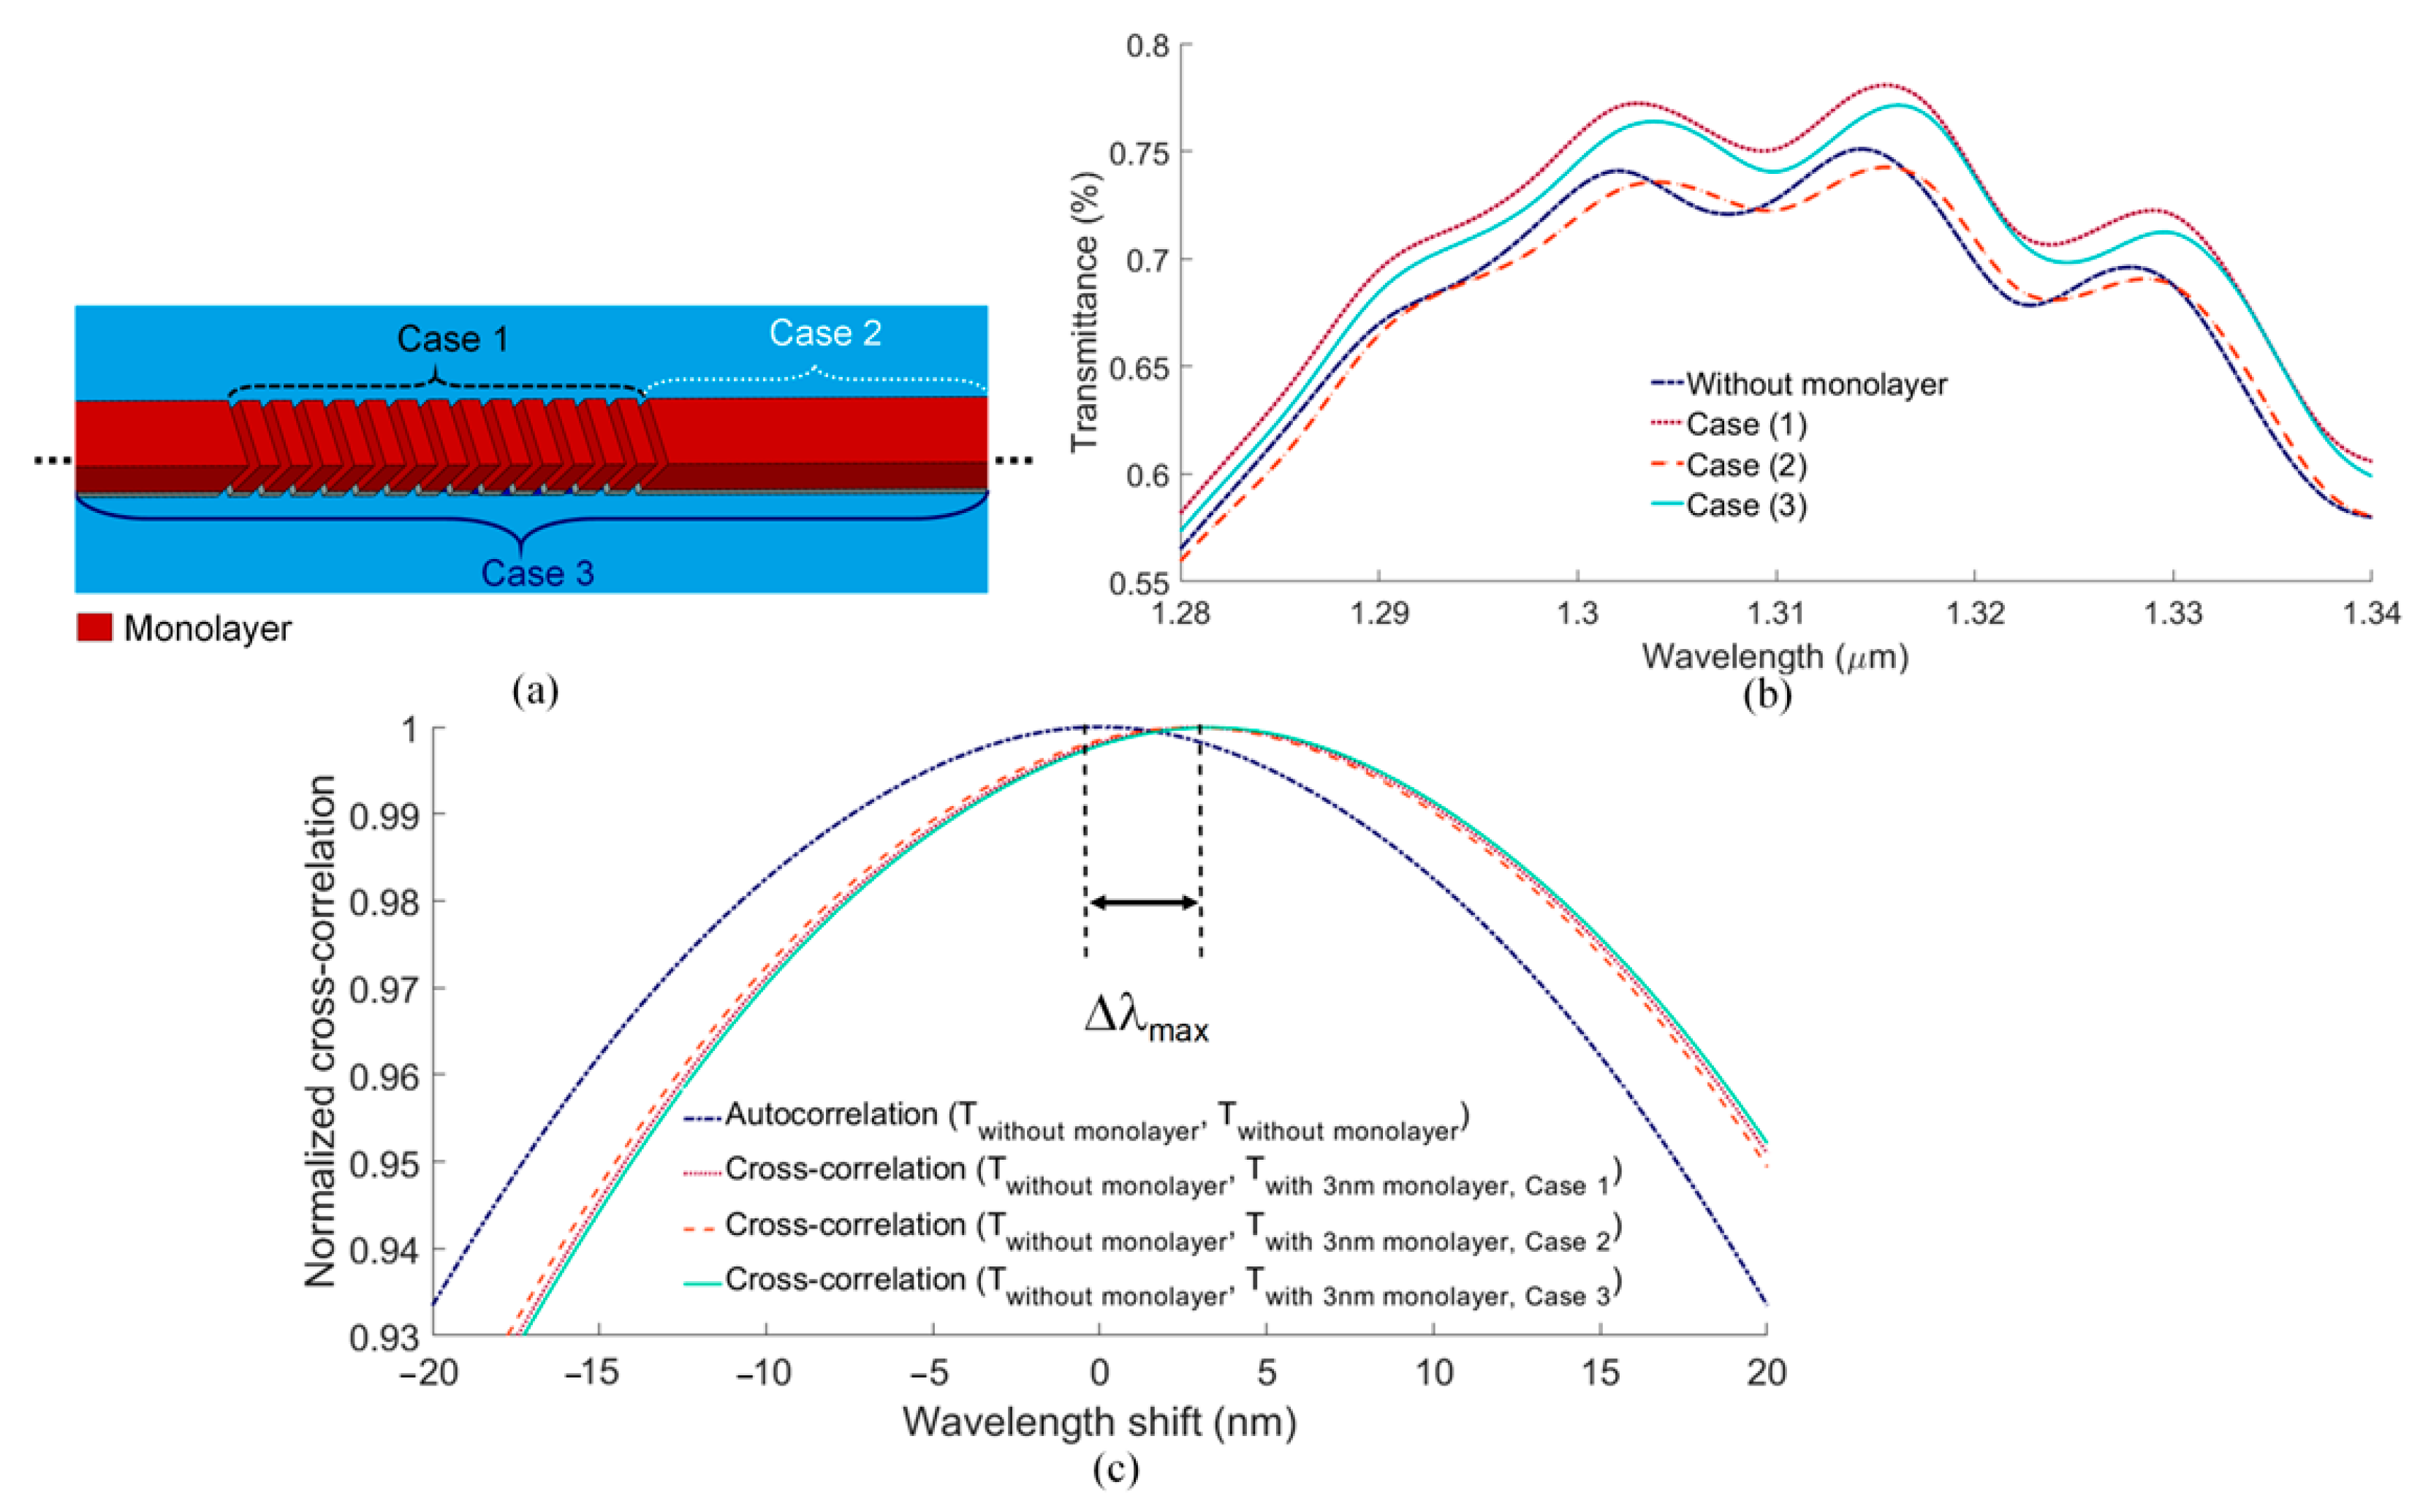
4. Proposed Fabrication Steps, Design Robustness, and Fabrication Tolerance

Although our study is theoretical, we propose in Figure 4 steps to fabricate the biosensor, with justification based on the literature. As depicted in Figure 4a, the starting “substrate” consists of the cleaved and polished end-facet of a commercial DCSMF [24,32]. The fiber is threaded into a ferrule, mounted perpendicularly on a custom-machined jig or fixture with fiber management to enable mounting on vacuum tools, as in a previous work [33].
Then, a 50 nm thick Cr layer can be evaporated on the flat and smooth end-facet. This large thickness guarantees strong adhesion between the subsequent Au layer and the facet while also eliminating any undesired SPPs from being supported along the bottom surface of the metal film. Cr evaporation is subsequently followed by Au evaporation without breaking the vacuum, targeting a 300 nm thick Au layer, as shown in Figure 4b. The Au thickness selected ensures the long-term robustness of the sensing surface, and its resilience to chemical cleaning, facilitating multiple re-uses of the sensing surface (thick Au/Cr bi-layer or tri-layer stacks with near-perfect interfaces have successfully been realized in previous works [22,34]).
After cleaning and inspection, a focused ion beam (FIB) milling system can be used to mill the slanted gratings [35,36] and the biosensing waveguide directly on the end-facet, following previous works [33,37], as sketched in Figure 4c,d. Direct milling using a He ion beam has proven effective in forming delicate nanoscale features in a Au film [38]. For the slants, the facet can be tilted to mill at an angle. As discussed in the previous section, the designed slant angle (θ) is approximately 40°, and the grating pitch (Λ) and width (w) are approximately 980 nm and 580 nm, respectively, such that the slits are wider than the metal thickness, yielding a milled aspect ratio of less than 1. As discussed below, small changes in geometrical parameters due to the fabrication tolerance do not strongly affect the sensor response (e.g., θ = 60° yields almost the same result as θ = 40°).
The influence on the transmittance due to changes in the nominal design of our grating (Table 1) is demonstrated in Figure 5, maintaining an RI of 1.333 for the sensing solution. Figure 5a shows the effect of changing the Au thickness on the optical response. A thick Au layer is needed to ensure efficient coupling by the PSGCs to the SPP mode propagating along the top Au surface. As seen, a 300 nm thick Au film provides good coupling while simultaneously offering robustness (due to thickness). A thick Cr layer is also needed to suppress the SPP along the bottom Au surface while providing strong adhesion between the end-facet and the Au layer. Figure 5b shows the effect of changing the Cr thickness on the sensor response. As shown in the electric field profile of Figure 5e Part i, a 10 nm Cr layer is not thick enough to completely suppress the undesired SPP propagating along the bottom. Therefore, we choose 50 nm for this layer to achieve better suppression. (Alternatively, a 200 nm Au layer on a 30 nm Cr layer can also provide good coupling, while reducing the thicknesses, easing fabrication).
In practice, fabrication imperfections may cause small changes in the structural parameters of realized biosensor. As discussed in the following section, our sensor design is sufficiently robust such that small changes in the grating parameters do not significantly alter the sensor performance. As seen in Figure 5c, small changes in the slant angle (due to small changes in the FIB milling angle) do not significantly affect the sensor response; the transmittance is not significantly affected for PSGC slant angles from θ = 40° to 60° near nominal (θ = ~43°, Table 1). This can be appreciated by comparing the on-resonance field distributions of Figure 5e, Parts ii with iii, which show no appreciable difference.
In addition, small changes in the grating length do not influence the sensor response significantly, which also supports design robustness (Figure 5d). We know that the fiber mode field is slightly larger than the core diameter, as the mode decays exponentially into the cladding. Thus, the length of the PSGCs should be at least as large as 1/e of the fiber mode field diameter. To investigate the effect of PSGC length on the sensor transmittance, we define forward and backward offset lengths, Loff-f and Loff-b, respectively, in Figure 1a, which are added to the core diameter, L. The total length of a PSGC is denoted as Lt. As presented in Figure 5d, setting the grating length to the core diameter (Lt = L) does not lead to the best coupling. Adding grating ridges in the forward direction does not improve the sensor transmittance. However, adding grating ridges in the backward direction increases the sensor transmittance by increasing the directivity of SPP excitation in the forward direction. Increasing Loff-b beyond 6 μm does not further increase the sensor transmittance. Thus, we choose Lt = 14 μm for our design (Lt = L + Loff-b, L = 8 μm, and Loff-b = 6 μm). However, as seen, even 2 μm changes in Lt do not cause a significant change in the sensor response.
The fill factor (ff) is also an important parameter, as it directly changes neff of the PSGC. As shown in Figure 6a, ff = 60% yields the best coupling, in agreement with our theoretical design (Table 1). For smaller or larger fill factors, the effective index of the PSGCs is altered such that the coupling efficiency is reduced. Moreover, ff = 60% presents a good aspect ratio from the fabrication viewpoint. As shown in Figure 6b, if ff changes slightly near 60% due to fabrication errors, the sensor response does not change significantly. Note that a 5% change in ff implies approximately 50 nm of change in the width (w) of the ridges, which corresponds to a large fabrication error.
Another fabrication error that might occur in FIB milling is the creation of slanted profiles with non-parallel sidewalls, having overcut or undercut slants [39], as shown in Figure 6c. The effect of overcut and undercut slants on the sensor response are depicted in Figure 6d,e, respectively. Here, the change in the ff, Δff, is defined as the summation of the right and left ff changes, Δffr + Δffl. As seen, up to 5% change in the ff due to the overcutting and undercutting effects does not change the sensor response, also indicating sensor design robustness against fabrication errors.
As mentioned earlier, lower thicknesses of 200 nm for the Au layer and of 30 nm for the Cr layer reduce material costs and are also suitable for the sensor design. In addition, θ can be chosen as 45°, which may be easier to set practically. Figure 6f shows the effect of changing ff in steps of 5% on the sensor design, with HAu = 200 nm, HCr = 30 nm, and θ = 45°, revealing almost the same robustness as the design involving larger thicknesses.

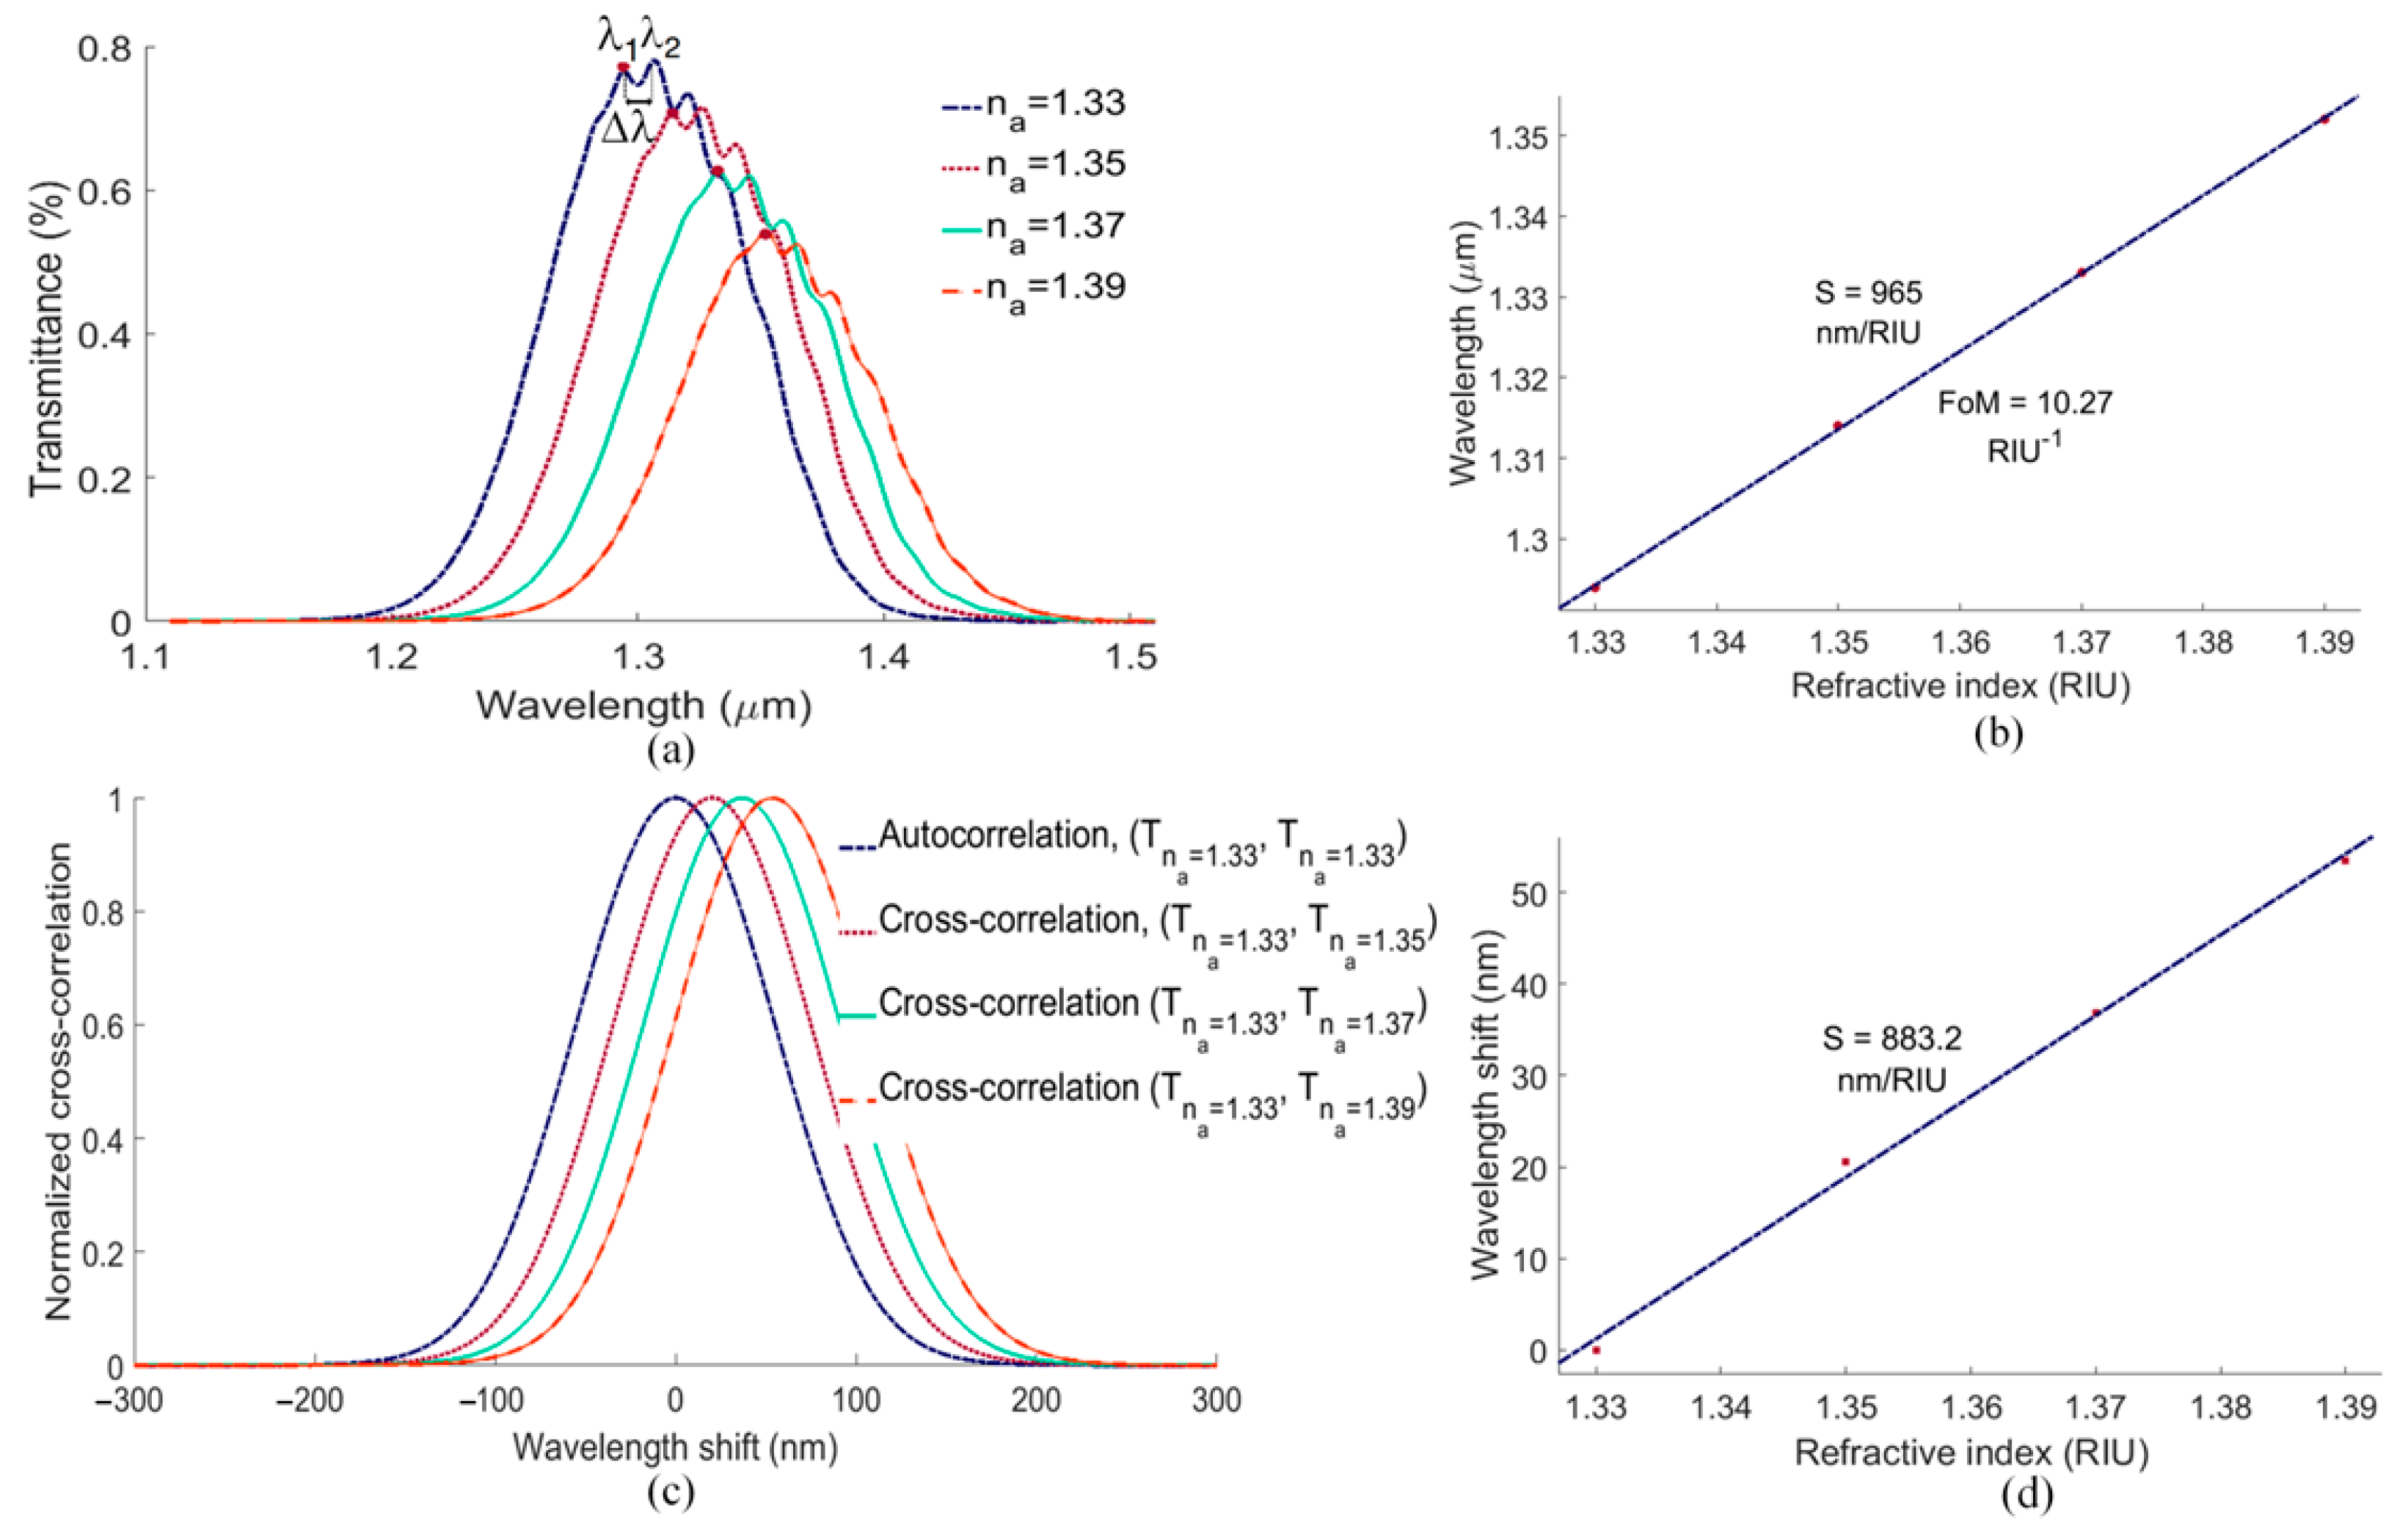
5. Sensitivity Computations

The conventional method for calculating the bulk sensitivity under wavelength interrogation is to determine the shift in the resonance wavelength (Δλr) resulting from changes in the bulk RI of the sensing solution (Δna), S = Δλr/Δna. Another important parameter of sensor performance is the figure of merit (FoM), defined as FoM = S/FWHM [40], where FWHM denotes the full-width at half-maximum of the transmittance spectrum.
Figure 7a shows the sensor transmittance as the RI of the sensing solution varies from 1.33 to 1.39, a range typical for bio-compatible sensing solutions. As observed, changing na brings about not only obvious shifts in the transmittance but also slight changes in spectral shape and in the fringes comprising the spectra. These tiny fringes in the optical response of the structure originate from the weak Fabry–Pérot cavity formed between the mirrored PSGCs, as verified by calculating the distance between adjacent fringes (e.g., Δλ in Figure 7a), which is of the order of the free spectral range (FSR) for such a resonator [13]. Choosing one of the fringes, e.g., the first clear fringe in each spectrum, marked by the solid red dot in Figure 7a, and tracking its wavelength shift vs. na yields the plot of Figure 7b, from which a bulk sensitivity and FoM of 965 nm/RIU and 10 RIU−1, respectively, are deduced.
However, if the spectral shape evolves, a monitoring approach based on identifying and tracking a single feature in a complex spectral response may not be robust. Alternatively, we propose the calculation and tracking of the cross-correlation between transmittance curves. For this purpose, we choose one of the curves as our reference, e.g., the transmittance for na = 1.33 (Tna = 1.33), and calculate the normalized autocorrelation of this reference spectrum and the normalized cross-correlation between all other transmittance curves and Tna = 1.33, as plotted in Figure 7c. We then plot the shift in the cross-correlated curves vs. na in Figure 7d, from which the bulk sensitivity is determined as 883 nm/RIU. The bulk sensitivity from the cross-correlations is smaller than that obtained directly from the spectra in which the Fabry–Pérot fringes are tracked (Figure 7a), because the Fabry–Pérot fringes are more sensitive than the underlying wide grating peak mostly tracked by the cross-correlation. However, tracking the cross-correlation is more robust, as the entire response curve is used, and there is no need to identify and track a specific feature.
To evaluate the surface sensitivity of our proposed structure, we apply a 3 nm thick dielectric monolayer, representative of a monolayer of protein receptor molecules, on different regions of the sensor, as sketched in Figure 8a. Three separate cases of monolayer growth are considered: on the PSGCs only (Case 1), on the biosensing waveguide only (Case 2), and on the entire structure (Case 3). Although, in practice, the monolayer would grow following Case 3, i.e., on all exposed Au surfaces following bio-functionalization [41], considering different regions separately determines the contribution of each to the surface sensitivity. The RI of the buffer is set to 1.338, and the RI of the monolayer is set to 1.5, representative of proteins over a broad wavelength range.
Figure 8b plots the zoomed-in transmittance spectra computed for the three cases of monolayer growth. The growth of the monolayer in all cases shifts the transmittance. This means that both gratings and the waveguide contribute to the surface sensitivity of the device. We also calculate the normalized cross-correlation of the transmittance responses without and with the monolayer (for the three cases), as shown in Figure 8c. As observed, the results are almost the same for the different cases of monolayer growth. The surface sensitivity of the structure is taken as that for Case 3, which produces a shift of approximately 3.17 nm in the cross-correlation curves, yielding a surface sensitivity of approximately 1 nm/nm.

6. Discussion and Concluding Remarks

A comparison of our biosensor performance with other optical fiber end-facet (tip-based) biosensors in the literature is presented in Table 2. Such biosensors are generally based upon SPR [1,42,43,44] or localized SPR (LSPR) structures [45,46], Fano-resonance (FR) structures [47], Fabry–Pérot interferometers (FPIs) [48,49], or a grating-coupled FPI [13]. Most are based on single-mode fibers (SMFs), multi-mode fibers (MMFs), or photonic crystal fibers (PCFs) [33]. Wavelength interrogation in all cases is performed in reflection, except for three schemes [13,33,42]: one uses a DCSMF, but with a dielectric sensing structure on the end-facet [13], another uses two spectrometers and a splitter [42], and the other a free-space transmission setup [33]. Our design produces a high bulk sensitivity of approximately 880 nm/RIU, outperforming all of the end-facet biosensors reported in the literature, except for the design of [43] (Table 2).
Our proposed configuration exploits the main advantage of a DCSMF, i.e., enabling end-facet spectral interrogation using a fiber-based transmission setup (which is simpler than spectral interrogation in reflection). The configuration offers compelling prospects for remote real-time biosensing. The proposed configuration yields robust and experimentally realizable designs, e.g., using metal evaporation and FIB milling. Cross-correlation analysis is proposed as an approach to monitor spectral changes during sensing, which adds robustness to the measurements because the entire spectral response curve is used. The grating design approach based on the grating vector and modal analysis could be applied to design similar plasmonic grating couplers for other biophotonic applications. The proposed biosensor provides high bulk and surface sensitivities, although the latter could be further improved by enhancing the resonance between the two fiber cores or by nano-structuring the biosensing waveguide. The biosensor tip can be dipped in a vial containing the sensing sample, which eliminates the need for microfluidics and further simplifies the setup. Once packaged adequately, the biosensor could be inserted directly into a living organism for in vivo biosensing.

Author Contributions

F.F.M., A.M. and P.B. generated the initial ideas of this work and developed the theory and the design approach; A.M. and P.B. guided the research; F.F.M. performed numerical analyses and wrote the first draft of the manuscript; F.F.M., A.M. and P.B. discussed the results and contributed to the final manuscript. All authors have read and agreed to the published version of the manuscript.

Funding

This research received no external funding.

Institutional Review Board Statement

Not applicable.

Informed Consent Statement

Not applicable.

Data Availability Statement

Not applicable.

Conflicts of Interest

The authors declare no conflict of interest.

Abbreviations

BMABoundary Mode Analysis
DCSMFDual-Core Single-Mode Optical Fiber
FEMFinite Element Method
FIBFocused Ion Beam Milling
FoMFigure of Merit
FRFano-Resonance
FPIsFabry–Pérot Interferometers
FSRFree Spectral Range
LSPRLocalized Surface Plasmon Resonance
LOFLab-on-a-Fiber
MMFsMulti-Mode Fibers
PCFsPhotonic Crystal Fibers
PMLsPerfectly Matched Layers
RIRefractive Index
SMFsSingle-Mode Fibers
SPPsSurface Plasmon Polaritons
SPRSurface Plasmon Resonance
PSGCsPlasmonic Slanted Grating Couplers
TMTransverse Magnetic

References

  1. Polley, N.; Basak, S.; Hass, R.; Pacholski, C. Fiber optic plasmonic sensors: Providing sensitive biosensor platforms with minimal lab equipment. Biosens. Bioelectron. 2019, 132, 368–374. [Google Scholar] [CrossRef] [PubMed]
  2. Chen, Y.-T.; Lee, Y.-C.; Lai, Y.-H.; Lim, J.-C.; Huang, N.-T.; Lin, C.-T.; Huang, J.-J.J.B. Review of integrated optical biosensors for point-of-care applications. Biosensors 2020, 10, 209. [Google Scholar] [CrossRef]
  3. Caucheteur, C.; Loyez, M.; González-Vila, Á.; Wattiez, R.J.O.E. Evaluation of gold layer configuration for plasmonic fiber grating biosensors. Opt. Express 2018, 26, 24154–24163. [Google Scholar] [CrossRef] [PubMed]
  4. Briliant, A.P.; Purwidyantri, A.; Kou-Chen, L.J.B. Surface plasmon resonance optical sensor: A review on light source technology. Biosensors 2018, 8, 80. [Google Scholar]
  5. Esfahani Monfared, Y. Overview of Recent Advances in the Design of Plasmonic Fiber-Optic Biosensors. Biosensors 2020, 10, 77. [Google Scholar] [CrossRef]
  6. Han, H.; Hou, D.; Luan, N.; Bai, Z.; Song, L.; Liu, J.; Hu, Y.J.S. Surface plasmon resonance sensor based on dual-side polished microstructured optical fiber with dual-core. Sensors 2020, 20, 3911. [Google Scholar] [CrossRef]
  7. Corres, J.M.; Matias, I.; Bravo, J.; Arregui, F.J.S.; Chemical, A.B. Tapered optical fiber biosensor for the detection of anti-gliadin antibodies. Sens. Actuators B Chem. 2008, 135, 166–171. [Google Scholar] [CrossRef]
  8. Viegas, D.; Goicoechea, J.; Santos, J.L.; Araújo, F.M.; Ferreira, L.A.; Arregui, F.J.; Matias, I.R.J.S. Sensitivity improvement of a humidity sensor based on silica nanospheres on a long-period fiber grating. Sensors 2009, 9, 519–527. [Google Scholar] [CrossRef]
  9. Xiong, Y.; Xu, F.J.A.P. Multifunctional integration on optical fiber tips: Challenges and opportunities. Adv. Photonics 2020, 2, 064001. [Google Scholar] [CrossRef]
  10. Gandhi, M.A.; Chu, S.; Senthilnathan, K.; Babu, P.R.; Nakkeeran, K.; Li, Q.J.A.S. Recent advances in plasmonic sensor-based fiber optic probes for biological applications. Appl. Sci. 2019, 9, 949. [Google Scholar] [CrossRef]
  11. Aliberti, A.; Ricciardi, A.; Giaquinto, M.; Micco, A.; Bobeico, E.; La Ferrara, V.; Ruvo, M.; Cutolo, A.; Cusano, A. Microgel assisted lab-on-fiber optrode. Sci. Rep. 2017, 7, 14459. [Google Scholar] [CrossRef]
  12. Ricciardi, A.; Crescitelli, A.; Vaiano, P.; Quero, G.; Consales, M.; Pisco, M.; Esposito, E.; Cusano, A. Lab-on-fiber technology: A new vision for chemical and biological sensing. Analyst 2015, 140, 8068–8079. [Google Scholar] [CrossRef] [PubMed]
  13. Mahani, F.F.; Maleki, M.; Mokhtari, A.; Berini, P. Design of an efficient Fabry-Perot biosensor using high-contrast slanted grating couplers on a dual-core single-mode optical fiber tip. IEEE Sens. J. 2021, 21, 19705–19713. [Google Scholar] [CrossRef]
  14. Alam, M.Z.; Yang, Z.; Sheik-Bahae, M.; Aitchison, J.S.; Mojahedi, M. Directional excitation of surface plasmon using multi-mode interference in an aperture. Sci. Rep. 2021, 11, 3170. [Google Scholar] [CrossRef]
  15. Liao, H.; Li, Z.; Chen, J.; Zhang, X.; Yue, S.; Gong, Q. A submicron broadband surface-plasmon-polariton unidirectional coupler. Sci. Rep. 2013, 3, 1–7. [Google Scholar] [CrossRef]
  16. Eftekharinia, B.; Moshaii, A.; Dabirian, A. Design of a slit-groove coupler for unidirectional excitation of the guided surface plasmon polaritons through a plasmonic slot waveguide. Plasmonics 2017, 12, 131–138. [Google Scholar] [CrossRef]
  17. Ayata, M.; Fedoryshyn, Y.; Koch, U.; Leuthold, J. Compact, ultra-broadband plasmonic grating couplers. Opt. Express 2019, 27, 29719–29729. [Google Scholar] [CrossRef]
  18. López-Tejeira, F.; Rodrigo, S.G.; Martin-Moreno, L.; García-Vidal, F.J.; Devaux, E.; Ebbesen, T.W.; Krenn, J.R.; Radko, I.; Bozhevolnyi, S.I.; González, M.U. Efficient unidirectional nanoslit couplers for surface plasmons. Nat. Phys. 2007, 3, 324–328. [Google Scholar] [CrossRef]
  19. Liu, Y.; Palomba, S.; Park, Y.; Zentgraf, T.; Yin, X.; Zhang, X. Compact magnetic antennas for directional excitation of surface plasmons. Nano Lett. 2012, 12, 4853–4858. [Google Scholar] [CrossRef]
  20. Liu, W.; Wang, G.; Wen, K.; Hu, X.; Qin, Y. Efficient unidirectional SPP launcher: Coupling the SPP to a smooth surface for propagation. Opt. Lett. 2022, 47, 621–624. [Google Scholar] [CrossRef] [PubMed]
  21. Bonod, N.; Popov, E.; Li, L.; Chernov, B. Unidirectional excitation of surface plasmons by slanted gratings. Opt. Express 2007, 15, 11427–11432. [Google Scholar] [CrossRef]
  22. McPolin, C.; Bouillard, J.-S.; Vilain, S.; Krasavin, A.V.; Dickson, W.; O’Connor, D.; Wurtz, G.A.; Justice, J.; Corbett, B.; Zayats, A.V. Integrated plasmonic circuitry on a vertical-cavity surface-emitting semiconductor laser platform. Nat. Commun. 2016, 7, 12409. [Google Scholar] [CrossRef]
  23. Suzuki, H.; Sugimoto, M.; Matsui, Y.; Kondoh, J. Effects of gold film thickness on spectrum profile and sensitivity of a multimode-optical-fiber SPR sensor. Sens. Actuators B Chem. 2008, 132, 26–33. [Google Scholar] [CrossRef]
  24. Geng, Y.; Li, S.; Li, M.-J.; Sutton, C.G.; McCollum, R.L.; McClure, R.L.; Koklyushkin, A.V.; Matthews, K.I.; Luther, J.P.; Butler, D.L. High-speed, bi-directional dual-core fiber transmission system for high-density, short-reach optical interconnects. In Proceedings of the Next-Generation Optical Networks for Data Centers and Short-Reach Links II, San Francisco, CA, USA, 9 May 2015; p. 939009. [Google Scholar]
  25. Bertie, J.E.; Lan, Z. Infrared intensities of liquids XX: The intensity of the OH stretching band of liquid water revisited, and the best current values of the optical constants of H2O (l) at 25 °C between 15,000 and 1 cm−1. Appl. Spectrosc. 1996, 50, 1047–1057. [Google Scholar] [CrossRef]
  26. Comsol Multiphysics, Finite Element Mode Solver. Available online: www.comsol.com (accessed on 20 August 2021).
  27. Taillaert, D.; Bogaerts, W.; Bienstman, P.; Krauss, T.F.; Van Daele, P.; Moerman, I.; Verstuyft, S.; De Mesel, K.; Baets, R. An out-of-plane grating coupler for efficient butt-coupling between compact planar waveguides and single-mode fibers. IEEE J. Quantum Electron. 2002, 38, 949–955. [Google Scholar] [CrossRef]
  28. Johnson, P.B.; Christy, R.-W. Optical constants of the noble metals. Phys. Rev. B 1972, 6, 4370. [Google Scholar] [CrossRef]
  29. Johnson, P.; Christy, R. Optical constants of transition metals: Ti, v, cr, mn, fe, co, ni, and pd. Phys. Rev. B 1974, 9, 5056. [Google Scholar] [CrossRef]
  30. Ditlbacher, H.; Galler, N.; Koller, D.; Hohenau, A.; Leitner, A.; Aussenegg, F.; Krenn, J.J.O.e. Coupling dielectric waveguide modes to surface plasmon polaritons. Opt. Express 2008, 16, 10455–10464. [Google Scholar] [CrossRef] [PubMed]
  31. Wang, B.; Jiang, J.; Nordin, G.P. Systematic design process for slanted grating couplers. Appl. Opt. 2006, 45, 6223–6226. [Google Scholar] [CrossRef] [PubMed]
  32. Ayata, M.; Fedoryshyn, Y.; Heni, W.; Baeuerle, B.; Josten, A.; Zahner, M.; Koch, U.; Salamin, Y.; Hoessbacher, C.; Haffner, C. High-speed plasmonic modulator in a single metal layer. Science 2017, 358, 630–632. [Google Scholar] [CrossRef]
  33. Suleman, H.; Hajebifard, A.; Hahn, C.; Olivieri, A.; Berini, P. Plasmonic heptamer-arranged nanoholes in a gold film on the end-facet of a photonic crystal fiber. Opt. Lett. 2021, 46, 4482–4485. [Google Scholar] [CrossRef] [PubMed]
  34. Nagal, V.; Li, T.; Khurgin, J.B.; Gracias, D.H.J.A.A.N.M. Large-area arrays of quasi-3D Au nanostructures for polarization-selective mid-infrared metasurfaces. ACS Appl. Nano Mater. 2020, 3, 7029–7039. [Google Scholar] [CrossRef]
  35. Wang, L.; Li, T.; Li, L.; Xia, W.; Xu, X.; Zhu, S. Electrically generated unidirectional surface plasmon source. Opt. Express 2012, 20, 8710–8717. [Google Scholar] [CrossRef]
  36. Schrauwen, J.; Van Laere, F.; Van Thourhout, D.; Baets, R. Focused-ion-beam fabrication of slanted grating couplers in silicon-on-insulator waveguides. IEEE Photonics Technol. Lett. 2007, 19, 816–818. [Google Scholar] [CrossRef]
  37. Dhawan, A.; Muth, J.F. Engineering surface plasmon based fiber-optic sensors. Mater. Sci. Eng. B 2008, 149, 237–241. [Google Scholar] [CrossRef]
  38. Hahn, C.; Hajebifard, A.; Berini, P. Helium focused ion beam direct milling of plasmonic heptamer-arranged nanohole arrays. Nanophotonics 2020, 9, 393–399. [Google Scholar] [CrossRef]
  39. Miller, J.M.; de Beaucoudrey, N.; Chavel, P.; Turunen, J.; Cambril, E.J.A.o. Design and fabrication of binary slanted surface-relief gratings for a planar optical interconnection. Appl. Opt. 1997, 36, 5717–5727. [Google Scholar] [CrossRef] [PubMed]
  40. Farhadi, S.; Farmani, A.; Hamidi, A.J.O.; Electronics, Q. Figure of merit enhancement of surface plasmon resonance biosensor based on Talbot effect. Opt. Quantum Electron. 2021, 53, 518. [Google Scholar] [CrossRef]
  41. Antoniou, M.; Tsounidi, D.; Petrou, P.S.; Beltsios, K.G.; Kakabakos, S.E. Functionalization of silicon dioxide and silicon nitride surfaces with aminosilanes for optical biosensing applications. Med. Devices Sens. 2020, 3, e10072. [Google Scholar] [CrossRef]
  42. Jia, P.; Yang, J. A plasmonic optical fiber patterned by template transfer as a high-performance flexible nanoprobe for real-time biosensing. Nanoscale 2014, 6, 8836–8843. [Google Scholar] [CrossRef]
  43. Pisco, M.; Galeotti, F.; Quero, G.; Iadicicco, A.; Giordano, M.; Cusano, A. Miniaturized sensing probes based on metallic dielectric crystals self-assembled on optical fiber tips. ACS Photonics 2014, 1, 917–927. [Google Scholar] [CrossRef]
  44. Nguyen, H.; Sidiroglou, F.; Collins, S.F.; Baxter, G.W.; Roberts, A.; Davis, T.J. Periodic array of nanoholes on gold-coated optical fiber end-faces for surface plasmon resonance liquid refractive index sensing. In Proceedings of the Third Asia Pacific Optical Sensors Conference, Sydney, Australia, 21 January–3 February 2012; pp. 505–510. [Google Scholar]
  45. Consales, M.; Ricciardi, A.; Crescitelli, A.; Esposito, E.; Cutolo, A.; Cusano, A. Lab-on-fiber technology: Toward multifunctional optical nanoprobes. ACS Nano 2012, 6, 3163–3170. [Google Scholar] [CrossRef] [PubMed]
  46. Nguyen, H.; Sidiroglou, F.; Collins, S.; Davis, T.; Roberts, A.; Baxter, G.J.A.P.L. A localized surface plasmon resonance-based optical fiber sensor with sub-wavelength apertures. Appl. Phys. Lett. 2013, 103, 193116. [Google Scholar] [CrossRef]
  47. Savinov, V.; Zheludev, N.J.A.P.L. High-quality metamaterial dispersive grating on the facet of an optical fiber. Appl. Phys. Lett. 2017, 111, 091106. [Google Scholar] [CrossRef]
  48. Novais, S.; Ferreira, M.S.; Pinto, J.L. Optical fiber Fabry–Perot tip sensor for detection of water–glycerin mixtures. J. Light. Technol. 2018, 36, 1576–1582. [Google Scholar] [CrossRef]
  49. Huang, C.; Yang, M.; Xie, W.; Dai, J. Optical fiber Fabry-Perot refractive index sensor based on porous Al2O3 film. In Proceedings of the 24th International Conference on Optical Fibre Sensors, Curitiba, Brazil, 28 September–2 October 2015; p. 963484. [Google Scholar]
Figure 1. (a) Cross-sectional view of the plasmonic biosensor based on Au/Cr plasmonic slanted grating couplers (PSGCs) interconnected by a Au/Cr biosensing waveguide on the end-facet of a dual-core single-mode fiber (DCSMF). (b) Expanded views of the input PSGC in (i) longitudinal cross-sectional and (ii) 3D views. (c) Schematic diagram of a proposed experimental setup for interrogating the proposed biosensor.
Biosensors 13 00558 g001
Figure 2. (a) Vector geometries and (b) TM0 mode field calculations for the theoretical design of the proposed plasmonic slanted grating couplers.
Biosensors 13 00558 g002
Figure 3. (a) Calculated core-to-core transmittance (TM0-to-TM0) from the first (Pin) to the second (Pout) core for the nominal design based on the vector geometry and modal calculations (Table 1). Normalized electric field distributions: (b) on-resonance; (c,d) off-resonance.
Biosensors 13 00558 g003
Figure 4. Proposed fabrication steps based on focused ion beam (FIB) milling. (a) Cleaved and polished end-facet of a DCSMF; (b) evaporation of Au and Cr layers; (c) FIB milling of excess metal to define the biosensing stripe waveguide; (d) FIB milling at an angle to define the slanted gratings.
Biosensors 13 00558 g004
Figure 5. Fabrication tolerance of the sensor determined as variations in core-to-core transmittance (TM0-to-TM0) due to changes in (a) gold thickness (HAu), (b) chromium thickness (HCr), (c) slant angle (θ), and (d) length (L) of the gratings. (e) (i) Normalized on-resonance electric field distribution of the nominal design with HCr = 10 nm, demonstrating the undesired excitation of SPPs along the bottom interface, and (ii) normalized on-resonance electric field distribution of the nominal design with θ = 40° and (iii) θ = 60°, showing good robustness against small changes in FIB milling angle.
Biosensors 13 00558 g005
Figure 6. Fabrication tolerance of the sensor determined as variations in core-to-core transmittance (TM0-to-TM0) as the fill factor (ff) is changed in steps of (a) 20% and (b) 5%. (c) Slants of non-parallel sidewalls as (i) overcut or (ii) undercut features and their effect, (d) overcut and (e) undercut, on the sensor response. (f) Effect of changing fill factor (ff) in steps of 5% on the sensor design with HAu = 200 nm, HCr = 30 nm, and θ = 45°.
Biosensors 13 00558 g006
Figure 7. (a) The shift in the transmittance spectrum as the RI of the sensing solution is varied in the range from 1.33 to 1.39. (b) The shift in the wavelength of the feature marked by the solid red dot in Part (a) vs. the RI. The bulk sensitivity is taken as the slope of the best-fit linear model through the data. (c) Calculated normalized autocorrelation and cross-correlation of the transmittance responses of Part (a). (d) The shift in the peak cross-correlation vs. the RI. The bulk sensitivity is taken as the slope of the best-fit linear model through the data.
Biosensors 13 00558 g007
Figure 8. (a) Monolayer growth on different regions of the biosensor (shown for a small section of the structure). (b) Effect of 3 nm monolayer growth on the transmittance spectrum for all cases. (c) Calculated normalized autocorrelation of the transmittance without a monolayer and cross-correlations for a 3 nm monolayer in the three cases.
Biosensors 13 00558 g008
Table 1. Design parameters of the proposed biosensor.
ParameterDefinitionParameter Value
θslant angle42.8°
Λgrating pitch971.67 nm (initial)
980.72 nm (scaled)
fffill factor60%
wgrating width583 nm (initial)
588.43 nm (scaled)
HCrchromium height50 nm
HAugold height300 nm
Dccore diameter8 μm
Lgrating length on the core8 μm
Loff-bbackward offset length6 μm
Loff-fforward offset length0
Lttotal grating length (L + Loff-b)16 μm
Dinterintermediate distance between the cores46.6 μm
Table 2. Comparison of optical fiber end-facet sensors with our proposed scheme.
StructureS (nm/RIU)RIU RangeWavelength Range (nm)Wavelength Interrogation Mode *Data TypeOptical Fiber
SPR [1]4201.330–1.365650–950RExperimentalMMF
SPR [42]5951.341–1.368810–930T/RExperimental/NumericalMMF
SPR [43]23001–1.381250–1650RExperimental/NumericalSMF
SPR [44]2941.32–1.38700–1100RExperimental/NumericalSMF
SPR/LSPR [33]166.67–233.331–1.3600–1100TExperimental/NumericalPCF
LSPR [45]1251–1.41200–1550RExperimental/NumericalSMF
LSPR [46]7551–1.5800–1800RExperimental/NumericalSMF
FR [47]4001.32–1.351220–1420RExperimental/NumericalSMF
FPI [48]51.31–1.471530–1570RExperimental/NumericalSMF
FPI [49]1541.333–1.4431260–1300RExperimentalSMF
Gratings/FPI [13]50–1001.33–1.521100–1500TNumericalDCSMF
This work883.21.33–1.391100–1500TNumericalDCSMF
* R: Reflection; T: Transmission.
Disclaimer/Publisher’s Note: The statements, opinions and data contained in all publications are solely those of the individual author(s) and contributor(s) and not of MDPI and/or the editor(s). MDPI and/or the editor(s) disclaim responsibility for any injury to people or property resulting from any ideas, methods, instructions or products referred to in the content.

