Article

Electrochemical Sensing of Gallic Acid in Beverages Using a 3D Bio-Nanocomposite Based on Carbon Nanotubes/Spongin-Atacamite

1
Institute of Electronic and Sensor Materials, Faculty of Materials Science and Materials Technology, Technische Universität Bergakademie Freiberg, 09599 Freiberg, Germany
2
Faculty of Medicine, Kermanshah University of Medical Sciences, Kermanshah 6715847141, Iran
3
Freiberg Center for Water Research-ZeWaF, Technische Universität Bergakademie Freiberg, 09599 Freiberg, Germany
*
Author to whom correspondence should be addressed.
Biosensors 2023, 13(2), 262; https://doi.org/10.3390/bios13020262
Submission received: 6 January 2023 / Revised: 9 February 2023 / Accepted: 10 February 2023 / Published: 13 February 2023
(This article belongs to the Special Issue New Biosensors and Nanosensors)

Abstract

:
Gallic acid (GA) is one of the most important polyphenols, being widely used in the food, cosmetic, and pharmaceutical industries due to its biological effects such as antioxidant, antibacterial, anticancer, antiviral, anti-inflammatory, and cardioprotective properties. Hence, simple, fast, and sensitive determination of GA is of particular importance. Considering the fact that GA is an electroactive compound, electrochemical sensors offer great potential for GA quantitation due to their fast response time, high sensitivity, and ease of use. A simple, fast, and sensitive GA sensor was fabricated on the basis of a high-performance bio-nanocomposite using spongin as a natural 3D polymer, atacamite, and multi-walled carbon nanotubes (MWCNTs). The developed sensor showed an excellent response toward GA oxidation with remarkable electrochemical features due to the synergistic effects of 3D porous spongin and MWCNTs, which provide a large surface area and enhance the electrocatalytic activity of atacamite. At optimal conditions by differential pulse voltammetry (DPV), a good linear relationship was obtained between peak currents and GA concentrations in a wild linear range of 500 nM to 1 mM. Subsequently, the proposed sensor was used to detect GA in red wine as well as in green and black tea, confirming its great potential as a reliable alternative to conventional methods for GA determination.

1. Introduction

Over the past few years, antioxidants have emerged as important ingredients in foods and beverages due to their numerous health benefits, such as anti-aging and anti-inflammatory properties [1]. In fact, they neutralize free radicals and reactive oxygen species that damage cells and cause chronic health problems and aging. Polyphenols, secondary plant compounds with over 8000 variants, are the most common antioxidants found in vegetables, fruits, grains, and beverages. Recently, they have been widely applied as natural additives instead of synthetic ones to improve food quality and promote health benefits [2,3,4]. Among them, GA (3,4,5-trihydroxybenzoic acid) and its derivatives have received significant attention due to their extraordinary biological features. They can be found in a variety of herbs, vegetables, and fruits, including apple peel, bile seeds, grapes, bananas, strawberries, lemons, pineapple, and oak bark, as well as in wine products and in green and black tea [5,6]. The anti-cancer [7], anti-diabetic [8], anti-allergic [9], anti-fungal [10], anti-bacterial [11], anti-inflammatory [12], neuroprotective [13], and cardioprotective properties [14] have made GA as one of the most widely used phenolic components in the medicine, food, and pharmaceutical industries. Considering these diverse biological and pharmaceutical effects, the determination of GA is of great importance. High-performance liquid chromatography [15], spectrophotometry [16], flow injection analysis [17], capillary electrophoresis [18], and chemiluminescence [19] are the conventional analytical techniques used to identify GA. However, despite the high sensitivity of these techniques, they require complicated equipment, specialized operators, complex sample preparation, and pre-treatment. In addition, on-site and in vivo analysis of GA is not possible with these methods. Since GA is an electroactive phenolic compound, electrochemical approaches such as cyclic voltammetry (CV), differential pulse voltammetry (DPV), amperometry, and electrochemical impedance spectroscopy (EIS) hold great potential for GA determination. Considering the advantages of this technology, including high sensitivity and selectivity, low cost, short measurement time, and simplicity, several studies have been performed to determine the GA electrochemically using different types of electrodes in various food and pharmaceutical matrices [4,20,21].
Carbon-based electrodes such as graphite [22], glassy carbon (GC) [23,24], and carbon paste electrodes (CPEs) [25,26,27,28] are generally used as working electrodes for the determination of GA. Compared to graphite and GC electrodes, CPEs seem to be the best choice due to their low cost, quick and easy fabrication and modification, fast regenerable surface by simple polishing on a paper, and low background current [29]. However, since CPEs are not sufficiently selective and sensitive to the target analyte, a variety of compounds (organic and inorganic) can be mixed with the carbon paste to improve their electrochemical performance [30]. Carbon nanostructures (such as graphene, and carbon nanotubes (CNTs)) [20,25,27], metal oxide nanoparticles (NPs) (such as CoO, ZrO2, and SiO2) [28,31,32], polymers [33], and the combination of them (Bi NPs/CNTs, polymer/CuO NPs, gold NPs/ZrO2 NPs) [26,34,35], as well as bio-nanocomposites (Fe3O4/chitosan nanocomposite) [36], are the most commonly used modifiers for proposed CPEs toward GA determination.
Due to the inherent advantages such as conductivity, excellent electrocatalytic activity, multiple preparation methods, and low cost, Cu-based NPs and nanocomposites have recently gained much interest as modifier candidates for the development of electrochemical sensors [37]. Nevertheless, the development of Cu-based nanocomposites with high specific surface areas and highly desirable electrocatalytic kinetics is a major challenge. This issue can be addressed by incorporating Cu-based nanostructures onto various 2D and 3D carbon nanomaterials, polymers, and biopolymers [37,38]. Especially renewable biopolymers, such as spongin, which represents the main structural proteinaceous component of sponges’ skeletons, remain to be in the focus of modern biomaterials science [39,40]. Spongin-based naturally occurring 3D scaffolds [41,42] have already been successfully used for enzyme immobilization [43,44] and carbonization [45], as well as in extreme biomimetics [46] for the development of new metal-oxide-containing composite materials [47,48,49,50]. Recently, we also reported that spongin, as a natural biopolymer with a microporous 3D structure, can react with Cu ions to form a porous 3D sensing system with excellent catalytic activity [38,51]. On the basis of the incorporation of atacamite (Cu2Cl(OH)3), as an electrocatalyst with enzyme-like activity, into the porous 3D sponge scaffold, we developed a simple and cost-effective enzyme-free glucose sensor for the determination of glucose in human blood serum samples [38]. On the other hand, CNTs and their composites have emerged as an attractive sensing material due to their high electrical conductivity, electrocatalytic effect, large surface area, and biocompatibility [52,53]. Thus, the integration of CNTs into a 3D Cu-spongin scaffold (Sp-At) creates a novel 3D sensing composite with synergistic effects and important features for catalysis.
In the present work, a simple, low-cost, environmentally friendly, and sensitive electrochemical sensor for the effective determination of GA based on a novel bio-nanocomposite of 3D porous spongin, atacamite, as a highly active catalyst and MWCNTs (denoted as Sp-At/MWCNT), was developed. The prepared 3D Sp-At/MWCNT composite was utilized for modification of CPE and applied for electrocatalytic oxidation of GA in red wine and black/green tea samples.

2. Materials and Methods

2.1. Reagents

Graphite powder, GA monohydrate (HPLC > 98%), sodium phosphate (Na2HPO4 and NaH2PO4), and paraffin oil were purchased from Sigma Aldrich. Sulfuric acid 98% and nitric acid 65% were obtained from Merck. Spongin scaffolds of Hippospongia communis marine demosponges were purchased from INTIB GmbH (Freiberg, Germany). Cupric chloride dihydrate and ammonia solution were obtained from Riedel-de Haën AG (Seelze, Germany), Th. Geyer GmbH & Co. KG (Renningen, Germany) and abcr GmbH (Karlsruhe, Germany). MWCNTs were purchased from Sigma Aldrich (Burlington, NJ, USA) with a diameter ranging from 6 to 13 nm and a length ranging from 2.5 to 20 μm. Pristine MWCNTs were then purified through acid treatment according to Wang et al. [54].

2.2. Apparatus and Measurements

Electrochemical measurements were performed with a PalmSens 4 electrochemical analyzer system with the software PSTrace 5.8 (PalmSens BV, Houten, the Netherlands). All experiments were carried out at room temperature in an electrochemical cell with a three-electrode platform. A saturated silver/silver chloride (Ag/AgCl) (3 M KCl solution) and a platinum wire electrode were used as the reference electrode and auxiliary electrode, respectively. Bare and modified CPEs served as the working electrode. Phosphate buffer solution (0.1 M, pH 3.0–6.0) was prepared using a mixture of the stock solutions (NaH2PO4 and Na2HPO4) and employed as an electrolyte solution for all measurements. EIS measurements were carried out in 0.1 M KCl containing 5 mM [Fe(CN)6]3−/4− at the frequency range of 0.1 Hz–100 kHz, applied potential of 0.23 V, and an amplitude of 5 mV.

2.3. Preparation of the CPEs

Three-dimensional Sp-At was prepared according to our earlier reports [38,51]. It was characterized using different methods such as high-resolution transmission electron microscopy, scanning electron microscopy, X-ray photoelectron spectroscopy, and X-ray diffraction [38,51]. The bare CPE and modified CPEs were fabricated by grinding different ratios of graphite, MWCNTs, Sp-At powder, and paraffin oil as a binder in a mortar and with a grinding time of 40 min (Table 1). The components were homogenized to shape a paste, which was then pressed into a carbon paste holder with an inner diameter of 4 mm. These electrodes were then denoted as MWCNTs/CPE (MWCNTs modified CPE), Sp-At/CPE (Sp-At modified CPE), and Sp-At/MWCNTs/CPE (Sp-At- and MWCNT-modified CPE). Before each measurement, the surface of the CPEs was regenerated by smoothing with a filter paper.

2.4. Preparation of Sample Solutions

Black and green tea samples were obtained by a simple filtration method. A total of 3 g of dried and powered tea leaves were added to 25 mL of 80 °C boiled double distilled water for 10 min and then allowed to cool at room temperature. The extract was filtered with filter paper and diluted with 0.1 M phosphate buffer (pH 4). Prior to each measurement, it was spiked with standard GA solutions.
The red wine sample was directly diluted with 0.1 M phosphate buffer (pH 4), without any pretreatment, and spiked with standard GA solutions.

3. Results

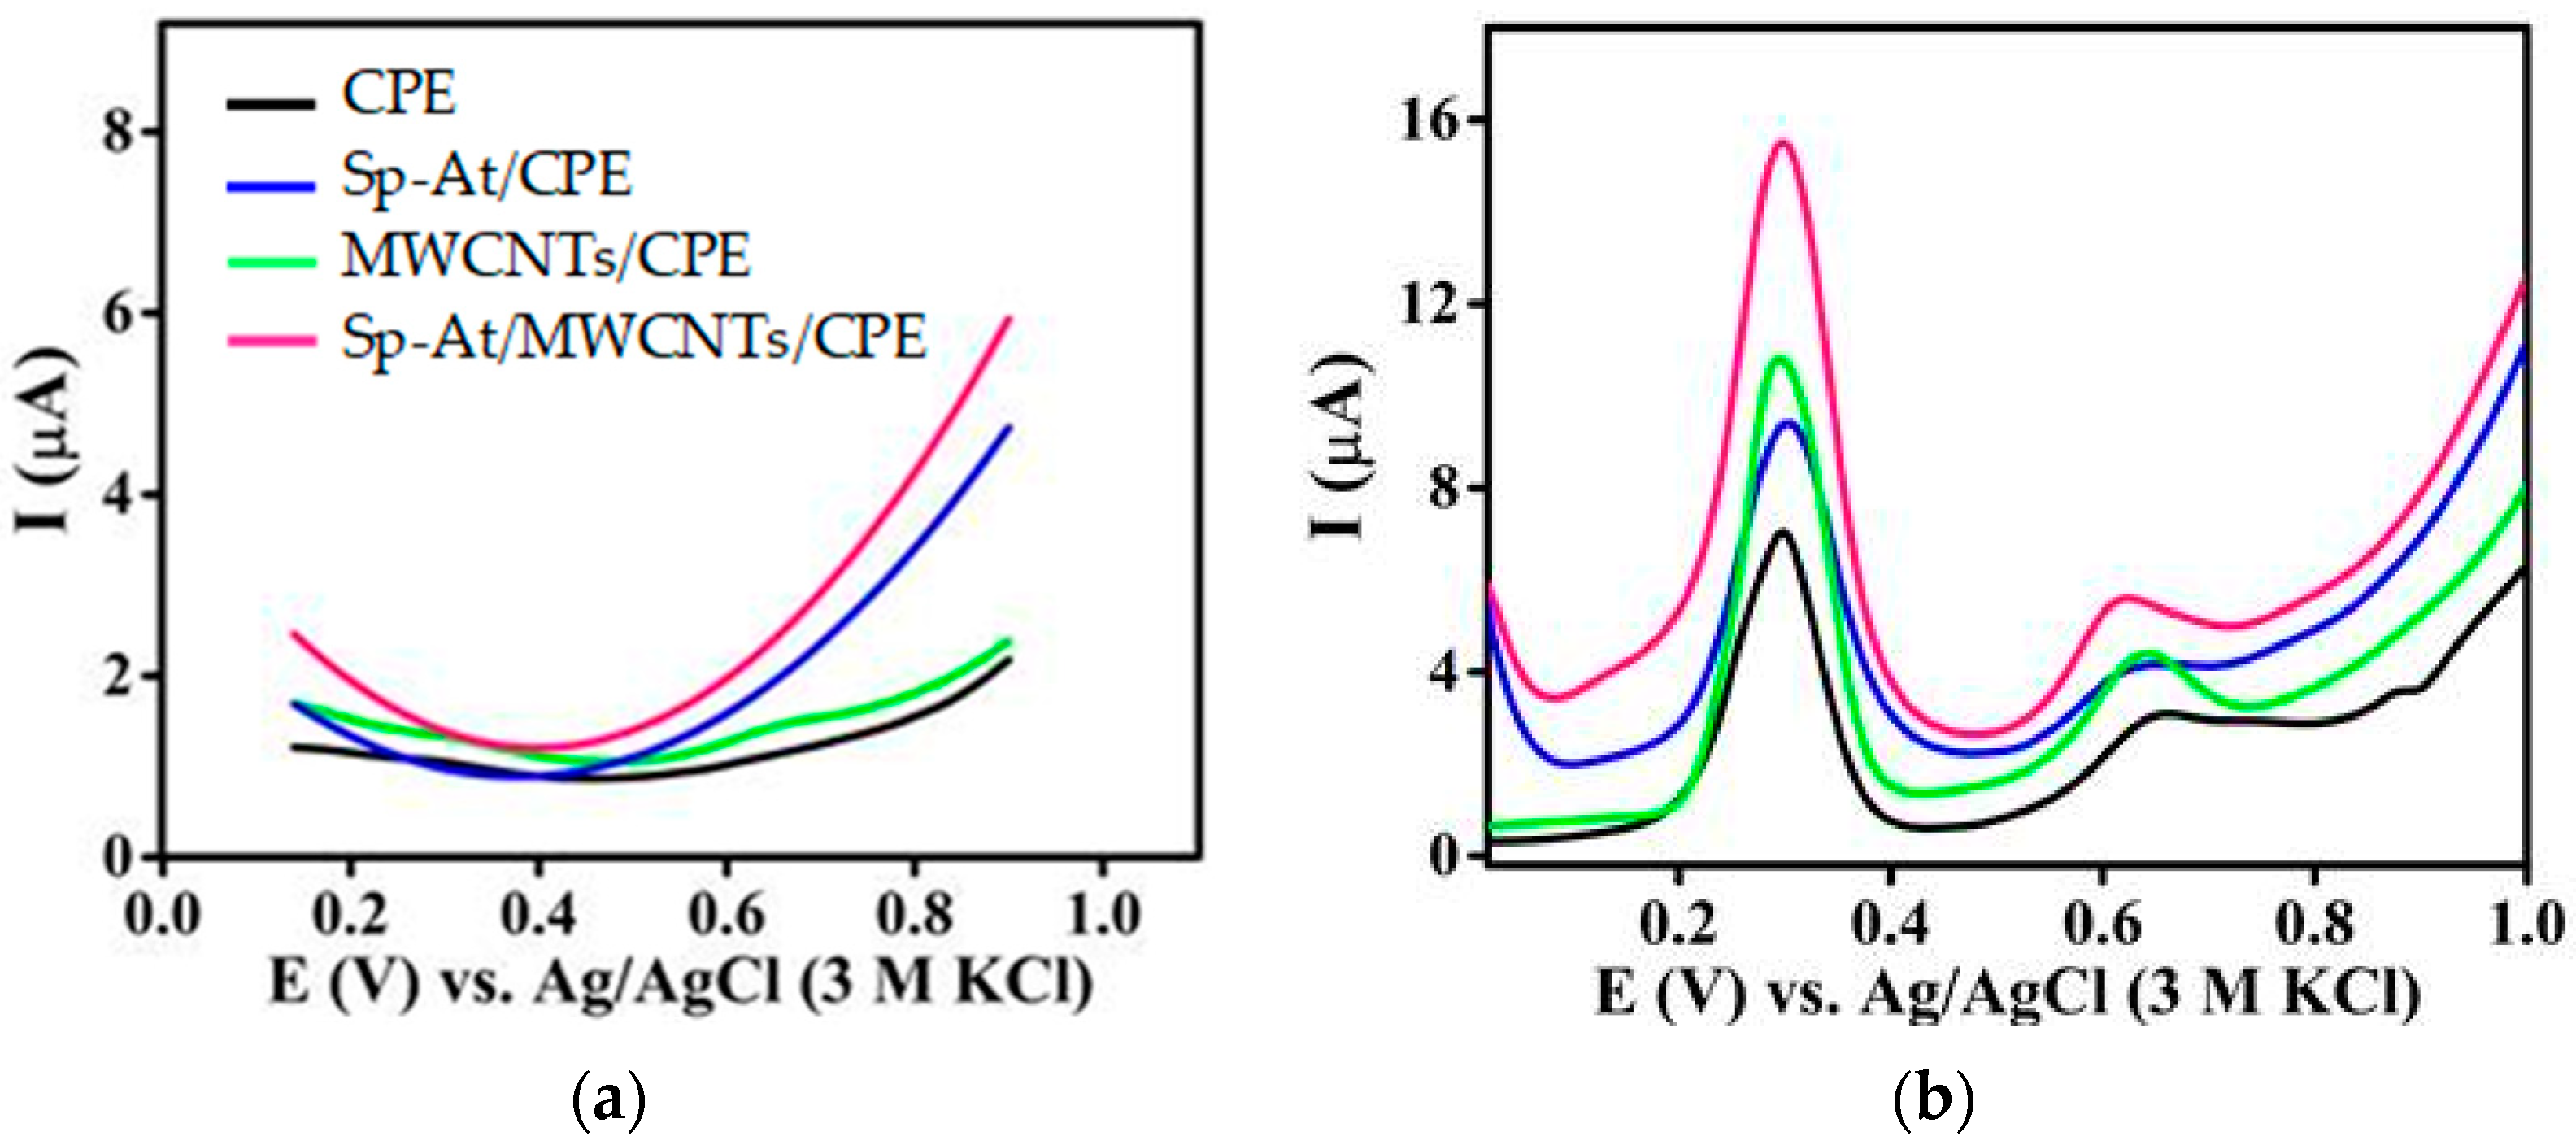
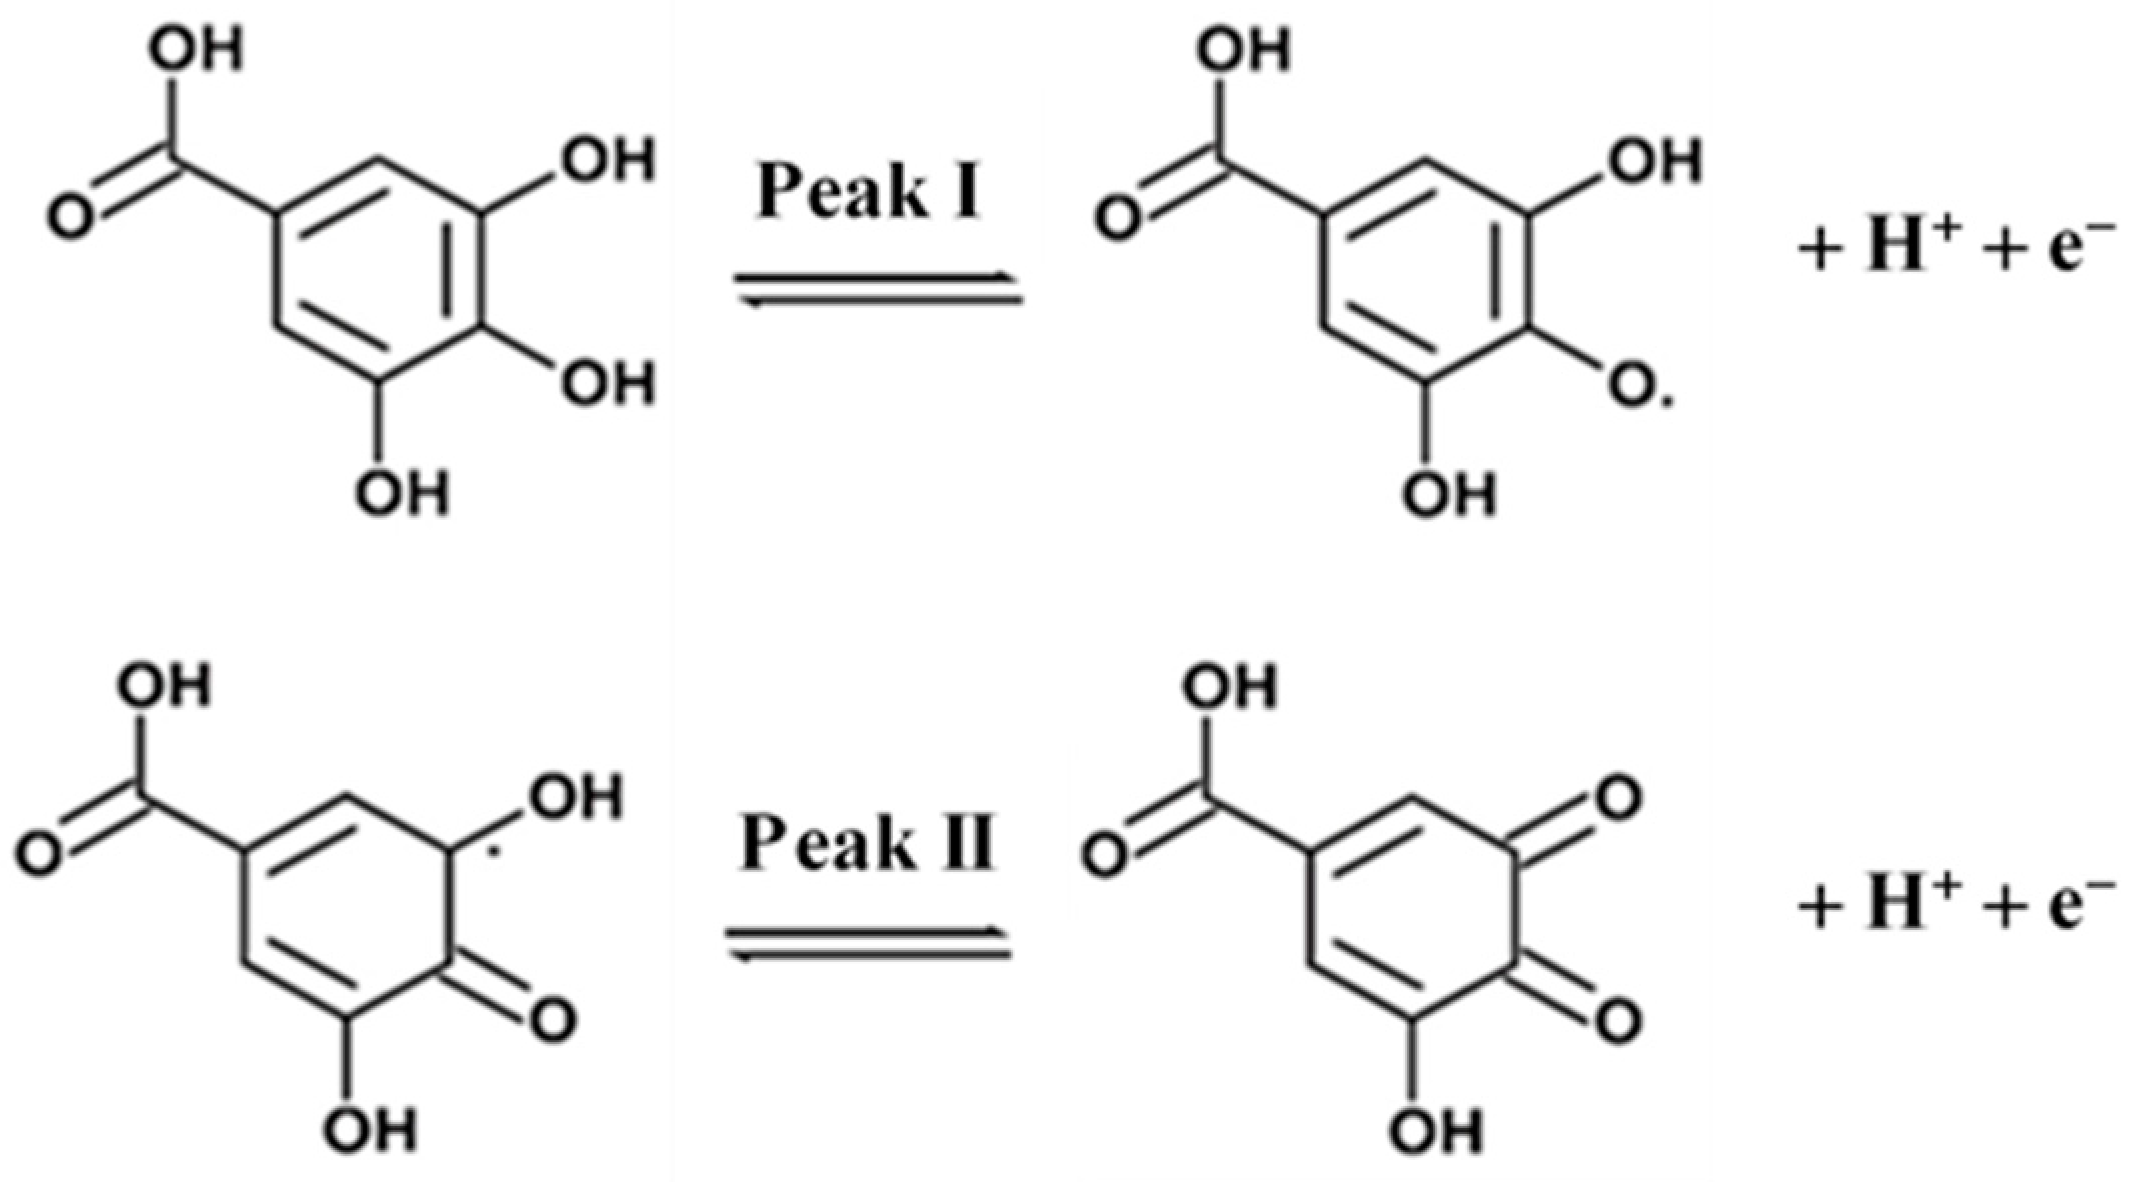
3.1. Electrochemical Behavior of CPEs towards GA Oxidation

Figure 1 shows the DPVs of bare CPE, Sp-At/CPE, MWCNTs/CPE, and Sp-At/MWCNTs/CPE recorded in 0.1 M phosphate buffer, pH 4, in the absence and presence of 30 μM GA. In the absence of GA, no obvious oxidation peak was observed at any of the electrodes, and also the background current was very low (Figure 1a). DPVs of different CPEs in the presence of 30 µM GA revealed that the electrochemical oxidation of GA was defined by two anodic peaks (Figure 1b). Peak I (0.3 V vs. Ag/AgCl) was ascribed to the formation of the semiquinone radical as a result of the oxidation of the galloyl group, which was then oxidized to the quinone form (peak II (0.6 V vs. Ag/AgCl)) [55]. In both reactions, one proton and one electron were involved. Scheme 1 illustrates the well-known route for the oxidation of phenols, hydroquinones, and derivatives. Since the second peak was much weaker than the first one, GA oxidation was studied by focusing on the first oxidation peak [25]. As seen in Figure 1b, Sp-At/MWCNTs/CPE exhibited a clearly enhanced oxidation current in response to GA in comparison to CPE, Sp-At/CPE, and MWCNTs/CPE. In accordance with the literature [56,57], the electrochemical oxidation of GA is initiated by the oxidation of copper oxides to their higher valence states, and then the oxidized copper oxides help to oxidize GA electrocatalytically. The 3D spongin structure provides a large surface area for the formation of nano- and microcrystalline atacamite and promotes surface adsorption and electron transfer between GA and Sp-At [38]. These features, combined with the ability of MWCNTs to facilitate electron transfer kinetics, favorably contributed to the enhancement of electron transfer between GA and the electrode surface and the resulting oxidation current [27]. Hence, the Sp-At/MWCNTs/CPE was used as a working electrode for further investigations.

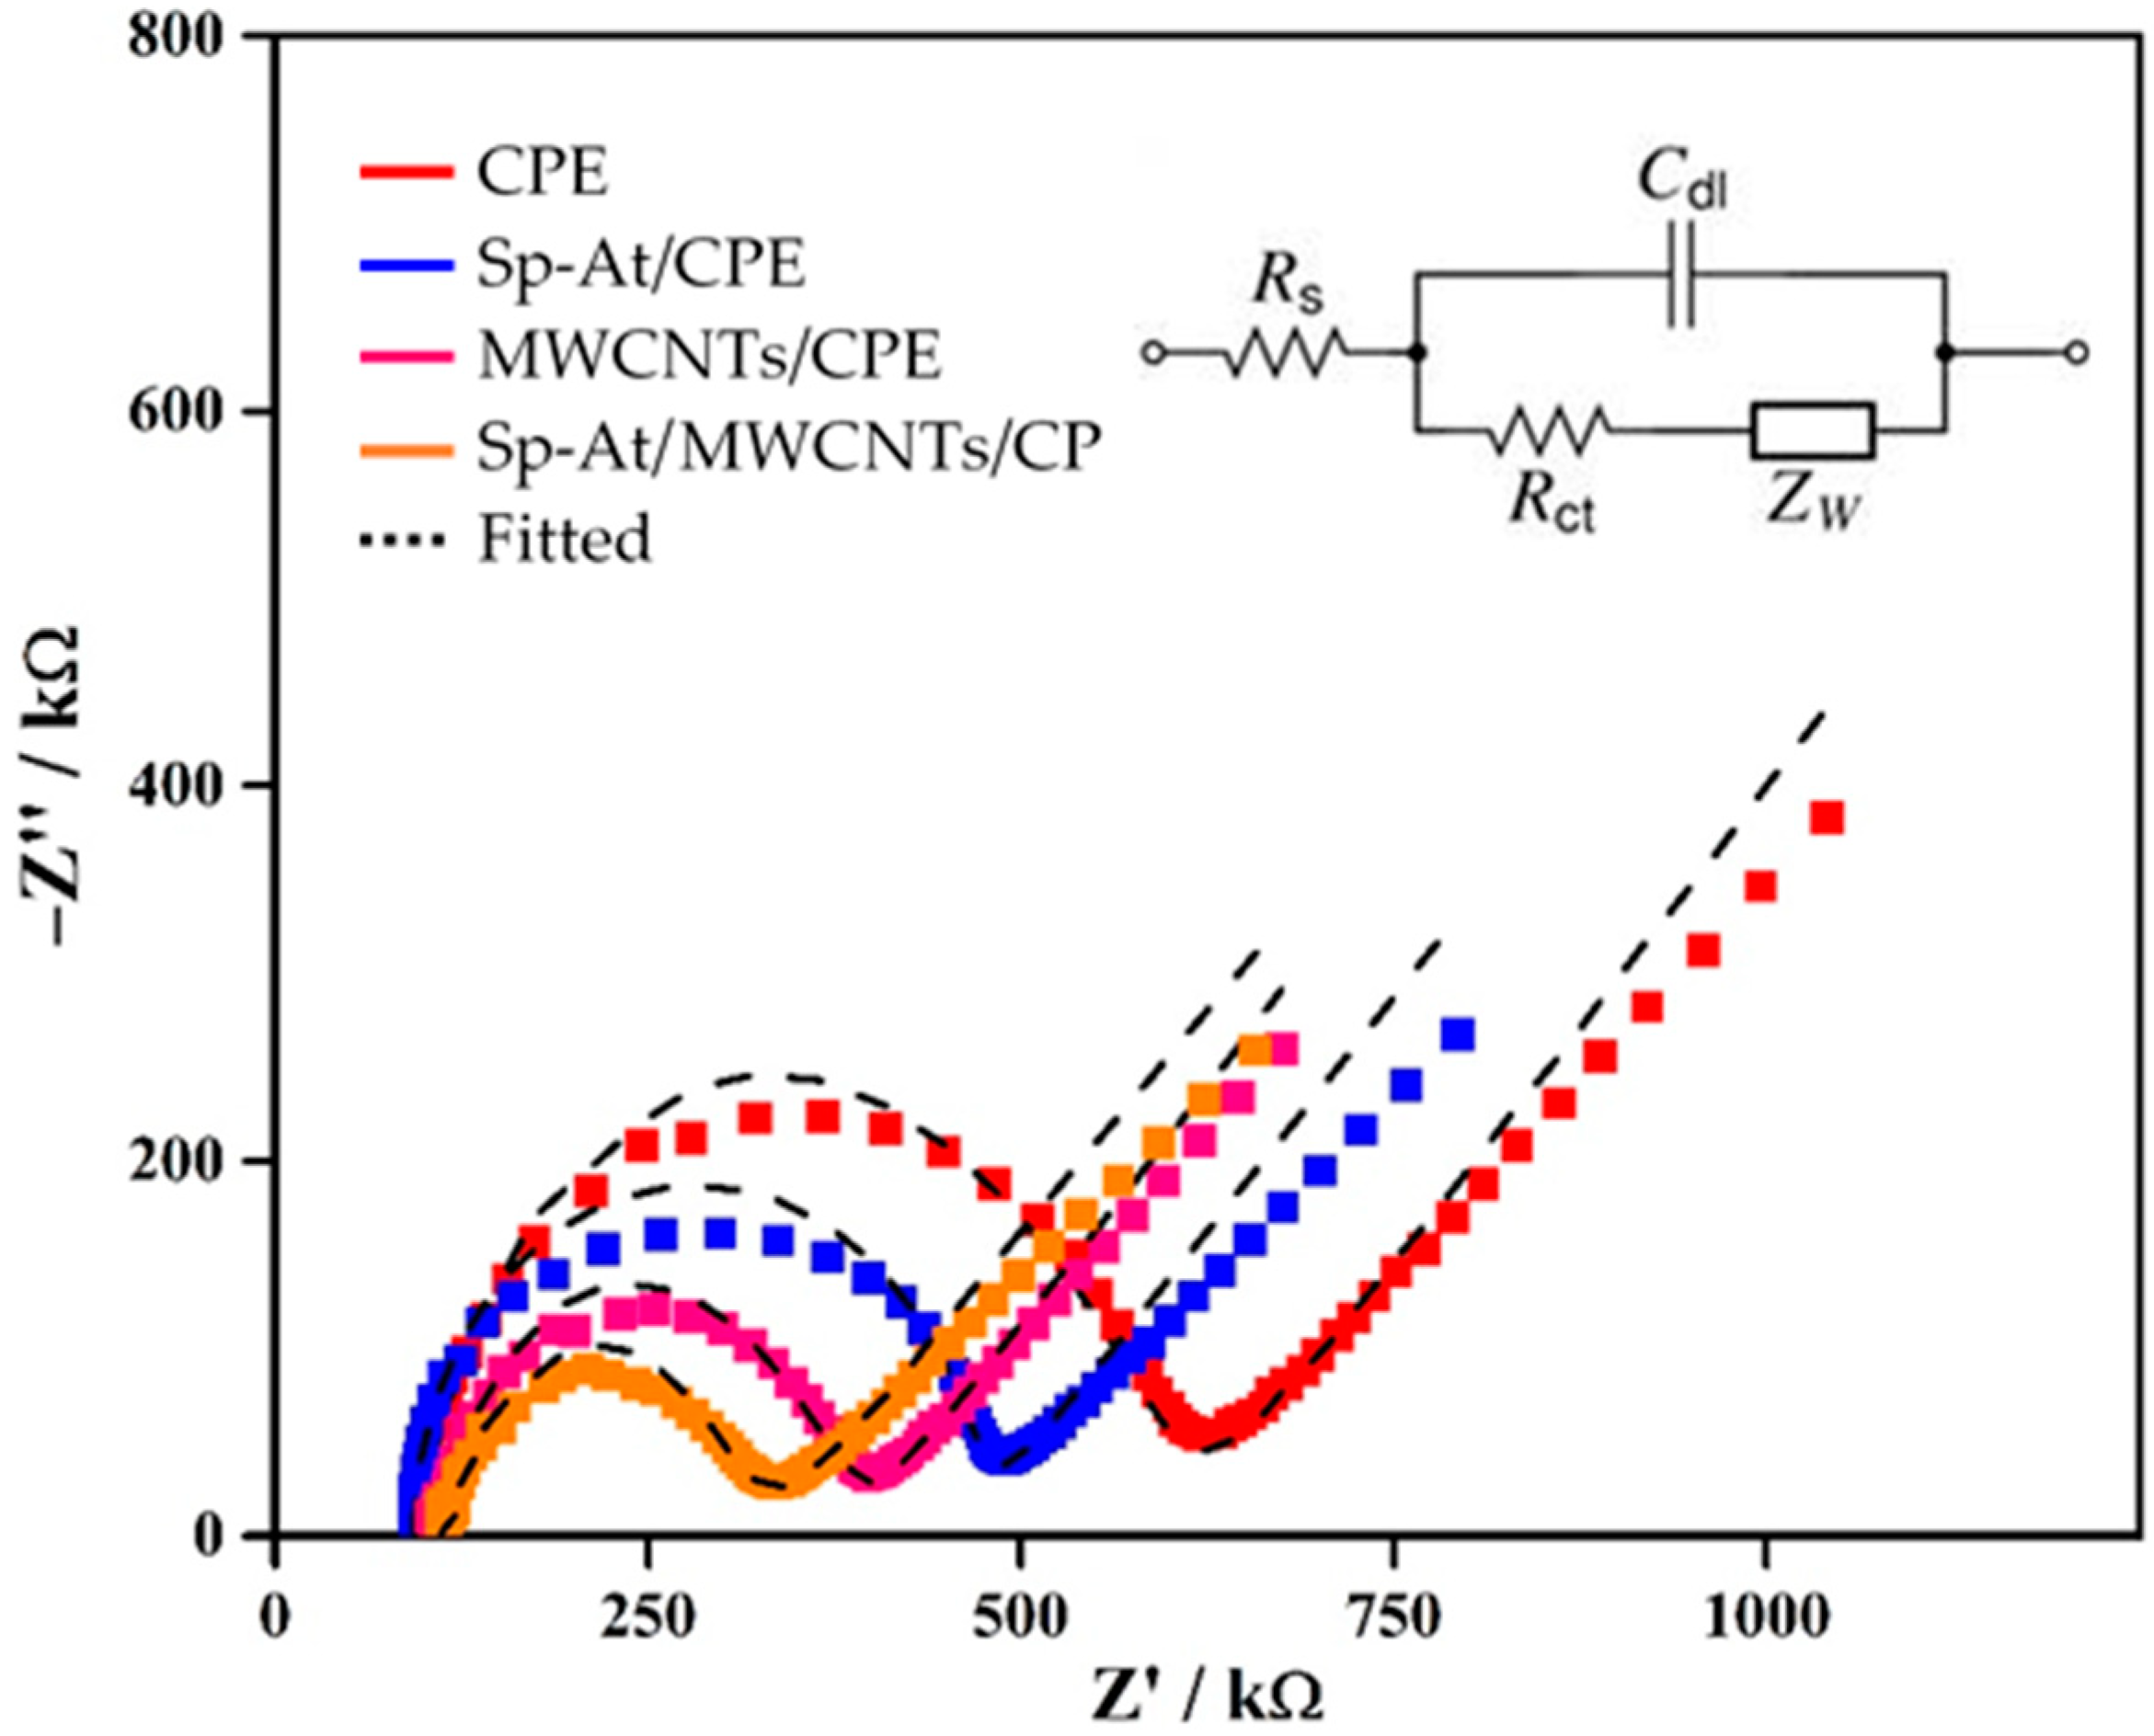
3.2. Electrochemical Characterization of CPEs

EIS, as a powerful method for characterizing the electrical properties of an electrode surface, was utilized to confirm the electrode modification. Figure 2 depicts Nyquist plots of CPE, Sp-At/CPE, MWCNTs/CPE, and Sp-At/MWCNTs/CPE in 0.1 M KCl containing 5 mM [Fe(CN)6]3−/4−. The impedance data were fitted on the basis of the Randles equivalent circuit (Figure 2, inset), where Rs stands for solution resistance; Cdl is the double-layer capacitance; and Zw and Rct represent Warburg resistance and charge transfer resistance, respectively. As illustrated in Figure 2, all electrodes exhibited semicircles of differing diameters in the high-frequency region, which corresponds to Rct and, in the low-frequency region, a line at about 45 degrees (also known as the Warburg element), which can be attributed to the probe’s diffusion from the bulk solution to the electrode–solution interface. In comparison to the bare CPE (487 Ω), Sp-At/CPE (370 Ω), and MWCNTs/CPE (256 Ω), the Sp-At/MWCNTs/CPE (200 Ω) exhibited a smaller Rct value. This indicates that both Sp-At and MWCNTs accelerate electron transfer, but the combination of 3D porous Sp-At, which offers higher electron conduction paths, and MWCNTs with a specifically large surface area exhibits the highest charge transfer and electrical conductivity.

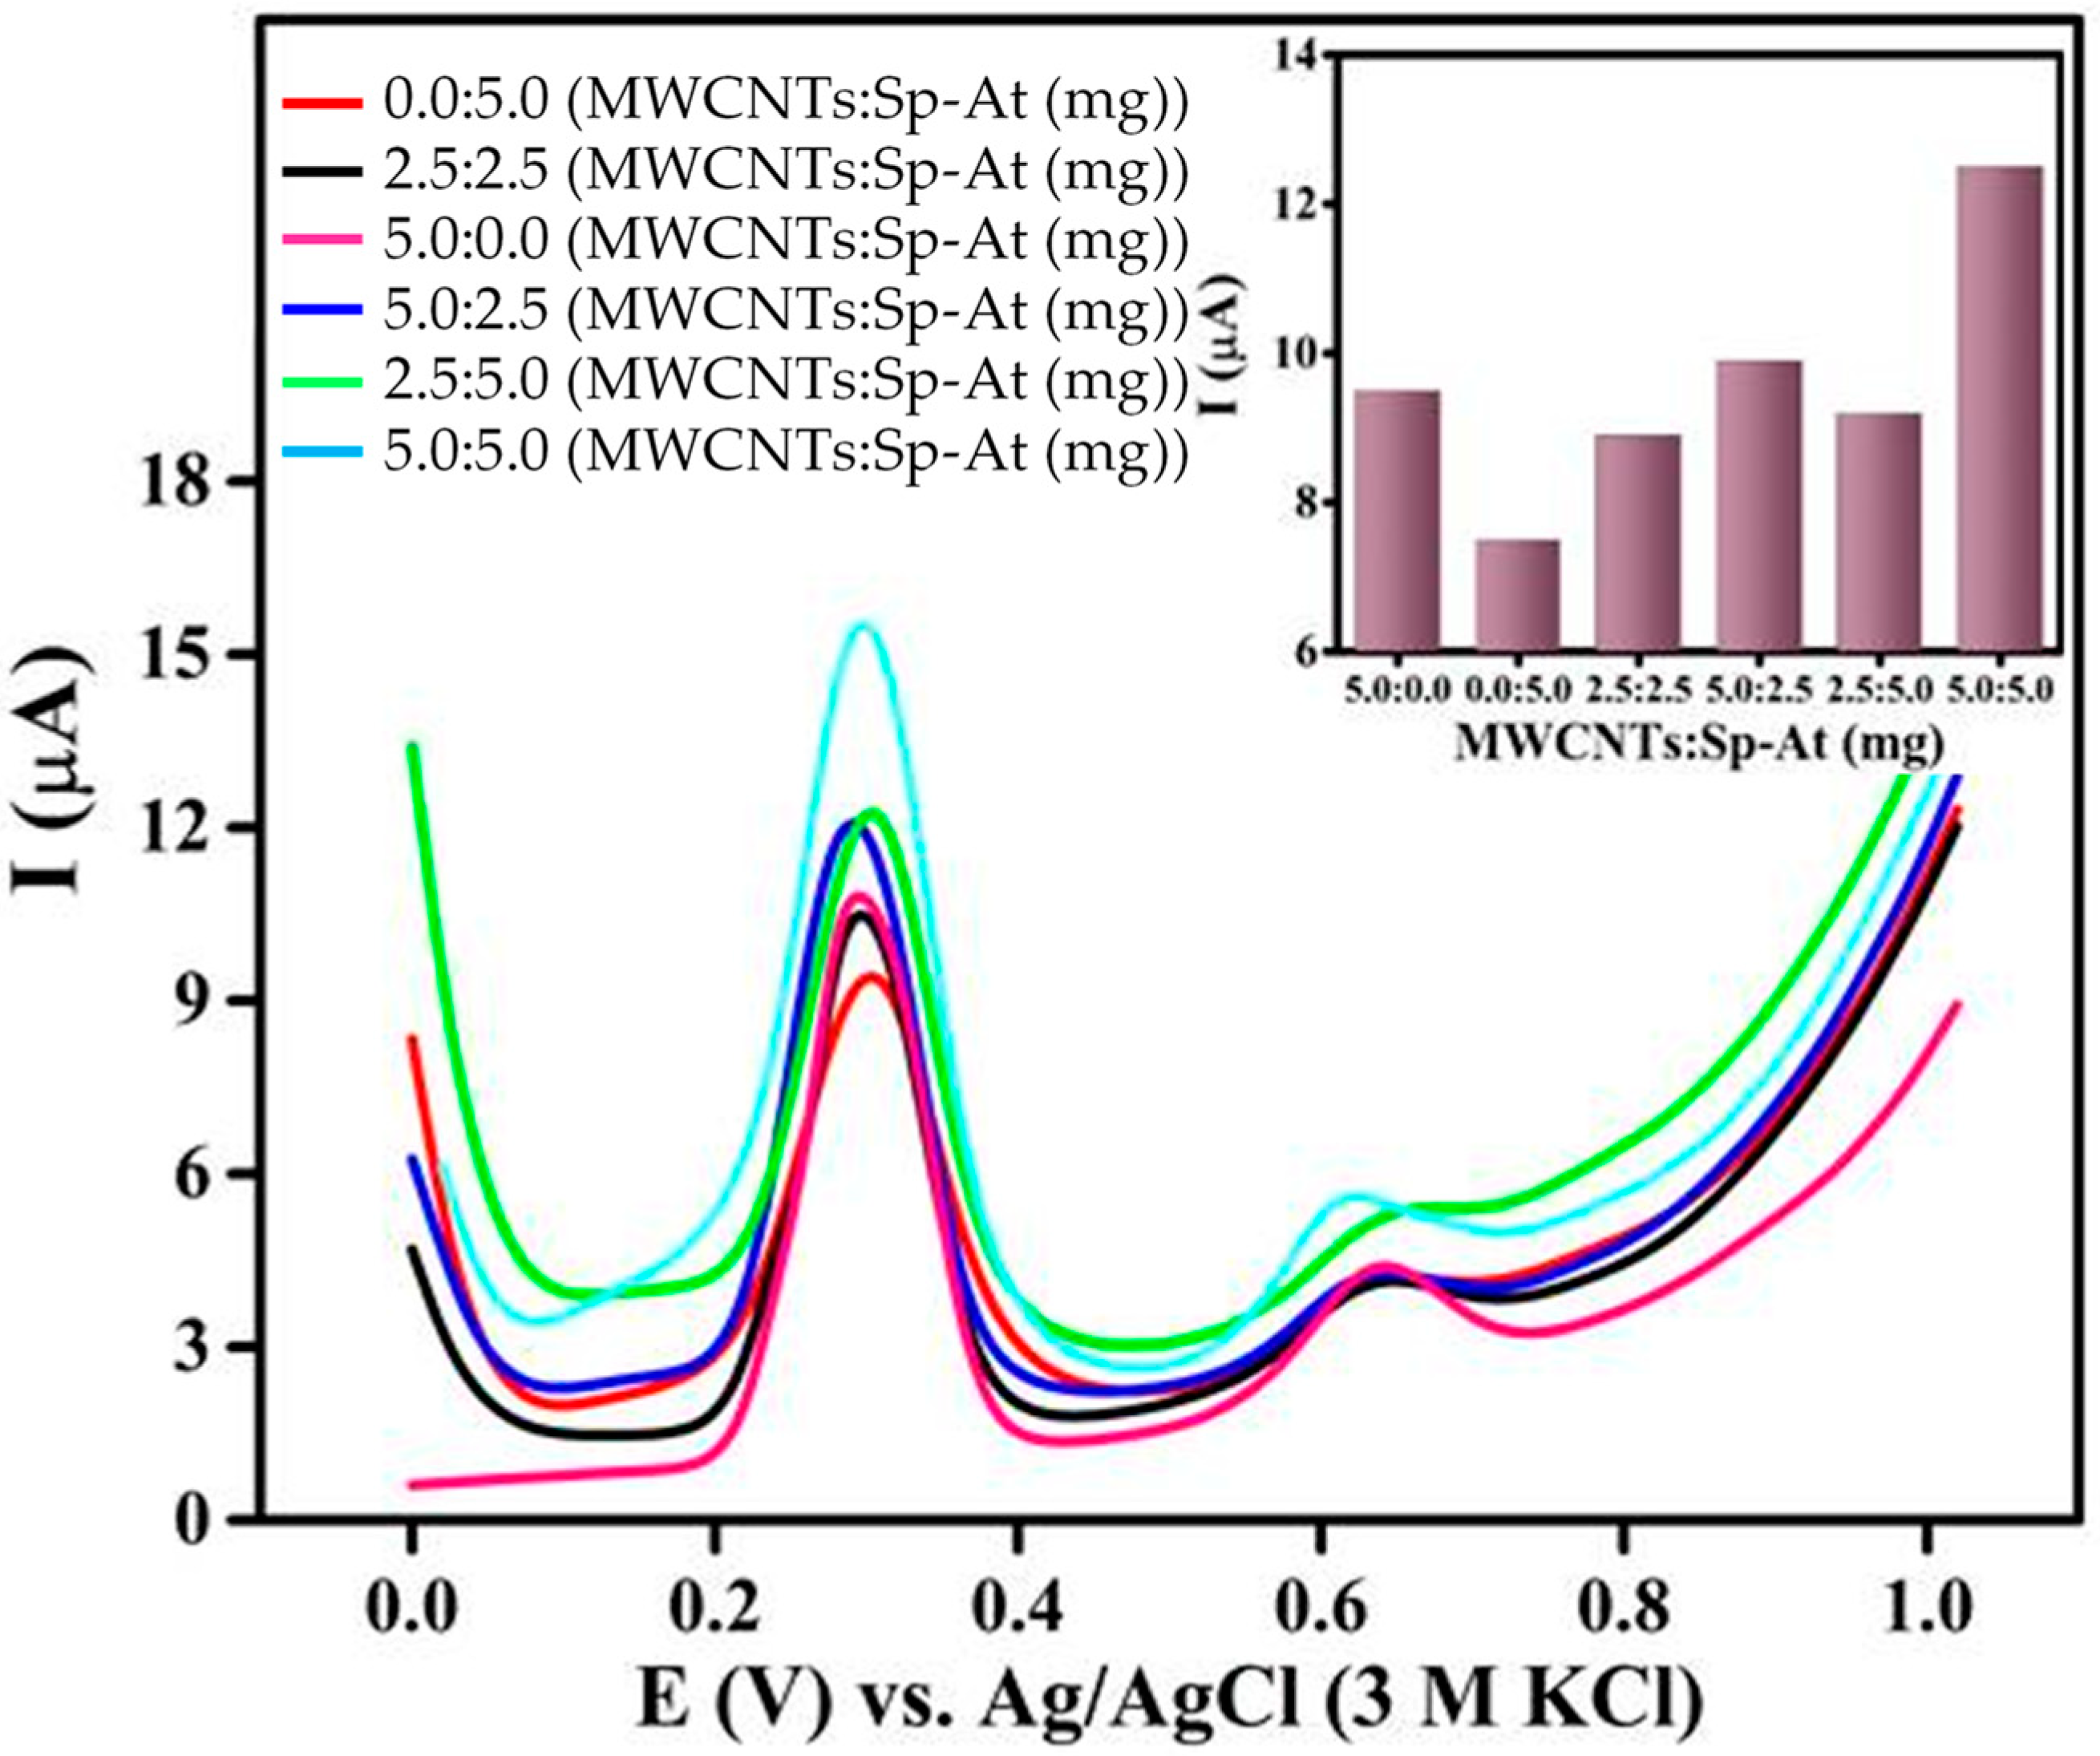
3.3. Optimization of Sp-At/MWCNTs/CPE Composition

It is well known that the electrochemical behavior of modified carbon paste electrodes strongly depends on the mixing ratio, the way of preparing the carbon pastes, the duration of grinding, and homogenization [58,59]. In this regard, to improve the efficiency of the proposed sensor based on Sp-At/MWCNTs/CPE for detecting GA, the ratio of MWCNTs and Sp-At powder as modifiers was optimized (Table 1). Six electrodes with different ratios of MWCNTs and Sp-At powder were prepared, and the DPVs of the prepared electrodes were recorded in 0.1 M phosphate buffer, pH 4, in the presence of 30 µM GA. Figure 3 shows the responses of different electrode compositions in the similar electrochemical conditions. As can be seen, the amount of the two modifiers played an important role in the response of the sensors to GA. MWCNTs as modifiers enhanced the oxidation current of GA due to their large surface area and electrical and electrocatalytic properties. On the other hand, the 3D microporous sponges provided a larger specific surface area for atacamite as an electrocatalyst, facilitating the diffusion of GA toward atacamite and improving the electron transfer between GA and atacamite. Thus, the synergistic effects of MWCNTs and 3D Sp-At lead to a remarkable improvement in the sensing performance of Sp-At/MWCNTs/CPE. According to the obtained results, the CPE containing 10% (in a ratio of 1:1) MWCNTs and Sp-At powder showed the maximum oxidation current.

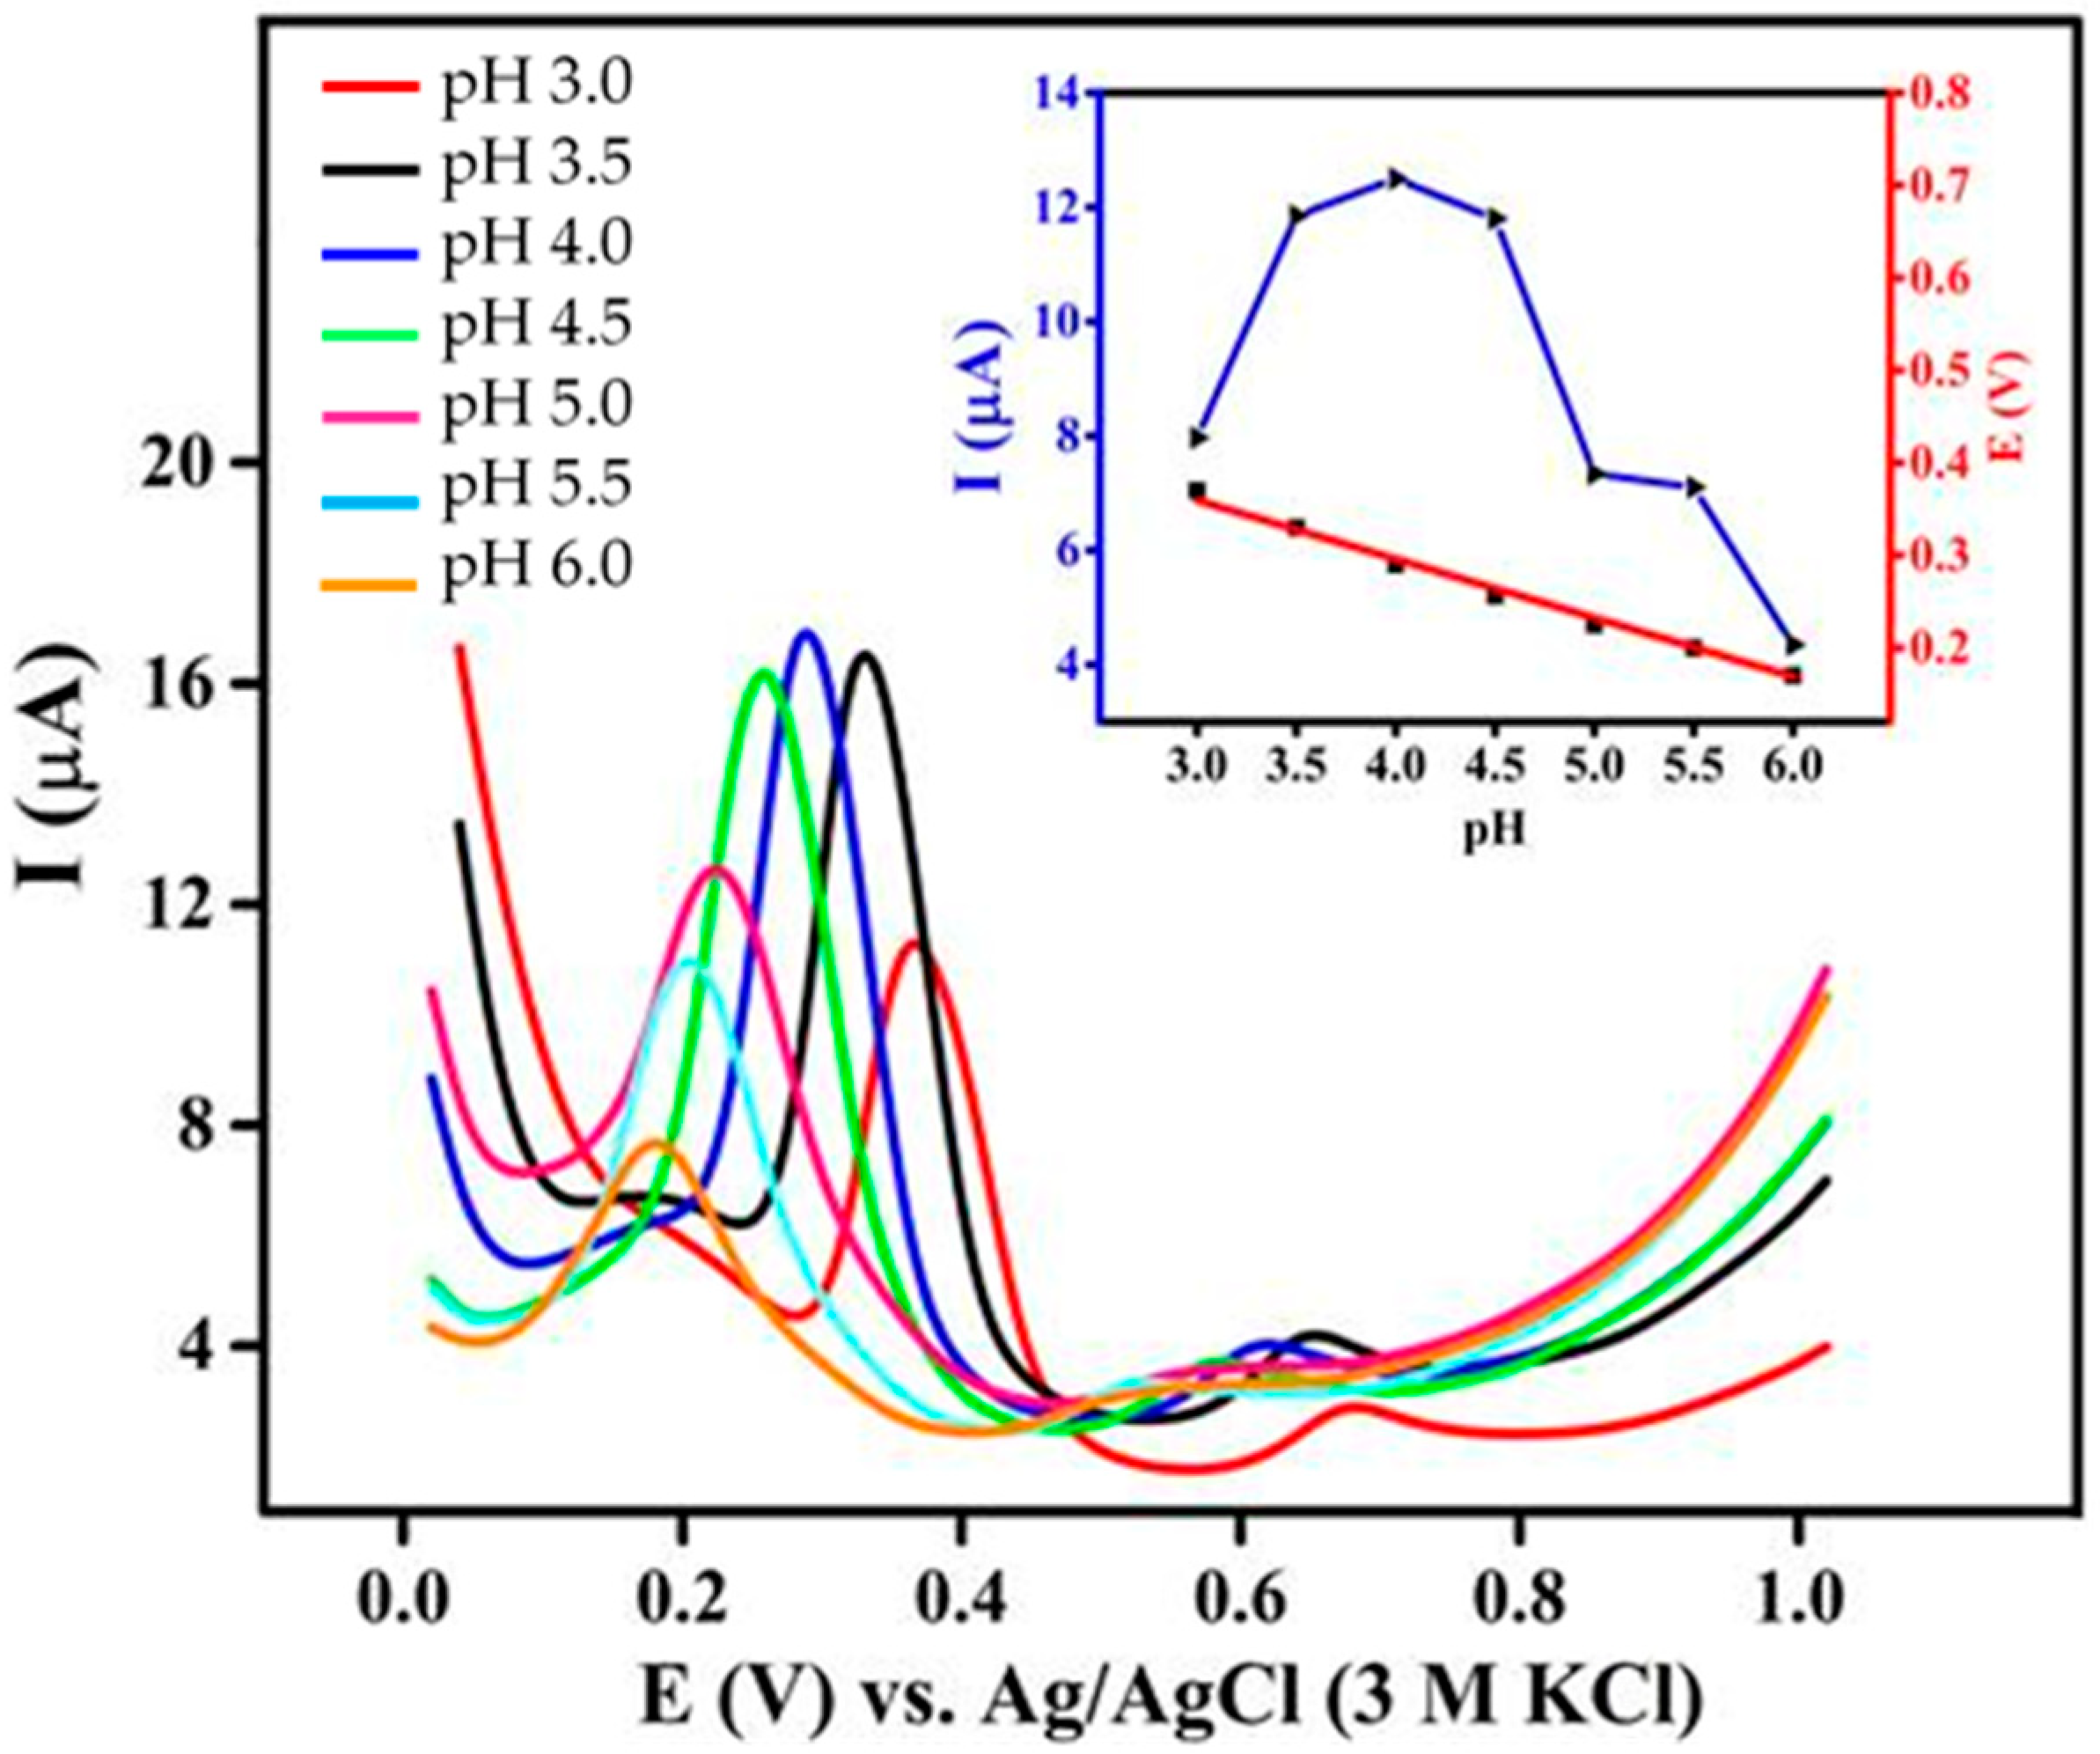
3.4. Influence of pH on GA Oxidation

The effect of pH on the oxidation of 30 μM GA was investigated in the pH range of 3–6 in 0.1 M phosphate buffer. It can be seen that GA oxidation was affected by the pH of phosphate buffer, which was due to the fact that GA oxidation was a protonation reaction (Figure 4). GA with a pKa of 4.4 was a weak acid and existed in the undissociated form in solution at lower pH values (pH < 4.4) and dissociated as the solution pH increased. Therefore, the maximum adsorption of GA on the surface of Sp-At/MWCNTs/CPE was expected to occur when GA was undissociated [30]. As shown in the inset of Figure 4 (blue), the anodic peak current (Ipa) reached a maximum value at pH 4 and then decreased with increasing pH to 6. This implies that the species were gradually deprotonated. Moreover, the peak anodic potentials shifted negatively with an average shift of 30 mV when the pH was increased, confirming that the electrode process was affected by the protonation reactions, as observed by other authors [55,60]. A linear regression line was obtained for the changing of peak potential (Ep) as a function of pH (Figure 4, inset; red) with a regression equation of Ep = −0.0661 pH + 0.5603 (R2 = 0.9929). The slope of −66 mV was in good agreement with the theoretical Nernstian systems with a mono-electron transfer step followed by single protonation [61].

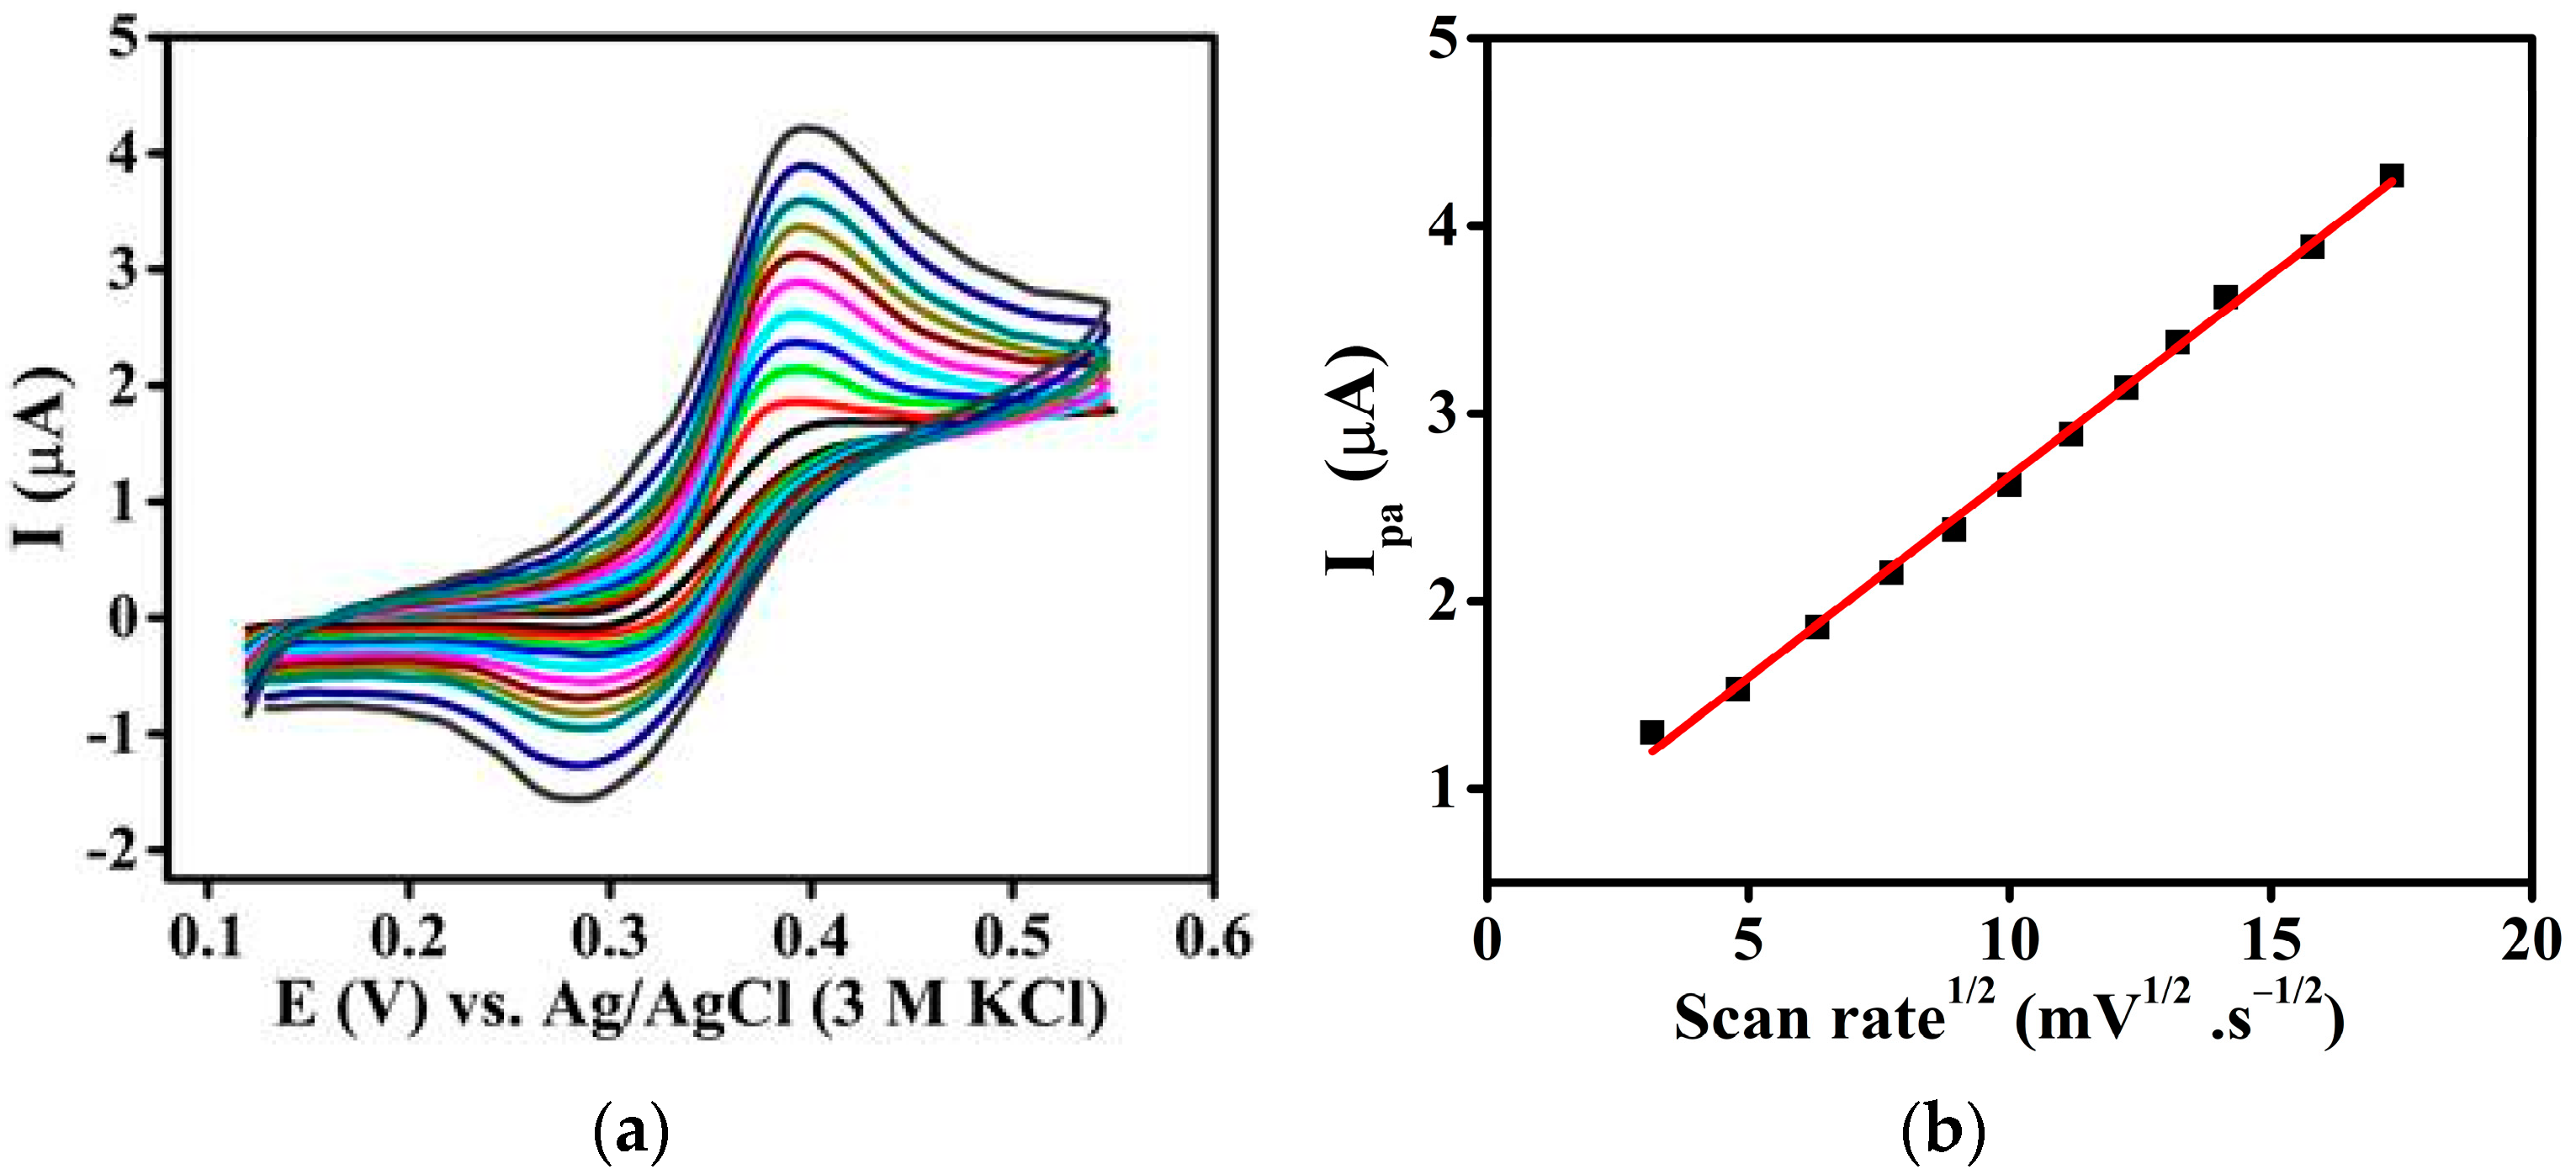
3.5. Scan Rate Influence on the Oxidation of GA

The GA oxidation reaction kinetics on the surface of Sp-At/MWCNTs/CPE was further evaluated by conducting CV measurements at different scan rates in 0.1 M phosphate buffer (pH 4) containing 30 μM GA solution. As can be observed, at low scan rates, a cathodic peak with very low current on the reverse sweep appeared, which indicated that the oxidized form of GA was not reduced at the surface of Sp-At/MWCNTs/CPE or maybe underwent a further chemical reaction. However, with increasing scan rate, the cathodic current increased, indicating that the oxidized form of GA was quasi-reversibly reduced before the chemical reaction [20,32]. From Figure 5a, it can be seen that the Ipa for GA oxidation increased as the scan rate rose from 20 to 300 mV·s−1. As exhibited in the Figure 5b, Ipa increased linearly in proportion to the square root of the scan rate with a linear regression equation of Ipa (μA) = 0.2147 ν1/2 (mV1/2 s−1/2) + 0.5186 (R2 = 0.9975). The R2 value of Ipa vs. the square root of the scan rate was almost equal to the theoretical value of 1.0, which was generally expected for a diffusion-controlled redox system, thus verifying that electrochemical oxidation of GA at the surface of Sp-At/MWCNTs/CPE is entirely diffusion controlled [62].

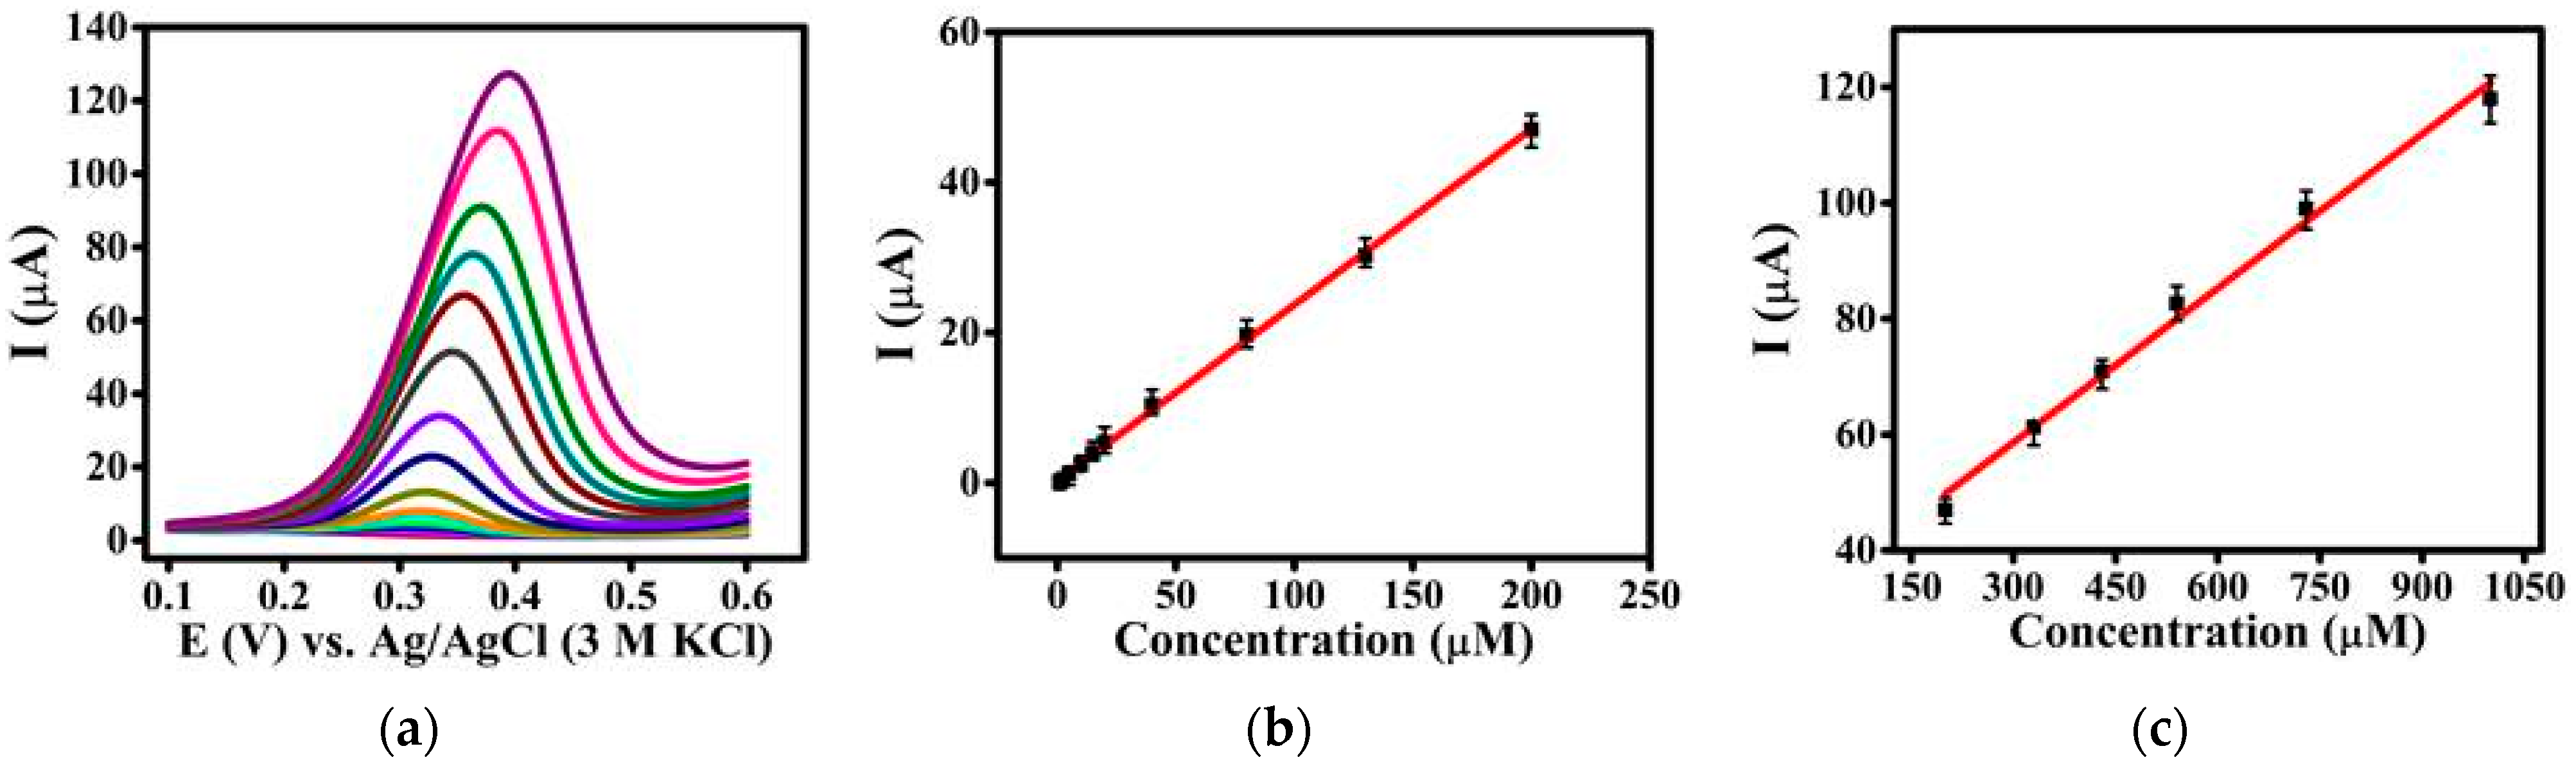
3.6. Quantification of GA by DPV

GA quantification was performed under the optimum experimental conditions (phosphate buffer (pH 4); Sp-At/MWCNTs/graphite/paraffin oil, 5:5:70:20 (W/W/W/W)). While the peak current increased by increasing the GA concentration, shift of the peak potentials towards more positive potentials was observed due to the generation of more electro-inactive oxidation species that block the electrode surface [61]. The calibration curves for the peak current versus the concentrations of GA were obtained at Sp-At/MWCNTs/CPE with two different linear parts. Figure 6b illustrates the first linear part, which was observed between 500 nM and 230 µM for lower GA concentrations with a linear regression equation as Ipa (µA) = 234.1 CGA (mM) + 0.299 (R2 = 0.9991), and Figure 6c shows the second linear part for higher GA concentrations between 230 µM and 1 mM with a linear regression equation of Ipa (µA) = 88.8 CGA (mM) + 32.024 (R2 = 0.9916). The sensitivity of the prepared GA sensor based on Sp-At/MWCNTs/CPE was calculated to be 18.6 μA mM−1 cm−2 at low concentrations and 7 μA mM−1 cm−2 at high concentrations of GA. The detection limit (LOD) and limit of quantitation (LOQ) were calculated from the LOD = 3 σ/m and LOQ = 10 σ/m equations, respectively (σ is the standard deviation of the signal in blank solution, and m is the slope of the calibration curve for lower GA concentrations). The LOD and LOQ values of Sp-At/MWCNTs/CPE were obtained as 5.4 nM and 17.9 nM, respectively, which were quite low in comparison to the other reported GA sensors [26,36,63]. The shift of the peak potential towards more positive potentials was due to the generation of electro-inactive oxidation species on increasing the GA concentration. These products blocked the electrode surface.

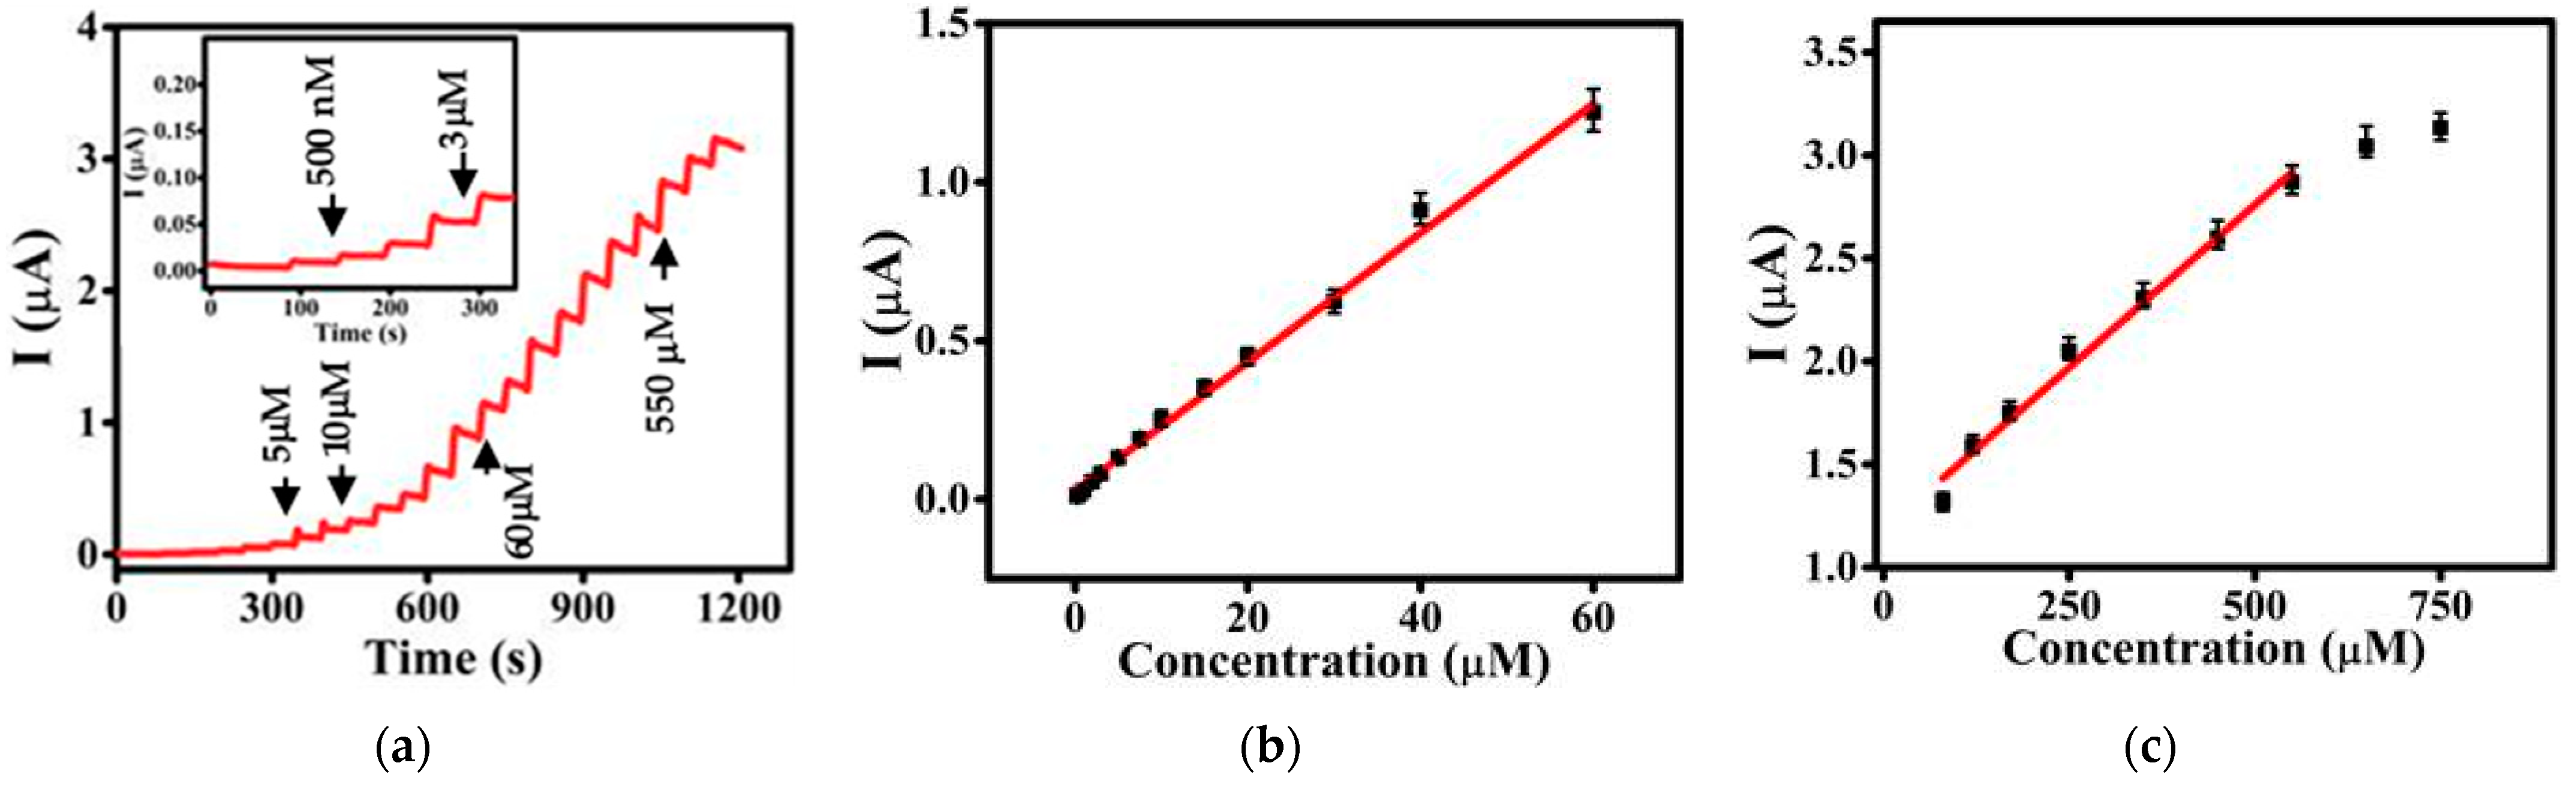
3.7. Quantification of GA by Amperometry

In amperometric studies, mass transfer occurs via diffusion and convection processes, which facilitate the quantitation of analytes at lower concentrations. The amperometric results under the optimized conditions for GA oxidation at 0.35 V are presented in Figure 7a. By increasing the GA concentration, the oxidation current increased. Figure 7b,c illustrates the corresponding calibration plots for GA consisting of two different slopes. The first linear section was found between 250 nM and 60 µM with an equation of Ipa (µA) = 20.7 CGA (mM) + 0.0238 (R2 = 0.9954), and the second linear part was found between 60 µM and 550 µM with an equation of Ipa (µA) = 3.3 CGA (mM) + 1.1295 (R2 = 0.9841). The sensitivity of the proposed GA sensor based on Sp-At/MWCNTs/CPE was evaluated as 1.64 μA mM−1 cm−2 at low concentrations and 0.26 μA mM−1 cm−2 at high concentrations, with a detection limit of 3.6 nM. These quantitative results clearly show that the fabricated Sp-At/MWCNTs/CPE-based sensor has excellent performance for GA determination. The extraordinary electronic properties of MWCNTs promote electron transfer in electrochemical reactions, and the large surface area and good crystalline structure of the 3D Sp-At porous scaffold offer a considerable number of interaction sites for such reactions, leading to the high-performance properties of the GA sensor. Table 2 summarizes the analytical performance characteristics of the Sp-At/MWCNTs/CPE with several previously reported GA sensors.

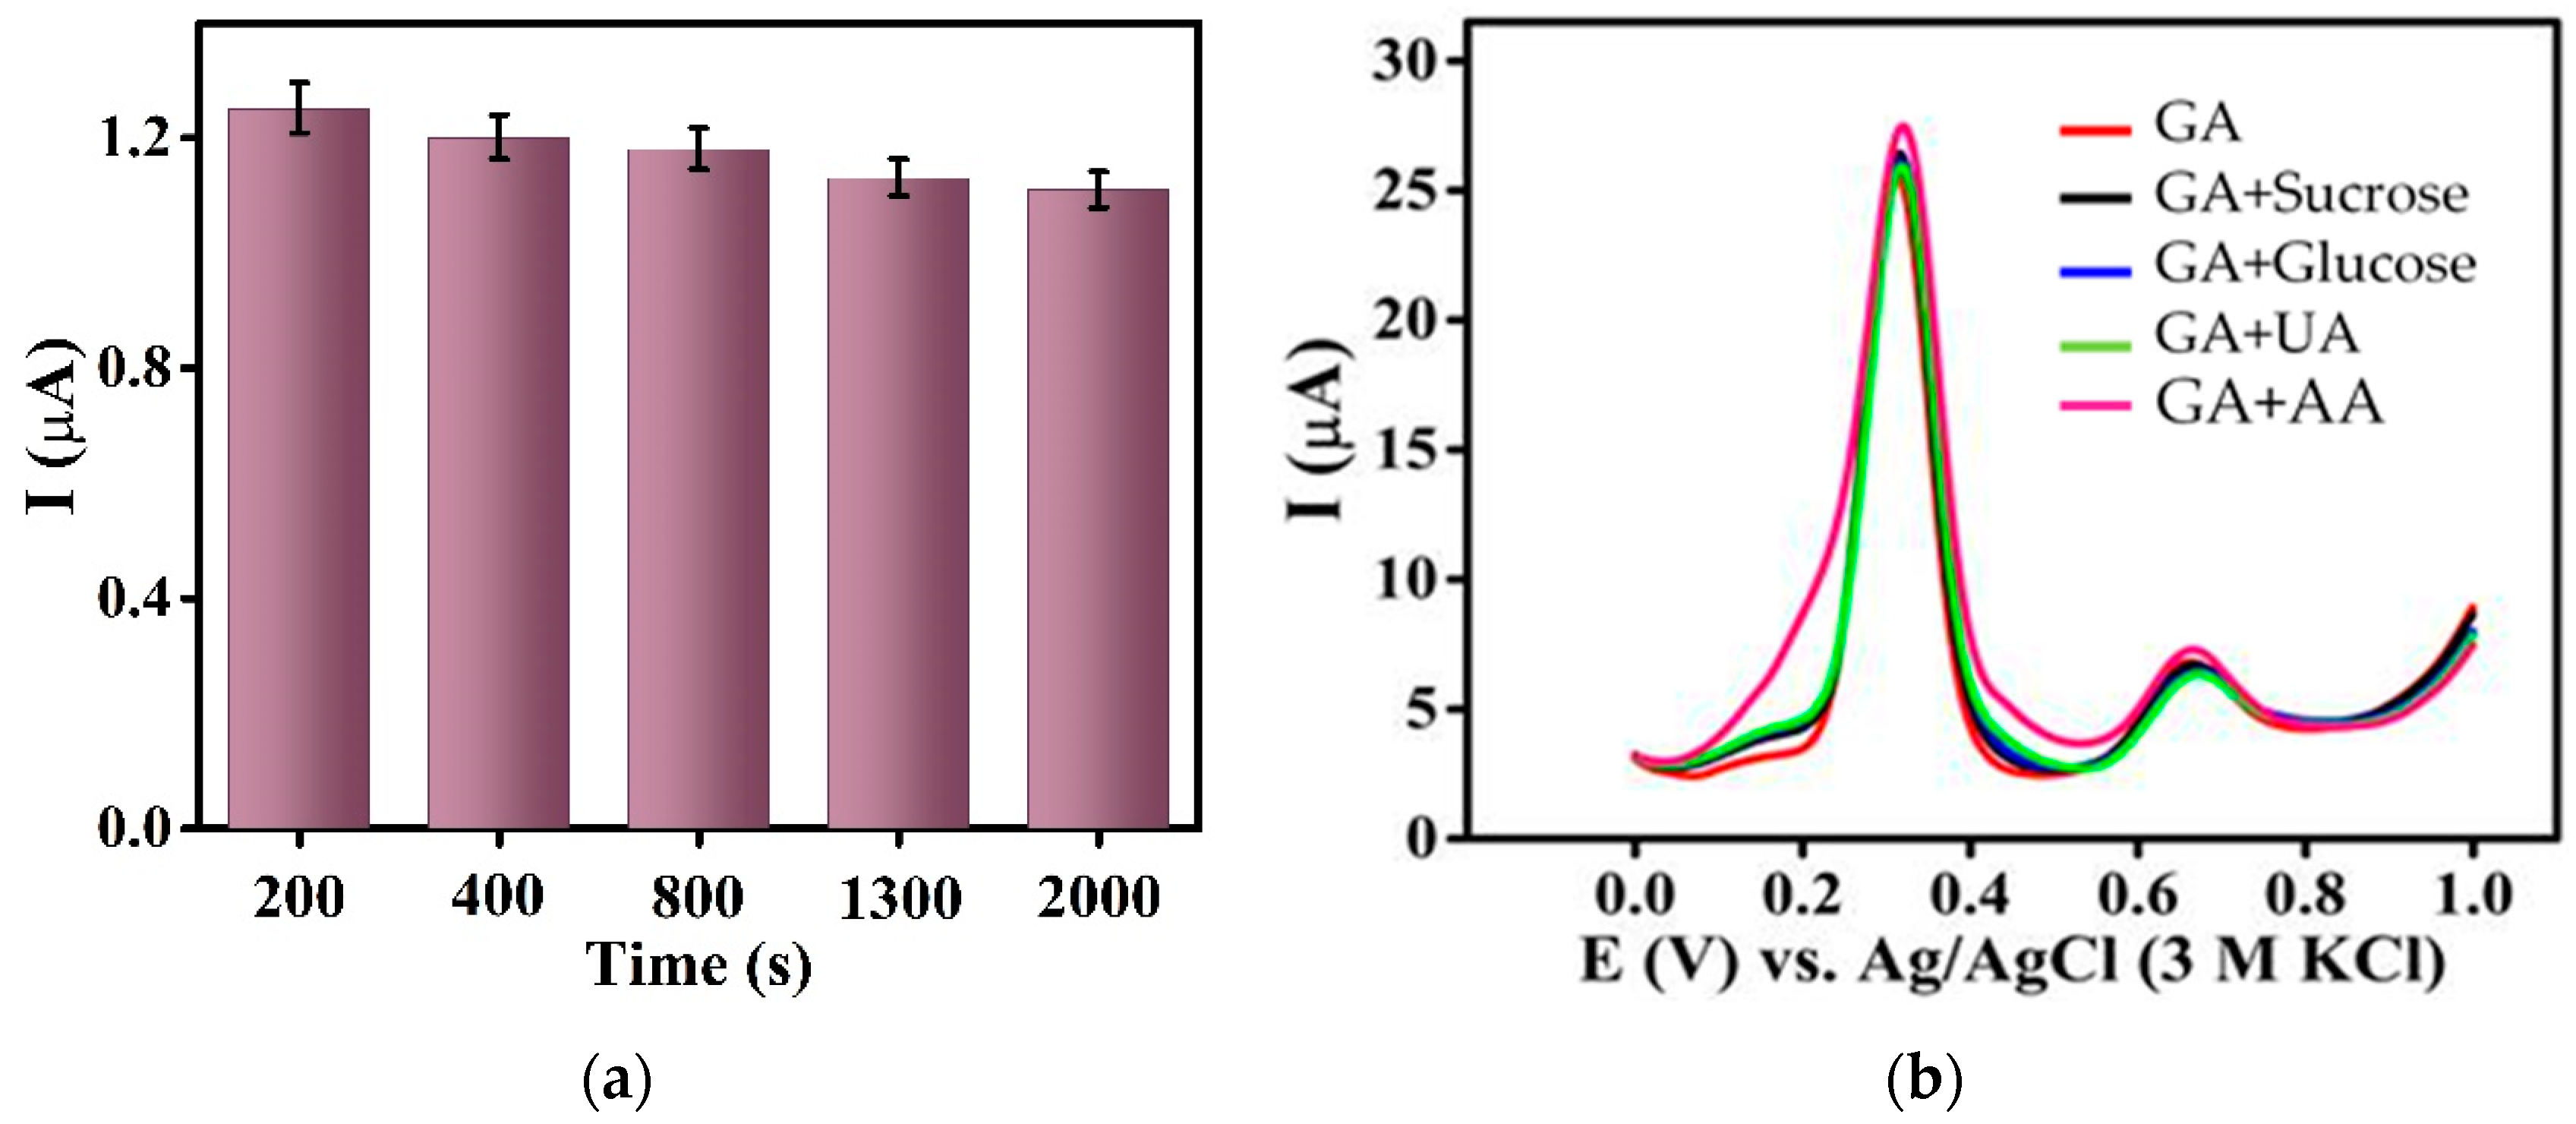
3.8. Stability, Reproducibility, and Selectivity of Sp-At/MWCNTs/CPE

Important factors such as selectivity, reproducibility, and stability were studied to estimate the proposed method’s applicability. To test the reproducibility, the DPV response of four Sp-At/MWCNTs/CPE fresh electrodes to 0.1 M phosphate buffer (pH 4) containing 30 μM GA was investigated (Figure S1). The relative standard deviation (RSD) of recorded anodic peak currents of four independently prepared electrodes was 4.22%, indicating that the fabricated sensors are excellent in terms of reproducibility. Similarly, in the repeatability test, eight consecutive measurements of 30 μM GA on one Sp-At/MWCNTs/CPE resulted in an RSD of 0.62%, confirming the favorable repeatability of the fabricated sensor (Figure S2). The long-term stability test was additionally assessed by DPV measurements of the Sp-At/MWCNTs/CPE in the presence of 30 μM GA. After one month, the current was still maintained at over 87% of its original value, signifying that the proposed sensor is notably stable (Figure S3). Moreover, the current response of Sp-At/MWCNTs/CPE was monitored at intervals of 2000 s after the injection of 30 μM GA. The amperometric current remained at 85% of its initial value after testing for 2000 s (Figure 8a). The specificity of the Sp-At/MWCNTs/CPE sensor was evaluated for 60 μM GA in the presence of 100-fold of possible coexistence species (sucrose, glucose, ascorbic acid (AA), and uric acid (UA)), which are usually presented along with GA [26,63]. As shown in Figure 8b, it can be found that these organic substances did not significantly impact the determination of GA. The Sp-At/MWCNTs/CPE sensor showed a relatively small peak current change, which was less than ±5%, suggesting excellent selectivity for the determination of GA. Considering that the oxidation of AA and UA occurred in the same potential window of GA, this selectivity could have been due to the structure of GA and the number of its hydroxyl groups. GA with three ionizable hydroxyl groups (compared to AA with two hydroxyl groups and uric acid without hydroxyl groups) forms both intra- (between hydroxyl groups) and intermolecular hydrogen bonds [68]. This hydrogen bonding ability contributes to GA diffusing and adsorbing more strongly than other coexisting species on the spongin scaffold (with different amino acids and consequently multiple functional groups such as SH, OH, NH2, and COOH) [51].

3.9. Determination of GA in Real Samples

Determination of GA content in black and green tea and red wine accomplished utilizing the Sp-At/MWCNTs/CPE sensor. The samples were prepared in 0.1 M phosphate buffer (pH 4) and then were spiked with standard GA solutions to obtain a GA range from 0 to 30 µM, followed by recording their corresponding DPV voltammograms (Figure S4). In all real samples (red wine, black tea, and green tea), GA was detected and quantified on the basis of the generated Ipa (Table 3), which is generally attributed to the total antioxidant capacity of the sample, as described [55]. More oxidation peaks were produced with increasing spiked GA concentrations in all samples. The obtained excellent recovery resulted in 95.2 to 102% (Table 3), confirming the applicability of the developed sensor for determining GA in beverages.

4. Conclusions

In summary, for the first time, renewable biopolymer spongin and atacamite in combination with MWCNTs (SP-At/MWCNTs) was successfully applied as a sensitive composite to fabricate a low-cost, easy, and reliable GA sensor. The SP-At/MWCNT composite enabled fast electron transfer, charge conduction, and efficient mass transport of GA on the surface of electrode. Further, the fabricated sensor based on SP-At/MWCNTs/CPE showed improved GA quantitation at a lower potential. Elevated sensitivity; acceptable selectivity among several interferences; a low detection limit; and a wide linear range with excellent stability, good repeatability, and reproducibility were realized. The developed sensor was applied successfully for determining GA in beverage samples such as black/green tea and red wine with satisfactory recovery results. The low cost, incorporation of a renewable biopolymer, ease of fabrication, and good stability make this approach attractive for the development of new sensing materials to quantify other phenolic compounds in food and beverage matrices.

Supplementary Materials

The following supporting information can be downloaded at https://www.mdpi.com/article/10.3390/bios13020262/s1. Figure S1. DPVs of Sp-At/MWCNTs/CPE in 0.1 M phosphate buffer pH 4 containing 30 μM GA at a scan rate of 0.1 V·s−1 (4 fresh electrodes). Figure S2. DPVs of Sp-At/MWCNTs/CPE in 0.1 M phosphate buffer pH 4 containing 30 μM GA at a scan rate of 0.1 V·s−1 (8 replicates). Figure S3. DPVs of Sp-At/MWCNTs/CPE in 0.1 M phosphate buffer pH 4 containing 30 μM GA at a scan rate of 0.1 V·s−1 (recorded within 30 days). Figure S4. DPVs of Sp-At/MWCNTs/CPE in 0.1 M phosphate buffer pH 4 containing (a) black tea sample, (b) green tea sample, and (c) red wine sample and increasing amounts of GA standard solutions. (d) Corresponding standard addition curves for determination of GA in samples.

Author Contributions

Y.J., H.E., P.R. and S.F. (Sedigheh Falahi) contributed to the conceptualization and methodology. P.R., S.F. (Sepideh Falahi) and S.F. (Sedigheh Falahi) performed the writing of the original draft. The design, review and editing were carried out by Y.J., M.Z., P.R. and S.F. (Sedigheh Falahi). All authors provided critical feedback and helped shape the research and manuscript. All authors have read and agreed to the published version of the manuscript.

Funding

Open access funding was received by the publication fund of the TU Bergakademie Freiberg.

Institutional Review Board Statement

Not applicable.

Informed Consent Statement

Not applicable

Data Availability Statement

Not applicable.

Conflicts of Interest

The authors declare no conflict of interest.

References

  1. Zehiroglu, C.; Ozturk Sarikaya, S.B. The importance of antioxidants and place in today’s scientific and technological studies. J. Food Sci. Technol. 2019, 56, 4757–4774. [Google Scholar] [CrossRef] [PubMed]
  2. Ahmadi, A.; Bagheri, D.; Hoseinifar, S.H.; Morshedi, V.; Paolucci, M. Beneficial role of polyphenols as feed additives on growth performances, immune response and antioxidant status of Lates Calcarifer (Bloch, 1790) juveniles. Aquaculture 2022, 552, 737955. [Google Scholar] [CrossRef]
  3. Lourenço, S.C.; Moldão-Martins, M.; Alves, V.D. Antioxidants of natural plant origins: From sources to food industry applications. Molecules 2019, 24, 4132. [Google Scholar] [CrossRef] [PubMed]
  4. Badea, M.; di Modugno, F.; Floroian, L.; Tit, D.M.; Restani, P.; Bungau, S.; Iovan, C.; Badea, G.E.; Aleya, L. Electrochemical strategies for gallic acid detection: Potential for application in clinical, food or environmental analyses. Sci. Total Environ. 2019, 672, 129–140. [Google Scholar] [CrossRef] [PubMed]
  5. Mediavilla, M.; Revenga-Parra, M.; Gutiérrez-Sánchez, C.; Hernández-Apaolaza, L.; Pariente, F.; Lorenzo, E. Fluorescent enzymatic assay for direct total polyphenol determination in food-related samples. Talanta 2022, 247, 123576. [Google Scholar] [CrossRef]
  6. Naczk, M.; Shahidi, F. Phenolics in cereals, fruits and vegetables: Occurrence, extraction and analysis. J. Pharm. Biomed. Anal. 2006, 41, 1523–1542. [Google Scholar] [CrossRef]
  7. Jiang, Y.; Pei, J.; Zheng, Y.; Miao, Y.-J.; Duan, B.-Z.; Huang, L.-F. Gallic Acid: A Potential anti-cancer agent. Chin. J. Integr. Med. 2022, 28, 661–671. [Google Scholar] [CrossRef]
  8. Variya, B.C.; Bakrania, A.K.; Patel, S.S. Antidiabetic potential of gallic acid from Emblica officinalis: Improved glucose transporters and insulin sensitivity through PPAR-γ and Akt signaling. Phytomedicine 2020, 73, 152906. [Google Scholar] [CrossRef]
  9. Kim, S.-H.; Jun, C.-D.; Suk, K.; Choi, B.-J.; Lim, H.; Park, S.; Lee, S.H.; Shin, H.-Y.; Kim, D.-K.; Shin, T.-Y. Gallic acid inhibits histamine release and pro-inflammatory cytokine production in mast cells. Toxicol. Sci. 2006, 91, 123–131. [Google Scholar] [CrossRef]
  10. Li, Z.-J.; Liu, M.; Dawuti, G.; Dou, Q.; Ma, Y.; Liu, H.-G.; Aibai, S. Antifungal activity of gallic acid in vitro and in vivo. Phytother. Res. 2017, 31, 1039–1045. [Google Scholar] [CrossRef]
  11. Dos Santos, J.F.S.; Tintino, S.R.; de Freitas, T.S.; Campina, F.F.; Menezes, I.R.D.A.; Siqueira-Júnior, J.P.; Coutinho, H.D.M.; Cunha, F.A.B. In vitro e in silico evaluation of the inhibition of Staphylococcus aureus efflux pumps by caffeic and gallic acid. Comp. Immunol. Microbiol. Infect. Dis. 2018, 57, 22–28. [Google Scholar] [CrossRef]
  12. Lim, K.S.; Park, J.-K.; Jeong, M.H.; Bae, I.H.; Park, D.S.; Shim, J.W.; Kim, J.H.; Kim, H.K.; Kim, S.S.; Sim, O.S.; et al. Anti-inflammatory effect of gallic acid-eluting stent in a porcine coronary restenosis model. Acta Cardiol. Sin. 2018, 34, 224–232. [Google Scholar] [CrossRef]
  13. Maya, S.; Prakash, T.; Madhu, K. Assessment of neuroprotective effects of gallic acid against glutamate-induced neurotoxicity in primary rat cortex neuronal culture. Neurochem. Int. 2018, 121, 50–58. [Google Scholar] [CrossRef] [PubMed]
  14. Akdemir, F.N.E.; Yildirim, S.; Kandemir, F.M.; Tanyeli, A.; Küçükler, S.; Dortbudak, M.B. Protective effects of gallic acid on doxorubicin-induced cardiotoxicity; an experimantal study. Arch. Physiol. Biochem. 2021, 127, 258–265. [Google Scholar] [CrossRef]
  15. Narumi, K.; Sonoda, J.-I.; Shiotani, K.; Shigeru, M.; Shibata, M.; Kawachi, A.; Tomishige, E.; Sato, K.; Motoya, T. Simultaneous detection of green tea catechins and gallic acid in human serum after ingestion of green tea tablets using ion-pair high-performance liquid chromatography with electrochemical detection. J. Chromatogr. B 2014, 945–946, 147–153. [Google Scholar] [CrossRef]
  16. López, M. Study of phenolic compounds as natural antioxidants by a fluorescence method. Talanta 2003, 60, 609–616. [Google Scholar] [CrossRef] [PubMed]
  17. Phakthong, W.; Liawruangrath, B.; Liawruangrath, S. Determination of gallic acid with rhodanine by reverse flow injection analysis using simplex optimization. Talanta 2014, 130, 577–584. [Google Scholar] [CrossRef]
  18. Yue, M.-E.; Jiang, T.-F.; Shi, Y.-P. Determination of gallic acid and salidroside in Rhodiola and its preparation by capillary electrophoresis. J. Anal. Chem. 2006, 61, 365–368. [Google Scholar] [CrossRef]
  19. Wang, X.; Wang, J.; Yang, N. Flow injection chemiluminescent detection of gallic acid in olive fruits. Food Chem. 2007, 105, 340–345. [Google Scholar] [CrossRef]
  20. Gao, Y.; Wang, L.; Zhang, Y.; Zou, L.; Li, G.; Ye, B. Highly sensitive determination of gallic acid based on a Pt nanoparticle decorated polyelectrolyte-functionalized graphene modified electrode. Anal. Methods 2016, 8, 8474–8482. [Google Scholar] [CrossRef]
  21. Munteanu, I.G.; Apetrei, C. A Review on Electrochemical sensors and biosensors used in assessing antioxidant activity. Antioxidants 2022, 11, 584. [Google Scholar] [CrossRef] [PubMed]
  22. Talarico, D.; Arduini, F.; Constantino, A.; Del Carlo, M.; Compagnone, D.; Moscone, D.; Palleschi, G. Carbon black as successful screen-printed electrode modifier for phenolic compound detection. Electrochem. Commun. 2015, 60, 78–82. [Google Scholar] [CrossRef]
  23. Niu, X.; Pei, W.-Y.; Ma, J.-C.; Yang, J.; Ma, J.-F. Simultaneous electrochemical detection of gallic acid and uric acid with p-tert-butylcalix4arene-based coordination polymer/mesoporous carbon composite. Mikrochim. Acta 2022, 189, 93. [Google Scholar] [CrossRef]
  24. Bitew, Z.; Kassa, A.; Misgan, B. Poly(diphenylamine-4-sulfonic acid) modified glassy carbon electrode for voltammetric determination of gallic acid in honey and peanut samples. Arab. J. Chem. 2022, 15, 103853. [Google Scholar] [CrossRef]
  25. Sarafraz, S.; RafieePour, H.; Khayatkashani, M.; Ebrahimi, A. Electrochemical determination of gallic acid in Camellia sinensis Viola odorata Commiphora mukul and Vitex agnus-castus by MWCNTs-COOH modified CPE. J. Nanostruct. 2019, 9, 384–395. [Google Scholar] [CrossRef]
  26. Madhusudhana; Manasa, G.; Bhakta, A.K.; Mekhalif, Z.; Mascarenhas, R.J. Bismuth-nanoparticles decorated multi-wall-carbon-nanotubes cast-coated on carbon paste electrode; an electrochemical sensor for sensitive determination of gallic acid at neutral pH. Mater. Sci. Energy Technol. 2020, 3, 174–182. [Google Scholar] [CrossRef]
  27. Ghoreishi, S.M.; Behpour, M.; Khayatkashani, M.; Motaghedifard, M.H. Simultaneous determination of ellagic and in Punica granatum, Myrtus communis and Itriphal formulation by an electrochemical sensor based on a paste electrode modified with multi-walled carbon nanotubes. Anal. Methods 2011, 3, 636–645. [Google Scholar] [CrossRef]
  28. Chikere, C.O.; Hobben, E.; Faisal, N.H.; Kong-Thoo-Lin, P.; Fernandez, C. Electroanalytical determination of gallic acid in red and white wine samples using cobalt oxide nanoparticles-modified carbon-paste electrodes. Microchem. J. 2021, 160, 105668. [Google Scholar] [CrossRef]
  29. Svancara, I.; Kalcher, K.; Walcarius, A.; Vytras, K. Electroanalysis with Carbon Paste Electrodes; CRC Press: Boca Raton, FL, USA, 2012; ISBN 9780429152078. [Google Scholar]
  30. Zamarchi, F.; Silva, T.R.; Winiarski, J.P.; Santana, E.R.; Vieira, I.C. Polyethylenimine-Based Electrochemical Sensor for the Determination of Caffeic Acid in Aromatic Herbs. Chemosensors 2022, 10, 357. [Google Scholar] [CrossRef]
  31. Chikere, C.O.; Faisal, N.H.; Kong-Thoo-Lin, P.; Fernandez, C. Interaction between Amorphous Zirconia Nanoparticles and Graphite: Electrochemical Applications for Gallic Acid Sensing Using Carbon Paste Electrodes in Wine. Nanomaterials 2020, 10, 537. [Google Scholar] [CrossRef] [PubMed] [Green Version]
  32. Tashkhourian, J.; Nami-Ana, S.F. A sensitive electrochemical sensor for determination of gallic acid based on SiO2 nanoparticle modified carbon paste electrode. Mater. Sci. Eng. C 2015, 52, 103–110. [Google Scholar] [CrossRef]
  33. Shojaei, S.; Nasirizadeh, N.; Entezam, M.; Koosha, M.; Azimzadeh, M. An electrochemical nanosensor based on molecularly imprinted polymer (MIP) for detection of gallic acid in fruit juices. Food Anal. Methods 2016, 9, 2721–2731. [Google Scholar] [CrossRef]
  34. Das, D.; Biswas, D.; Hazarika, A.K.; Sabhapondit, S.; Roy, R.B.; Tudu, B.; Bandyopadhyay, R. CuO nanoparticles decorated MIP-based electrode for sensitive determination of gallic acid in green tea. IEEE Sens. J. 2021, 21, 5687–5694. [Google Scholar] [CrossRef]
  35. Shahamirifard, S.A.; Ghaedi, M.; Razmi, Z.; Hajati, S. A simple ultrasensitive electrochemical sensor for simultaneous determination of gallic acid and uric acid in human urine and fruit juices based on zirconia-choline chloride-gold nanoparticles-modified carbon paste electrode. Biosens. Bioelectron. 2018, 114, 30–36. [Google Scholar] [CrossRef] [PubMed]
  36. Nazari, F.; Ghoreishi, S.M.; Khoobi, A. Bio-based Fe3O4/chitosan nanocomposite sensor for response surface methodology and sensitive determination of gallic acid. Int. J. Biol. Macromol. 2020, 160, 456–469. [Google Scholar] [CrossRef] [PubMed]
  37. Gawande, M.B.; Goswami, A.; Felpin, F.-X.; Asefa, T.; Huang, X.; Silva, R.; Zou, X.; Zboril, R.; Varma, R.S. Cu and Cu-based nanoparticles: Synthesis and applications in catalysis. Chem. Rev. 2016, 116, 3722–3811. [Google Scholar] [CrossRef] [PubMed]
  38. Falahi, S.; Jaafar, A.; Petrenko, I.; Zarejousheghani, M.; Ehrlich, H.; Rahimi, P.; Joseph, Y. High-performance three-dimensional spongin-atacamite biocomposite for electrochemical nonenzymatic glucose sensing. ACS Appl. Bio Mater. 2022, 5, 873–880. [Google Scholar] [CrossRef]
  39. Tsurkan, D.; Wysokowski, M.; Petrenko, I.; Voronkina, A.; Khrunyk, Y.; Fursov, A.; Ehrlich, H. Modern scaffolding strategies based on naturally pre-fabricated 3D biomaterials of poriferan origin. Appl. Phys. A 2020, 126, 382. [Google Scholar] [CrossRef]
  40. Khrunyk, Y.; Lach, S.; Petrenko, I.; Ehrlich, H. Progress in modern marine biomaterials research. Mar. Drugs 2020, 18, 589. [Google Scholar] [CrossRef]
  41. Ehrlich, H.; Wysokowski, M.; Żółtowska-Aksamitowska, S.; Petrenko, I.; Jesionowski, T. Collagens of poriferan Origin. Mar. Drugs 2018, 16, 79. [Google Scholar] [CrossRef] [Green Version]
  42. Jesionowski, T.; Norman, M.; Żółtowska-Aksamitowska, S.; Petrenko, I.; Joseph, Y.; Ehrlich, H. Marine spongin: Naturally prefabricated 3D scaffold-based biomaterial. Mar. Drugs 2018, 16, 88. [Google Scholar] [CrossRef]
  43. Zdarta, J.; Norman, M.; Smułek, W.; Moszyński, D.; Kaczorek, E.; Stelling, A.L.; Ehrlich, H.; Jesionowski, T. Spongin-based scaffolds from hippospongia communis demosponge as an effective support for lipase immobilization. Catalysts 2017, 7, 147. [Google Scholar] [CrossRef]
  44. Zdarta, J.; Katarzyna, A.; Robert, F.; Agnieszka, Z.-G.; Hermann, E.; Teofil, J. The effect of operational parameters on the biodegradation of bisphenols by Trametes versicolor laccase immobilized on Hippospongia communis spongin scaffolds. Sci. Total Environ. 2018, 615, 784–795. [Google Scholar] [CrossRef]
  45. Petrenko, I.; Summers, A.P.; Simon, P.; Żółtowska-Aksamitowska, S.; Motylenko, M.; Schimpf, C.; Rafaja, D.; Roth, F.; Kummer, K.; Brendler, E.; et al. Extreme biomimetics: Preservation of molecular detail in centimeter-scale samples of biological meshes laid down by sponges. Sci. Adv. 2019, 5, eaax2805. [Google Scholar] [CrossRef]
  46. Ehrlich, H.; Wysokowski, M.; Jesionowski, T. The philosophy of extreme biomimetics. Sustain. Mater. Technol. 2022, 32, e00447. [Google Scholar] [CrossRef]
  47. Szatkowski, T.; Siwińska-Stefańska, K.; Wysokowski, M.; Stelling, A.L.; Joseph, Y.; Ehrlich, H.; Jesionowski, T. Immobilization of titanium(IV) oxide onto 3D spongin scaffolds of marine sponge origin according to extreme biomimetics principles for removal of C.I. basic blue 9. Biomimetics 2017, 2, 4. [Google Scholar] [CrossRef]
  48. Szatkowski, T.; Kopczyński, K.; Motylenko, M.; Borrmann, H.; Mania, B.; Graś, M.; Lota, G.; Bazhenov, V.V.; Rafaja, D.; Roth, F.; et al. Extreme biomimetics: A carbonized 3D spongin scaffold as a novel support for nanostructured manganese oxide(IV) and its electrochemical applications. Nano Res. 2018, 11, 4199–4214. [Google Scholar] [CrossRef]
  49. Szatkowski, T.; Wysokowski, M.; Lota, G.; Pęziak, D.; Bazhenov, V.V.; Nowaczyk, G.; Walter, J.; Molodtsov, S.L.; Stöcker, H.; Himcinschi, C.; et al. Novel nanostructured hematite–spongin composite developed using an extreme biomimetic approach. RSC Adv. 2015, 5, 79031–79040. [Google Scholar] [CrossRef]
  50. Akbari, M.; Jafari, H.; Rostami, M.; Mahdavinia, G.R.; Nasab, A.S.; Tsurkan, D.; Petrenko, I.; Ganjali, M.R.; Rahimi-Nasrabadi, M.; Ehrlich, H. Adsorption of cationic dyes on a magnetic 3D spongin scaffold with nano-sized Fe3O4 cores. Mar. Drugs 2021, 19, 512. [Google Scholar] [CrossRef]
  51. Tsurkan, D.; Simon, P.; Schimpf, C.; Motylenko, M.; Rafaja, D.; Roth, F.; Inosov, D.S.; Makarova, A.A.; Stepniak, I.; Petrenko, I.; et al. Extreme Biomimetics: Designing of the first nanostructured 3D spongin-atacamite composite and its application. Adv. Mater. 2021, 33, e2101682. [Google Scholar] [CrossRef] [PubMed]
  52. Sajjadi, S.; Ghourchian, H.; Rafiee-Pour, H.-A.; Rahimi, P. Accelerating the electron transfer of choline oxidase using ionic-liquid/NH2-MWCNTs nano-composite. J. Iran. Chem. Soc. 2012, 9, 111–119. [Google Scholar] [CrossRef]
  53. Sajjadi, S.; Ghourchian, H.; Rahimi, P. Different behaviors of single and multi wall carbon nanotubes for studying electrochemistry and electrocatalysis of choline oxidase. Electrochim. Acta 2011, 56, 9542–9548. [Google Scholar] [CrossRef]
  54. Wang, L.; Wang, Y.; Zhuang, Q. Simple self-referenced ratiometric electrochemical sensor for dopamine detection using electrochemically pretreated glassy carbon electrode modified by acid-treated multiwalled carbon nanotube. J. Electroanal. Chem. 2019, 851, 113446. [Google Scholar] [CrossRef]
  55. Souza, L.P.; Calegari, F.; Zarbin, A.J.G.; Marcolino-Junior, L.H.; Bergamini, M.F. Voltammetric determination of the antioxidant capacity in wine samples using a carbon nanotube modified electrode. J. Agric. Food Chem. 2011, 59, 7620–7625. [Google Scholar] [CrossRef] [PubMed]
  56. Sun, S.; Zhang, X.; Sun, Y.; Yang, S.; Song, X.; Yang, Z. Facile water-assisted synthesis of cupric oxide nanourchins and their application as nonenzymatic glucose biosensor. ACS Appl. Mater. Interfaces 2013, 5, 4429–4437. [Google Scholar] [CrossRef]
  57. Wang, L.; Jia, S.; Wang, N.; Cao, X. Atom-diffusion enhanced electrocatalytic activity toward glucose oxidation on atacamite nanorods. Int. J. Nanomanuf. 2016, 12, 298. [Google Scholar] [CrossRef]
  58. Khadem, M.; Faridbod, F.; Norouzi, P.; Rahimi Foroushani, A.; Ganjali, M.R.; Shahtaheri, S.J.; Yarahmadi, R. Modification of carbon paste electrode based on molecularly imprinted polymer for electrochemical determination of diazinon inbiological and environmental samples. Electroanalysis 2017, 29, 708–715. [Google Scholar] [CrossRef]
  59. Švancara, I.; Schachil, K. Testinf of unmodified carbon paste electrodes. Chem. Listy 1999, 93, 490–499. [Google Scholar]
  60. Ganesh, H.V.S.; Patel, B.R.; Fini, H.; Chow, A.M.; Kerman, K. Electrochemical Detection of gallic acid-capped gold nanoparticles using a multiwalled carbon nanotube-reduced graphene oxide nanocomposite electrode. Anal. Chem. 2019, 91, 10116–10124. [Google Scholar] [CrossRef]
  61. Abdel-Hamid, R.; Newair, E.F. Electrochemical behavior of antioxidants: I. Mechanistic study on electrochemical oxidation of gallic acid in aqueous solutions at glassy-carbon electrode. J. Electroanal. Chem. 2011, 657, 107–112. [Google Scholar] [CrossRef]
  62. Feminus, J.J.; Manikandan, R.; Narayanan, S.S.; Deepa, P.N. Determination of gallic acid using poly(glutamic acid): Graphene modified electrode. J. Chem. Sci. 2019, 131, 11. [Google Scholar] [CrossRef] [Green Version]
  63. Zhao, H.; Ran, Q.; Li, Y.; Li, B.; Liu, B.; Ma, H.; Zhang, M.; Komarneni, S. Highly sensitive detection of gallic acid based on 3D interconnected porous carbon nanotubes/carbon nanosheets modified glassy carbon electrode. J. Mater. Res. Technol. 2020, 9, 9422–9433. [Google Scholar] [CrossRef]
  64. Chen, J.; Chen, Y.; Li, S.; Yang, J.; Dong, J. In-situ growth of cerium-based metal organic framework on multi-walled carbon nanotubes for electrochemical detection of gallic acid. Colloids Surf. A Physicochem. Eng. Asp. 2022, 650, 129318. [Google Scholar] [CrossRef]
  65. Sekar, S.; Huijun, J.; Liuzhu, Z.; Jin, C.; Lee, S.; Kim, D.Y.; Manikandan, R. Copper phthalocyanine conjugated graphitic carbon nitride nanosheets as an efficient electrocatalyst for simultaneous detection of natural antioxidants. Electrochim. Acta 2022, 413, 140150. [Google Scholar] [CrossRef]
  66. Alipour, E.; Mirzae Bolali, F.; Norouzi, S.; Saadatirad, A. Electrochemically activated pencil lead electrode as a sensitive voltammetric sensor to determine gallic acid. Food Chem. 2022, 375, 131871. [Google Scholar] [CrossRef] [PubMed]
  67. Węgiel, J.; Burnat, B.; Skrzypek, S. A graphene oxide modified carbon ceramic electrode for voltammetric determination of gallic acid. Diam. Relat. Mater. 2018, 88, 137–143. [Google Scholar] [CrossRef]
  68. Badhani, B.; Sharma, N.; Kakkar, R. Gallic acid: A versatile antioxidant with promising therapeutic and industrial applications. RSC Adv. 2015, 5, 27540–27557. [Google Scholar] [CrossRef]
Figure 1. DPVs of CPE, Sp-At/CPE, MWCNTs/CPE, and Sp-At/MWCNTs/CPE in 0.1 M phosphate buffer (pH 4) at a scan rate of 0.1 V·s−1 in the (a) absence of GA and (b) presence of 30 μM GA.
Biosensors 13 00262 g001
Scheme 1. Proposed pathway for electrochemical oxidation of GA.
Biosensors 13 00262 sch001
Figure 2. Nyquist plots of CPE, Sp-At/CPE, MWCNTs/CPE, and Sp-At/MWCNTs/CPE in a solution of 0.1 M KCl containing 5 mM [Fe(CN)6]3−/4− at the frequency range of 0.1 Hz–100 kHz, applied potential of 0.23 V and an amplitude of 5 mV. Inset: The Randles-equivalent circuit model.
Biosensors 13 00262 g002
Figure 3. Effect of the MWCNTs/Sp-At ratio on GA oxidation (DPVs recorded in 0.1 M phosphate buffer, pH 4, containing 30 μM GA at a scan rate of 0.1 V·s−1). Inset: bar graphs corresponding to each electrode current response.
Biosensors 13 00262 g003
Figure 4. DPVs of 0.1 M phosphate buffer (pH of 3, 3.5, 4, 4.5, 5, 5.5, and 6) containing 30 μM GA at a scan rate of 0.1 V·s−1. Inset: effect of pH on oxidation peak current (blue) and oxidation peak potential (red).
Biosensors 13 00262 g004
Figure 5. (a) CVs of Sp-At/MWCNTs/CPE in 0.1 M phosphate buffer (pH 4) containing 30 μM GA at different scan rates (20–300 mV·s−1). (b) The plot of the relationship between Ipa and the square root of the scan rate.
Biosensors 13 00262 g005
Figure 6. (a) DPV responses of Sp-At/MWCNTs/CPE with successive additions of different concentrations of GA from 500 nM to 1 mM in 0.1 M phosphate buffer (pH 4) at a scan rate of 0.1 V·s−1, pulse amplitude of 0.1 V, and pulse time of 0.02 s; current–GA concentration calibration curve for (b) low and (c) high concentrations of GA.
Biosensors 13 00262 g006
Figure 7. (a) Amperometric response of Sp-At/MWCNTs/CPE with successive additions of different concentrations of GA from 250 nM to 550 μM in 0.1 M phosphate buffer (pH 4) at 0.35 V. Inset: partial magnified view of the calibration curve for low concentrations of GA from 250 nM to 3 μM. The current-GA concentration calibration curve for (b) low and (c) high concentrations of GA.
Biosensors 13 00262 g007
Figure 8. (a) Stability for long-term testing. (b) Interference test of 60 μM GA with 0.6 mM of some known interfering species.
Biosensors 13 00262 g008
Table 1. Different CPE component ratios.
CPE No.MWCNTs
(%W)
Sp-At
(%W)
Graphite
(%W)
Paraffin Oil
(%W)
15.00.07520
20.05.07520
32.52.57520
45.02.572.520
52.55.072.520
65.05.07020
7--8020
Table 2. Comparison between various electroanalytical methods for the determination of GA in real samples.
ElectrodeMethodSampleLRLODRef.
Cerium-based metal organic framework on multi-walled carbon nanotubes) modified GCE (CeMOF/MWCNTs/GCE)DPVTea1.5–200 μM0.14 μM[64]
Poly(diphenylamine-4-sulfonic acid) modified GCE
(poly(DPASA)/GCE)
CVHoney and peanut0.5–0.3 mM4.35 nM[24]
Copper-phthalocyanine-conjugated graphitic-carbon-nitride-nanosheet-modified ITO 1
(CuPTc/g-C3N4Ns/ITO)
DPVFruit juice, alcoholic beverages, and tea10–445 nM0.5 nM[65]
Activated pencil lead electrode (APLE)DPVBlack/green tea and mango juice0.49–830 µM0.25 µM[66]
Fe3O4/chitosan/CPEDPVGreen tea0.5–300.0 μM12.1 nM[36]
Bismuth-nanoparticle-decorated MWCNT/CPE
(Bi-MWCNT/MCPE)
ChronoamperometryClove and green tea1.0–100.0 μM0.16 µM[26]
Reduced-graphene-oxide-modified carbon ceramic electrode (RGO)SWV 2Red wine and black/white tea0.51–46.40 μM86 nM[67]
(Sp-At/MWCNTs/CPE)Amperometry
DPV
Black/green tea and red wine0.25–550 μM
0.5–1000 µM
3.6 nM
5.4 nM
This work
1 Indium tin oxide. 2 Square wave voltammetry.
Table 3. Results of the analysis of GA in black/green tea and red wine.
SampleSpiked (μM)Detected GA (μM)Recovery (%)RSD (%)
Black tea-30.7-3.2
1040.698.22.3
3059.9972.6
Green tea-31.2-3.6
1041982.9
30621023.5
Red wine-18.2-4
1027.895.23.3
3047.497.13.5
Disclaimer/Publisher’s Note: The statements, opinions and data contained in all publications are solely those of the individual author(s) and contributor(s) and not of MDPI and/or the editor(s). MDPI and/or the editor(s) disclaim responsibility for any injury to people or property resulting from any ideas, methods, instructions or products referred to in the content.

