A Direct Catalytic Ethanol Fuel Cell (DCEFC) Modified by LDHs, or by Catalase-LDHs, and Improvement in Its Kinetic Performance: Applications for Human Saliva and Disinfectant Products for COVID-19

 ,
,  , , and
Abstract
:1. Introduction
2. Materials and Methods
2.1. Apparatus
2.2. Measurement Format
2.3. Measurements in Real Samples by Fuel Cell
2.4. Reagents, Materials, and Real Samples
2.5. LDH Preparation and Characterization
3. Results and Discussion
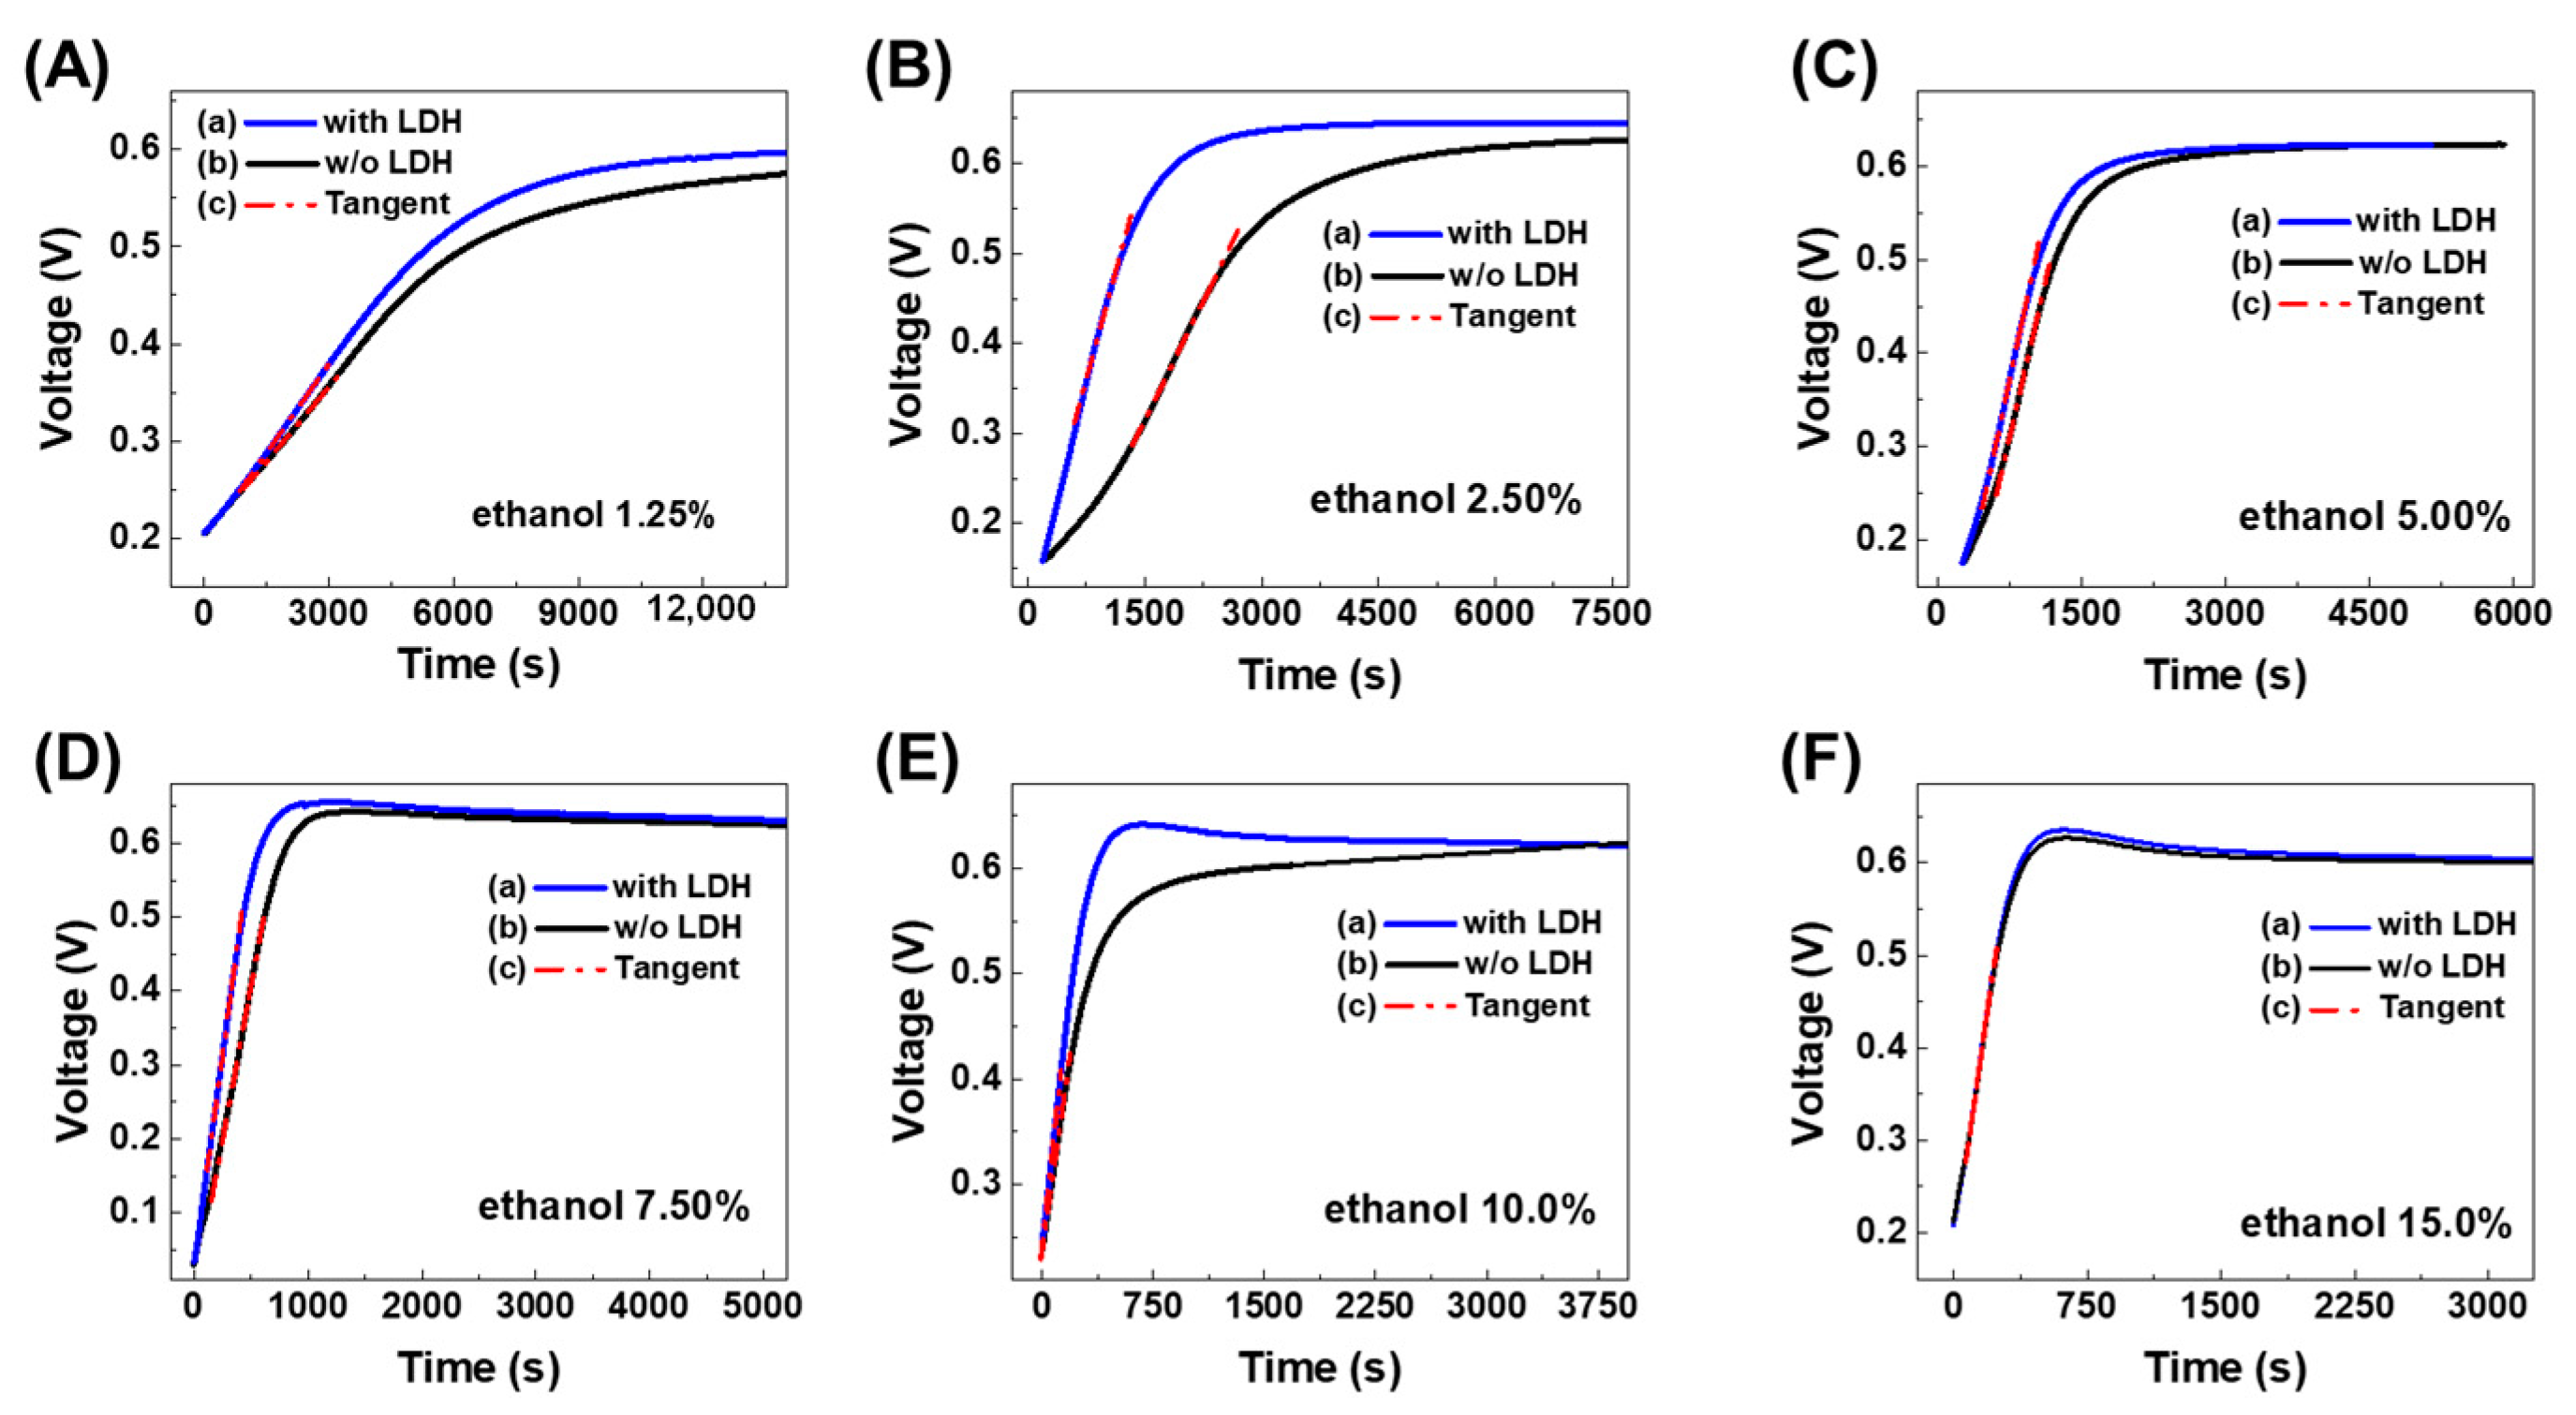
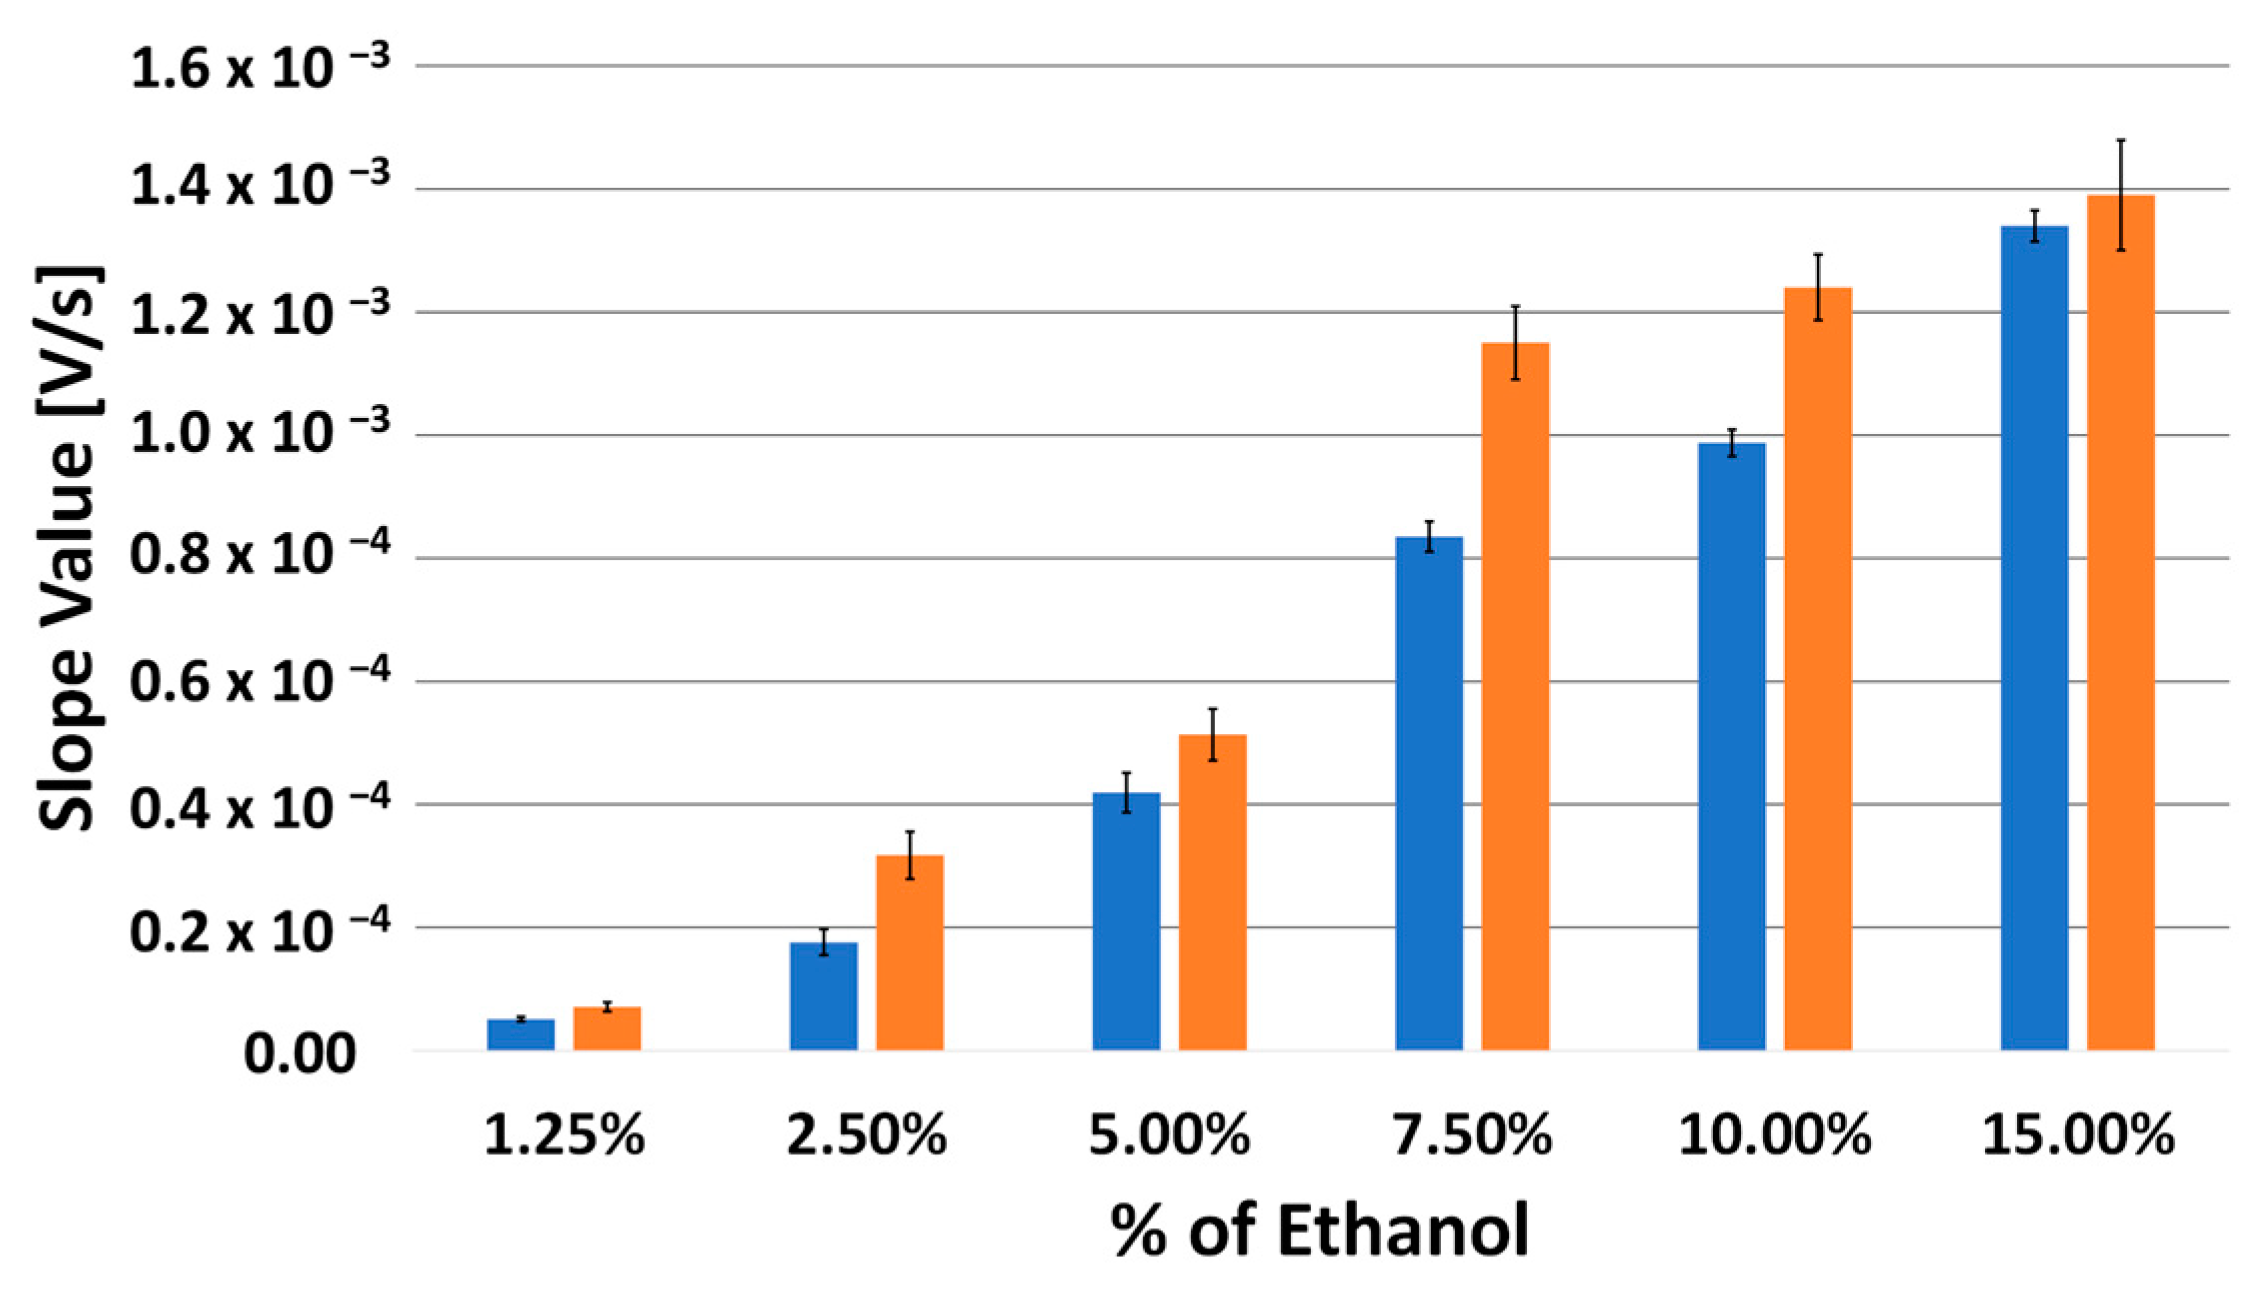
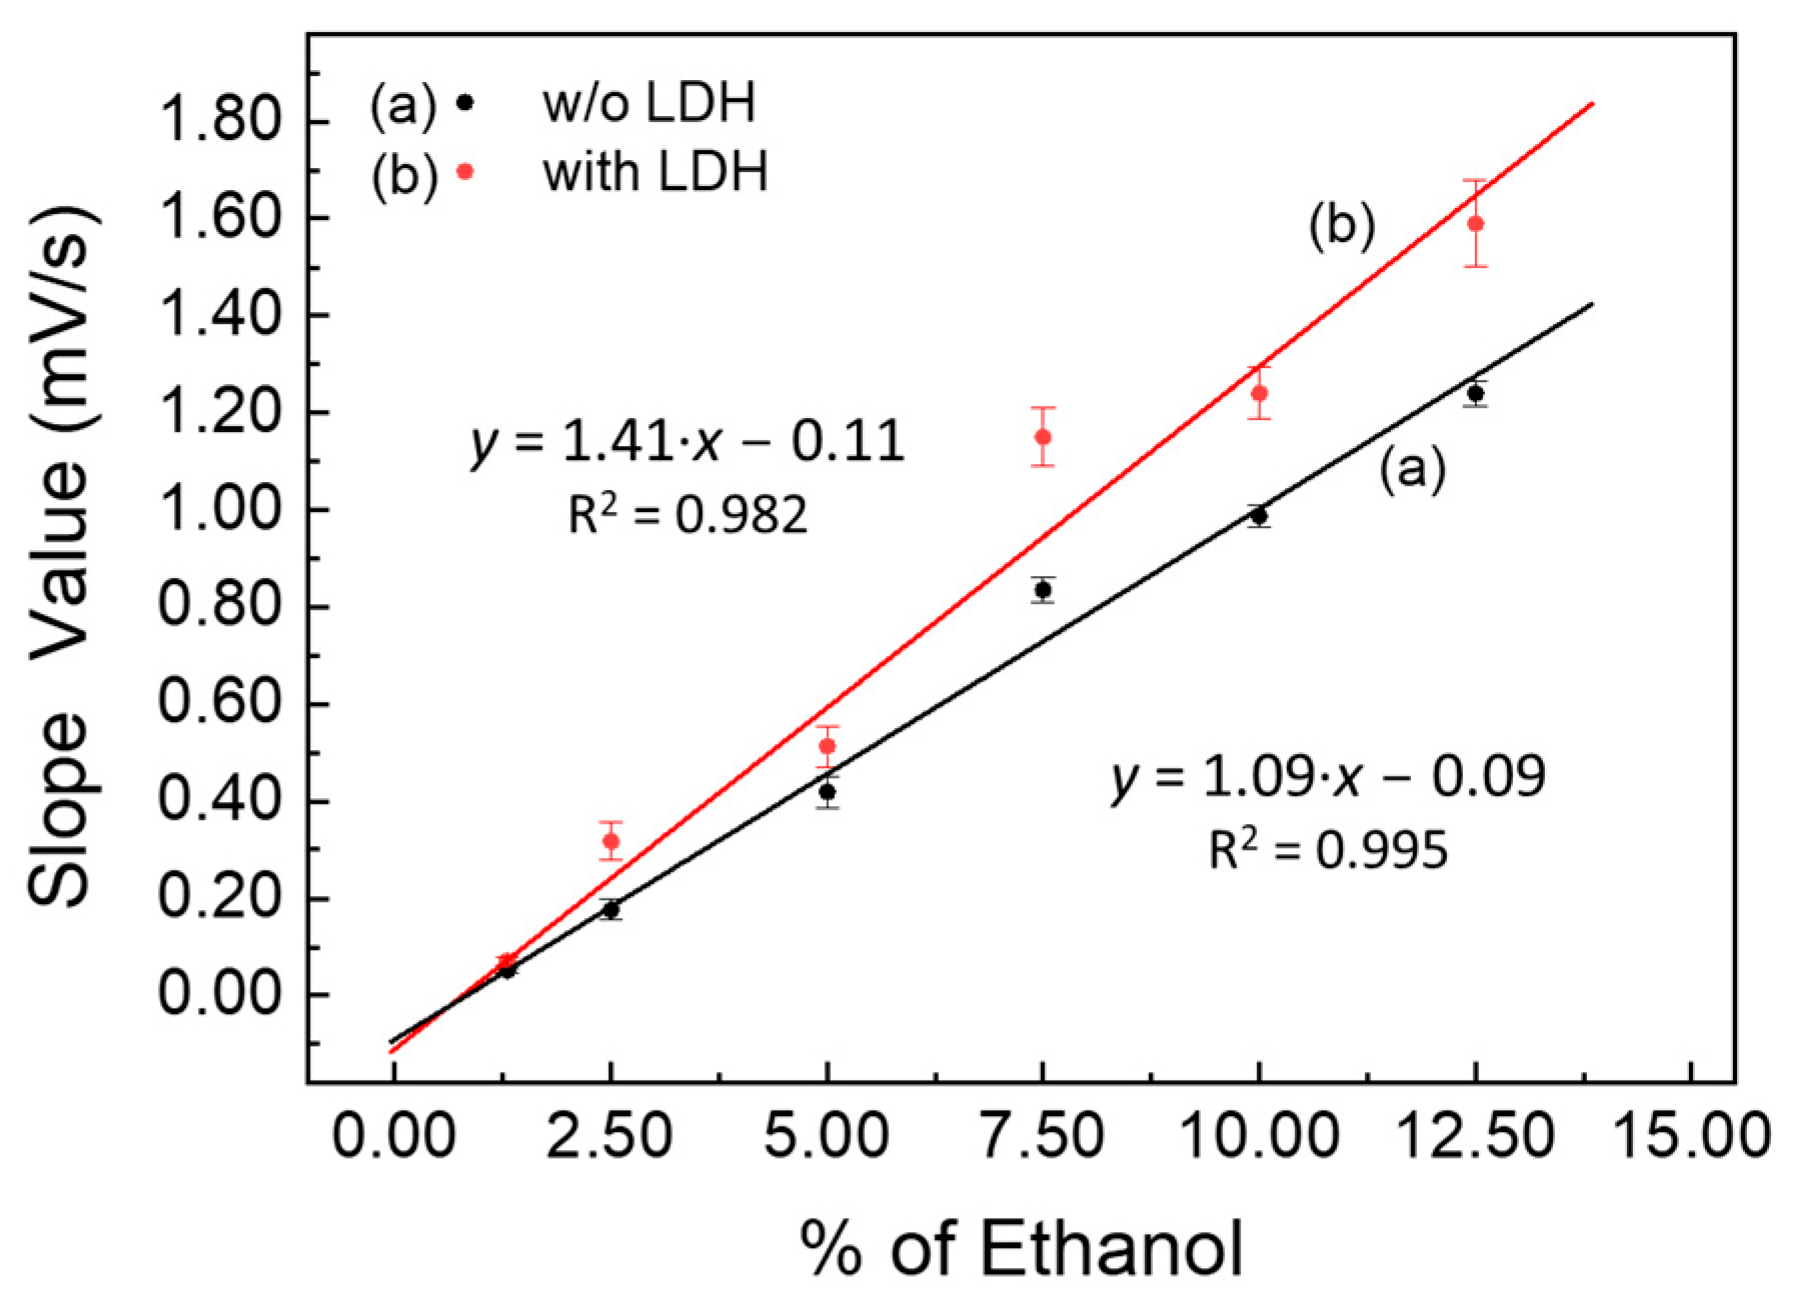
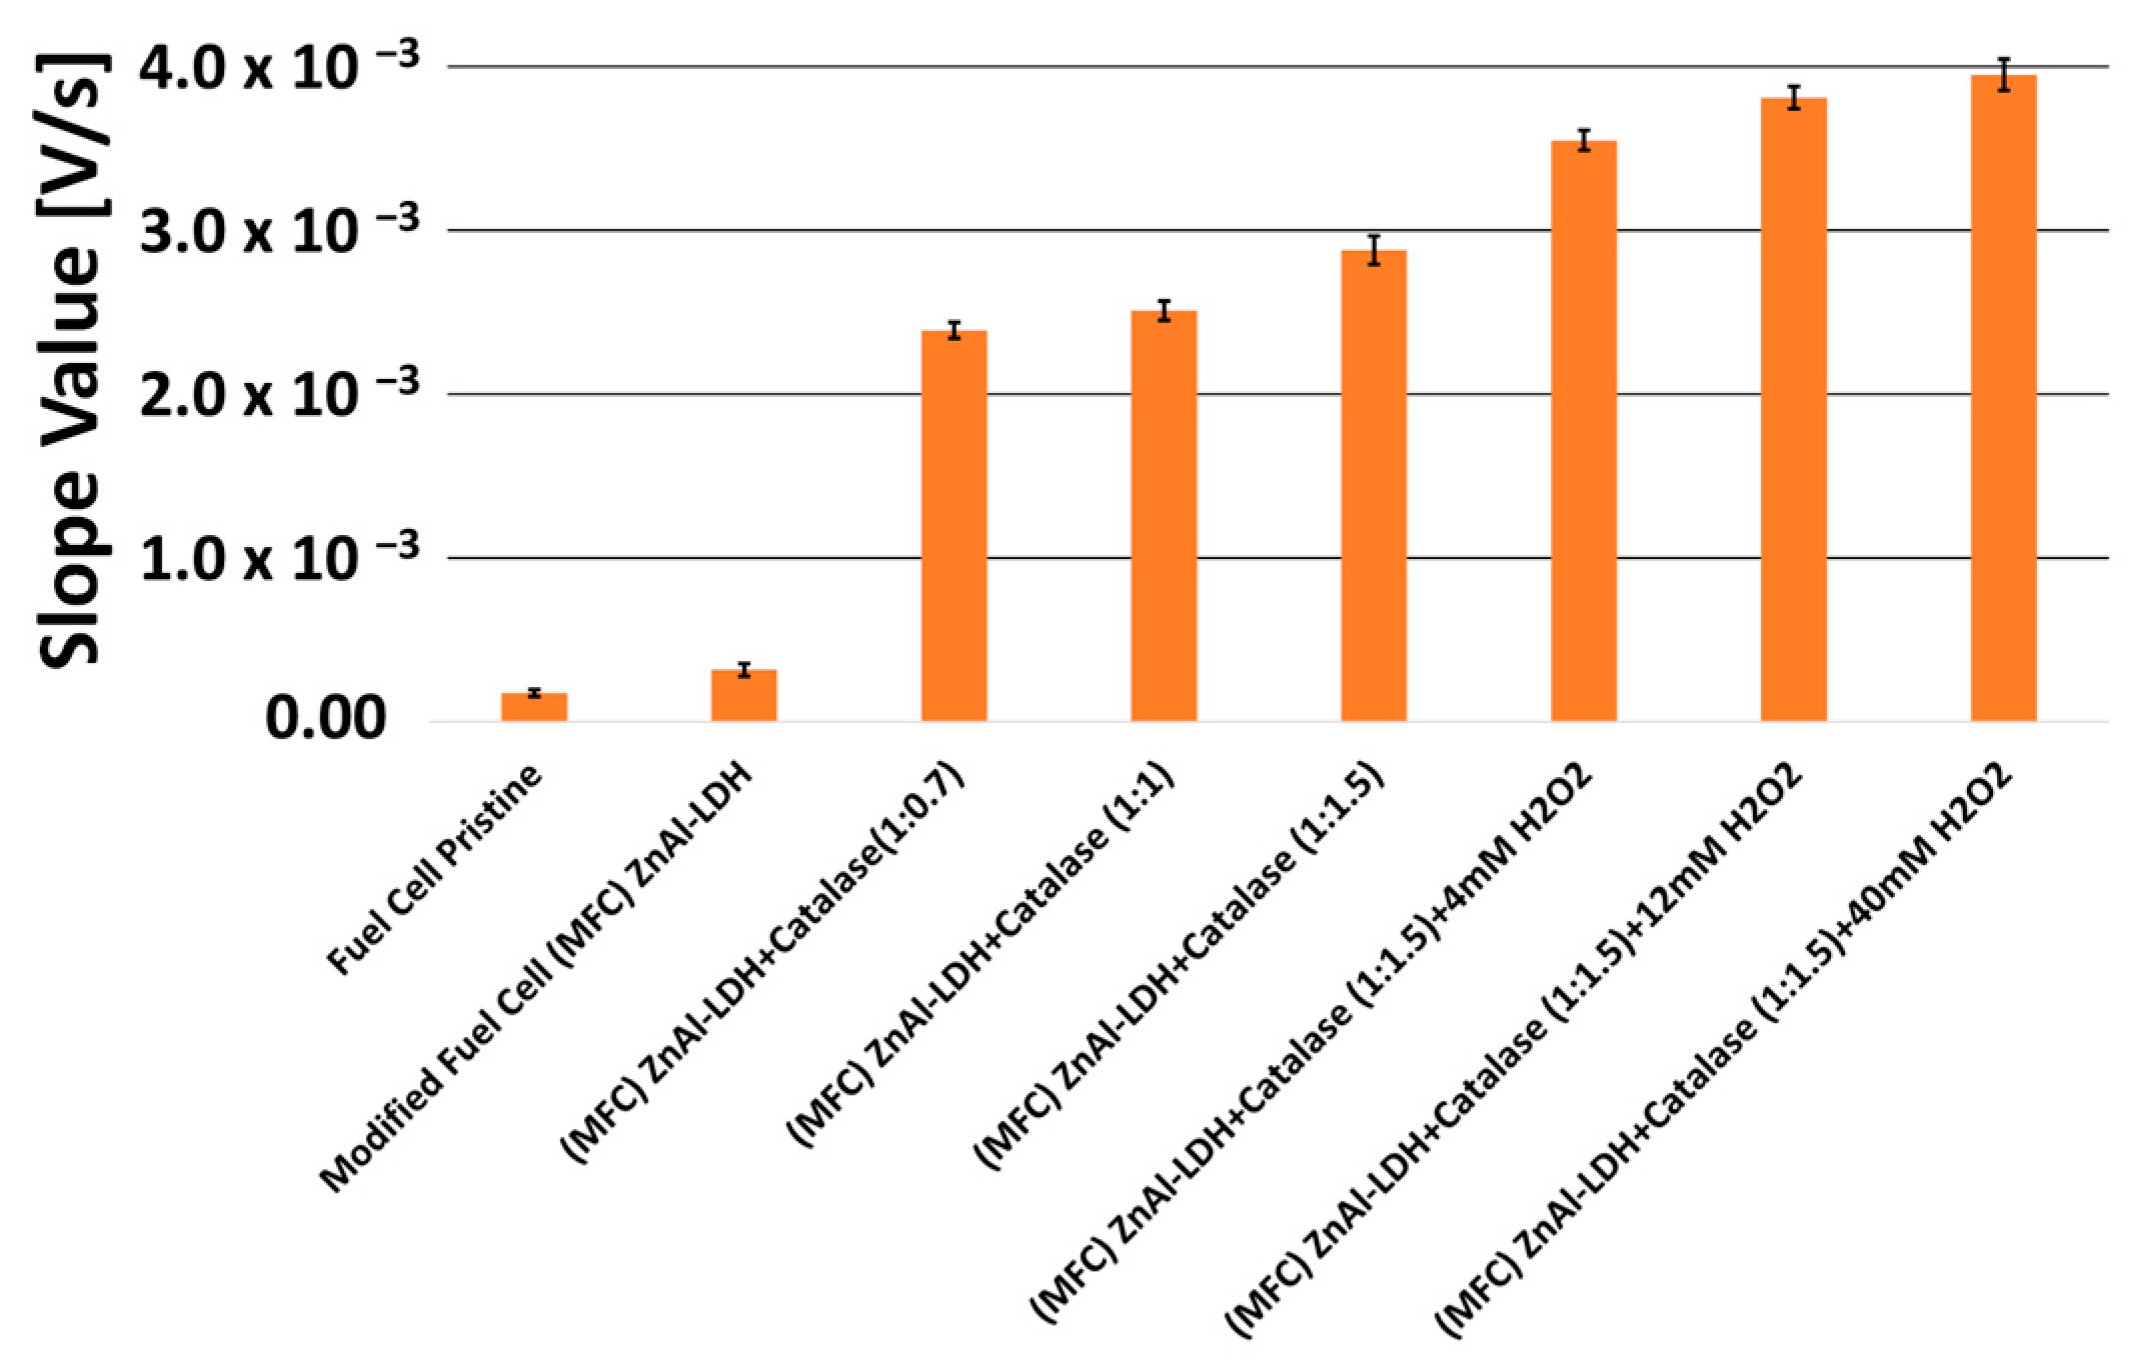
3.1. Modification of Fuel Cell to Increase Its Performance
3.2. Applications on Real Samples Using the Suitably Modified Fuel Cell
4. Conclusions
Author Contributions
Funding
Institutional Review Board Statement
Informed Consent Statement
Data Availability Statement
Acknowledgments
Conflicts of Interest
References
- Wasmus, S.; Küver, A. Methanol oxidation and direct methanol fuel cells: A selective review. J. Electroanal. Chem. 1999, 461, 14–31. [Google Scholar] [CrossRef]
- Liu, H.; Song, C.; Zhang, L.; Zhang, J.; Wang, H.; Wilkinson, D.P. A review of anode catalysis in the direct methanol fuel cell. J. Power Sources 2006, 155, 95–110. [Google Scholar] [CrossRef]
- Carrette, L.; Friedrich, K.A.; Stimming, U. Fuel Cells: Principles, Types, Fuels, and Applications. Chem. Phys. Chem. 2000, 1, 162–193. [Google Scholar] [CrossRef]
- Zhao, J.; Shao, M.; Yan, D.; Zhang, S.; Lu, Z.; Li, Z.; Cao, X.; Wang, B.; Wei, M.; Evans, D.G.; et al. A hierarchical heterostructure based on Pd nanoparticles/layered double hydroxide nanowalls for enhanced ethanol electrooxidation. J. Mater. Chem. A 2013, 1, 5840. [Google Scholar] [CrossRef]
- Compton, R.G.; Hancock, G. Applications of Kinetic Modelling, 1st ed.; Elsevier: Amsterdam, The Netherlands, 1999; ISBN 978-0-444-50164-6. [Google Scholar]
- Bagotzky, V.S.; Vassiliev, Y.B.; Khazova, O.A. Generalized scheme of chemisorption, electrooxidation and electroreduction of simple organic compounds on platinum group metals. J. Electroanal. Chem. Interfacial Electrochem. 1977, 81, 229–238. [Google Scholar] [CrossRef]
- Hamnett, A. Mechanism and electrocatalysis in the direct methanol fuel cell. Catal. Today 1997, 38, 445–457. [Google Scholar] [CrossRef]
- Léger, J.-M.; Rousseau, S.; Coutanceau, C.; Hahn, F.; Lamy, C. How bimetallic electrocatalysts does work for reactions involved in fuel cells? Electrochim. Acta 2005, 50, 5118–5125. [Google Scholar] [CrossRef]
- Tomassetti, M.; Pezzilli, R.; Prestopino, G.; Di Natale, C.; Medaglia, P.G. Fabrication and characterization of a Layered Double Hydroxide based catalase biosensor and a catalytic sensor for hydrogen peroxide determination. Microchem. J. 2021, 170, 106700. [Google Scholar] [CrossRef]
- Tomassetti, M.; Pezzilli, R.; Prestopino, G.; Di Biagio, F.; Di Natale, C.; Medaglia, P.G. A New Clark-Type Layered Double Hydroxides-Enzyme Biosensor for H2O2 Determination in Highly Diluted Real Matrices: Milk and Cosmetics. Processes 2021, 9, 1878. [Google Scholar] [CrossRef]
- Tomassetti, M.; Pezzilli, R.; Prestopino, G.; Di Natale, C.; Medaglia, P.G. Novel Electrochemical Sensors Based on L-Proline Assisted LDH for H2O2 Determination in Healthy and Diabetic Urine. Sensors 2022, 22, 7159. [Google Scholar] [CrossRef] [PubMed]
- Tomassetti, M.; Leonardi, C.; Pezzilli, R.; Prestopino, G.; Di Natale, C.; Medaglia, P.G. New Voltammetric Sensor Based on LDH and H2O2 for L-Proline Determination in Red and White Wines. Crystals 2022, 12, 1474. [Google Scholar] [CrossRef]
- Tomassetti, M.; Angeloni, R.; Merola, G.; Castrucci, M.; Campanella, L. Catalytic fuel cell used as an analytical tool for methanol and ethanol determination. Application to ethanol determination in alcoholic beverages. Electrochim. Acta 2016, 191, 1001–1009. [Google Scholar] [CrossRef] [Green Version]
- Tomassetti, M.; Angeloni, R.; Castrucci, M.; Martini, E.; Campanella, L. Ethanol content determination in hard liquor drinks, beers, and wines, using a catalytic fuel cell. Comparison with other two conventional enzymatic biosensors: Correlation and statistical data. Acta IMEKO 2018, 7, 91. [Google Scholar] [CrossRef]
- Tomassetti, M.; Dell’Aglio, E.; Castrucci, M.; Sammartino, M.P.; Campanella, L.; Di Natale, C. Simple Yeast-Direct Catalytic Fuel Cell Bio-Device: Analytical Results and Energetic Properties. Biosensors 2021, 11, 45. [Google Scholar] [CrossRef]
- Tomassetti, M.; Merola, G.; Angeloni, R.; Marchiandi, S.; Campanella, L. Further development on DMFC device used for analytical purpose: Real applications in the pharmaceutical field and possible in biological fluids. Anal. Bioanal. Chem. 2016, 408, 7311–7319. [Google Scholar] [CrossRef]
- Tomassetti, M.; Pellegrini, S.; Angeloni, R.; Merola, G.; Campanella, L. Checking Ethanol in Several Pharmaceutical Formulations Using Two Different Enzyme Sensor Methods Working by Different Formats. Curr. Pharm. Anal. 2017, 13, 543–551. [Google Scholar] [CrossRef]
- Tomassetti, M.; Angeloni, R.; Marchiandi, S.; Castrucci, M.; Martini, E.; Campanella, L. Direct Methanol Catalytic Fuel Cell, for Measuring Ethanol Contents in Pharmaceutical Tinctures. Curr. Anal. Chem. 2020, 16, 184–194. [Google Scholar] [CrossRef]
- Martini, E.; Tomassetti, M.; Angeloni, R.; Castrucci, M.; Campanella, L. A Suitable Immunosensor for Chloramphenicol Determination: Study of Two Different Competitive Formats. Curr. Pharm. Anal. 2020, 16, 412–423. [Google Scholar] [CrossRef]
- Tomassetti, M.; Angeloni, R.; Marchiandi, S.; Castrucci, M.; Sammartino, M.; Campanella, L. Direct Methanol (or Ethanol) Fuel Cell as Enzymatic or Non-Enzymatic Device, Used to Check Ethanol in Several Pharmaceutical and Forensic Samples. Sensors 2018, 18, 3596. [Google Scholar] [CrossRef] [PubMed] [Green Version]
- Tomassetti, M.; Marini, F.; Angeloni, R.; Castrucci, M.; Campanella, L.; Di Natale, C. Direct Catalytic Fuel Cell Device Coupled to Chemometric Methods to Detect Organic Compounds of Pharmaceutical and Biomedical Interest. Sensors 2020, 20, 3615. [Google Scholar] [CrossRef]
- Tomassetti, M.; Castrucci, M.; Aglio, E.D.; Campanella, L.; Pezzilli, R.; Natale, C.D. Glucose and Ethanol Checked by Flow Direct Catalytic Fuel Cell (DCFC)and Energetic Considerations. Curr. Anal. Chem. 2022, 18, 899–906. [Google Scholar] [CrossRef]
- Zhao, H.; Shen, J.; Zhang, J.; Wang, H.; Wilkinson, D.P.; Gu, C.E. Liquid methanol concentration sensors for direct methanol fuel cells. J. Power Sources 2006, 159, 626–636. [Google Scholar] [CrossRef]
- Sun, W.; Sun, G.; Yang, W.; Yang, S.; Xin, Q. A methanol concentration sensor using twin membrane electrode assemblies operated in pulsed mode for DMFC. J. Power Sources 2006, 162, 1115–1121. [Google Scholar] [CrossRef]
- Polese, D.; Mattoccia, A.; Giorgi, F.; Pazzini, L.; Di Giamberardino, L.; Fortunato, G.; Medaglia, P.G. A phenomenological investigation on Chlorine intercalated Layered Double Hydroxides used as room temperature gas sensors. J. Alloys Compd. 2017, 692, 915–922. [Google Scholar] [CrossRef]
- Prestopino, G.; Arrabito, G.; Generosi, A.; Mattoccia, A.; Paci, B.; Perez, G.; Verona-Rinati, G.; Medaglia, P.G. Emerging switchable ultraviolet photoluminescence in dehydrated Zn/Al layered double hydroxide nanoplatelets. Sci. Rep. 2019, 9, 11498. [Google Scholar] [CrossRef] [Green Version]
- Fan, G.; Li, F.; Evans, D.G.; Duan, X. Catalytic applications of layered double hydroxides: Recent advances and perspectives. Chem. Soc. Rev. 2014, 43, 7040–7066. [Google Scholar] [CrossRef]
- Zou, X.; Goswami, A.; Asefa, T. Efficient Noble Metal-Free (Electro)Catalysis of Water and Alcohol Oxidations by Zinc–Cobalt Layered Double Hydroxide. J. Am. Chem. Soc. 2013, 135, 17242–17245. [Google Scholar] [CrossRef] [PubMed]
- Angeloni, R.; Tomassetti, M.; Castrucci, M.; Campanella, L. Ethanol Determination in Alcoholic Beverages Using Two Different Amperometric Enzyme Sensors. Curr. Anal. Chem. 2014, 11, 56–67. [Google Scholar] [CrossRef]
- Oshino, N.; Oshino, R.; Chance, B. The characteristics of the ‘peroxidatic’ reaction of catalase in ethanol oxidation. Biochem. J. 1973, 131, 555–563. [Google Scholar] [CrossRef] [Green Version]
- Keilin, D.; Hartree, E.F. Properties of catalase. Catalysis of coupled oxidation of alcohols. Biochem. J. 1945, 39, 293–301. [Google Scholar] [CrossRef] [Green Version]
- Siahrostami, S.; Villegas, S.J.; Bagherzadeh Mostaghimi, A.H.; Back, S.; Farimani, A.B.; Wang, H.; Persson, K.A.; Montoya, J. A Review on Challenges and Successes in Atomic-Scale Design of Catalysts for Electrochemical Synthesis of Hydrogen Peroxide. ACS Catal. 2020, 10, 7495–7511. [Google Scholar] [CrossRef]
- Chen, W.; Cai, S.; Ren, Q.-Q.; Wen, W.; Zhao, Y.-D. Recent advances in electrochemical sensing for hydrogen peroxide: A review. Analyst 2012, 137, 49–58. [Google Scholar] [CrossRef] [PubMed]
- Menegazzo, F.; Signoretto, M.; Ghedini, E.; Strukul, G. Looking for the “Dream Catalyst” for Hydrogen Peroxide Production from Hydrogen and Oxygen. Catalysts 2019, 9, 251. [Google Scholar] [CrossRef] [Green Version]
- Jawad, A.; Li, Y.; Lu, X.; Chen, Z.; Liu, W.; Yin, G. Controlled leaching with prolonged activity for Co–LDH supported catalyst during treatment of organic dyes using bicarbonate activation of hydrogen peroxide. J. Hazard. Mater. 2015, 289, 165–173. [Google Scholar] [CrossRef] [PubMed]
- Jones, A.W. Assessment of an automated enzymatic method for ethanol determination in microsamples of saliva. Scand. J. Clin. Lab. Investig. 1979, 39, 199–203. [Google Scholar] [CrossRef] [PubMed]
- Jones, A.W. Distribution of ethanol between saliva and blood in man. Clin. Exp. Pharmacol. Physiol. 1979, 6, 53–59. [Google Scholar] [CrossRef]
- Heravi, M.M.; Ghalavand, N.; Hashemi, E. Hydrogen Peroxide as a Green Oxidant for the Selective Catalytic Oxidation of Benzylic and Heterocyclic Alcohols in Different Media: An Overview. Chemistry 2020, 2, 101–178. [Google Scholar] [CrossRef] [Green Version]
- Zhou, X.-T.; Ji, H.-B.; Liu, S.-G. Solvent-free selective oxidation of primary and secondary alcohols catalyzed by ruthenium-bis(benzimidazole)pyridinedicarboxylate complex using hydrogen peroxide as an oxidant. Tetrahedron Lett. 2013, 54, 3882–3885. [Google Scholar] [CrossRef] [Green Version]
- Baratta, W.; Da Ros, P.; Del Zotto, A.; Sechi, A.; Zangrando, E.; Rigo, P. Cyclometalated Ruthenium(II) Complexes as Highly Active Transfer Hydrogenation Catalysts. Angew. Chem. 2004, 116, 3668–3672. [Google Scholar] [CrossRef]
- Zhao, S.; Tsen, W.-C.; Gong, C. 3D nanoflower-like layered double hydroxide modified quaternized chitosan/polyvinyl alcohol composite anion conductive membranes for fuel cells. Carbohydr. Polym. 2021, 256, 117439. [Google Scholar] [CrossRef]
- Tahir, M.; Pan, L.; Idrees, F.; Zhang, X.; Wang, L.; Zou, J.-J.; Wang, Z.L. Electrocatalytic oxygen evolution reaction for energy conversion and storage: A comprehensive review. Nano Energy 2017, 37, 136–157. [Google Scholar] [CrossRef]
- Kubo, D.; Tadanaga, K.; Hayashi, A.; Tatsumisago, M. Improvement of electrochemical performance in alkaline fuel cell by hydroxide ion conducting Ni–Al layered double hydroxide. J. Power Sources 2013, 222, 493–497. [Google Scholar] [CrossRef]
- Chen, N.; Long, C.; Li, Y.; Wang, D.; Zhu, H. High-performance layered double hydroxide/poly(2,6-dimethyl-1,4-phenylene oxide) membrane with porous sandwich structure for anion exchange membrane fuel cell applications. J. Membr. Sci. 2018, 552, 51–60. [Google Scholar] [CrossRef]
- Rasmussen, M.; Abdellaoui, S.; Minteer, S.D. Enzymatic biofuel cells: 30 years of critical advancements. Biosens. Bioelectron. 2016, 76, 91–102. [Google Scholar] [CrossRef] [Green Version]
- Akers, N.L.; Moore, C.M.; Minteer, S.D. Development of alcohol/O2 biofuel cells using salt-extracted tetrabutylammonium bromide/Nafion membranes to immobilize dehydrogenase enzymes. Electrochim. Acta 2005, 50, 2521–2525. [Google Scholar] [CrossRef]
- Amir, L.; Tam, T.K.; Pita, M.; Meijler, M.M.; Alfonta, L.; Katz, E. Biofuel Cell Controlled by Enzyme Logic Systems. J. Am. Chem. Soc. 2009, 131, 826–832. [Google Scholar] [CrossRef]
- Arechederra, M.N.; Jenkins, C.; Rincón, R.A.; Artyushkova, K.; Atanassov, P.; Minteer, S.D. Chemical polymerization and electrochemical characterization of thiazines for NADH electrocatalysis applications. Electrochim. Acta 2010, 55, 6659–6664. [Google Scholar] [CrossRef]
- Xu, Q.; Guo, Z.; Xia, L.; He, Q.; Li, Z.; Temitope Bello, I.; Zheng, K.; Ni, M. A comprehensive review of solid oxide fuel cells operating on various promising alternative fuels. Energy Convers. Manag. 2022, 253, 115175. [Google Scholar] [CrossRef]
- Das, G.S.; Hwang, J.Y.; Jang, J.-H.; Tripathi, K.M.; Kim, T. Biomass-Based Functionalized Graphene for Self-Rechargeable Zinc–Air Batteries. ACS Appl. Energy Mater. 2022, 5, 6663–6670. [Google Scholar] [CrossRef]
- Tu, B.; Wen, H.; Yin, Y.; Zhang, F.; Su, X.; Cui, D.; Cheng, M. Thermodynamic analysis and experimental study of electrode reactions and open circuit voltages for methane-fuelled SOFC. Int. J. Hydrogen Energy 2020, 45, 34069–34079. [Google Scholar] [CrossRef]


| % Ethanol | Slope without LDHs | Slope with LDHs | ||||
|---|---|---|---|---|---|---|
| [V s−1] | [V s−1] | |||||
| 1.25% | 5.12 × 10⁻⁵ | ± | 3.79 × 10⁻⁶ | 7.10 × 10⁻⁵ | ± | 7.32 × 10⁻⁶ |
| 2.50% | 1.76 × 10⁻⁴ | ± | 2.10 × 10⁻⁵ | 3.17 × 10⁻⁴ | ± | 3.83 × 10⁻⁵ |
| 5.00% | 4.19 × 10⁻⁴ | ± | 3.23 × 10⁻⁵ | 5.13 × 10⁻⁴ | ± | 4.19 × 10⁻⁵ |
| 7.50% | 8.35 × 10⁻⁴ | ± | 1.65 × 10⁻⁵ | 1.15 × 10⁻³ | ± | 5.95 × 10⁻⁵ |
| 10.0% | 9.87 × 10⁻⁴ | ± | 1.85 × 10⁻⁵ | 1.24 × 10⁻³ | ± | 5.34 × 10⁻⁵ |
| 15.0% | 1.34 × 10⁻³ | ± | 6.37 × 10⁻⁵ | 1.39 × 10⁻³ | ± | 9.55 × 10⁻⁵ |
| Samples | (a) % Nominal Final Values Added in the Sample | (b) % Experimental Found Value (RSD % ≤ 4.0) | ∆% = [(b − a)/a]% |
|---|---|---|---|
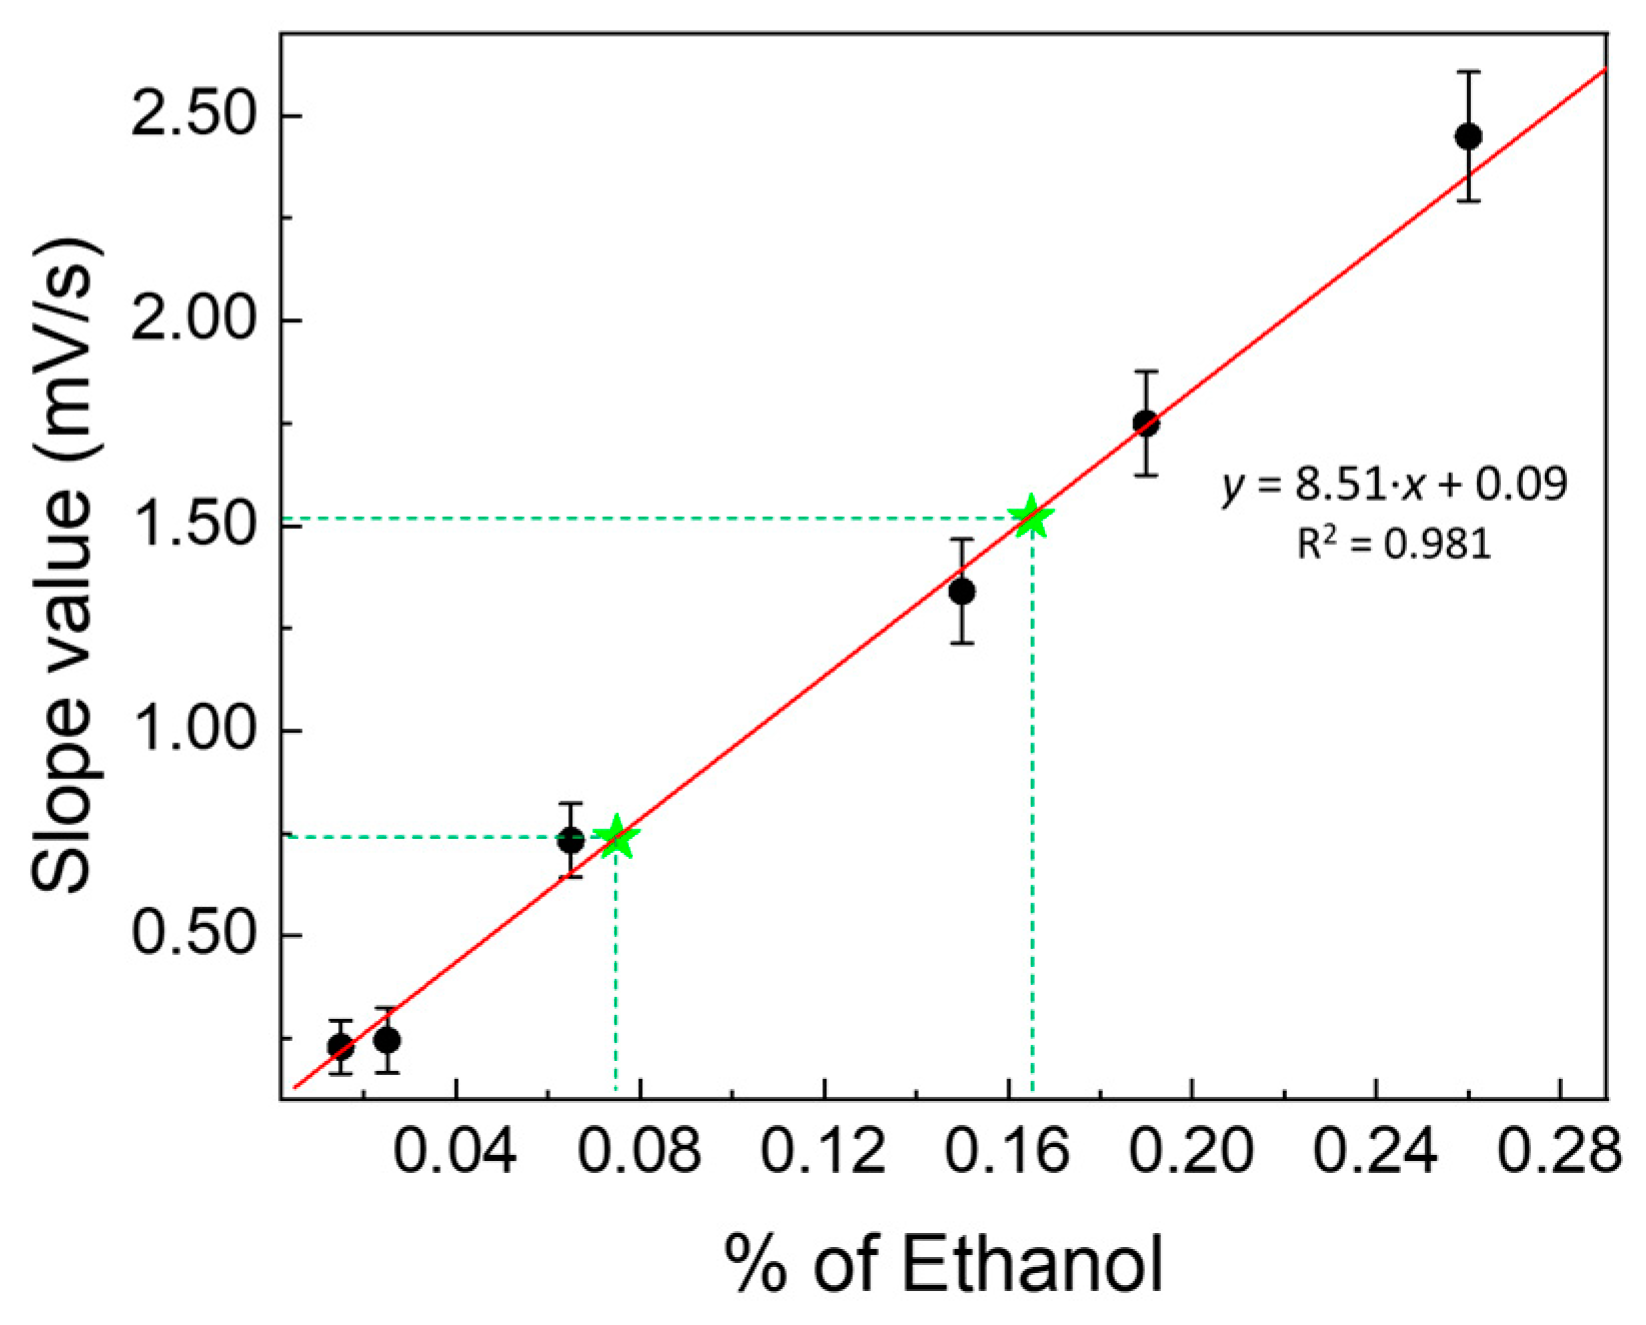
| BS1 | 0.07 | 0.073 | +4.3 |
| BS2 | 0.17 | 0.167 | −1.8 |
| % Nominal Values Reported by Producer | % Experimental Found Value (RSD % ≤ 4.5) | ∆% = [(b − a)/a]% | |
| DS1 | 3.30 | 3.49 | 5.76 |
| DS2 | 3.50 | 3.70 | 5.71 |
| DS3 | 3.70 | 3.87 | 4.59 |
Disclaimer/Publisher’s Note: The statements, opinions and data contained in all publications are solely those of the individual author(s) and contributor(s) and not of MDPI and/or the editor(s). MDPI and/or the editor(s) disclaim responsibility for any injury to people or property resulting from any ideas, methods, instructions or products referred to in the content. |
© 2023 by the authors. Licensee MDPI, Basel, Switzerland. This article is an open access article distributed under the terms and conditions of the Creative Commons Attribution (CC BY) license (https://creativecommons.org/licenses/by/4.0/).
Share and Cite
Tomassetti, M.; Pezzilli, R.; Leonardi, C.; Prestopino, G.; Di Natale, C.; Campanella, L.; Medaglia, P.G. A Direct Catalytic Ethanol Fuel Cell (DCEFC) Modified by LDHs, or by Catalase-LDHs, and Improvement in Its Kinetic Performance: Applications for Human Saliva and Disinfectant Products for COVID-19. Biosensors 2023, 13, 441. https://doi.org/10.3390/bios13040441
Tomassetti M, Pezzilli R, Leonardi C, Prestopino G, Di Natale C, Campanella L, Medaglia PG. A Direct Catalytic Ethanol Fuel Cell (DCEFC) Modified by LDHs, or by Catalase-LDHs, and Improvement in Its Kinetic Performance: Applications for Human Saliva and Disinfectant Products for COVID-19. Biosensors. 2023; 13(4):441. https://doi.org/10.3390/bios13040441
Chicago/Turabian StyleTomassetti, Mauro, Riccardo Pezzilli, Claudio Leonardi, Giuseppe Prestopino, Corrado Di Natale, Luigi Campanella, and Pier Gianni Medaglia. 2023. "A Direct Catalytic Ethanol Fuel Cell (DCEFC) Modified by LDHs, or by Catalase-LDHs, and Improvement in Its Kinetic Performance: Applications for Human Saliva and Disinfectant Products for COVID-19" Biosensors 13, no. 4: 441. https://doi.org/10.3390/bios13040441