Article

Ultrasensitive Electrochemiluminescence Immunoassay Based on Signal Amplification of 0D Au—2D WS2 Nano-Hybrid Materials

1
School of Science, Jiangsu Ocean University, Lianyungang 222005, China
2
Jiangsu Pacific Quartz Co., Ltd., Lianyungang 222005, China
3
School of Chemistry and Chemical Engineering, Southeast University, Nanjing 211189, China
4
Fujian Key Laboratory of Drug Target Discovery and Structural and Functional Research, School of Pharmacy, Fujian Medical University, Fuzhou 350004, China
*
Authors to whom correspondence should be addressed.
Biosensors 2023, 13(1), 58; https://doi.org/10.3390/bios13010058
Submission received: 1 December 2022 / Revised: 22 December 2022 / Accepted: 28 December 2022 / Published: 30 December 2022
(This article belongs to the Special Issue Electrochemical Biosensors for Disease Detection)

Abstract

:
In this study, we proposed a novel Ru(bpy)32+-Au-WS2 nanocomposite (Ru-Au-WS2 NCs) nano-hybrid electrochemiluminescence (ECL) probe for the highly sensitive detection of carcinoembryonic antigen (CEA). This system utilizes Au nanoparticles (Au NPs) as a bridge to graft the high-performance of a Ru(bpy)32+ ECL emitter and WS2 nanosheet with excellent electrochemical performance into an ECL platform, which shows outstanding anodic ECL performance and biosensing platform due to the synergetic effect and biocompatibility of Au NPs and WS2 nanosheet. Because the ECL intensity of Ru(bpy)32+ is sensitively affected by the antibody-antigen insulator, a preferable linear dependence was obtained in the concentration range of CEA from 1 pg·mL−1 to 350 ng·mL−1 with high selectivity (LOD of 0.3 pg·mL−1, S/N = 3). Moreover, the ECL platform had good reproducibility and stability and exhibited excellent anti-interference performance in the detection process of CEA. We believe that the platform we have developed can expand the opportunities for the detection of additional high specificity-related antibodies/antigens and demonstrate broad prospects for disease diagnosis and biochemical research.

1. Introduction

Cancer is one of the leading causes of death in humans, which kills nearly 10 million people worldwide every year. In fact, the previous study found that the early detection and treatment of malignant tumors in early carcinoma and advanced carcinoma would significantly reduce the difficulty coefficient of treatment and mortality. It is well known that carcinoembryonic antigen (CEA) is a tumor marker for different types of cancer such as breast cancer and lung cancer [1]. Therefore, CEA has an important application prospect in the early diagnosis of tumors. Rapid quantitative detection of CEA has important value in clinical diagnosis, treatment evaluation and drug discovery [2]. There are many immunoassays to detect CEA, such as colorimetric, enzyme-linked immunoassay, capillary electrophoresis, fluorescence and electrochemistry [3,4,5,6,7]. Most of these strategies have complicated experimental procedures, unstable substrates and long detection times. Electrochemiluminescence (ECL) as a classical sensing technique, in which the input signal of current and the output signal of light are completely separated, has received considerable attention owing to its high sensitivity [8]. Due to its benefits, such as high selectivity, high sensitivity, rapid response, and low background signal [9,10], the ECL immunoassay has thus developed into a potent analytical tool for the highly specific and sensitive detection of cancer biomarkers such as CEA and prostate-specific antigen (PSA).
Two-dimensional (2D) graphene-like materials such as MoS2, WS2, MoSe2 and WSe2 nanosheets, have recently attracted intense interest due to their high dispersibility in aqueous solution, high loading efficiency for biomolecules and good biocompatibility [11,12,13,14]. Through the combination with 0D materials, the graphene-like materials obtain more excellent application prospects. Recent studies have shown that 0D/2D nanocomposites, including MoS2-PbS QDs and Au NPs/GQDs-WS2 possess potential applications in electrocatalysts, photocatalysis, photodetectors and biosensors [15,16]. For instance, Hou and co-workers fabricated an Au NPs/MoS2 heterostructure ECL biosensor for the detection of miRNA-210 in breast cancer tissue [17]. Shorie et al. fabricated the composites of gold nanoparticles on WS2 nanosheets by using the intrinsic reducing properties of the nanosheet [18]. Huang et al. [19] combined gold nanoparticles (Au NPs) with WS2 nanosheets to construct an electrochemical biosensor for 17β-estradiol. Designing new systems for specialized applications may be encouraged by the synergistic effect of 0D and 2D structures. However, there are few reports on the use of 0D and 2D hybrid nanomaterials for ECL.
As far as we know, 0D and 2D hybrid structure nanomaterials incorporated into an ECL sensor for CEA detection have not been reported. In this paper, we fabricated a hybrid Ru-Au-WS2 NCs combining 0D Au NPs, 2D WS2 nanosheet and Ru(bpy)3Cl2 via a cost-effective and conventional sonication approach. Furthermore, an ECL platform was developed for immunosensing CEA by coating Ru-Au-WS2 NCs onto a glassy carbon electrode surface and subsequently immobilizing the CEA antibody. Experimental conditions including CEA incubation time and Tripropylamine (TPA) concentration on the behavior of the biosensor were optimized for determining CEA with excellent performances. An ECL immuno-assay method based on Ru-Au-WS2 NCs was developed for CEA determination. The hybrid structure with WS2 thin-layers and Au NPs improved the electrocatalytic activity of the ECL system. The electrical conductivity, biocompatibility, electrocatalytic activity and large specific surface area of the 0D-Au NPs-2D WS2 NS heterostructure were used to detect the actual samples [20]. The constructed hybrid nanomaterials ECL probes displayed simple and fast determination of CEA from 1 pg·mL−1 to 350 ng·mL−1 with the detection limit down to 0.3 pg·mL−1 (S/N = 3) [21].

2. Experimental Section

2.1. Chemicals and Reagents

CEA and anti-CEA were purchased from Bosai Co., Ltd. (Zhengzhou, China). Bovine serum albumin (BSA) was purchased from Dingguo Co., Ltd. (Beijing, China). TPA, WS2, N-dimethylformamide (DMF) and Tris(2,2′-bipyridyl) ruthenium (II) chloride hexahydrate were purchased from Sigma-Aldrich (Beijing, China). All other reagents are analytically pure and could be used right away without any additional purification. Each solution was made with double-distilled water.

2.2. Instrument and Apparatus

Cyclic voltammetry (CV) and electrochemiluminescence (ECL) measurements were made using an electro-chemiluminescence analyzer, model MPI-B (Xi’an Remex Analysis Instrument Co., Ltd., Xi’an, China). All ECL measurements were performed using a standard three-electrode setup, which included an Ag/AgCl (saturated KCl solution) reference electrode, a platinum wire counter electrode, and a glassy carbon working electrode. The ECL responses of the electrode were recorded in 0.10 M PBS (pH 7.4) containing 100 mM TPA with scanning the potential from 0.2 to 1.4 V at 100 mV/s, and the bias voltage of the photomultiplier tube (PMT) was 800 V. The UV-vis absorption spectra were measured using the UV-vis spectrophotometer Uv-2450 (Shimadzu, Japan). Transmission electron microscopy (TEM) was carried out on a JEOL 2010 TEM with an accelerating voltage of 200 kV.

2.3. Preparation of Au NPs

The preparation of Au NPs was conducted as in the previous method [22]. Briefly, 1 mL of 2% HAuCl4·4H2O was mixed with 79 mL water and then 20 mL containing 0.4% sodium citrate and 0.01% tannic acid solution was quickly added while stirring. The mixed solution was then kept stirring for another 35 min at 60 °C until the mixture turned a deep red color, signifying the formation of Au NPs. Before use, the acquired Au NPs were cooled to room temperature and stored in a brown glass bottle at 5 °C.

2.4. Preparation of WS2 Nanosheets

To create a uniform, black suspension with a final concentration of 1 mg·mL−1, 20 mg of WS2 powder with a particle size of 90 nm were dispersed in 20 mL DMF and ultrasonically treated at room temperature for 60 min. After centrifuging the suspension at 12000 rpm for 10 min, the supernatant was discarded and the product was dissolved in 2 mL of water.

2.5. Preparation of Ru-Au-WS2 NCs

An amount of 150 μL of Ru(bpy)3Cl2 (50 mM) was quickly mixed with 2 mL of Au colloidal solution. After stirring the reaction mixture for 12 h, 0.5 mL of WS2 nanosheet solution was added and continued stirring for 12 h. After being collected, the supernatant was cleaned with distilled water before being centrifuged at 10,000 rpm for 15 min. At long last, the Ru-Au-WS2 NCs were scattered in 2 mL of water for assist characterizations and applications. During the whole synthesis process, Ru(bpy)3Cl2 and Au NPs were first functionalized and mixed, and then Au NPs were grown in situ on the surface of WS2 NS, and finally Ru-Au-WS2 NCs were successfully synthesized.

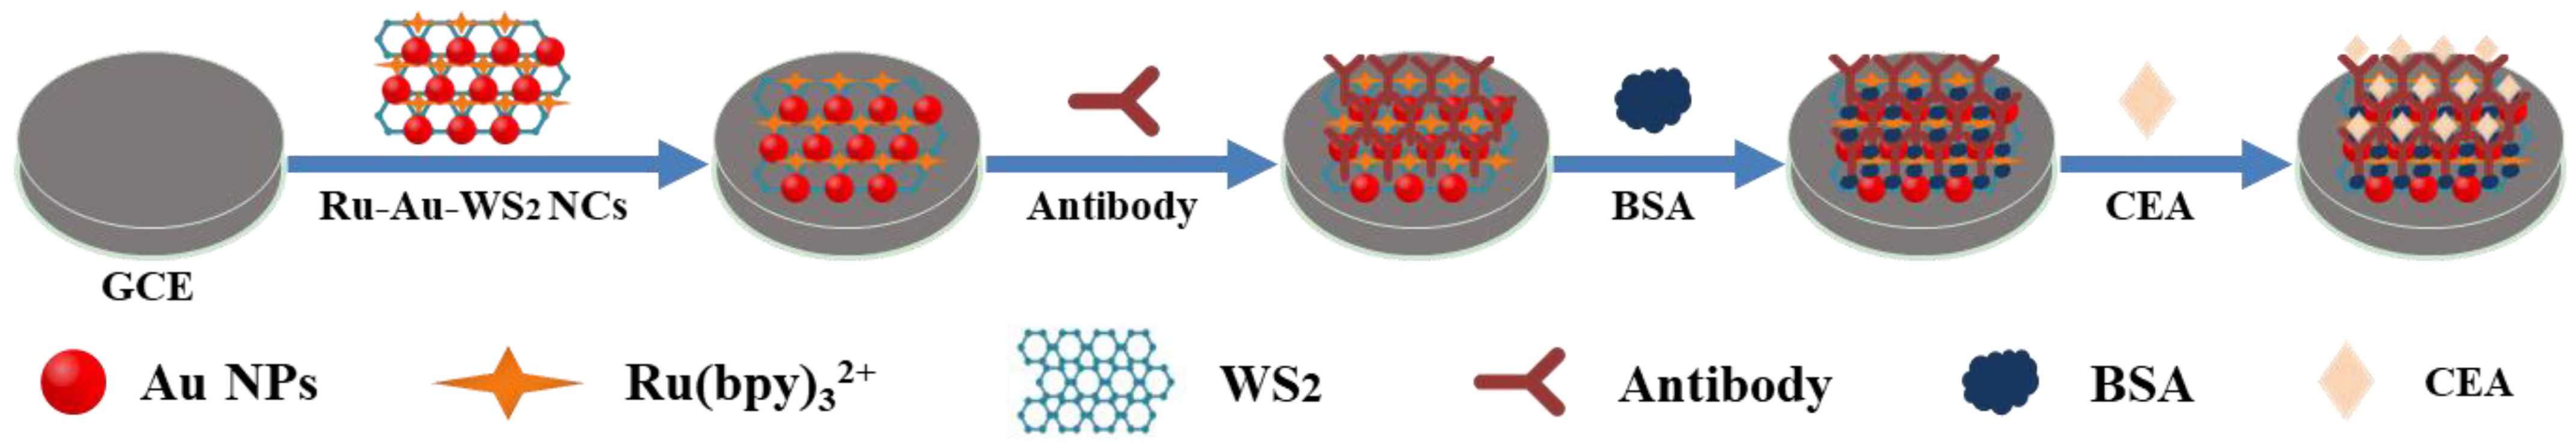
2.6. Fabrication of the ECL Immunosensor

Alumina powder (1.0, 0.3, and 0.05 μm) was used to polish a glassy carbon electrode (GCE, 3 mm diameter, CH Instruments, Shanghai, China.). The GCE was successively sonicated in 1:1 nitric acid, acetone and distilled water. Following a thorough water wash and immediate N2 drying of the cleaned electrode, 5 μL of the Ru-Au-WS2 NCs solution was poured onto the GCE surface. After air drying at room temperature, the Ru-Au-WS2 NCs modified GCE (GCE/Ru-Au-WS2) was produced. After that, a 6 μL coating of a 500 μg·mL−1 antibody (Ab) solution was applied to the modified electrode’s surface, which was then allowed to dry at 4 °C overnight. Then, a cross-linking reaction between glutaraldehyde and Ab was used to stabilize the interface. The electrode was then washed with PBS (pH = 7.4) and 3 mL of a 1 wt% BSA solution for 1 h to prevent non-specific binding sites. At this time, the modified electrode was donated as GCE/Ru-Au-WS2/Ab/BSA.

2.7. ECL Detection of CEA

For the CEA assay, the prepared ECL immunosensors were put in CEA solutions of different concentrations and allowed to hatch at 37 °C for 1 h. The pH 7.4 PBS was used to carefully wash away any remaining non-chemisorbed CEA before recording the immunosensor’s ECL signals in 0.1 M pH 7.4 PBS containing 0.1 M TPA. Finally, the modified electrode treated with CEA solution was donated as GCE/Ru-Au-WS2/Ab/BSA/CEA. Finally, the concentrations of CEA were determined by ECL. The step-by-step preparation diagram of the ECL immunosensor was shown in Figure 1.

3. Results and Discussion

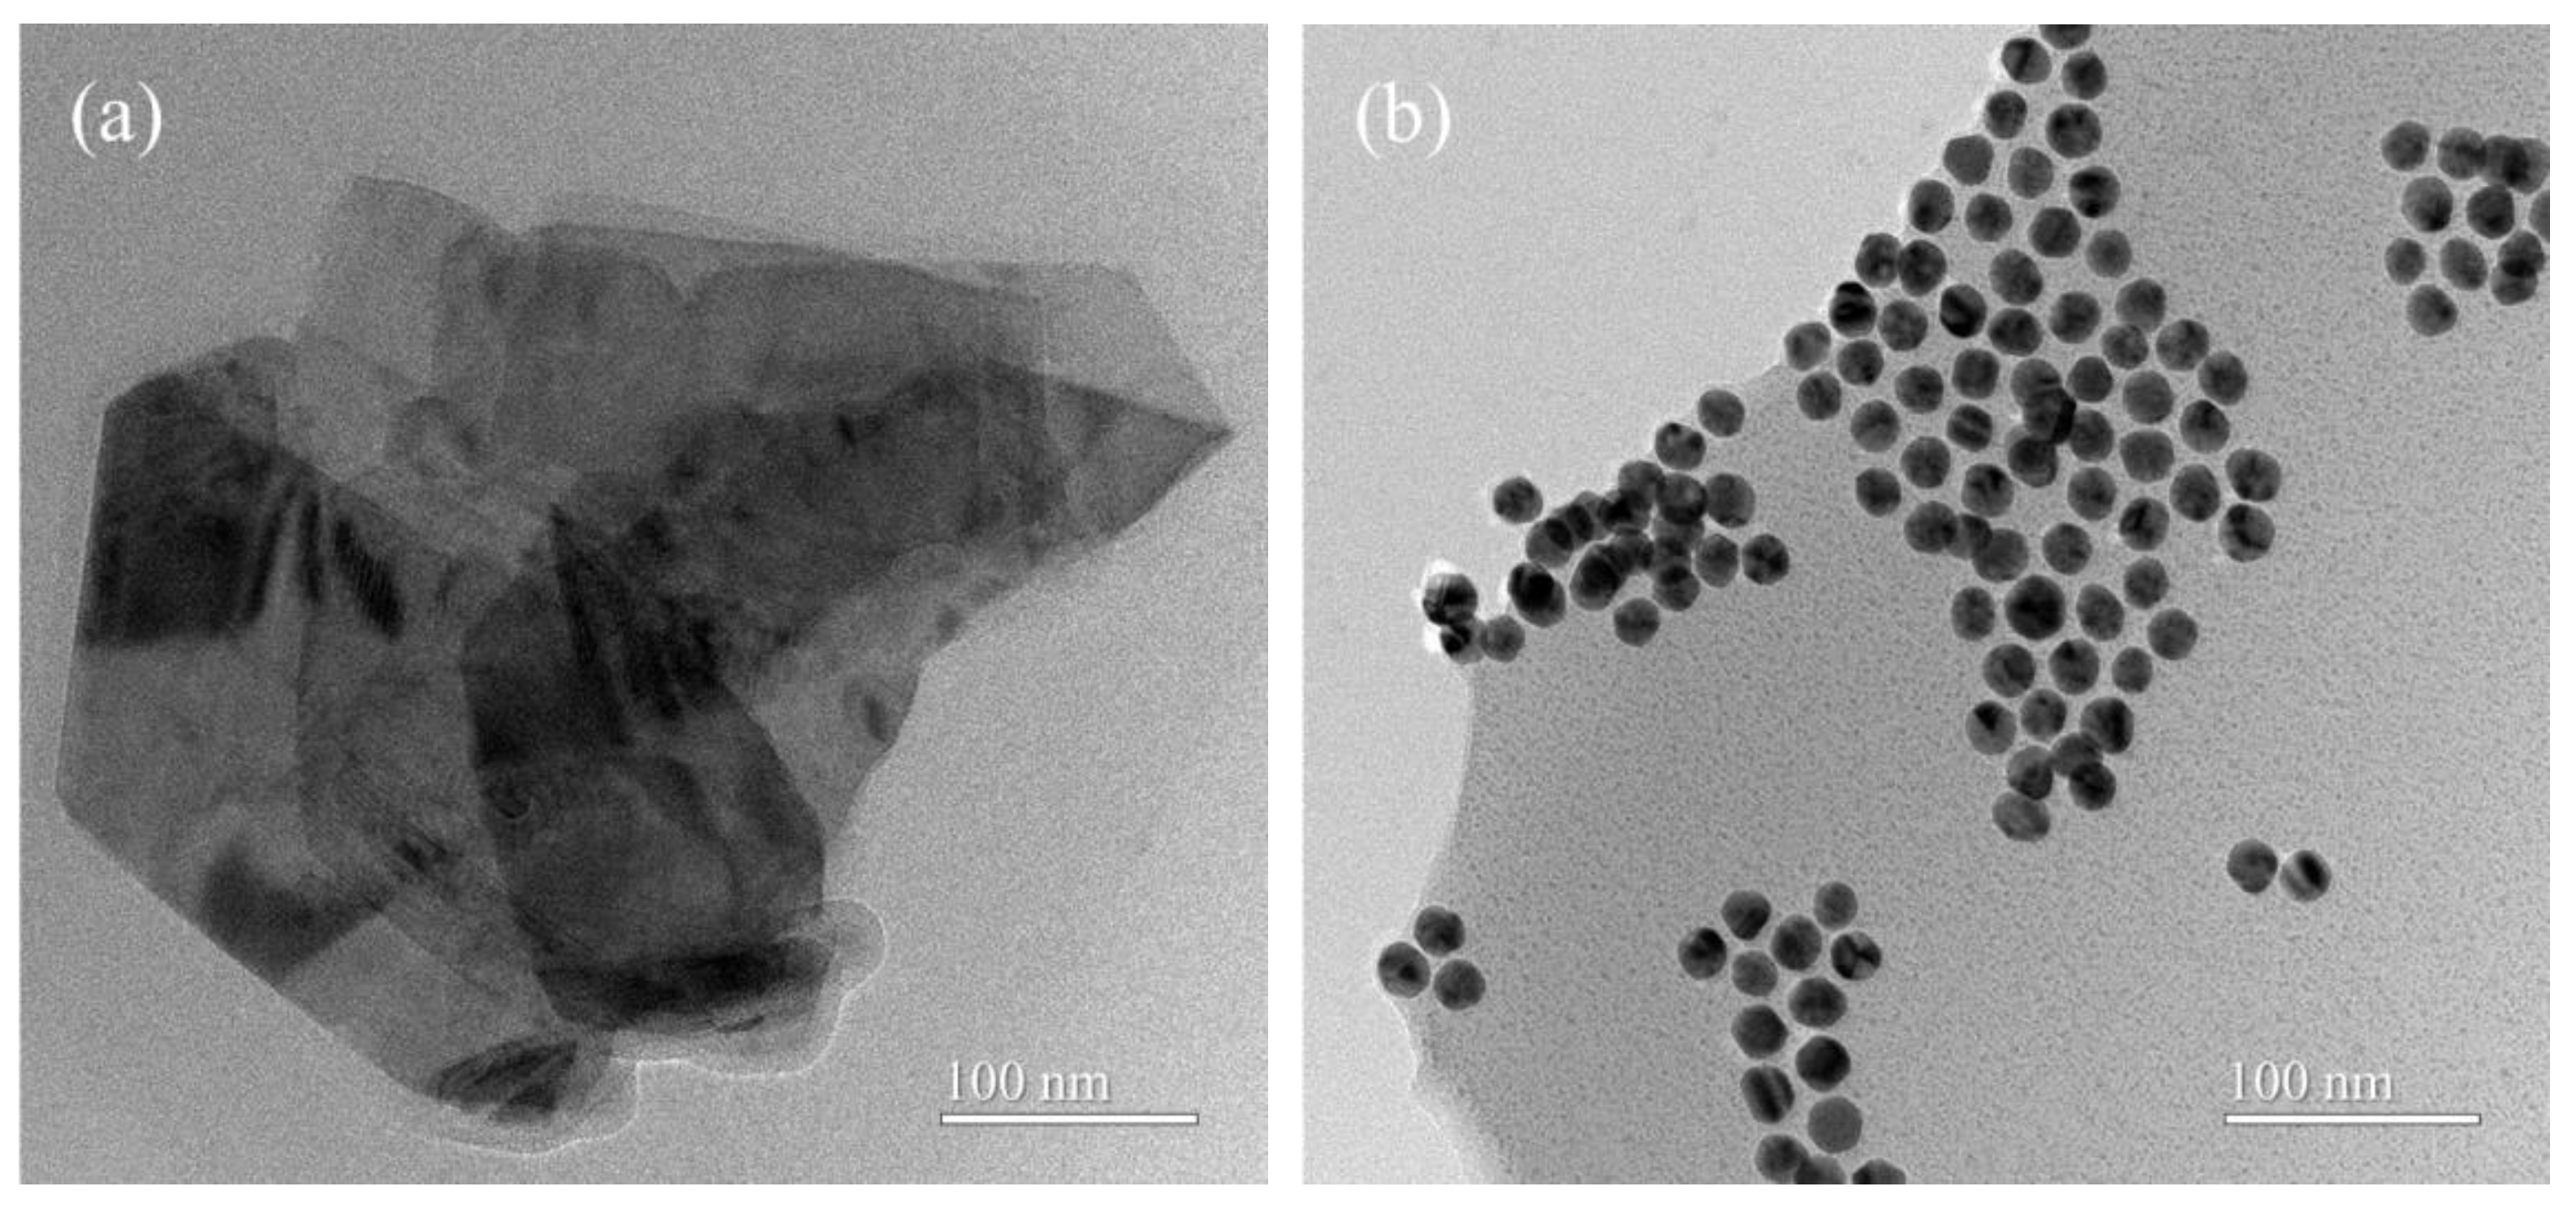
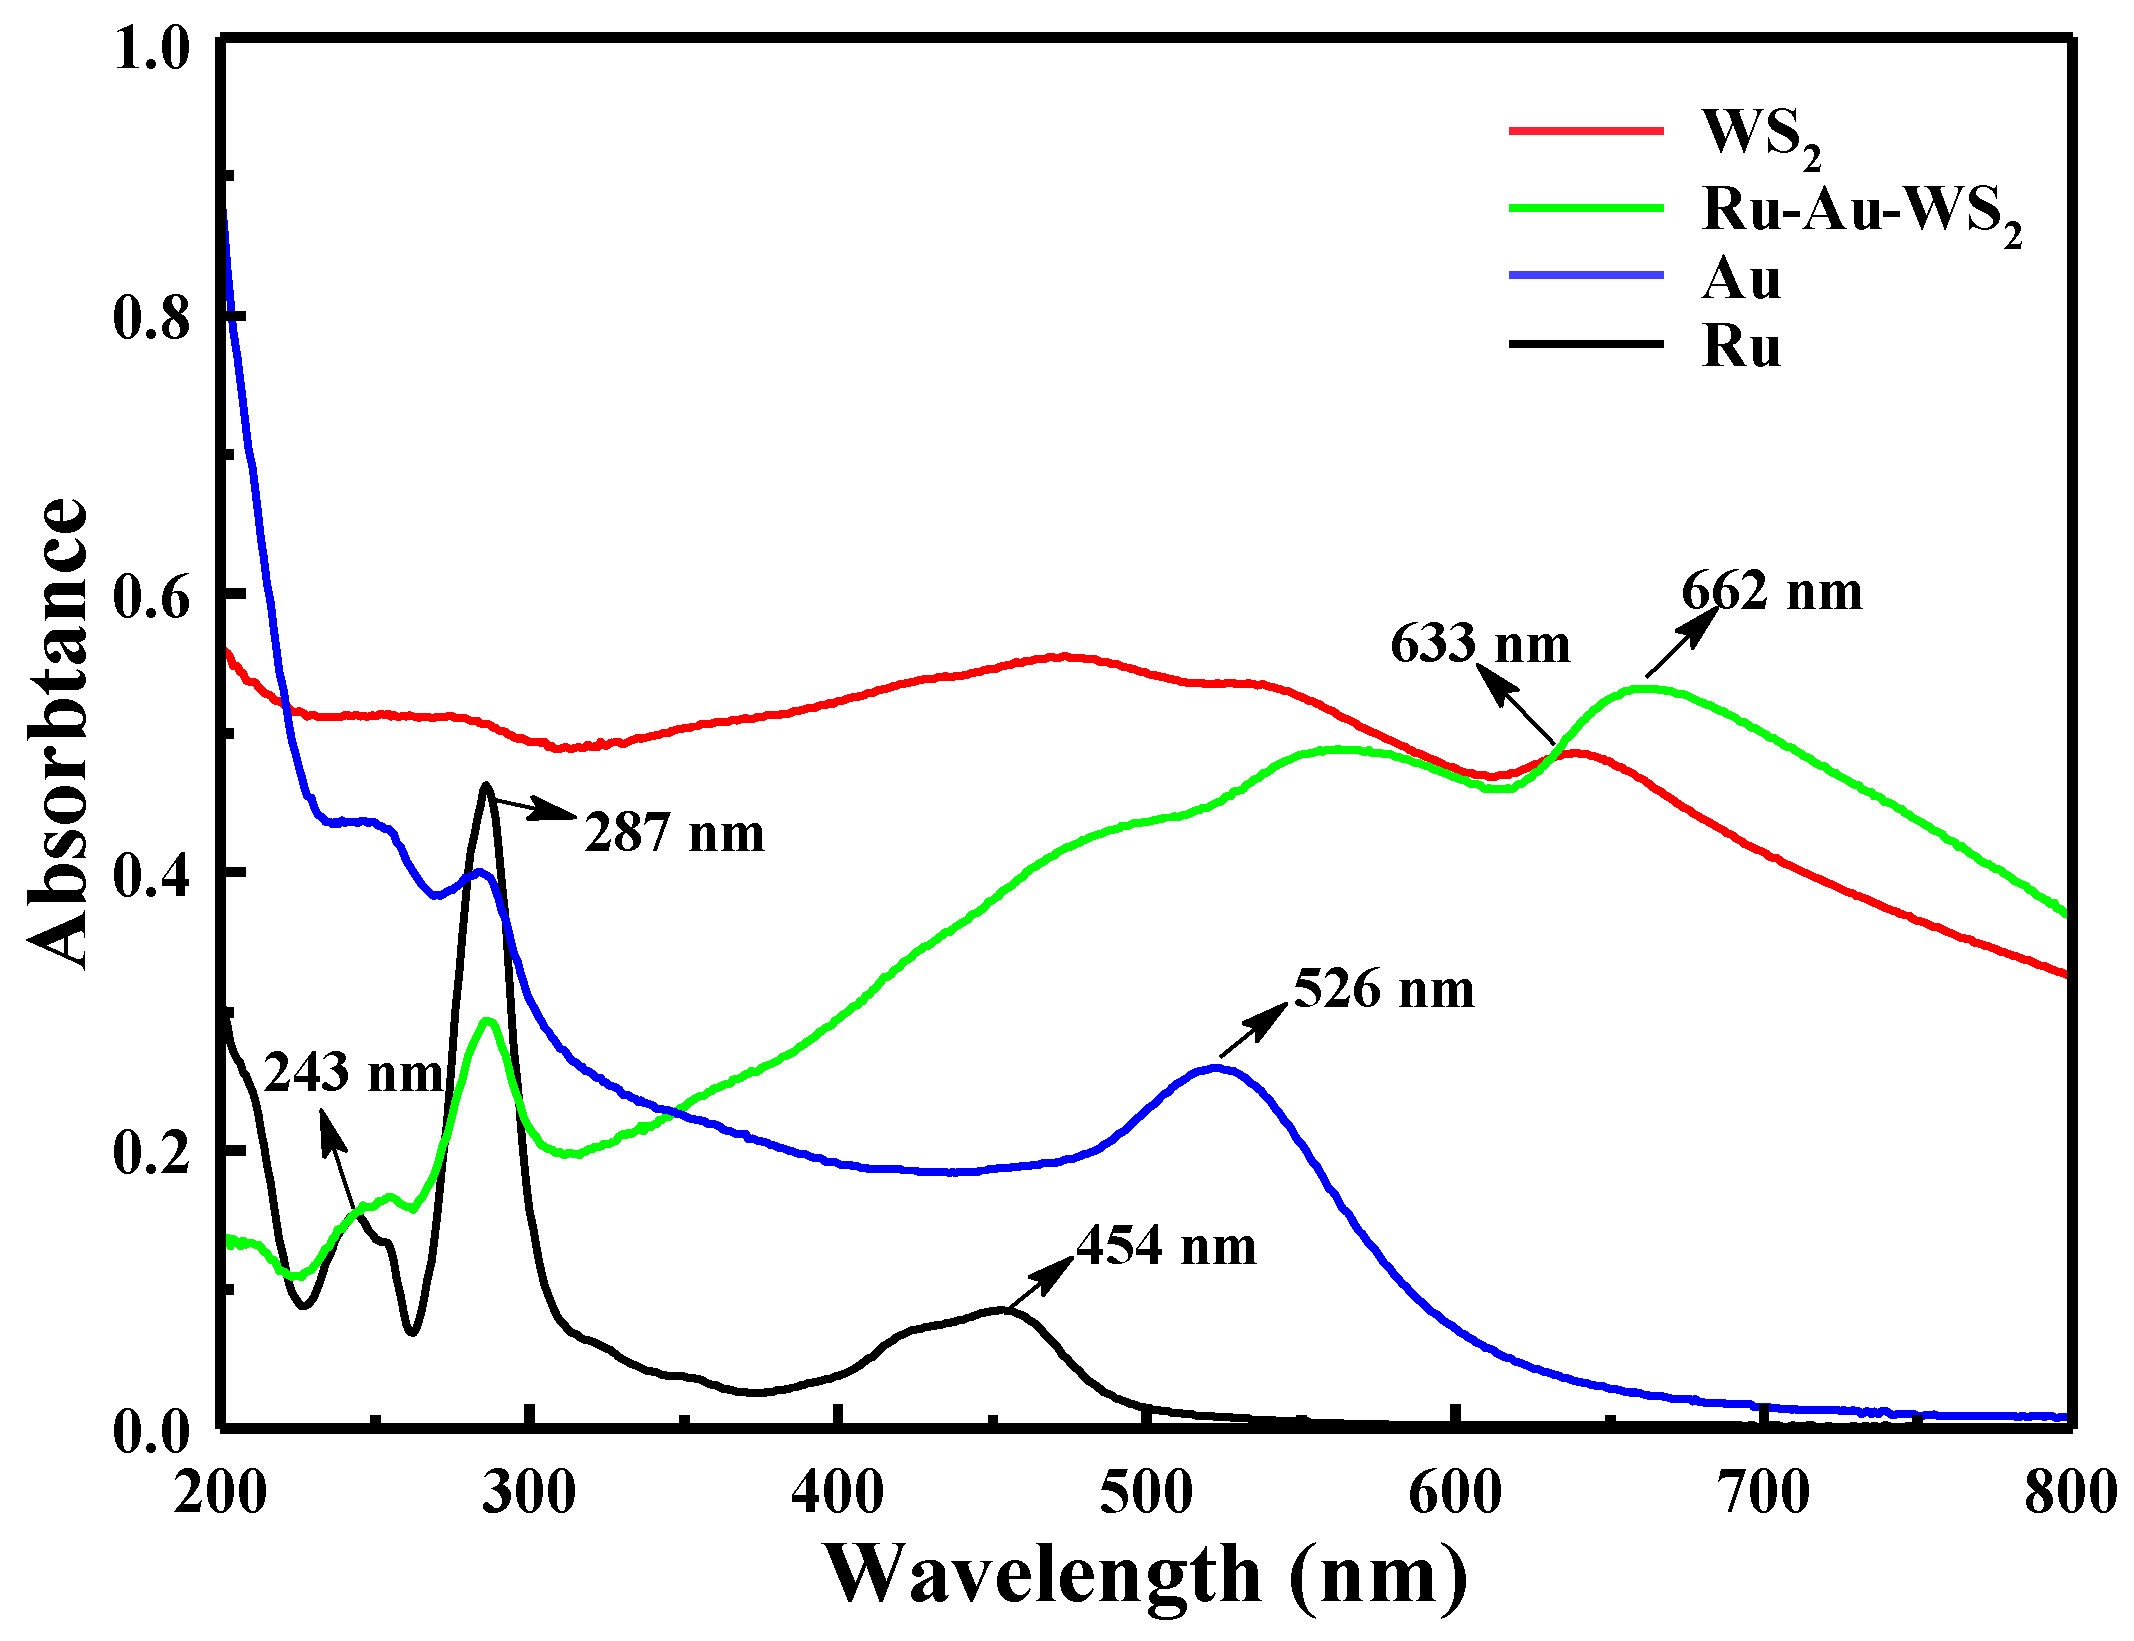
3.1. Characterization of WS2 NS and Ru-Au-WS2 NCs

The WS2 and Ru-Au-WS2 NCs were characterized by TEM. The layered structure of WS2 NS was confirmed by TEM results, as shown in Figure 2a. A large number of Au NPs are uniformly loaded on the surface of WS2. Since Ru(bpy)3Cl2 is positively charged and Au NPs are negatively charged [23], Ru-Au-WS2 NCs are aggregated by electrostatic interaction Figure 2b.
To investigate the properties of the synthesized Ru-Au-WS2 NCs, the UV-vis absorption spectra of the synthesized Ru-Au-WS2 NCs, Au NPs, WS2 sheets and pure Ru(bpy)32+ were recorded. As shown in Figure 3, the UV-vis absorption peaks at 287 and 454 in the Ru(bpy)32+ spectrum were attributed to the π–π* electronic transition of bi-pyridine and metal to ligand charge transfer adsorption, respectively. A typical absorption peak at 526 nm was assigned to the characteristic peak of Au NPs. Furthermore, WS2 displays an obvious absorption peak at 633 nm, and three inconspicuous absorption peaks at 530 nm, 460 nm and 420 nm, respectively. Compared to the absorption spectra of Ru(bpy)32+ (454 nm), Au NPs (526 nm) and WS2 (633 nm), the characteristic absorption peak of Ru-Au-WS2 NCs show different degrees of red-shift. All the above results demonstrate the successful preparation of Ru-Au-WS2 NCs.

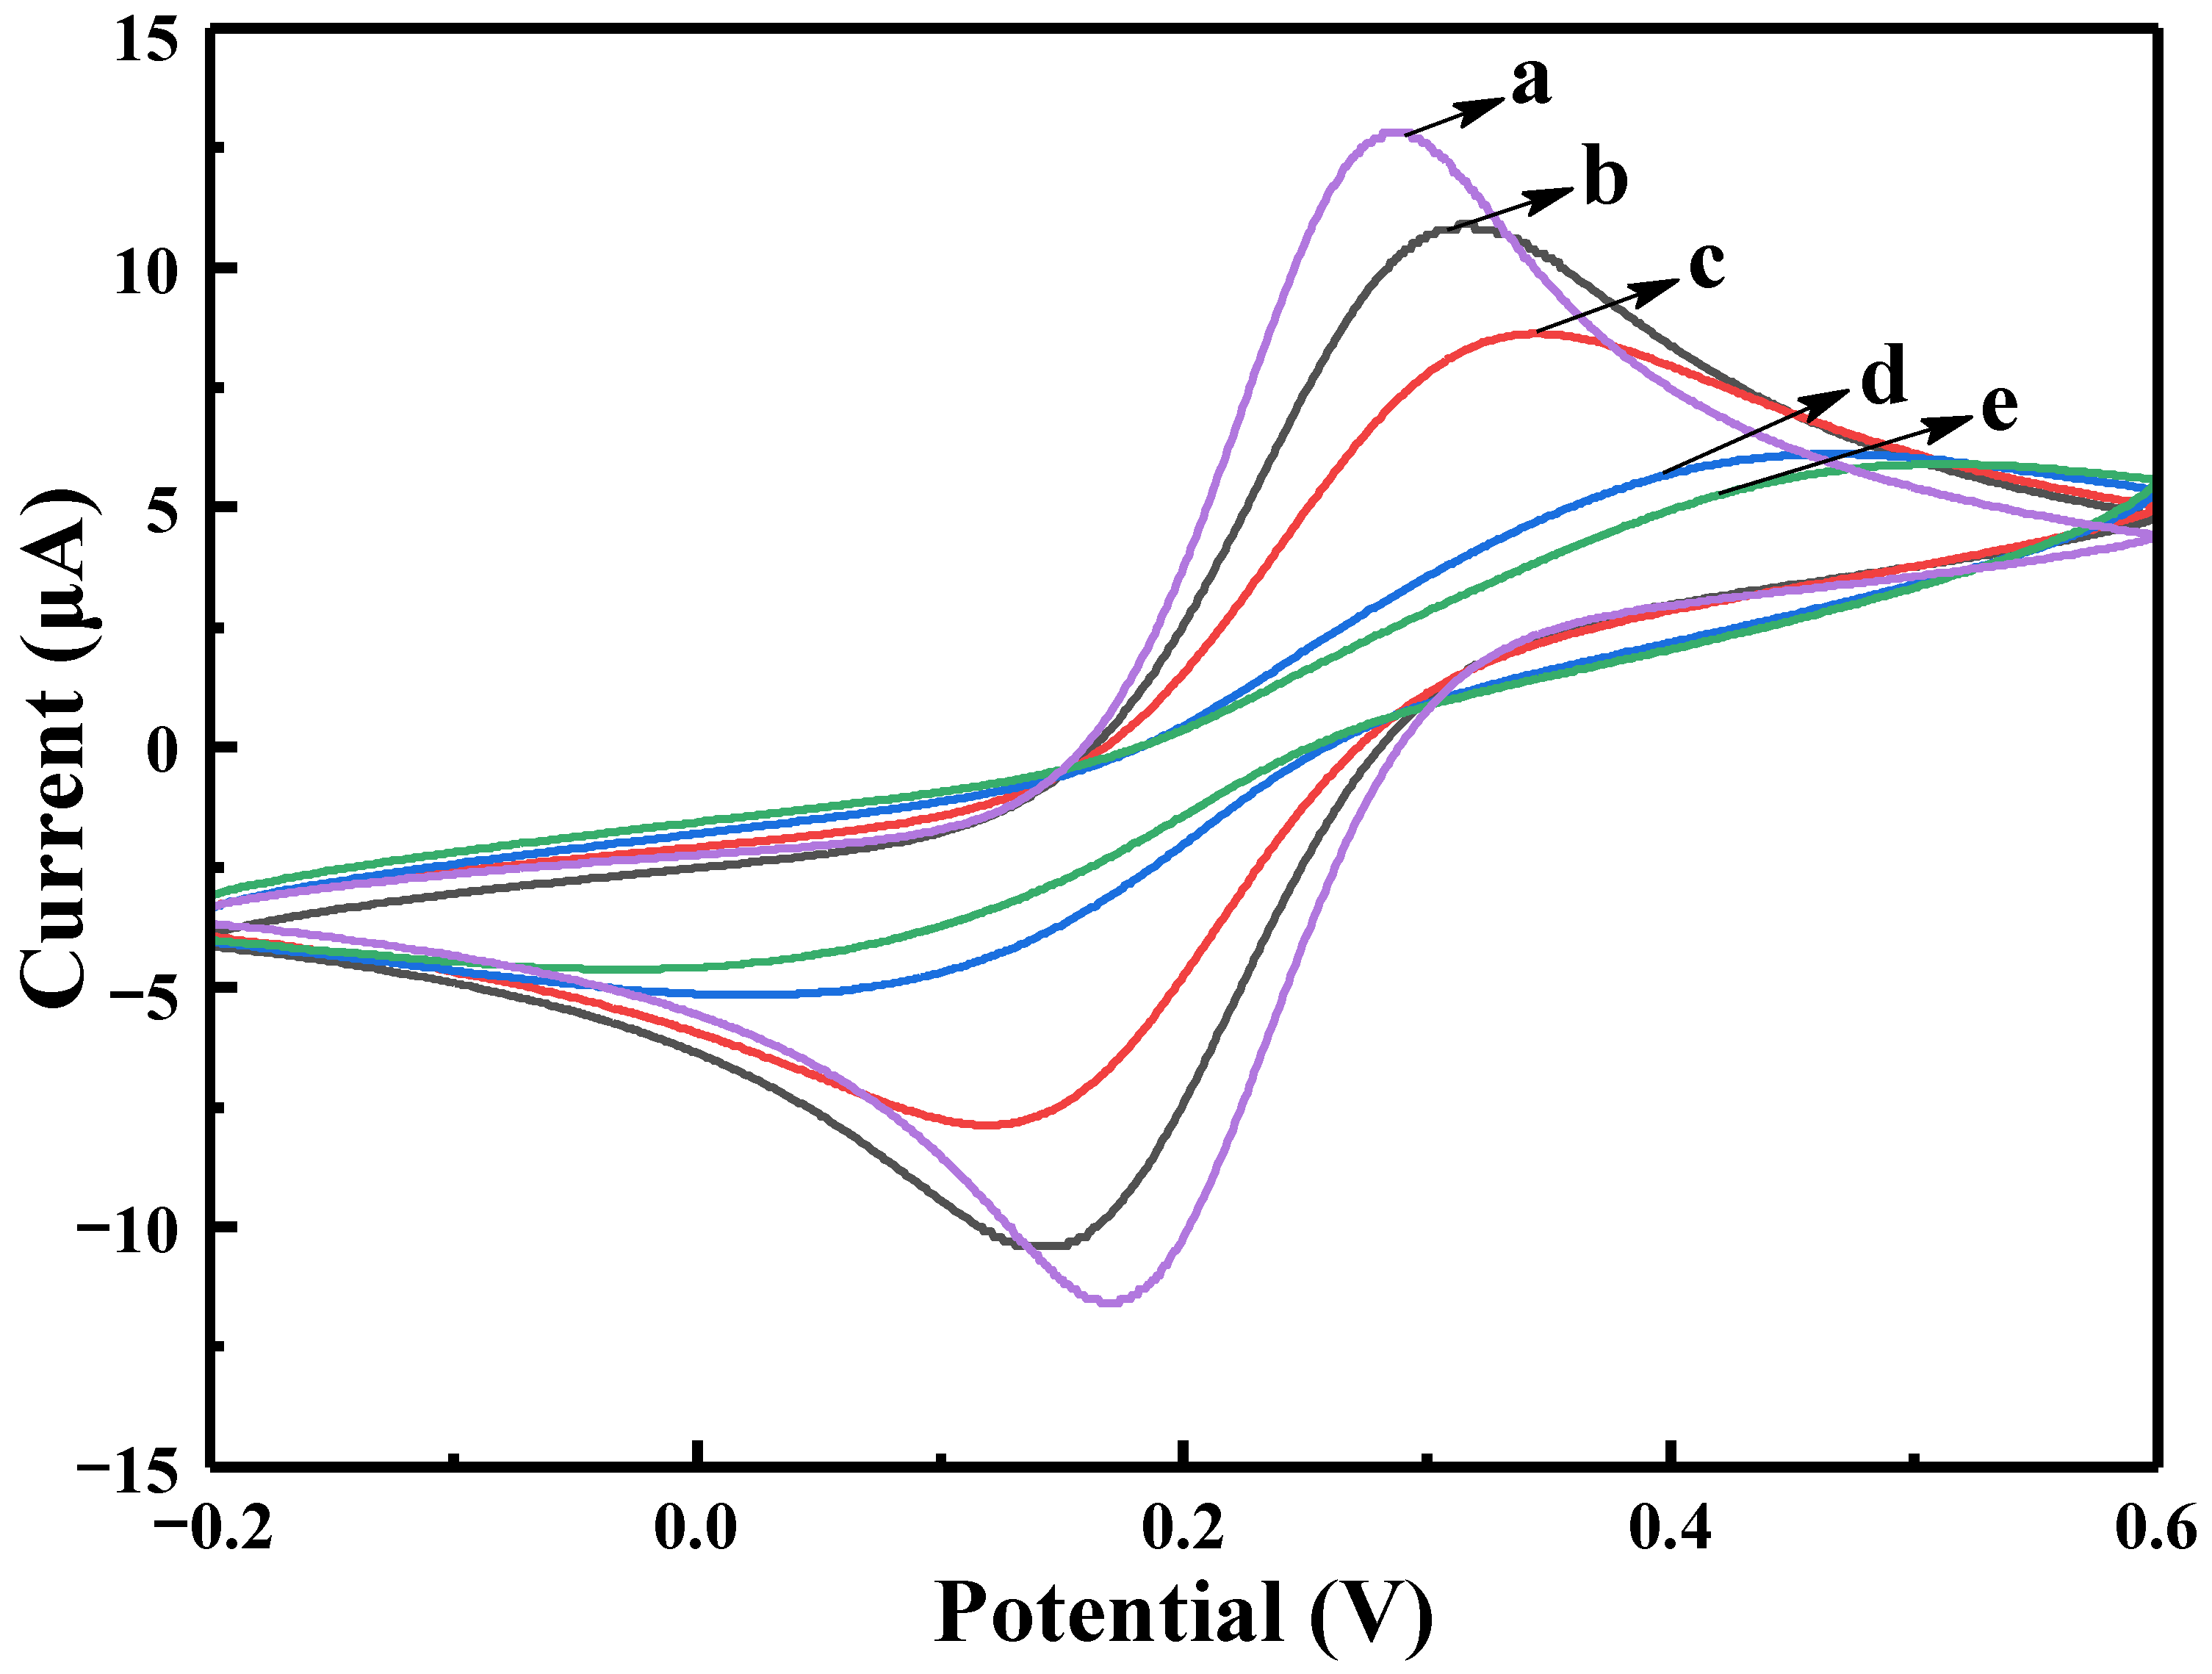
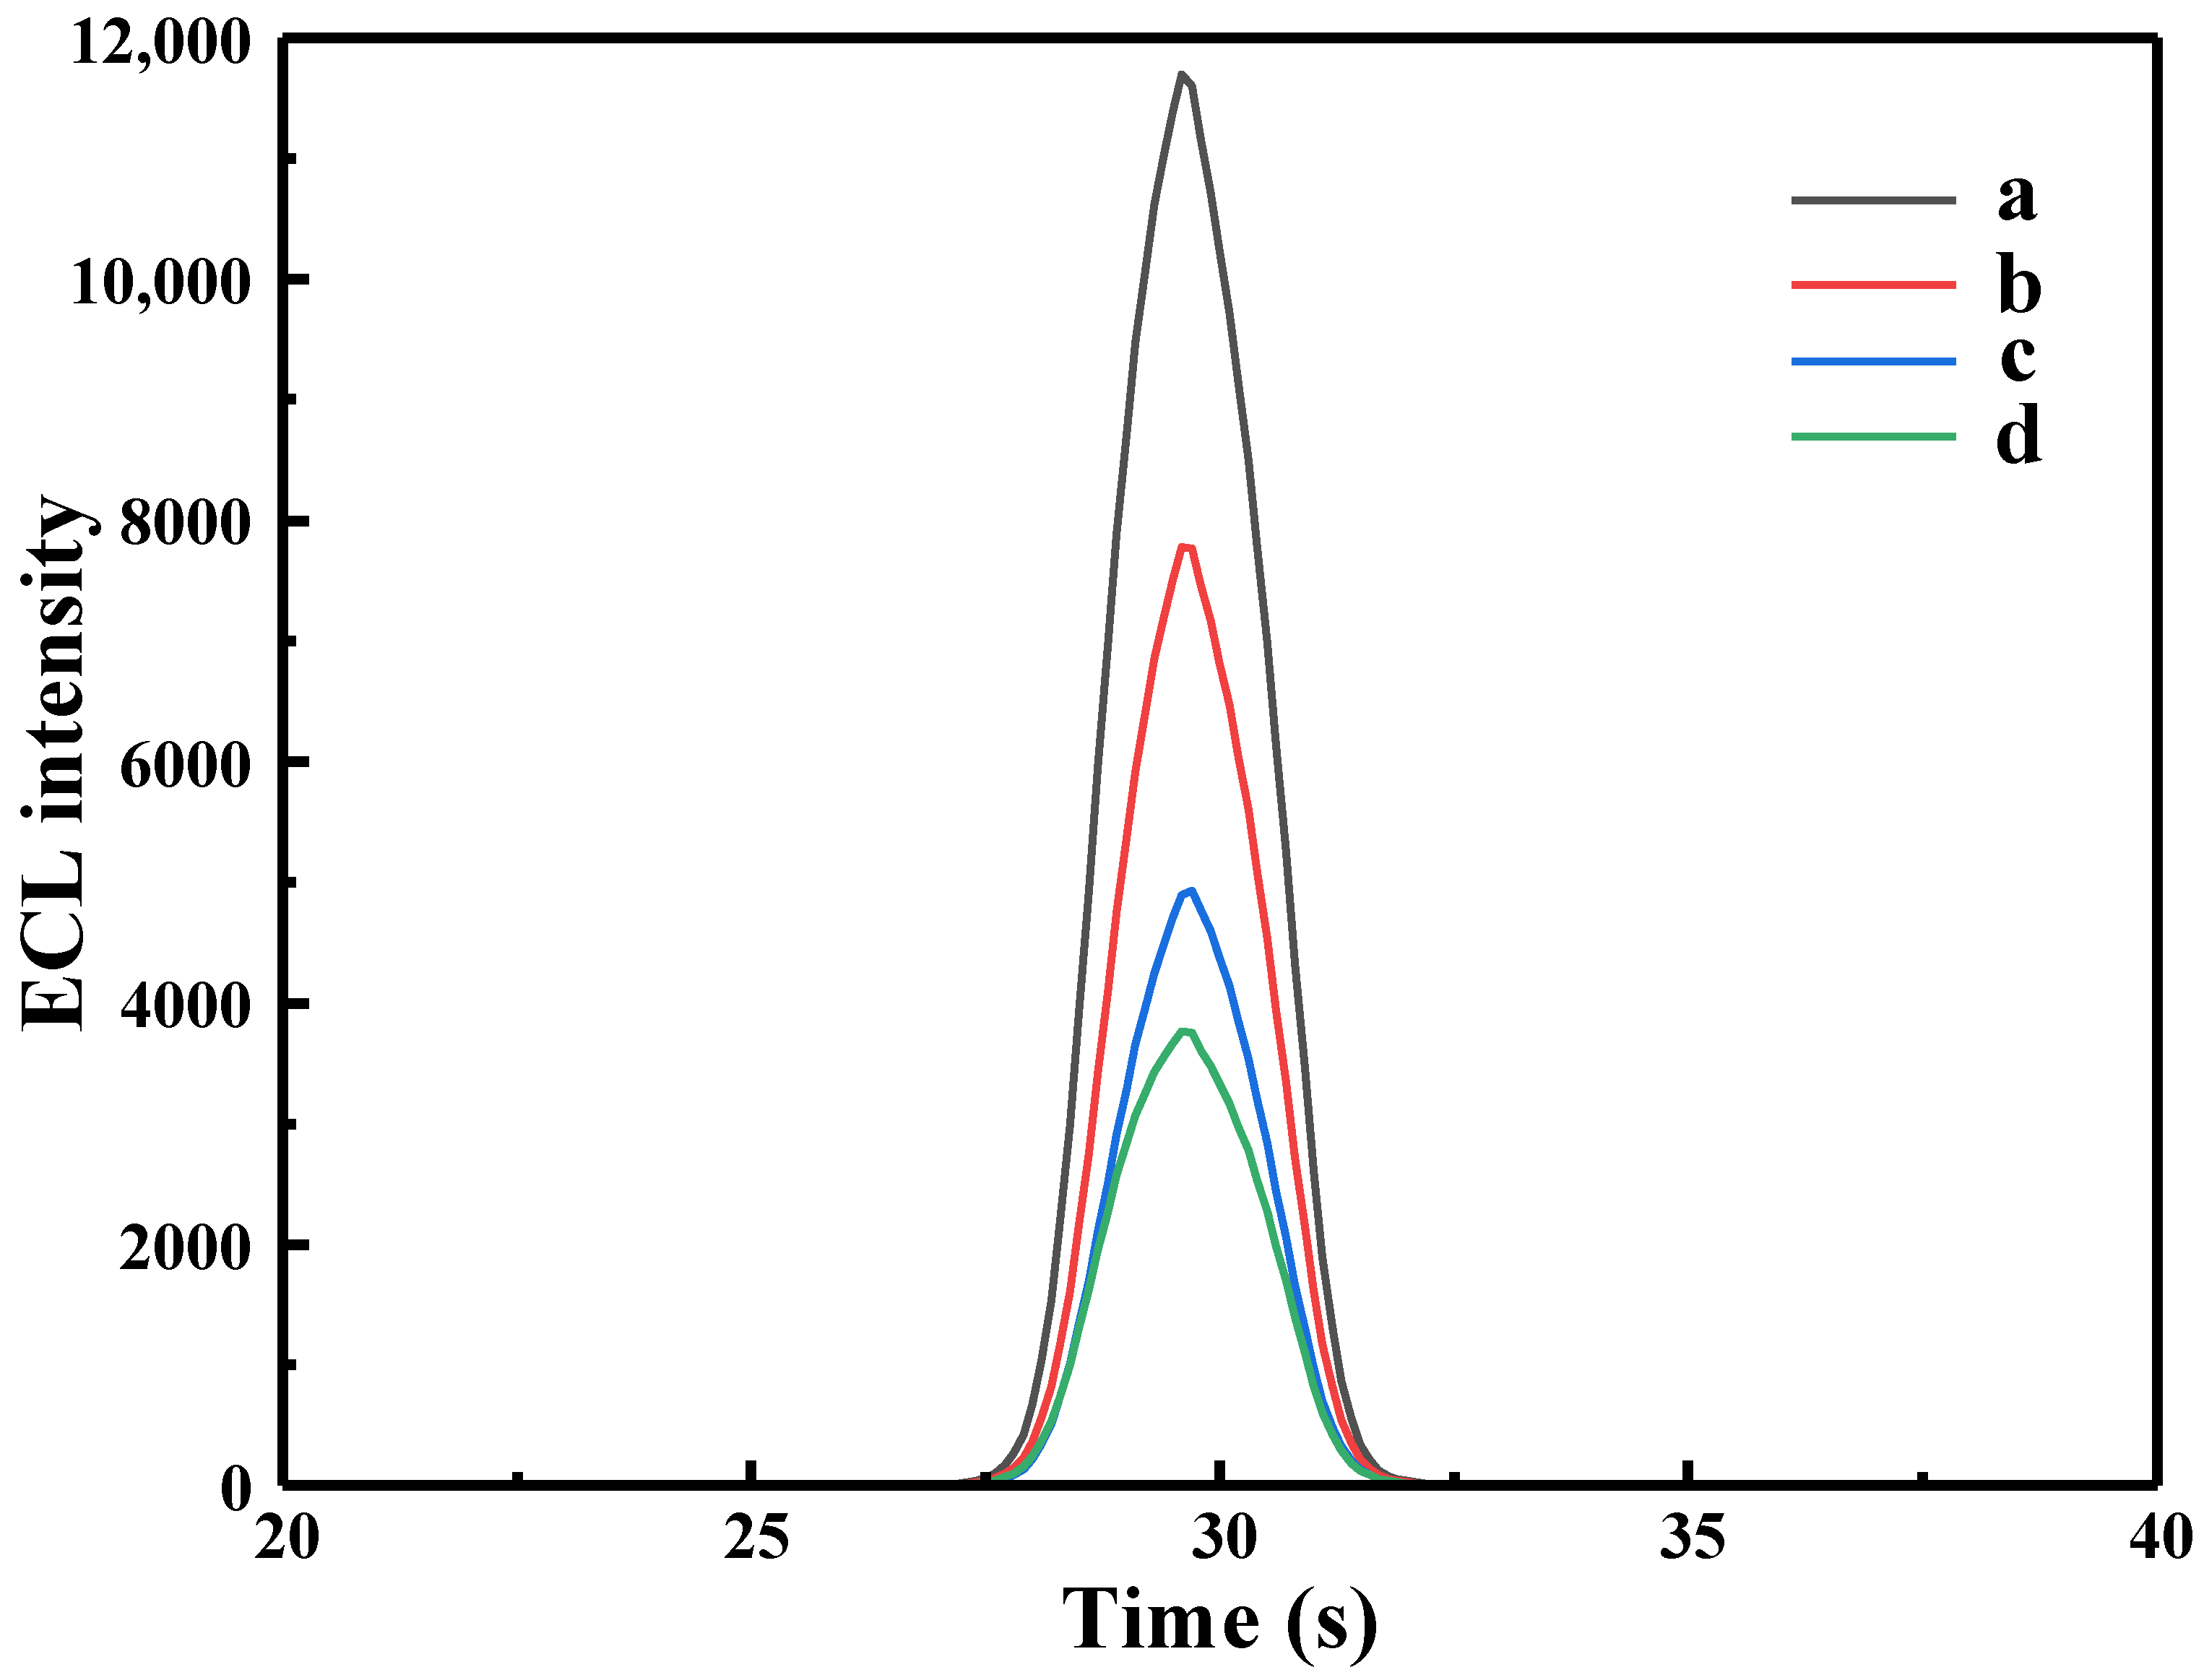
3.2. Electrochemical and Electrochemiluminescence Characterization of Modified Electrode

CV was used to electrochemically describe the immunosensor’s assembly process. At a scan rate of 100 mV s−1 in a solution of 5.0 mmol·L−1 potassium ferricyanide, all of the cyclic voltammetry curves were obtained within the potential range of −0.2–0.4 V, as shown in Figure 4. The bare electrode has an anodic peak at about 0.3 V, and a cathodic peak at 0.2 V, and the peak current is the largest compared to the other curves (curve a). After the Ru-Au-WS2 NCs were assembled, the peak current decreased slightly (curve b). Furthermore, the Ru-Au-WS2 NCs provide a large number of binding sites for anti-CEA immobilization. When 100 ng·mL−1 anti-CEA was added to the electrode surface, the peak current continued to fall, proving that the antibody had been successfully immobilized on the surface (curve c). The peak position difference and the peak current both significantly increased when BSA was used to block unbound antibody sites on the electrode surface (curve d). Additionally, the peak current decreased significantly due to the varying degrees of electron obstruction between anti-CEA and BSA. When 10 ng·mL−1 CEA antigen was added to the electrode, the peak current was further reduced (curve e). The specific antigen-antibody binding between anti-CEA and CEA, and the generated immune complex hindered the rate of electron transfer in the composite membrane, resulting in a decrease in the response current, which may account for this result.
In this experiment, TPA was selected as the co-reactant. A three-electrode system was used, with the working electrode being GCE/Ru-Au-WS2, the reference electrode being Ag/AgCl (saturated KCl), and the auxiliary electrode being Pt wire. The ECL properties of Ru-Au-WS2 NCs film were investigated in 0.1 mol·L−1 TPA solution using the reference experimental conditions (pH 7.4, PBS, 37 °C incubation for 60 min). The results are shown in Figure 5. As shown in (curve a), the synthesized Ru-Au-WS2 NCs has a strong ECL signal under experimental conditions, which also indicates that the Ru-Au-WS2 NCs were successfully prepared. As shown in (curve b), when the Ru-Au-WS2 NCs modified electrode was immobilized by Ab and a cross-linking reaction between glutaraldehyde, the ECL signal was significantly reduced, demonstrating that the antibody had been successfully immobilized on the electrode surface. Immediately afterward, as shown in (curve c), the unbound antibody site on the electrode surface was blocked with 0.5% BSA solution, and the ECL signal was found to decrease again. Finally, when the electrode was modified with 10 pg·mL−1 CEA antigen, the ECL signal kept declining, as shown in (curve d). This result should be attributed to the specific antigen-antibody binding between anti-CEA and CEA, and the generated immune complex once again hindered the transfer of electrons in the composite films. Consequently, the quantity of [Ru(bpy)32+]* produced by Ru(bpy)32+ reaction was decreased, which decreased the ECL signal.
The effects of CEA incubation time and TPA concentration on the behavior of the biosensor were examined to maximize the performance of the manufactured immunosensor. The best signal from the biosensor platform was produced when the TPA concentration was 0.1 mol·L−1 and the culture time was 30 min, as shown in Figure 6A,B. As a result, these circumstances were chosen as the best parameters for further CEA detection.

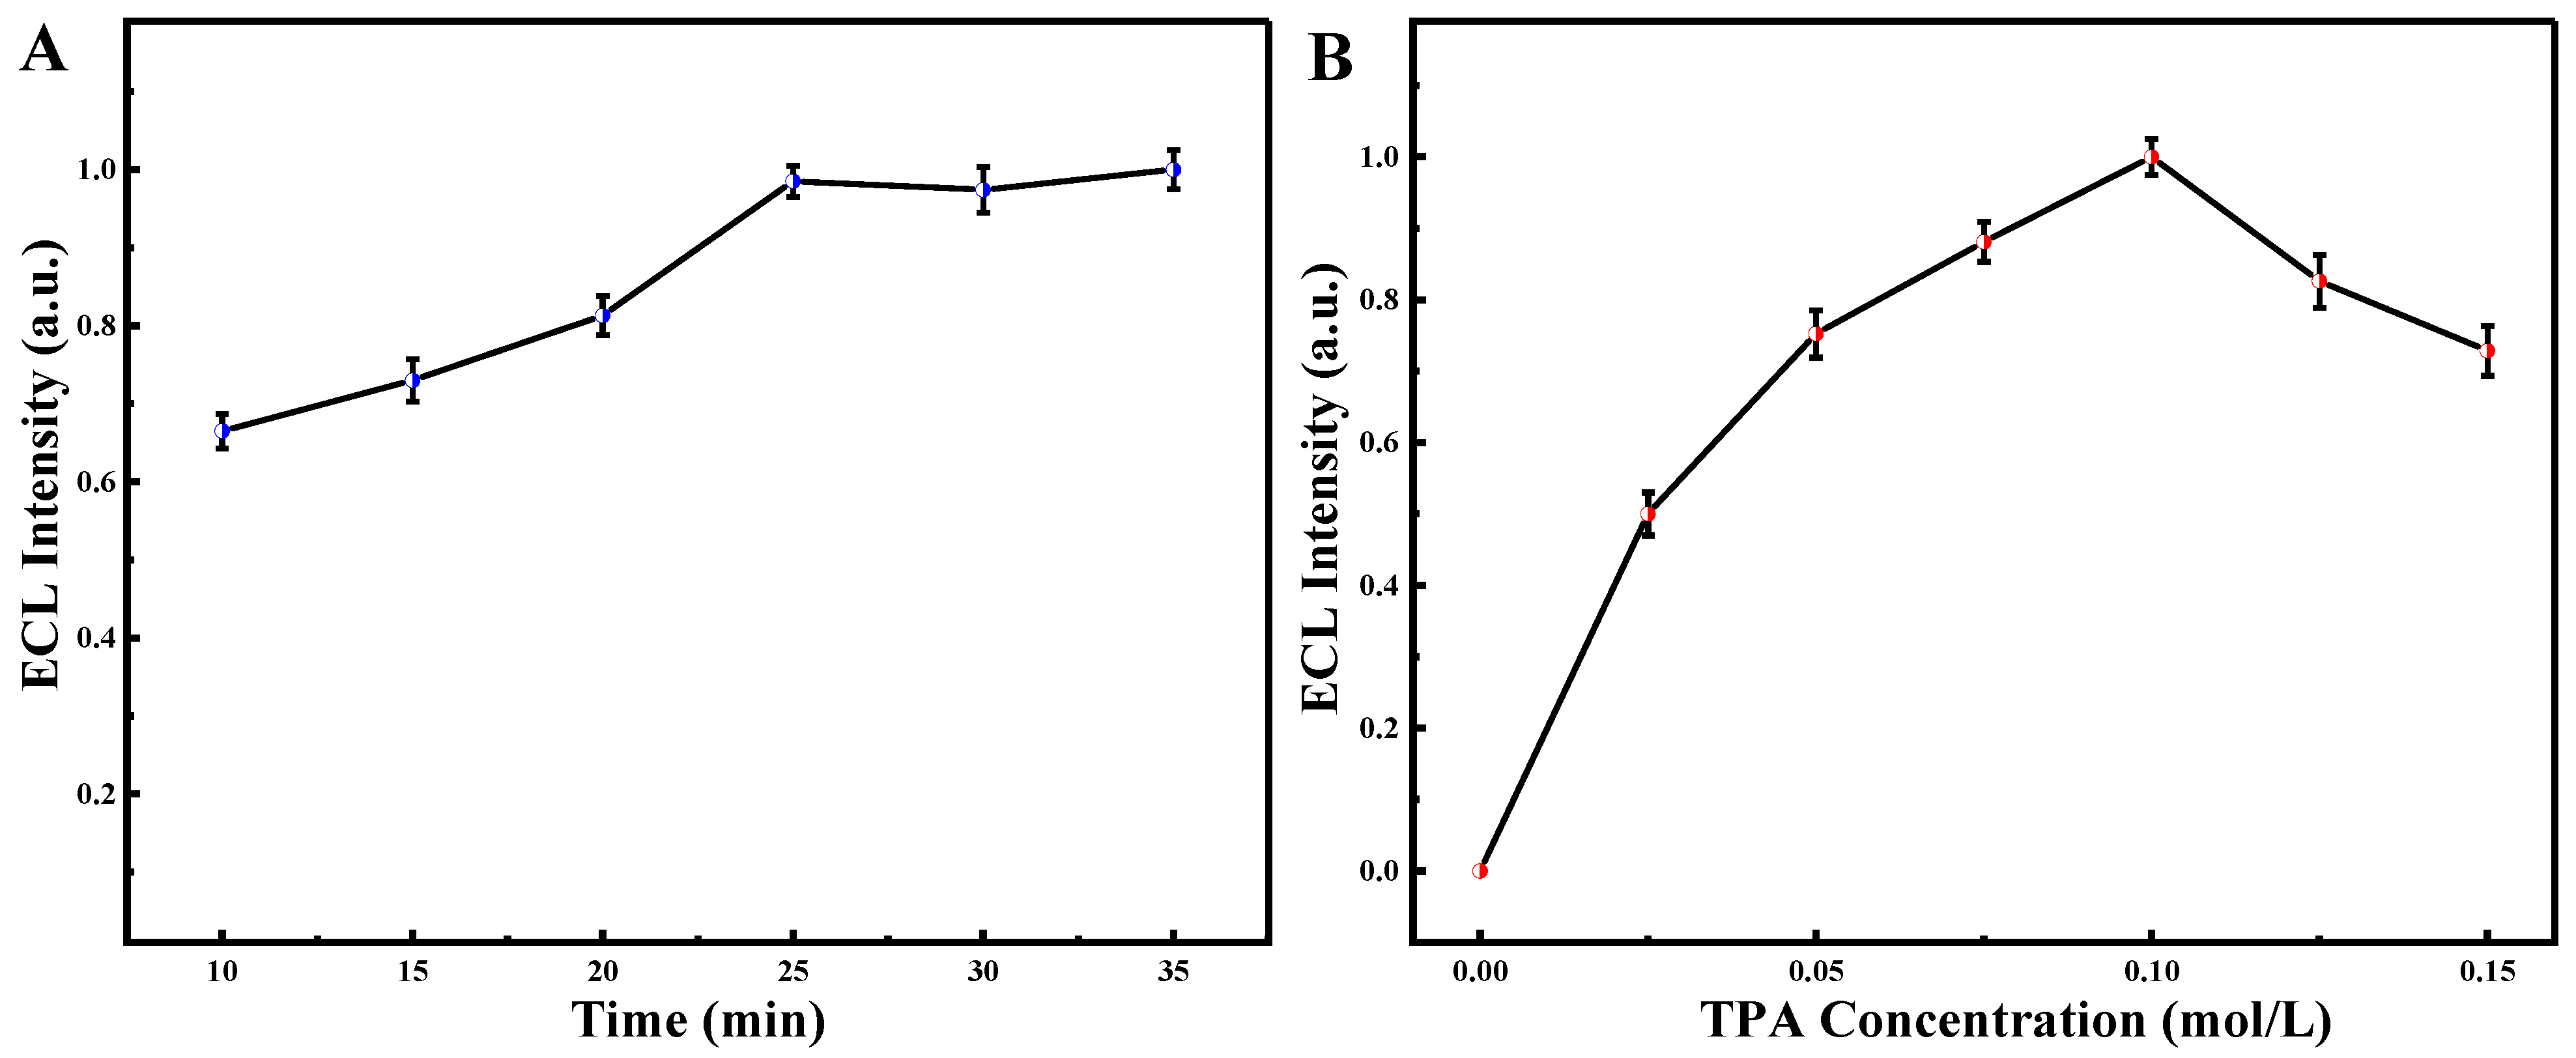
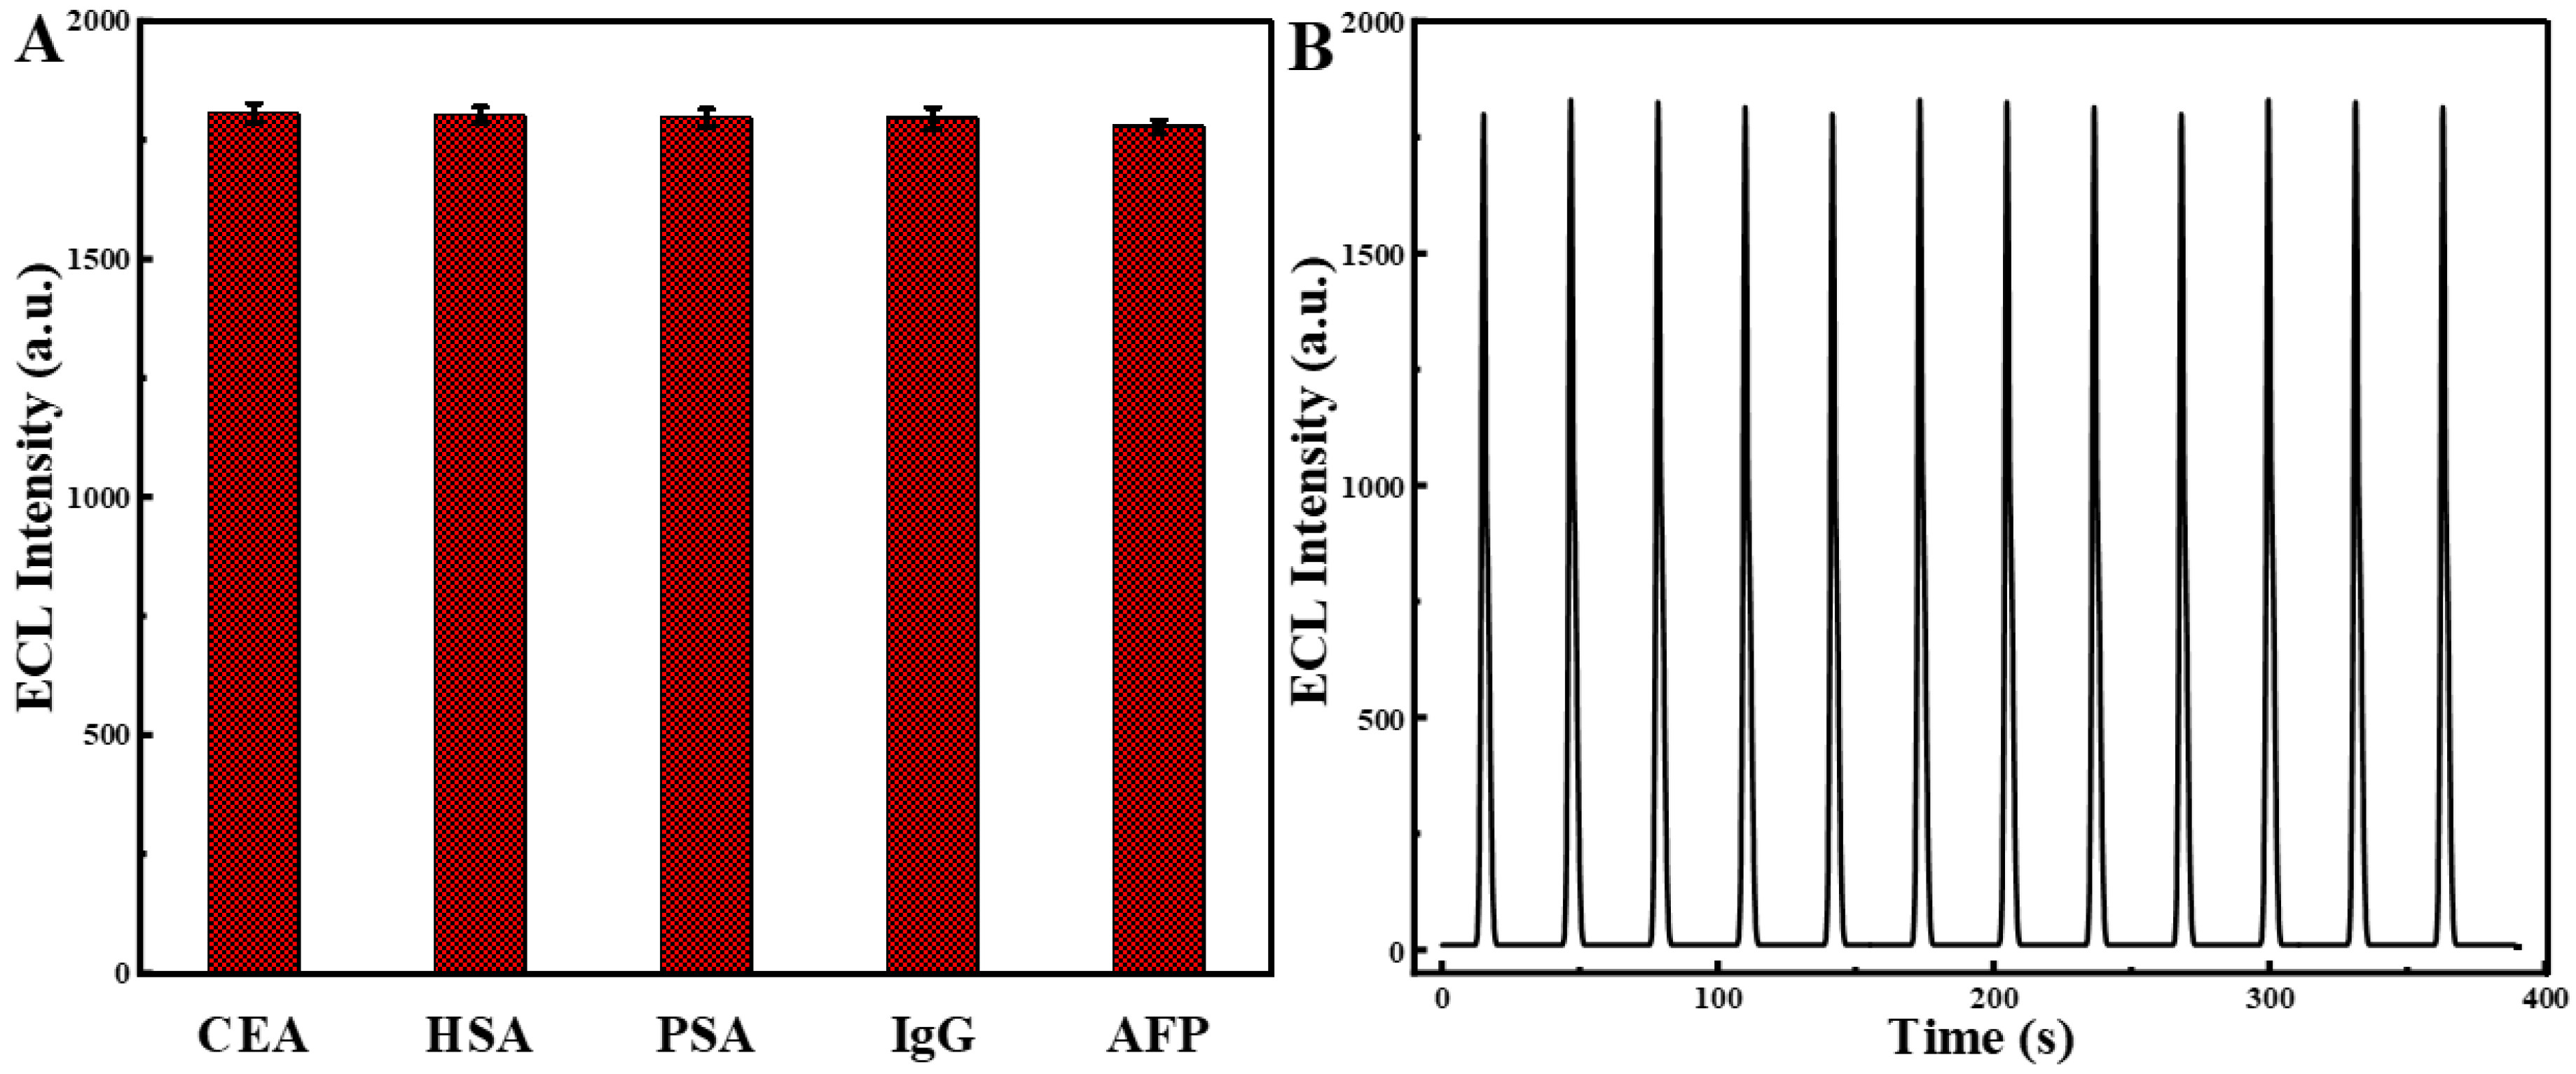
3.3. Quantitative Detection of CEA by Immunosensor

In addition, different concentrations of CEA antigen were incubated under the condition of GCE/Ru-Au-WS2/Ab/BSA modified electrodes as substrates. The quantitative detection of CEA antigen was realized in 0.1 mol·L−1 TPA solution. As shown in Figure 7, the ECL signal exhibits a decreasing trend as CEA antigen concentration rises. This can be explained as follows: with the increase in CEA concentration, anti-CEA has a specific antigen-antibody binding effect with CEA, and the immune complexes generated at the immune sensing interface increase, which continuously hinders the transfer of electrons in the composite film, so that the quantity of [Ru(bpy)32+]* produced by Ru(bpy)32+ reaction gradually declines, the ECL signal gradually declines. As a supplement, the linear range of the response of the sensor used in the experiment to CEA of different concentrations is 1 pg·mL−1–350 ng·mL−1, the linear equation is ip(μA) = −707.06178 + 2547.16748 logC(CEA) (ng·mL−1), and the detection limit is 0.3 pg·mL−1.
The selectivity of the designed biosensor was studied shown in Figure 8A. HSA (20 ng·mL−1), prostate-specific antigen (20 ng·mL−1), immunoglobulin G (20 ng·mL−1), and alpha-fetoprotein (20 ng·mL−1) interferences were added to 10 ng·mL−1 CEA at two times the concentration. Comparing the ECL reaction allowed for the evaluation of the specificity. The ECL signal of the mixture containing CEA alone (10 ng·mL−1) and HSA, PSA, IgG, and AFP was not significantly different from each other. The stability of the designed biosensor studied was shown in Figure 8B; after successive scans for 12 cycles, the ECL intensity of GCE/Ru-Au-WS2/Ab/BSA/CEA almost keeps constant, which manifests the stability of the designed biosensor.
Table 1 demonstrated some characteristic comparisons between Ru-Au-WS2 ECL biosensor and other 2D graphene-like materials methods.

4. Conclusions

In conclusion, an ECL immunoassay assembly is fabricated using the 0D Au NPs and 2D WS2. The application of graphene-like WS2 material effectively increased the loading of Ru(bpy)32+ on the surface of the electrode and exhibited high ECL intensity. Additionally, Au NP amplification was used to increase the detection sensitivity for protein ECL analysis. High sensitivity, a broad linear range, good reproducibility, and acceptable precision and accuracy were all displayed by the proposed immunosensor. This work offers a fresh immobile substrate for the identification of additional tumor markers. Designing new ECL systems for biosensor applications may be aided by the synergy between the 0D and 2D structures.

Author Contributions

Conceptualization, H.P. and Q.L.; methodology, Q.L. and K.X.; software, K.X. and H.Z.; validation, Z.H. and C.X.; formal analysis, Z.Z.; investigation, H.P., L.S. and Q.L.; resources, H.Z. and Z.H.; data curation, K.X. and C.X.; writing—original draft preparation, Q.L. and K.X.; writing—review and editing, Q.L., H.Z. and L.S.; visualization, Z.Z.; supervision, Q.L.; project administration, Z.H., H.P. and L.S.; funding acquisition, Q.L., Z.H. and L.S. All authors have read and agreed to the published version of the manuscript.

Funding

This research was funded by Lianyungang Haiyan Plan (2018-QD-019), the Postgraduate Research and Practice Innovation Program in Jiangsu Province (SY202204X).

Institutional Review Board Statement

Not applicable.

Informed Consent Statement

Not applicable.

Data Availability Statement

Not applicable.

Conflicts of Interest

The authors declare no conflict of interest.

References

  1. Taitt, H.E. Global Trends and Prostate Cancer: A Review of Incidence, Detection, and Mortality as Influenced by Race, Ethnicity, and Geographic Location. Am. J. Mens. Health 2018, 12, 1807–1823. [Google Scholar] [CrossRef] [PubMed] [Green Version]
  2. Fletcher, R.H. Carcinoembryonic Antigen. Ann. Intern. Med. 1986, 104, 66. [Google Scholar] [CrossRef] [PubMed] [Green Version]
  3. Li, P.; Li, W.; Xie, Z.; Zhan, H.; Deng, L.; Huang, J. A Label-free and Signal-amplifiable Assay Method for Colorimetric Detection of Carcinoembryonic Antigen. Biotechnol. Bioeng. 2022, 119, 504–512. [Google Scholar] [CrossRef] [PubMed]
  4. Lin, D.; Li, B.; Fu, L.; Qi, J.; Xia, C.; Zhang, Y.; Chen, J.; Choo, J.; Chen, L. A Novel Polymer-Based Nitrocellulose Platform for Implementing a Multiplexed Microfluidic Paper-Based Enzyme-Linked Immunosorbent Assay. Microsyst. Nanoeng. 2022, 8, 53. [Google Scholar] [CrossRef]
  5. Sakurai, T.; Katsumata, K.; Udo, R.; Tago, T.; Kasahara, K.; Mazaki, J.; Kuwabara, H.; Kawakita, H.; Enomoto, M.; Ishizaki, T.; et al. Validation of Urinary Charged Metabolite Profiles in Colorectal Cancer Using Capillary Electrophoresis-Mass Spectrometry. Metabolites 2022, 12, 59. [Google Scholar] [CrossRef]
  6. de Gooyer, J.M.; Elekonawo, F.M.K.; Bremers, A.J.A.; Boerman, O.C.; Aarntzen, E.H.J.G.; de Reuver, P.R.; Nagtegaal, I.D.; Rijpkema, M.; de Wilt, J.H.W. Multimodal CEA-Targeted Fluorescence and Radioguided Cytoreductive Surgery for Peritoneal Metastases of Colorectal Origin. Nat. Commun. 2022, 13, 2621. [Google Scholar] [CrossRef]
  7. Wang, X.; Liao, X.; Zhang, B.; Chen, S.; Zhang, M.; Mei, L.; Zhang, L.; Qiao, X.; Hong, C. Fabrication of a Novel Electrochemical Immunosensor for the Sensitive Detection of Carcinoembryonic Antigen Using a Double Signal Attenuation Strategy. Anal. Chim. Acta 2022, 1232, 340455. [Google Scholar] [CrossRef]
  8. Ma, C.; Cao, Y.; Gou, X.; Zhu, J.-J. Recent Progress in Electrochemiluminescence Sensing and Imaging. Anal. Chem. 2020, 92, 431–454. [Google Scholar] [CrossRef]
  9. Dong, Y.-P.; Zhou, Y.; Wang, J.; Zhu, J.-J. Electrogenerated Chemiluminescence Resonance Energy Transfer between Ru(Bpy)32+ Electrogenerated Chemiluminescence and Gold Nanoparticles/Graphene Oxide Nanocomposites with Graphene Oxide as Coreactant and its Sensing Application. Anal. Chem. 2016, 88, 5469–5475. [Google Scholar] [CrossRef]
  10. Yang, J.-J.; Cao, J.-T.; Wang, Y.-L.; Wang, H.; Liu, Y.-M.; Ma, S.-H. Sandwich-like Electrochemiluminescence Aptasensor Based on Dual Quenching Effect from Hemin-Graphene Nanosheet and Enzymatic Biocatalytic Precipitation for Sensitive Detection of Carcinoembryonic Antigen. J. Electroanal. Chem. 2017, 787, 88–94. [Google Scholar] [CrossRef]
  11. Xu, M.; Liang, T.; Shi, M.; Chen, H. Graphene-Like Two-Dimensional Materials. Chem. Rev. 2013, 113, 3766–3798. [Google Scholar] [CrossRef] [PubMed]
  12. Ramakrishna Matte, H.S.S.; Gomathi, A.; Manna, A.K.; Late, D.J.; Datta, R.; Pati, S.K.; Rao, C.N.R. MoS2 and WS2 Analogues of Graphene. Angew. Chem. Int. Ed. 2010, 49, 4059–4062. [Google Scholar] [CrossRef] [PubMed]
  13. Dai, C.; Zhou, Z.; Tian, C.; Li, Y.; Yang, C.; Gao, X.; Tian, X. Large-Scale Synthesis of Graphene-Like MoSe2 Nanosheets for Efficient Hydrogen Evolution Reaction. J. Phys. Chem. C 2017, 121, 1974–1981. [Google Scholar] [CrossRef]
  14. Wang, X.; Chen, Y.; Zheng, B.; Qi, F.; He, J.; Li, Q.; Li, P.; Zhang, W. Graphene-like WSe2 Nanosheets for Efficient and Stable Hydrogen Evolution. J. Alloys Compd. 2017, 691, 698–704. [Google Scholar] [CrossRef]
  15. Kufer, D.; Nikitskiy, I.; Lasanta, T.; Navickaite, G.; Koppens, F.H.L.; Konstantatos, G. Hybrid 2D-0D MoS2 -PbS Quantum Dot Photodetectors. Adv. Mater. 2015, 27, 176–180. [Google Scholar] [CrossRef] [PubMed]
  16. Ye, M.; Zhao, Z.; Hu, Z.; Liu, L.; Ji, H.; Shen, Z.; Ma, T. 0D/2D Heterojunctions of Vanadate Quantum Dots/Graphitic Carbon Nitride Nanosheets for Enhanced Visible-Light-Driven Photocatalysis. Angew. Chem. Int. Ed. 2017, 56, 8407–8411. [Google Scholar] [CrossRef] [PubMed] [Green Version]
  17. Hou, S.; Wang, P.; Nie, Y.; Guo, Y.; Ma, Q. A Novel Work Function Tuning Strategy-Based ECL Sensor with Sulfur Dots and Au NP@MoS2 Nanosheet Heterostructure for Triple-Negative Breast Cancer Diagnosis. Chem. Eng. J. 2022, 446, 136906. [Google Scholar] [CrossRef]
  18. Shorie, M.; Kumar, V.; Kaur, H.; Singh, K.; Tomer, V.K.; Sabherwal, P. Plasmonic DNA Hotspots Made from Tungsten Disulfide Nanosheets and Gold Nanoparticles for Ultrasensitive Aptamer-Based SERS Detection of Myoglobin. Microchim. Acta 2018, 185, 158. [Google Scholar] [CrossRef]
  19. Huang, K.-J.; Liu, Y.-J.; Zhang, J.-Z.; Liu, Y.-M. A Novel Aptamer Sensor Based on Layered Tungsten Disulfide Nanosheets and Au Nanoparticles Amplification for 17β-Estradiol Detection. Anal. Methods 2014, 6, 8011–8017. [Google Scholar] [CrossRef]
  20. Li, T.; Shang, D.; Gao, S.; Wang, B.; Kong, H.; Yang, G.; Shu, W.; Xu, P.; Wei, G. Two-Dimensional Material-Based Electrochemical Sensors/Biosensors for Food Safety and Biomolecular Detection. Biosensors 2022, 12, 314. [Google Scholar] [CrossRef]
  21. Valenti, G.; Rampazzo, E.; Kesarkar, S.; Genovese, D.; Fiorani, A.; Zanut, A.; Palomba, F.; Marcaccio, M.; Paolucci, F.; Prodi, L. Electrogenerated Chemiluminescence from Metal Complexes-Based Nanoparticles for Highly Sensitive Sensors Applications. Coordin. Chem. Rev. 2018, 367, 65–81. [Google Scholar] [CrossRef]
  22. Qiu, J.-D.; Peng, H.-Z.; Liang, R.-P.; Li, J.; Xia, X.-H. Synthesis, Characterization, and Immobilization of Prussian Blue-Modified Au Nanoparticles: Application to Electrocatalytic Reduction of H2O2. Langmuir 2007, 23, 2133–2137. [Google Scholar] [CrossRef] [PubMed]
  23. Mao, L.; Yuan, R.; Chai, Y.; Zhuo, Y.; Yang, X.; Yuan, S. Multi-Walled Carbon Nanotubes and Ru(Bpy)32+/Nano-Au Nano-Sphere as Efficient Matrixes for a Novel Solid-State Electrochemiluminescence Sensor. Talanta 2010, 80, 1692–1697. [Google Scholar] [CrossRef] [PubMed]
  24. Hu, Y.; Huang, Y.; Wang, Z.; Wang, Y.; Ye, X.; Wong, W.; Li, C.; Sun, D. Gold/WS2 Nanocomposites Fabricated by in-Situ Ultrasonication and Assembling for Photoelectrochemical Immunosensing of Carcinoembryonic Antigen. Microchim. Acta 2018, 185, 570. [Google Scholar] [CrossRef]
  25. Hong, G.; Chen, R.; Xu, L.; Lu, X.; Yang, Z.; Zhou, G.; Li, L.; Chen, W.; Peng, H. One-Pot Ultrasonic Synthesis of Multifunctional Au Nanoparticle-Ferrocene-WS2 Nanosheet Composite for the Construction of an Electrochemical Biosensing Platform. Anal. Chim. Acta 2020, 1099, 52–59. [Google Scholar] [CrossRef] [PubMed]
  26. Medetalibeyoglu, H.; Kotan, G.; Atar, N.; Yola, M.L. A Novel Sandwich-Type SERS Immunosensor for Selective and Sensitive Carcinoembryonic Antigen (CEA) Detection. Anal. Chim. Acta 2020, 1139, 100–110. [Google Scholar] [CrossRef] [PubMed]
  27. Song, Y.; Qiao, J.; Li, W.; Ma, C.; Chen, S.; Li, H.; Hong, C. Bimetallic PtCu Nanoparticles Supported on Molybdenum Disulfide—Functionalized Graphitic Carbon Nitride for the Detection of Carcinoembryonic Antigen. Microchim. Acta 2020, 187, 538. [Google Scholar] [CrossRef] [PubMed]
  28. Su, S.; Sun, Q.; Wan, L.; Gu, X.; Zhu, D.; Zhou, Y.; Chao, J.; Wang, L. Ultrasensitive Analysis of Carcinoembryonic Antigen Based on MoS2-Based Electrochemical Immunosensor with Triple Signal Amplification. Biosens. Bioelectron. 2019, 140, 111353. [Google Scholar] [CrossRef]
Figure 1. The schematic preparation process of immunosensor.
Biosensors 13 00058 g001
Figure 2. TEM images of (a) WS2, and (b) Ru-Au-WS2 NCs.
Biosensors 13 00058 g002
Figure 3. UV-vis absorption spectra of Au, Ru, WS2 and Ru-Au-WS2 NCs.
Biosensors 13 00058 g003
Figure 4. Cyclic voltammetric test diagram of modified electrodes in different states: (a) GCE, (b) GCE/Ru-AuWS2, (c) GCE/Ru-Au-WS2/Ab, (d) GCE/Ru-Au-WS2/Ab/BSA, (e) GCE/Ru-Au-WS2/Ab/BSA/CEA.
Biosensors 13 00058 g004
Figure 5. ECL diagram of modified electrodes in different states: (a) GCE/Ru-Au-WS2, (b) GCE/Ru-Au-WS2/Ab, (c) GCE/Ru-Au-WS2/Ab/BSA, (d) GCE/Ru-Au-WS2/Ab/BSA/CEA.
Biosensors 13 00058 g005
Figure 6. The effects of incubation time of CEA (A) and the concentration of TPA (B).
Biosensors 13 00058 g006
Figure 7. The ECL curve for quantitative detection using GCE/Ru-Au-WS2/Ab/BSA, the antigen concentration from left to right is: (a) 0.001, (b) 0.01, (c) 0.1, (d) 1, (e) 10, (f) 100, (g) 200, (h) 300, (i) 350 ng·mL−1, the inset shows the linear relationship between ECL signal and antigen concentration.
Biosensors 13 00058 g007
Figure 8. The selectivity of CEA 10 ng·mL−1 and CEA 10 ng·mL−1 mix 20 ng·mL−1 Human Serum Albumin (HSA), prostate-specific antigen (PSA), immunoglobulin G (IgG) and alpha-fetoprotein (AFP) (A) and the stability of GCE/Ru-Au-WS2/Ab/BSA/CEA (B).
Biosensors 13 00058 g008
Table 1. A comparison of different methods for the detection of CEA.
ImmunosensorDetection MethodLinear Range (ng·mL−1)LOD (pg·mL−1)Refs.
Anti-CEA(BSA)/Au/WS2/GCEPEC0.001–40 ng·mL−10.5 pg·mL−1[24]
AFW-CA72-4-Ab2/CA72-4/CA72-4-Ab1/IBM/GCEDPV/CV2–50 U/L0.6 U/L[25]
anti-CEA/Fe3O4 NPs@Au NPs/d-Ti3C2TX MXeneSERS0.0001–100 ng·mL−10.033 pg·mL−1[26]
MoS2/g-C3N4-PtCu/Ab2/BSA/CEA/Ab1/MoS2-Au NPs/GCEi-t0.0001–80 ng·mL−10.03 pg·mL−1[27]
nanoprobe/CEA/BSA/anti-CEA/MoS2-AuNPs/GCEDPV/CV0.00001–1 ng·mL−10.0012 pg·mL−1[28]
GCE/Ru-Au-WS2/Ab/BSA/CEAECL0.001–350 ng·mL−10.3 pg·mL−1This work
Disclaimer/Publisher’s Note: The statements, opinions and data contained in all publications are solely those of the individual author(s) and contributor(s) and not of MDPI and/or the editor(s). MDPI and/or the editor(s) disclaim responsibility for any injury to people or property resulting from any ideas, methods, instructions or products referred to in the content.

