Article

A Selective Fluorescent l-Lactate Biosensor Based on an l-Lactate-Specific Transcription Regulator and Förster Resonance Energy Transfer

1
State Key Laboratory of Microbial Technology, Shandong University, Qingdao 266237, China
2
Institute of Medical Sciences, The Second Hospital, Cheeloo College of Medicine, Shandong University, Jinan 250033, China
3
State Key Laboratory of Microbial Metabolism, School of Life Sciences and Biotechnology, Shanghai Jiao Tong University, Shanghai 200240, China
*
Author to whom correspondence should be addressed.
Biosensors 2022, 12(12), 1111; https://doi.org/10.3390/bios12121111
Submission received: 3 November 2022 / Revised: 21 November 2022 / Accepted: 28 November 2022 / Published: 1 December 2022
(This article belongs to the Special Issue Fluorescent Protein-Based Sensing and Detection)

Abstract

:
Selective detection of l-lactate levels in foods, clinical, and bacterial fermentation samples has drawn intensive attention. Many fluorescent biosensors based on non-stereoselective recognition elements have been developed for lactate detection. Herein, the allosteric transcription factor STLldR from Salmonella enterica serovar Typhimurium LT2 was identified to be stereo-selectively respond to l-lactate. Then, STLldR was combined with Förster resonance energy transfer (FRET) to construct a fluorescent l-lactate biosensor FILLac. FILLac was further optimized by truncating the N- and C-terminal amino acids of STLldR between cyan and yellow fluorescent proteins. The optimized biosensor FILLac10N0C exhibited a maximum emission ratio change (ΔRmax) of 33.47 ± 1.91%, an apparent dissociation constant (Kd) of 6.33 ± 0.79 μM, and a limit of detection of 0.68 μM. FILLac10N0C was applied in 96-well microplates to detect l-lactate in bacterial fermentation samples and commercial foods such as Jiaosu and yogurt. The quantitation results of FILLac10N0C exhibited good agreement with that of a commercial l-lactate biosensor SBA-40D bioanalyzer. Thus, the biosensor FILLac10N0C compatible with high-throughput detection may be a potential choice for quantitation of l-lactate in different biological samples.

1. Introduction

Lactate exists in two stereoisomers: l-lactate and d-lactate [1]. The lactate produced in humans is almost exclusively l-lactate [2]. High l-lactate level indicates serious clinical conditions such as sepsis [3], cardiac arrest [4], and liver failure [5]. l-Lactate level is also an important parameter affecting the flavor or quality of many foods such as wine, dairy products, flavored beverages, and yogurt [6,7]. In addition, l-lactate is a useful chemical with diverse applications. Optically pure l-lactate has been widely used in the synthesis of degradable bioplastic polylactic acid (PLA) [8,9].
Traditionally, the quantification of l-lactate is based on colorimetry [10,11], spectrophotometry [12], fluorescence [13,14], high-performance liquid chromatography (HPLC) [15,16], and liquid chromatography-mass spectrometry [17,18]. However, most of these methods are expensive and involve complicated procedures such as sample pre-treatment and reagent preparation [19]. Biosensors are promising analytical tools which combine a high selective signal recognition element with a signal transducer element. The main advantages of biosensors are their selectivity for a specific analyte and simplicity without tedious sample pre-treatment. Nowadays, many electrochemical biosensors with immobilized enzyme electrodes have been developed for quantification of l-lactate [20,21,22].
Besides electrochemical-based transduction, luminescence-based transduction is also widely applied in biosensors construction [20,21,22,23,24,25]. Laconic, an intracellular biosensor based on the regulator of lactate utilization operon from Escherichia coli (EcLldR) and Förster resonance energy transfer (FRET), was first constructed by San Martín et al. to measure the lactate concentration in mammalian cells [26]. Then, many other fluorescent biosensors including GEM-IL [27], Green Lindoblum [28], eLACCO1.1 [29], LARS [30], and LiLac [31], have been developed for quantitative detection of lactate. These biosensors use bacterial allosteric transcription factors (aTFs) [26,27,28], periplasmic binding proteins [29], G-protein-coupled receptors [30], or chemotaxis proteins [31] as recognition elements to detect lactate. However, the recognition elements of the reported fluorescent lactate biosensors are not stereoselective and thus these reported fluorescent biosensors detect both d-lactate and l-lactate. A fluorescent l-lactate biosensor with high stereoselectivity is still urgently needed for quantitative detection of l-lactate.
In this study, the regulator of lactate utilization operon in Salmonella enterica serovar Typhimurium LT2 (STLldR) was identified to specifically sense l-lactate. Then, a fluorescent l-lactate biosensor based on this specific aTF and FRET was constructed like Laconic and systematically optimized. The optimal sensor FILLac10N0C was used in specific detection of l-lactate in microbial fermentation samples and commercial foods such as Jiaosu and yogurt.

2. Materials and Methods

2.1. Materials

d-Lactate, l-lactate, pyruvate, oxaloacetate, citrate, isocitrate, glyoxylate, d-malate, l-malate, succinate, cis-aconitate, l-glutamate, 2-ketoglutarate, l-2-hydroxyglutarate, d-2-hydroxyglutarate, and SYPRO orange dye were purchased from Sigma-Aldrich (St. Louis, MI, USA). Fumarate, Tris and MRS broth were purchased from Beijing Solarbio Biotech Co. Ltd. (Beijing, China). All other chemicals were of analytical grade.

2.2. Bacterial Strains and Culture Conditions

Bacterial strains used in this study are listed in Table S1 (Supplementary Material). E. coli and its derivative strains were cultured in Luria-Bertani (LB) medium (10 g/L tryptone, 10 g/L NaCl, and 5 g/L yeast extract) at 37 °C with shaking at 180 rpm. Lactobacillus casei ATCC 334, L. plantarum ATCC 14917, and L. bulgaricus ATCC 11842 were grown in MRS medium at 37 °C without agitation. Antibiotics were used at the following concentrations: ampicillin at 100 μg/mL, and kanamycin at 50 μg/mL.

2.3. Expression, Purification, and Characterization of Lactate Utilization Operon Regulator LldR

The gene STlldR encoding LldR of S. Typhimurium LT2 (STLldR) was amplified from genome of the strain, and then ligated into the plasmid pET28a to construct pET28a-STlldR. The recombinant plasmid pET28a-STlldR was transformed into E. coli BL21 (DE3) for STLldR expression. The expression strain was cultured in LB medium at 37 °C until an optical density at 600 nm (OD600) of 0.6 and induced with 1 mM isopropyl-β-D-thiogalactoside (IPTG) at 16 °C for 12 h. The cells were harvested and washed twice with buffer A (20 mM sodium phosphate, 500 mM sodium chloride and 20 mM imidazole, pH 7.4), resuspended in buffer A supplemented with 1 mM phenylmethanesulfonyl fluoride (PMSF) and 10% (v/v) glycerol, and then disrupted by sonication. The cell lysate was centrifuged at 13,000 rpm and 4 °C for 40 min. The supernatant was then loaded onto a 5 mL HisTrap HP column (GE Healthcare, Chicago, IL, USA) preequilibrated with buffer A, and the target protein was eluted with buffer B (20 mM sodium phosphate, 500 mM sodium chloride, and 500 mM imidazole, pH 7.4). The purified STLldR was analyzed by 13% sodium dodecyl sulfate-polyacrylamide gel electrophoresis (SDS-PAGE). The protein concentration was determined using a Bradford protein assay kit (Sangon, Shanghai, China), and stored at –80 °C. The expression and purification of LldR in E. coli MG1655 (EcLldR), Pseudomonas aeruginosa PAO1 (PaLldR) [32] and P. fluorescens A506 (PfLldR) were conducted using the same procedure as above.

2.4. Fluorescence-Based Thermal Shift (FTS) Assay

FTS assays were performed using a LightCycler 480 system (Roche, Indianapolis, IN, USA) with the filter set to excitation wavelength 465 nm and emission wavelength 580 nm for SYPRO orange. Each 25 μL reaction mixture contained 10 μM LldR, 5× SYPRO orange, and 1 mM different compounds (l-lactate, d-lactate, pyruvate, oxaloacetate, d-malate, l-malate, citrate, isocitrate, succinate, fumarate, cis-aconitate, acetate, glyoxylate, 2-ketoglutarate, d-2-hydroxyglutarate, l-2-hydroxyglutarate and l-glutamate) in a reaction buffer (20 mM sodium phosphate and 150 mM sodium chloride, pH 7.4). The temperature was increased at a rate of 1.2 °C/s over a temperature range from 25 °C to 95 °C. The melting temperature (Tm) of LldR was calculated from the negative first derivative value of the raw fluorescence data. Thermal shift temperature (ΔTm) was calculated by subtracting the Tm of the control from the Tm of LldR with the addition of different compounds. Compounds with ΔTm > 2 °C may be potential ligands of LldR.

2.5. Construction and Purification of Fluorescent l-Lactate Biosensor FILLac

The FILLac expression vectors were constructed based on the plasmid pETDuet-mTFP-Venus carrying mTFP gene and Venus gene [33]. The original STlldR gene, its truncated variants or variants with artificial linkers were inserted between the mTFP gene and Venus gene by T5 exonuclease DNA assembly method (TEDA) [34] to construct pETDuet-FILLac0N0C and its variants. The l-lactate biosensor FILLac and its variants were expressed and purified using the same procedure of LldR.

2.6. Characterization of FILLac In-Virto

The purified FILLac and different compounds were diluted with 50 mM Tris-HCl buffer (pH 7.4), and then mixed at a volume ratio of 3:1 into a black 96-well microplate for a total detection volume of 100 μL. The final concentration of FILLac in the reaction mixture was 1 μM. The fluorescence intensities of FILLac at 485 nm (mTFP) and 528 nm (Venus) were detected by using an EnSight multifunctional microplate detector (PerkinElmer, USA) with excitation at 430 nm. The dose-response curves of purified FILLac for increasing concentrations of l-lactate (10 nm to 1 mM) were fitted with a [Inhibitor] vs. response-Variable slope (four parameters) models of GraphPad Prism 7.0 as follows:
R = R min + [ L - L a c t a t e ] p   ×   ( R m a x R m i n ) [ L - L a c t a t e ] p + K d p  
where R, Rmin, Rmax refer to the fluorescence emission ratio of Venus to mTFP, the ratio in the absence of l-lactate, and the ratio at saturation concentration of l-lactate, respectively. The [l-Lactate], Kd, and p refer to the l-lactate concentration, apparent dissociation constant, and Hill Slope, respectively. The maximum ratio changes (ΔRmax) were calculated according to the following formula:
Δ R max = R m a x R m i n R m i n .
The linear detection range refers to the l-lactate concentration range corresponding to 10–90% changes in the fluorescence emission ratio (ΔR).
The emission spectra of FILLac were recorded at 430 nm excitation with emission from 445 nm to 600 nm in steps of 2 nm. The excitation spectra of FILLac at 380−535 nm were recorded at 550 nm emission, in steps of 2 nm. Effects of pH on FILLac were determined by analyzing the responses of FILLac to l-lactate (0, 1, 10 and 100 μM) diluted with 50 mM Tris-HCl buffer at different pH (4.0, 5.0, 6.0, 7.0, 8.0, 8.5, 9.0, 10.0). Effects of temperature on FILLac were determined by analyzing the dose-response curves for l-lactate at 25, 28, 31, 34, 37, 40, and 45 °C, respectively.

2.7. Batch Fermentation for Lactate Production

Three lactate producing strains including L. casei ATCC 334, L. plantarum ATCC 14917, and L. bulgaricus ATCC 11842 were cultured in 100 mL shake flasks containing 50 mL of MRS medium with 1% CaCO3 at 37 °C for 24 h, respectively. Then, the fermentation samples were collected and the l-lactate concentrations were determined by HPLC, SBA-40D bioanalyzer, and FILLac, respectively.

2.8. Jiaosu and Yogurt Samples Preparation

Three different commercial yogurts (Yogurt A, Yogurt B, Yogurt C) were purchased from a local supermarket. Three different natural fruit and vegetable fermented beverages (Jiaosu A, Jiaosu B, Jiaosu C) were purchased online. The Jiaosu and yogurt samples were diluted with 50 mM Tris-HCl buffer (pH 7.4), and the l-lactate concentrations were determined by HPLC, SBA-40D bioanalyzer, and FILLac, respectively.

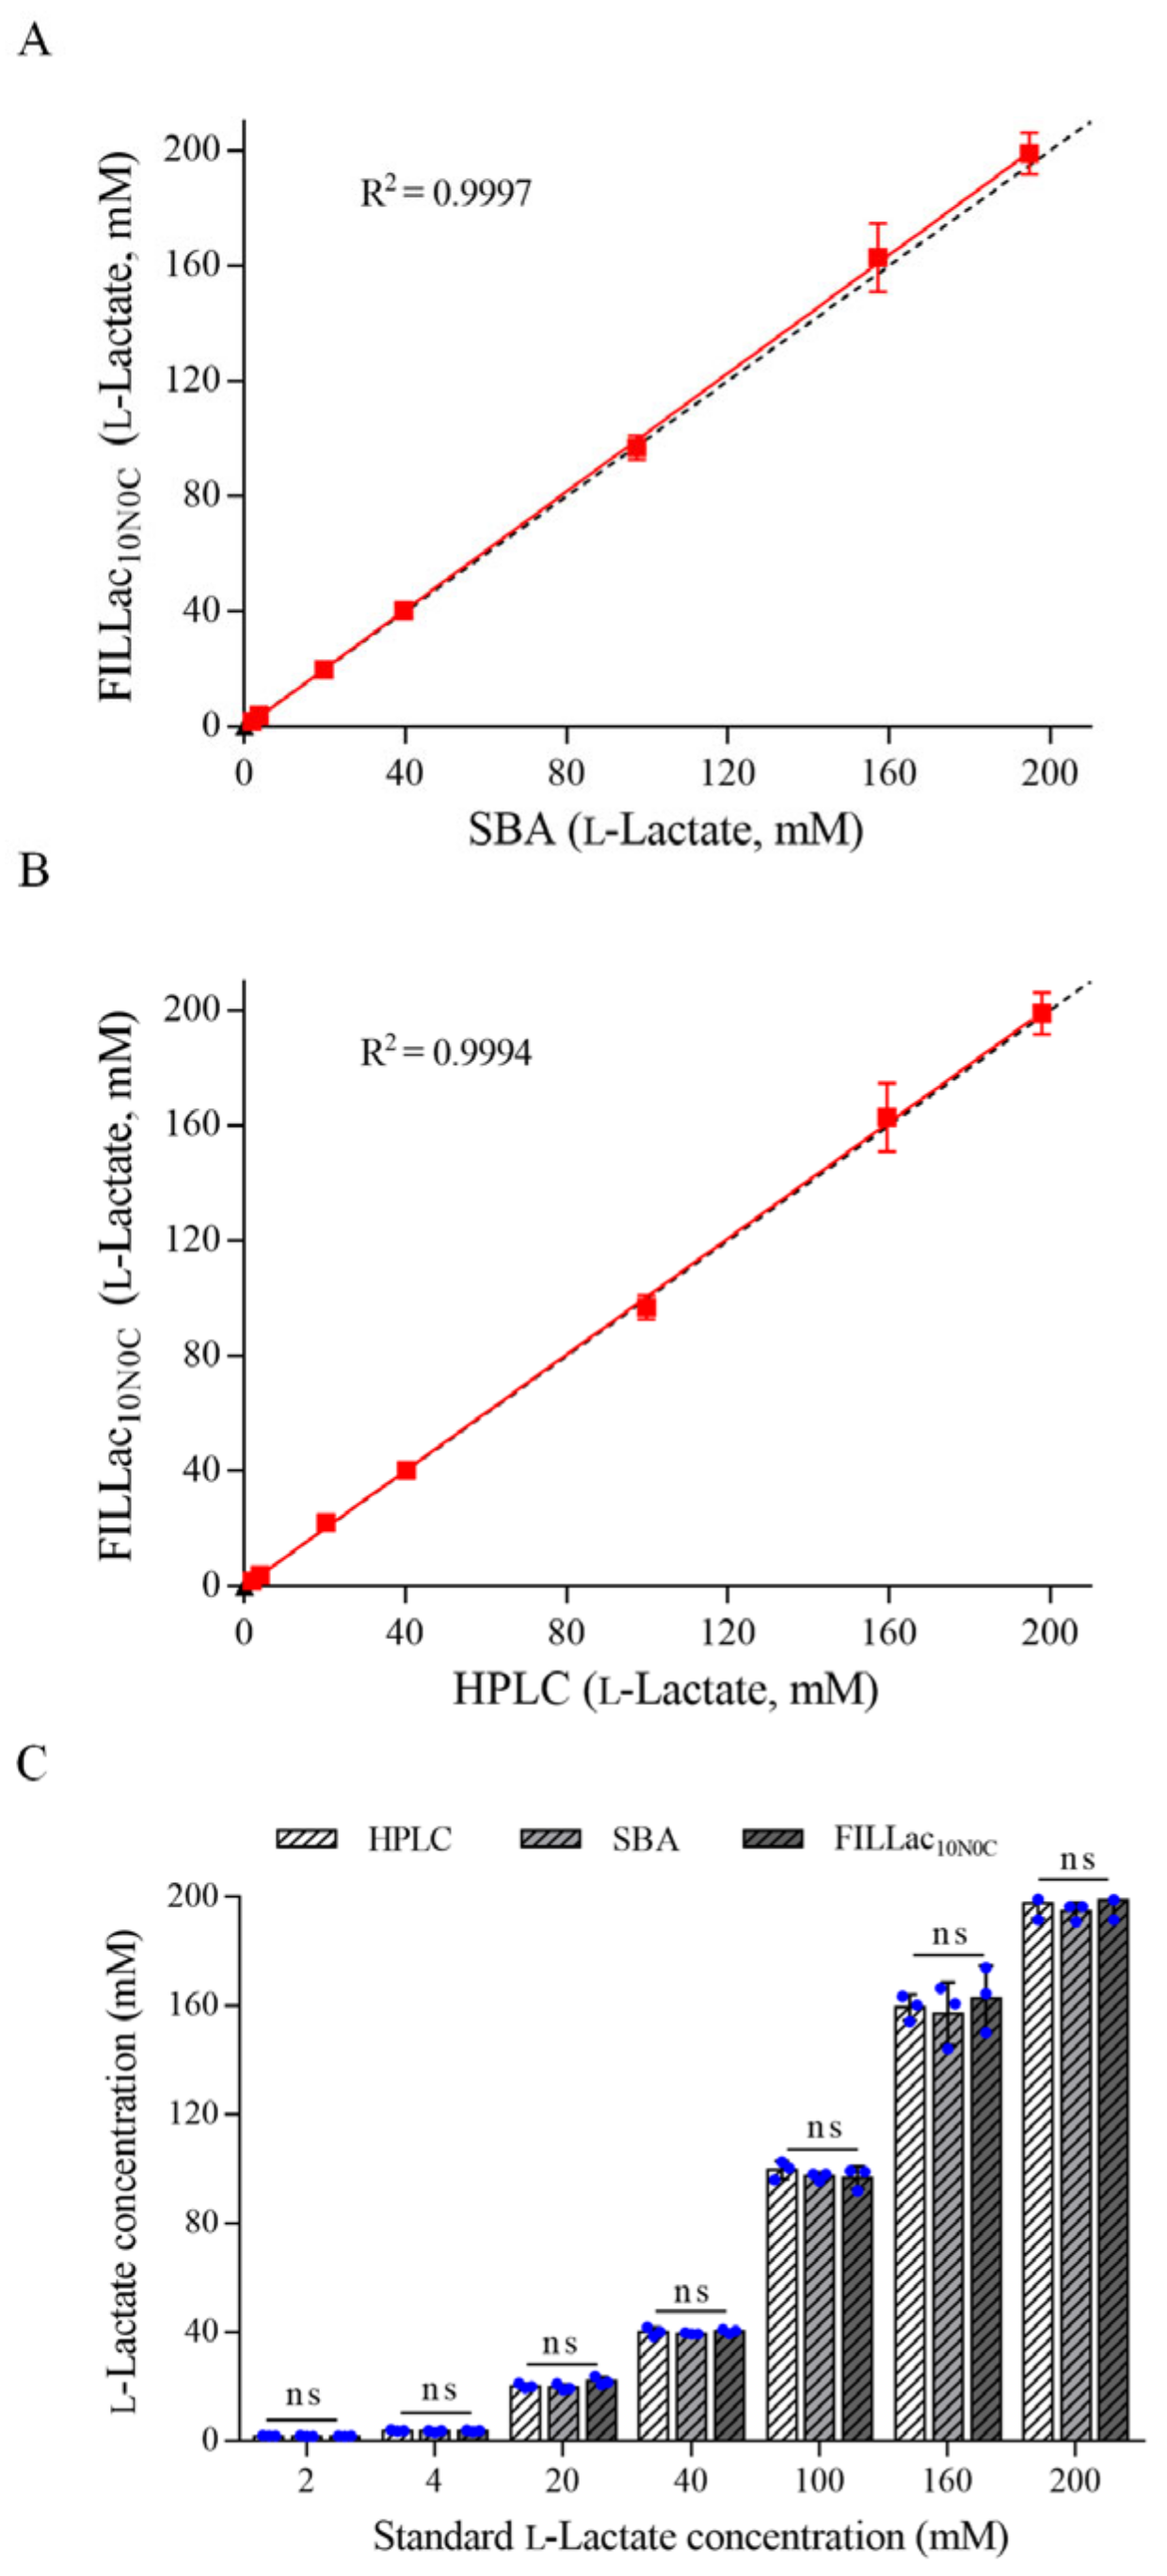
2.9. Quantification of l-Lactate by HPLC, SBA-40D Bioanalyzer and FILLac10N0C

To detect the concentrations of lactate in bacterial fermentation samples, Jiaosu, and yogurt by HPLC, the samples were heated in a metal bath at 105 °C for 15 min, centrifuged at 14,500 rpm for 15 min, then the supernatant was filtered through a 0.22 μm filter. Samples were analyzed using an LC-20AT liquid chromatograph (Shimadzu, Kyoto, Japan) equipped with a RID detector and an Aminex HPX-87H column (300 × 7.8 mm, Bio-Rad, Hercules, CA, USA) at 55 °C. The mobile phase was 10 mM sulfuric acid with a flow rate of 0.4 mL/min. The injection volume was 5 μL, and the total analysis time was 35 min. The stereoisomer composition of lactate in various samples were analyzed using an LC-20AT liquid chromatograph equipped with a UV detector at 254 nm and a chiral column (MCI GEL CRS10W, Tokyo, Japan) at 25 °C. The mobile phase was 2 mM CuSO4 with a flow rate of 0.5 mL/min. The injection volume was 5 μL, and the total analysis time was 30 min.
The SBA-40D bioanalyzer (Shandong Academy of Sciences, Jinan, China) was used to quantify the concentrations of l-lactate in various samples. The samples were centrifuged at 12,000 rpm for 2 min, and then the supernatants were appropriately diluted and analyzed for l-lactate concentrations by SBA-40D bioanalyzer.
To evaluate the applicability of FILLac in quantitative analysis of l-lactate in various samples, standard curves of FILLac for l-lactate detection were first established. Purified FILLac10N0C was diluted by 50 mM Tris-HCl buffer (pH 7.4). Increasing concentrations of l-lactate were added to the fermentation medium for detection of fermentation samples, or added to 50 mM Tris-HCl buffer (pH 7.4) for detection of Jiaosu and yogurt. The purified FILLac10N0C and different concentrations of l-lactate were mixed in a black 96-well microplate at a volume ratio of 3:1. After incubating at room temperature for 20 min, the emission intensities were determined at 430 nm excitation by EnSight multifunctional microplate detector. The formula for the quantitative detection of l-lactate concentrations in fermentation samples by FILLac10N0C is as follows:
[ L - Lactate ]   ( μ M ) = 6 . 813   × 0 . 537 R - 1 . 567 1 0 . 8347 ;
the formula for the quantitative detection of l-lactate concentrations in Jiaosu by FILLac10N0C is as follows:
[ L - Lactate ]   ( μ M ) = 6 . 547   × 0 . 56 R - 1 . 696 1 0 . 9625 ;
the formula for the quantitative detection of l-lactate concentrations in yogurt by FILLac10N0C is as follows:
[ L - Lactate ]   ( μ M ) = 5 . 646   × 0 . 524 R - 1 . 617 1 0 . 8576
where R refers to the fluorescence emission ratio of Venus to mTFP detected by FILLac10N0C. Fermentation samples, Jiaosu, or yogurt were diluted with 50 mM Tris-HCl buffer (pH 7.4), mixed with purified FILLac10N0C and analyzed using the same procedure as mentioned above. The l-lactate concentrations in these samples were determined by substituting the emission ratios into the respective standard curves. Spiking experiments on actual samples were performed by adding 5 mM of l-lactate to three Jiaosu samples, and the concentrations of l-lactate were analyzed using FILLac10N0C.

3. Results and Discussion

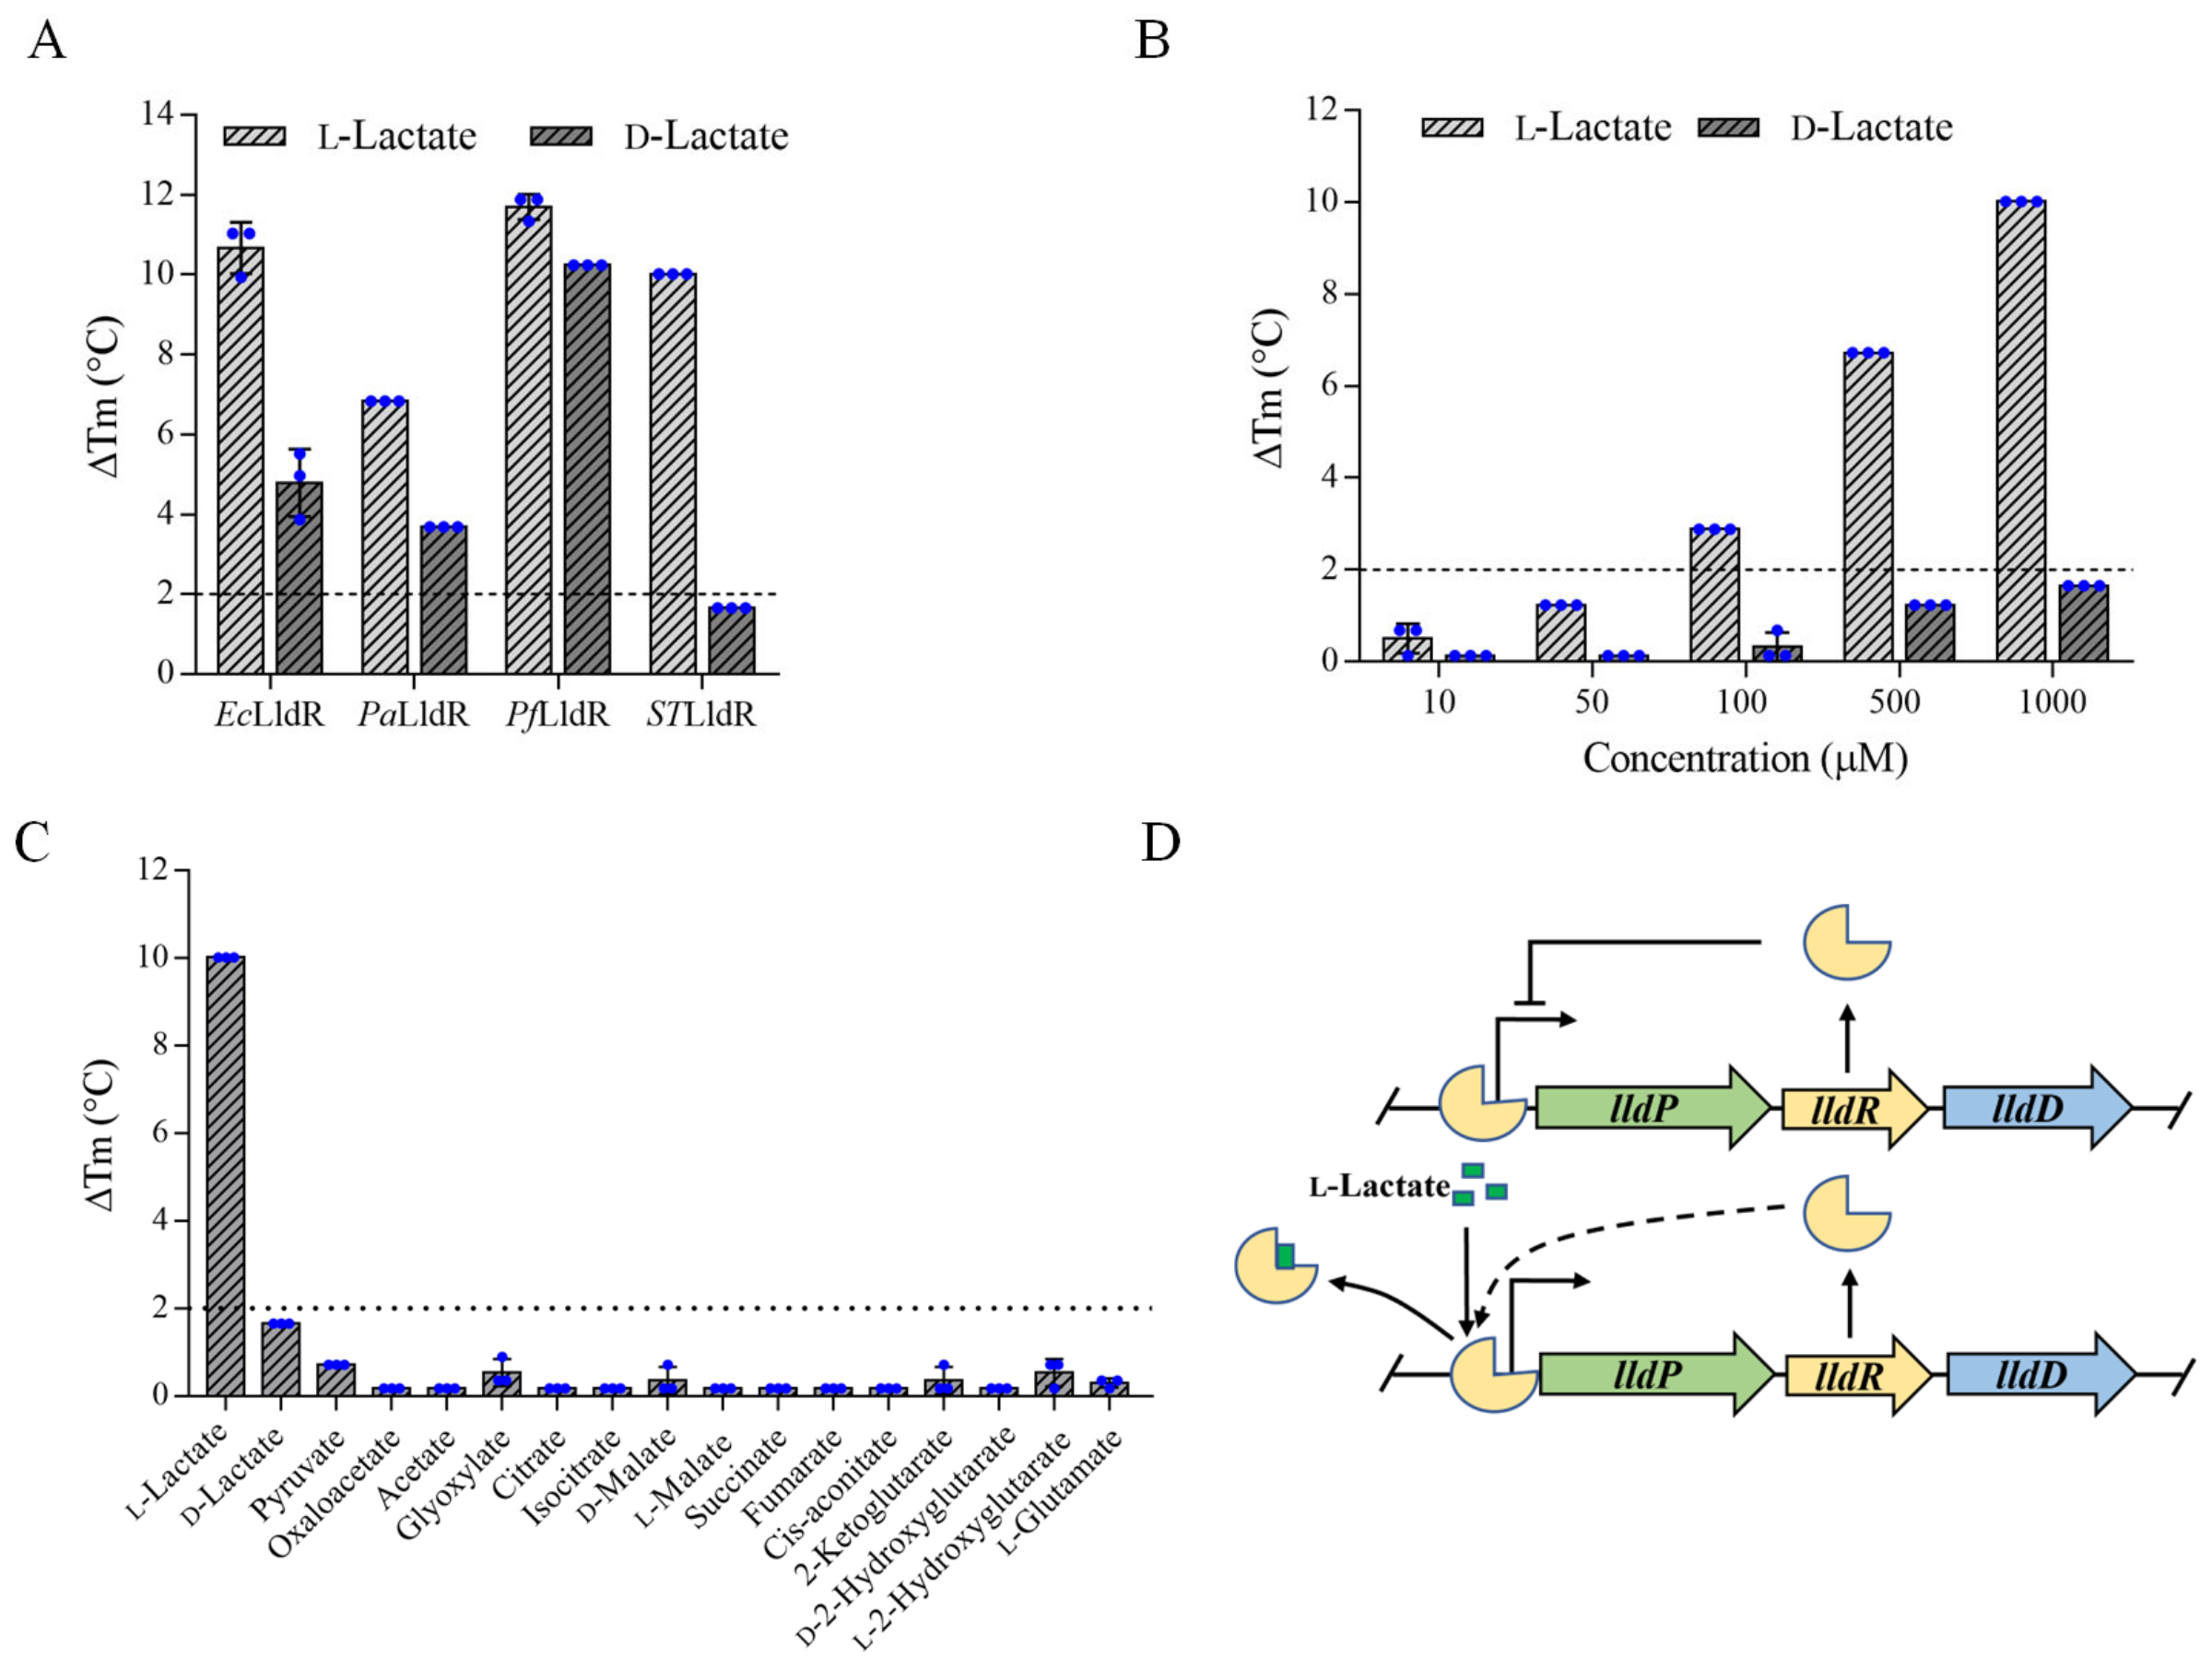
3.1. STLldR as a Specific Recognition Element for l-Lactate

aTF contains a DNA-binding domain that binds to specific DNA operator sequences and a ligand-binding domain that senses ligands [35]. Various aTFs have been used as the recognition elements for the construction of fluorescent biosensors [36]. Importantly, some bacterial aTFs can recognize chiral isomers of various metabolites. For example, the transcriptional regulators LhgR from P. putida W619 and DhdR from Achromobacter denitrificans NBRC 15125 can recognize the l-enantiomer and d-enantiomer of 2-hydroxyglutarate, respectively [33,37]. LhgR and DhdR have been used as the recognition elements to develop fluorescent biosensors for l-2-hydroxyglutarate and d-2-hydroxyglutarate, respectively. Lactate utilization in microorganisms is negatively regulated by transcriptional regulator LldR [38]. To identify the specific transcription regulator for l-lactate, the lactate utilization operon regulator LldRs in E. coli MG1655 (EcLldR), P. aeruginosa PAO1 (PaLldR), P. fluorescens A506 (PfLldR), and S. Typhimurium LT2 (STLldR) were overexpressed and purified, respectively (Figure S1, Supplementary Material). Then, the specificities of these LldRs were analyzed by FTS assays.
As shown in Figure 1A, both d-lactate and l-lactate induced significant changes in Tm of EcLldR, PaLldR, and PfLldR, while l-lactate but not d-lactate caused a significant change in Tm of STLldR. When the concentration of d-lactate was increased to 1 mM, the thermal stability of STLldR was still not significantly changed, while 100 μM l-lactate caused a significant change in thermal stability of STLldR (Figure 1B). In addition, among the seventeen metabolites (1 mM) tested, only l-lactate could lead to a significant change in the thermal stability of STLldR (Figure 1C). The lactate utilization operon of S. Typhimurium LT2 is composed of the lactate permease-encoding gene lldP, the transcriptional regulator LldR-encoding gene lldR, and the l-lactate dehydrogenase-encoding gene lldD [39]. Based on the results of FTS assays, we propose that STLldR negatively regulates the l-lactate catabolism of S. Typhimurium LT2, and l-lactate is its specific effector (Figure 1D).

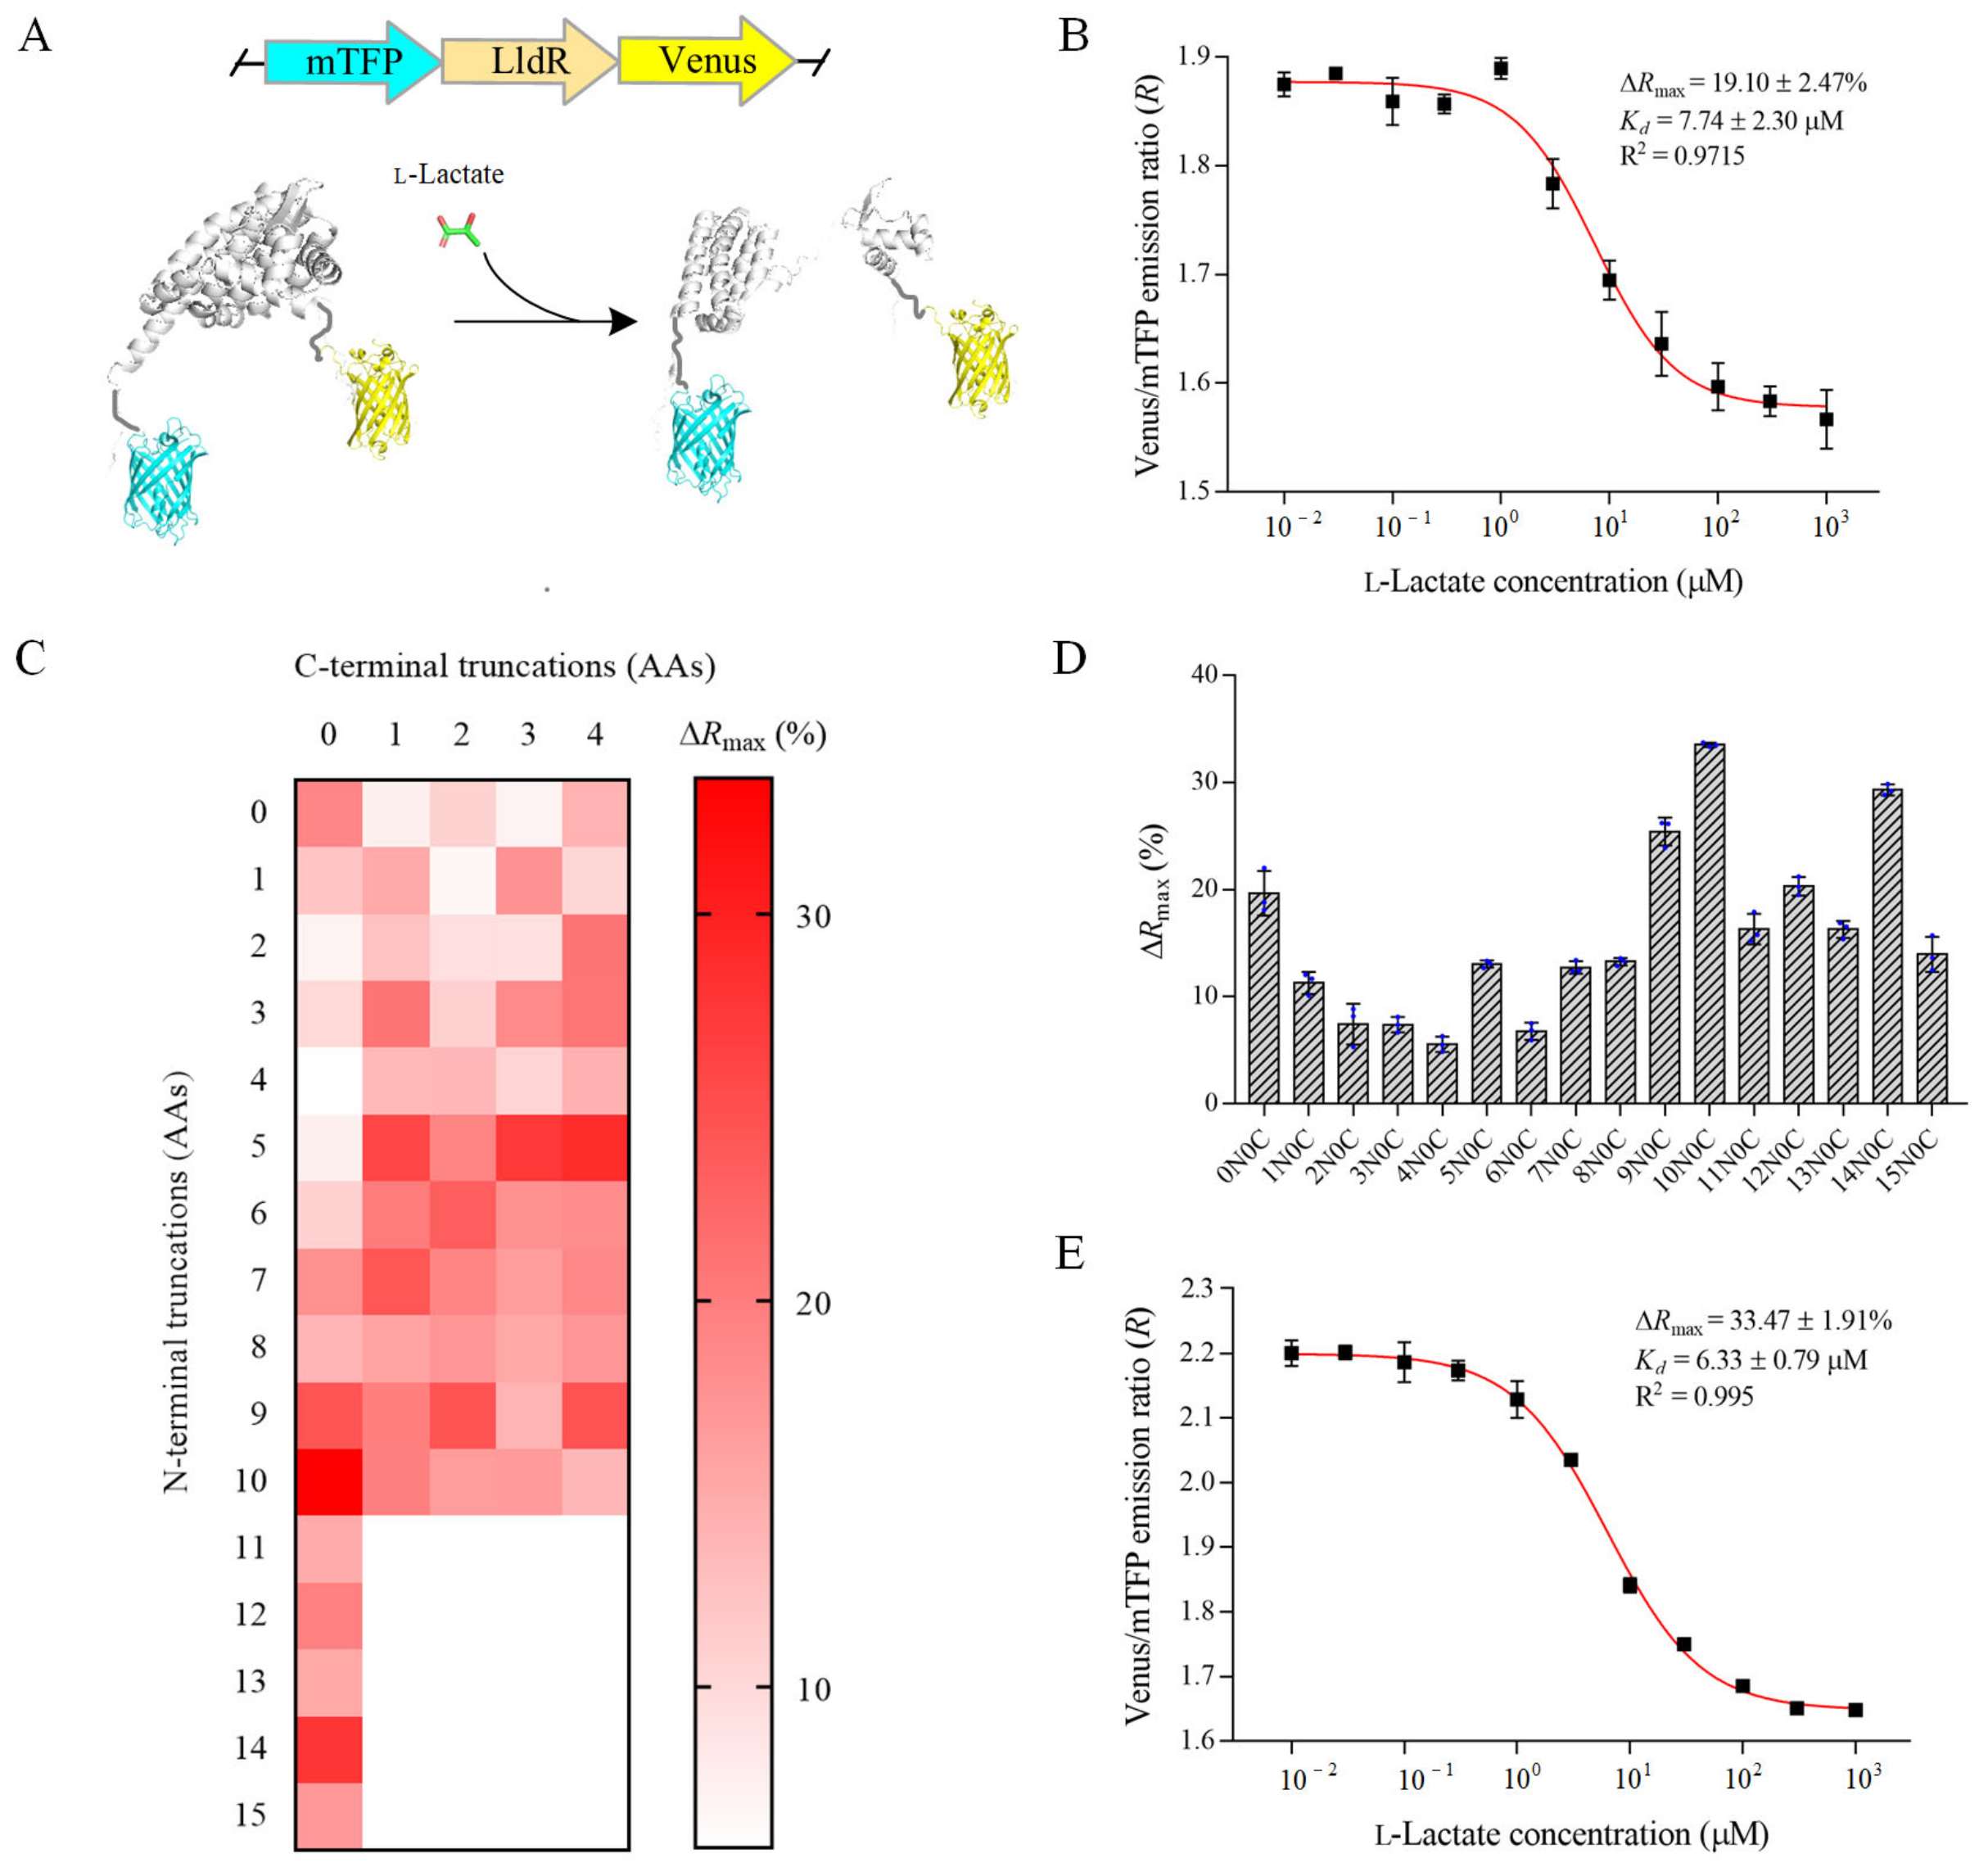
3.2. Design and Optimization of the Fluorescent l-Lactate Biosensor

FRET is an energy transfer process in which the donor fluorophore in the electronic excited state transfers energy to the acceptor fluorophore through resonant coupling [25]. FRET-based biosensors, which are composed of a sensing domain and two fluorophores, allow quantification of metabolites based on the ligand-binding induced changes in distance and/or orientation of two fluorophores and FRET efficiency [25]. In this study, a fluorescent l-lactate biosensor was constructed based on STLldR and FRET (Figure 2A). The optimized cyan and yellow fluorescent proteins, mTFP and Venus, were fused to the N-terminus and C-terminus of STLldR, respectively (Figure S2, Supplementary Material). The constructed fluorescent l-lactate biosensor was named as FILLac0N0C and expressed in E. coli BL21(DE3). FILLac0N0C exhibited l-lactate-dependent increases in the emission peak at 492 nm and decrease in the emission peak at 526 nm with excitation at 430 nm (Figure S3, Supplementary Material). Thus, the structural change of STLldR after l-lactate binding may lead to an unfavorable orientation and/or extended distance of mTFP and Venus, resulting in the decrease in FRET. In addition, l-lactate decreased the fluorescence emission ratio of FILLac0N0C in a dose-dependent manner with a maximum emission ratio change (ΔRmax) of 19.10 ± 2.47% and an apparent dissociation constant (Kd) of 7.74 ± 2.30 μM (Figure 2B).
Then, the biosensor was optimized for its magnitude of response to l-lactate. Sixty truncation variants were constructed by truncating the N- and C-terminal amino acids of STLldR (Figure 2C). As shown in Figure 2D, truncation of N-terminal amino acids of STLldR may significantly increase the ΔRmax of the sensor. The variant with a ten amino acids truncation of N-terminal of STLldR, designated as FILLac10N0C, showed the largest change in fluorescence intensity (ΔRmax = 33.47 ± 1.91%) and a Kd of 6.33 ± 0.79 μM (Figure 2E). The limits of detection (LOD) of FILLac10N0C for l-lactate was 0.68 μM, and the linear detection range was 0.76−51.79 μM. Artificial linkers including flexible linker G4 and rigid linker KL were further added between the truncated STLldR and two fluorescent proteins. However, none of the six constructed variants exhibited a larger ΔRmax than that of FILLac10N0C (Figure S4, Supplementary Material). Therefore, FILLac10N0C was selected as the optimal l-lactate biosensor for intensive study in subsequent experiments.

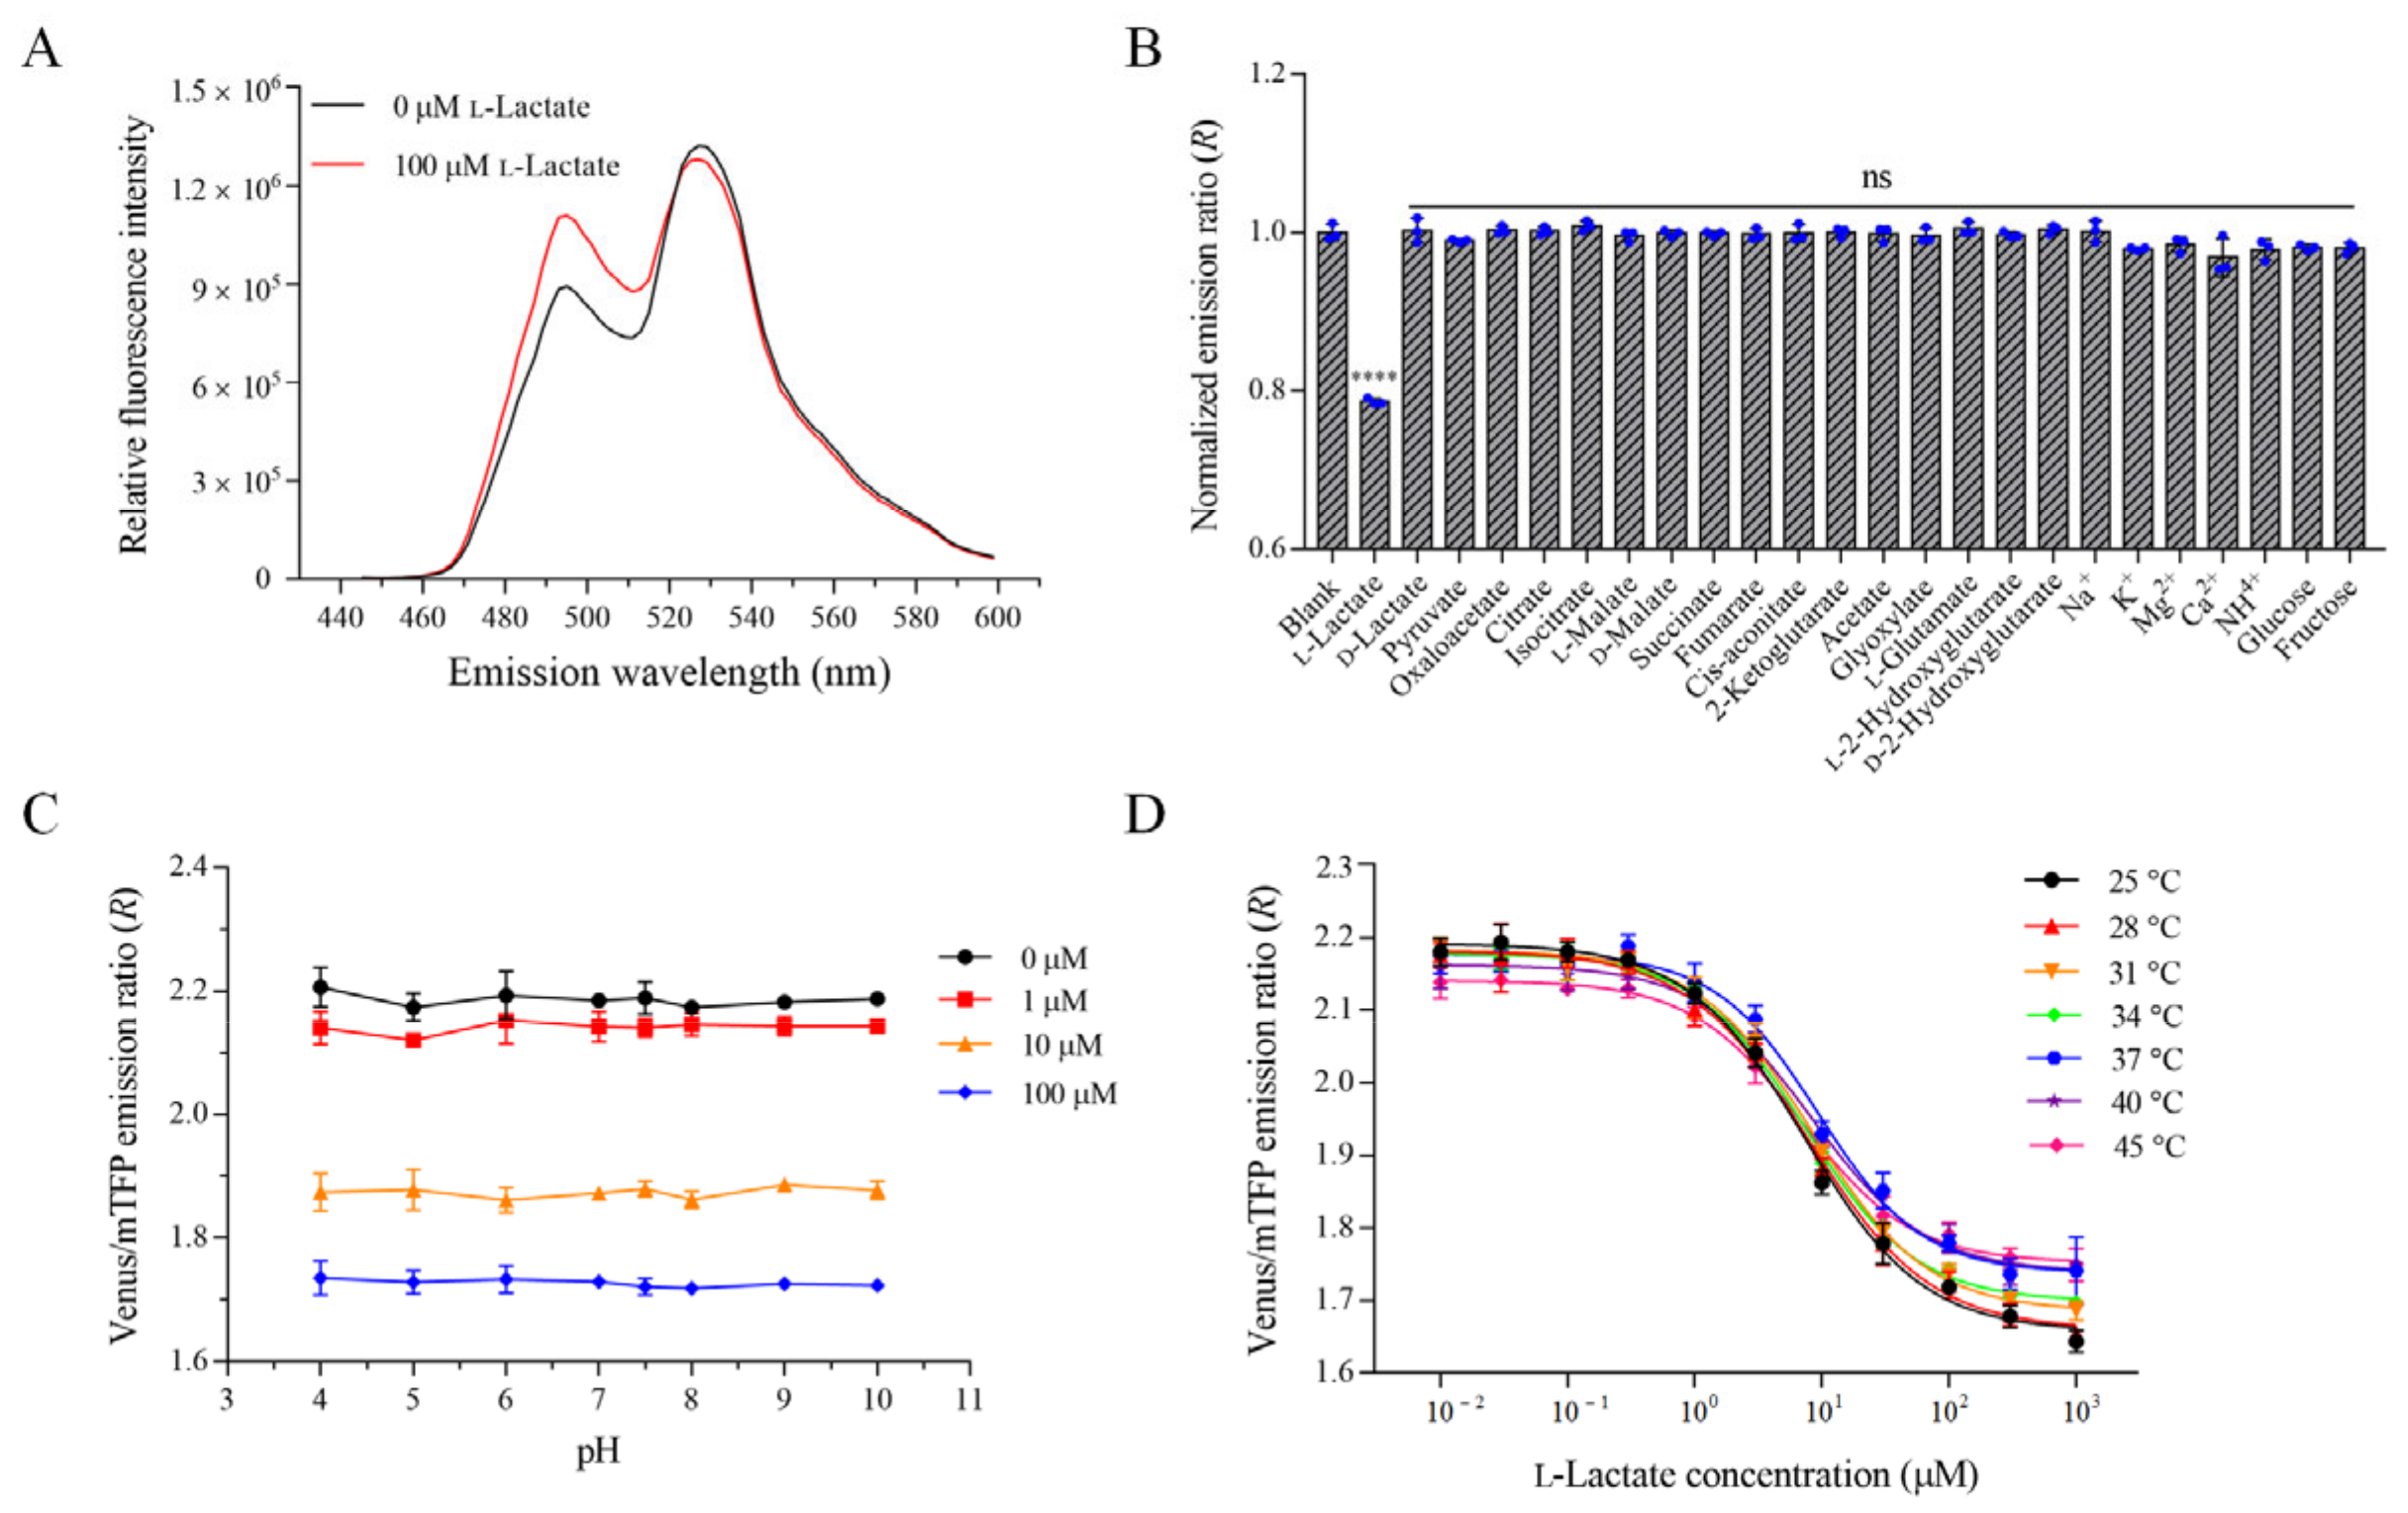
3.3. Characterization of the Optimal l-Lactate Biosensor FILLac10N0C

The properties of the optimal variant FILLac10N0C were further characterized. As shown in Figure 3A, FILLac10N0C also exhibited an l-lactate-dependent increase in the emission peak at 492 nm and a decrease in the emission peak at 526 nm. The increase in the emission peak at 492 nm was more significant than that of FILLac0N0C (Figure 3A and Figure S3A, Supplementary Material). Only l-lactate significantly reduced the fluorescence emission ratio of FILLac10N0C. d-Lactate, pyruvate, oxaloacetate, acetate, glyoxylate, citrate, isocitrate, d-malate, l-malate, succinate, fumarate, cis-aconitate, 2-ketoglutarate, d-2-hydroxyglutarate, l-2-hydroxyglutarate, l-glutamate, Na+, K+, Ca2+, Mg2+, NH4+, glucose and fructose did not change the emission ratio (Figure 3B). Detection of l-lactate by FILLac10N0C was not affected in the presence of 50 μM d-lactate or pyruvate (Figure S5B–E, Supplementary Material). The pH sensitivity of FILLac10N0C was determined. There were no detectable changes in the Venus to mTFP ratio in the pH range from 4.0 to 10.0 (Figure 3C). The dose-response curves of FILLac10N0C for l-lactate were also determined at different temperatures (Figure 3D). The results showed that the affinity of FILLac10N0C to l-lactate was unaffected under the test temperatures (Figure S5F, Supplementary Material).

3.4. Performance of FILLac10N0C in l-Lactate Quantitation

Different concentrations of l-lactate were added to the fermentation medium to simulate the samples for l-lactate detection. l-Lactate concentrations in these samples were detected by FILLac10N0C, SBA-40D bioanalyzer, and HPLC, respectively. As shown in Figure 4A,B, the results of l-lactate detection by FILLac10N0C showed high agreement (R2 > 0.999) with those of HPLC and SBA-40D bioanalyzer. There was no significant difference in the detection results of the three methods (Figure 4C). The accuracy and precision of FILLac10N0C, SBA-40D bioanalyzer, and HPLC for quantitative detection of l-lactate were also analyzed. The results showed that the developed biosensor FILLac10N0C has high accuracy and precision for the quantitative detection of l-lactate (Table S2, Supplementary Material).

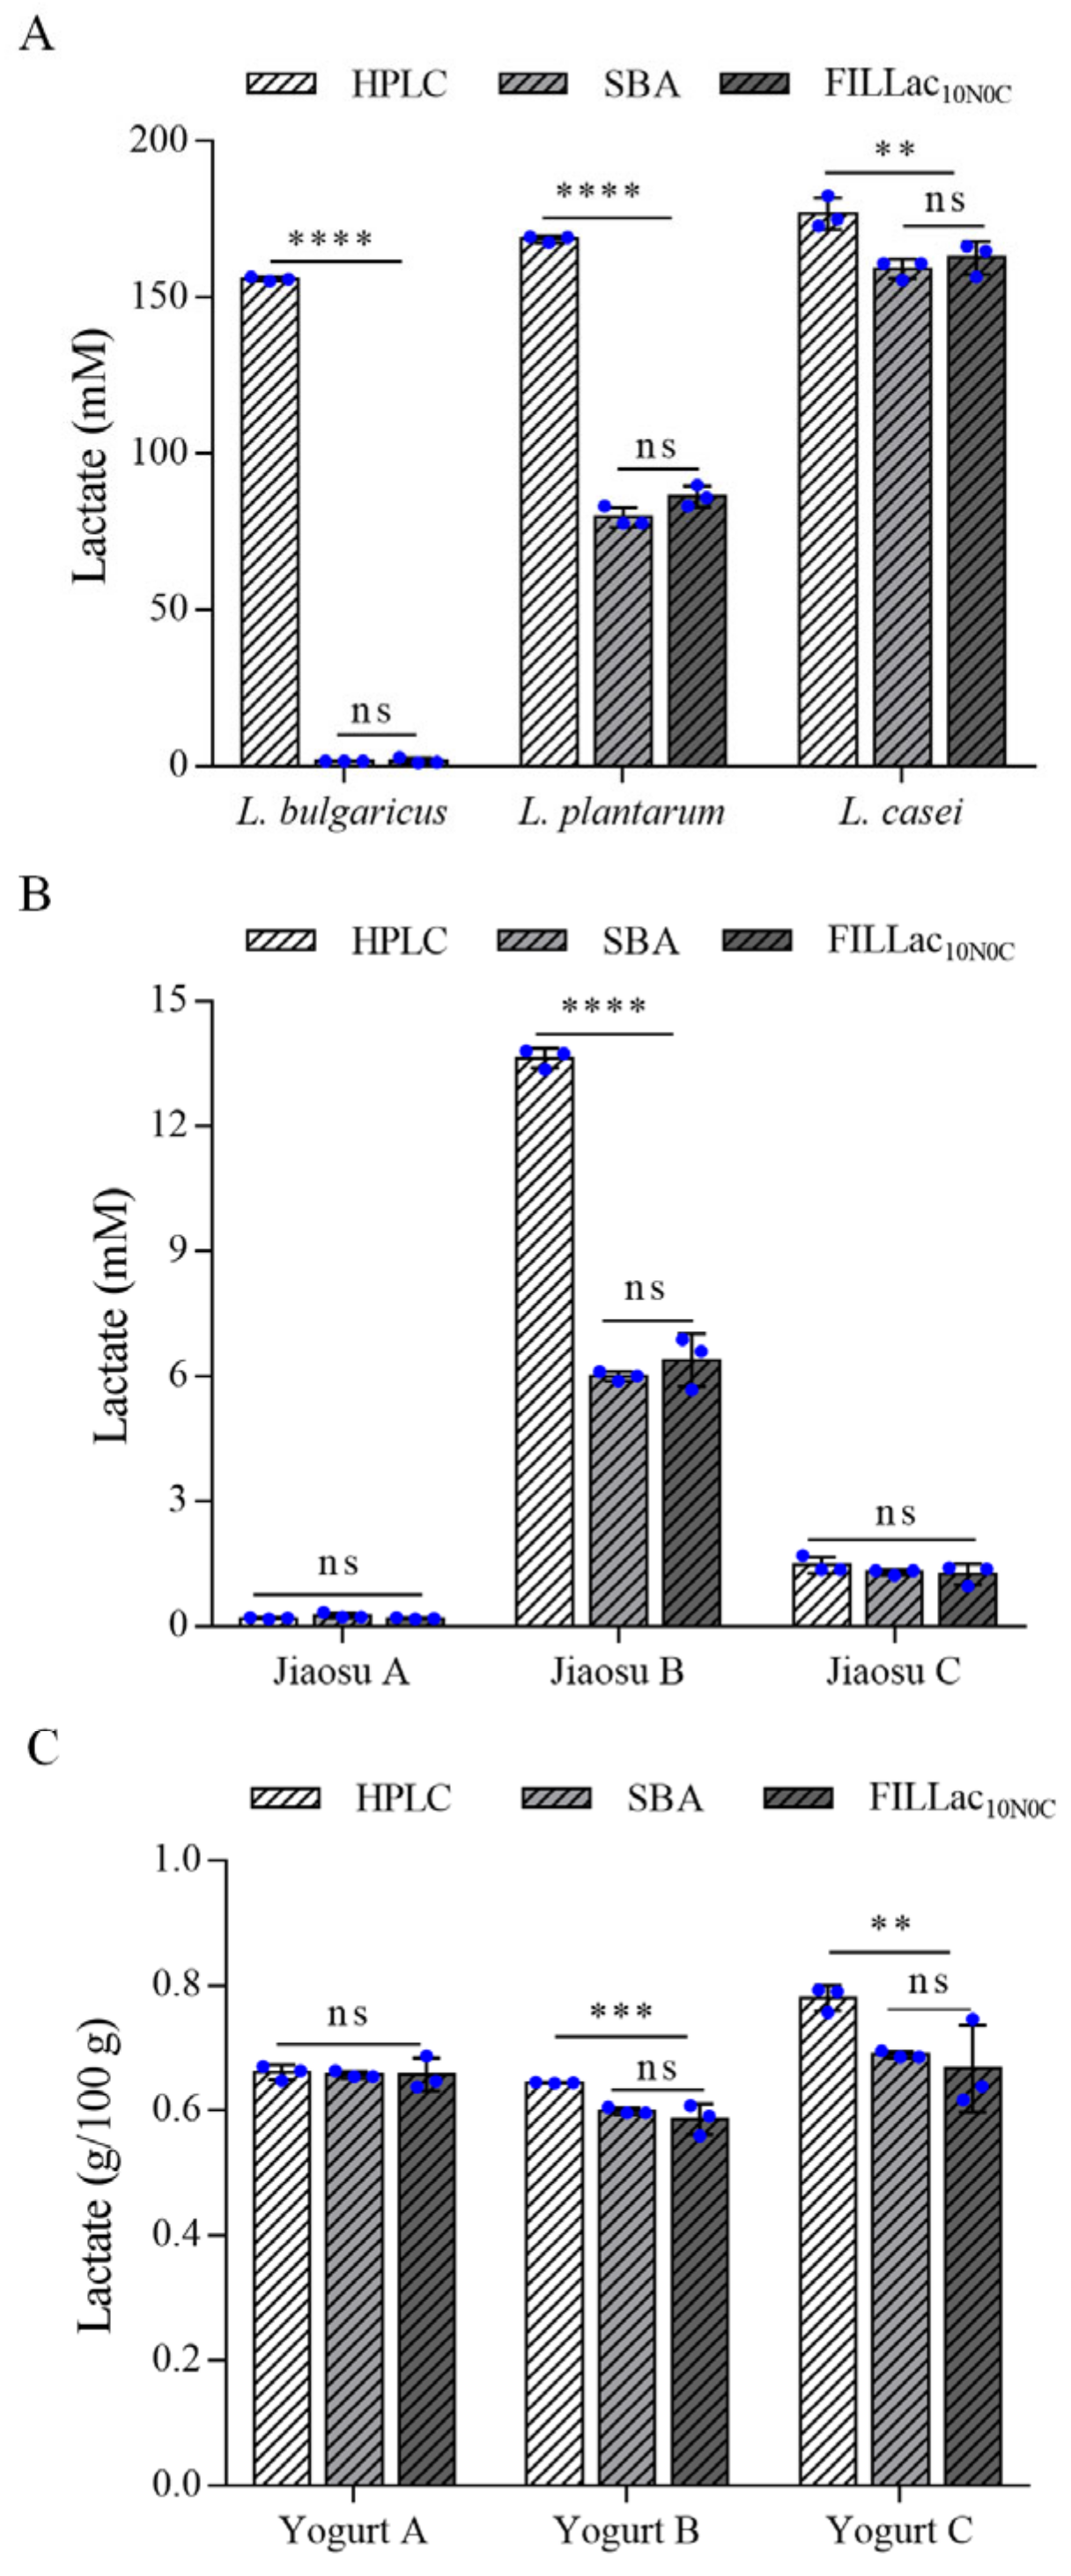
3.5. Quantitation of l-Lactate in Different Fermentation Samples by FILLac10N0C

Nowadays, lactate is mainly produced by microbial fermentation [40,41] and Lactobacillus is a common genus for lactate production [42]. Three Lactobacillus strains, L. casei ATCC 334, L. plantarum ATCC 14917 and L. bulgaricus ATCC 11842 were reported to mainly produce l-lactate [43], d,l-lactate [44], and d-lactate [41], respectively. To identify the feasibility of the sensor FILLac10N0C in quantification of l-lactate in bacterial fermentation samples, these three Lactobacillus strains were used for fermentative production of lactate. Then, the concentrations of lactate in the fermentation samples were detected by FILLac10N0C, SBA-40D bioanalyzer, and HPLC, respectively. Chiral chromatographic analysis revealed the presence of two chiral isomers of lactate in all three fermentation samples (Figure S6, Supplementary Material). SBA-40D bioanalyzer is a commercialized electrochemical biosensor for l-lactate detection. It uses immobilized l-lactate oxidase (l-LOx) as its biological recognition element for selective detection of l-lactate [32]. Generally consistent with expectations, SBA-40D bioanalyzer could not detect d-lactate in the three samples and the results of SBA-40D bioanalyzer were lower than those of HPLC (Figure 5A). Importantly, the results of FILLac10N0C and SBA-40D bioanalyzer were consistent with no significant difference (Figure 5A). Thus, FILLac10N0C, like the commercial SBA-40D bioanalyzer, can be used for the selective detection of l-lactate in fermentation samples.

3.6. Determination of l-Lactate in Food Samples by FILLac10N0C

l-Lactate is present in various fermented foods and can be used as an indicator for food flavor and quality [45,46]. The application of FILLac10N0C in detection of l-lactate in fermented foods such as yogurt and Jiaosu was also analyzed. As shown in Figure 5B,C, the results of FILLac10N0C and SBA-40D bioanalyzer with all of the three commercial yogurt and Jiaosu were identical to each other. Due to the presence of d-lactate in Jiaosu B, Yogurt B, and Yogurt C (Figure S7, Supplementary Material), the results of HPLC with these samples were higher than those of FILLac10N0C and SBA-40D bioanalyzer. Preliminary spiking experiments on three actual Jiaosu samples using FILLac10N0C were also performed and satisfactory recoveries of 93.15–97.47% were obtained (Table S3, Supplementary Material).
Selective l-lactate detection is ultimately important for food, clinical, and fermentation applications [19,45,46]. In this study, a selective fluorescent biosensor, FILLac10N0C, was constructed for l-lactate detection. Compared with other reported fluorescent lactate biosensors, a unique feature of FILLac10N0C is that it uses STLldR, an l-lactate selective aTF, as its recognition element. Exposure of FILLac10N0C to d-lactate did not change fluorescence emission ratio significantly, with a high Kd of 287.6 ± 66.5 μM (Figure S8, Supplementary Material). The commercial d-lactate we used is 98% enantiopure. The observed response of FILLac10N0C to d-lactate at high concentrations was likely a reflection of this impurity. The results of FILLac10N0C with bacterial fermentation and food samples showed high agreement (R2 > 0.999) with that of SBA-40D bioanalyzer, a commercial biosensor for l-lactate detection. Compared with the SBA-40D bioanalyzer, FILLac10N0C possesses a distinctive advantage of compatible with 96- or 384-well plates for high-throughput l-lactate detection. After stored at –80 ℃ for six months, FILLac10N0C exhibited a ΔRmax of 32.86 ± 2.33% and a Kd of 5.85 ± 0.92 μM (Figure S9, Supplementary Material), which were in good agreement with those of the freshly prepared biosensor (ΔRmax of 33.47 ± 1.91% and Kd of 6.33 ± 0.79 μM). Due to the good performance of FILLac10N0C in l-lactate detection, it may be a promising choice for the selective monitoring of extracellular l-lactate concentration in various biological samples (Figure 6).
l-Lactate is a crucial metabolite with diverse metabolic and signaling roles [47]. Some fluorescent sensors such as Laconic, eLACCO1.1, LiLac, etc., have been established for monitoring intracellular lactate metabolism [26,29,31]. The lactate produced in human is mainly l-isomer and thus the stereoselectivity of these sensors received insufficient attention. However, human can acquire exogenously d-lactate in foods, catabolize chemicals such as propylene glycol into d-lactate, and uptake d-lactate produced by intestinal bacteria [48]. For example, patients with short bowel syndrome may suffer from a complication called d-lactic acidosis, and d-lactate levels in plasma may be higher than 3 mM [49]. d-Lactate can also be endogenously generated in various types of cancer by methylglyoxal metabolism [48,50]. In addition, d-lactate exists in various model species such as Arabidopsis thaliana [51] and Saccharomyces cerevisiae [52]. The presence of d-lactate under these cases may interfere with the detection of l-lactate by unselective biosensors. Considering the recognitional capacity of STLldR toward l-lactate, STLldR is an ideal recognition element for construction of intracellular l-lactate biosensors with stereoselectivity. FILLac10N0C now exhibited good performance in monitoring extracellular l-lactate concentration. However, it has a rather small dynamic range and an inappropriate high affinity to l-lactate, which limit its application in detecting lactate fluctuations in-vivo. A more responsive derivative of FILLac10N0C with much higher magnitude of response and an appropriate affinity is need for monitoring l-lactate concentrations in living cells.

4. Conclusions

In this study, STLldR, the regulator of lactate utilization operon in S. Typhimurium LT2, was identified to specifically sense l-lactate. A stereoselective l-lactate biosensor was then constructed and systematically optimized. The quantitation results of l-lactate in bacterial fermentation samples, Jiaosu and yogurt using the optimal biosensor FILLac10N0C showed high agreement with that of the commercial SBA-40D bioanalyzer. With its desirable properties such as high sensitivity, specificity, and compatibility with high-throughput detection, l-lactate biosensor FILLac10N0C may be a promising tool in quantitation of l-lactate in various biological samples.

Supplementary Materials

The following supporting information can be downloaded at: https://www.mdpi.com/article/10.3390/bios12121111/s1. Figure S1: SDS-PAGE analysis of purified EcLldR (A), PaLldR (B), PfLldR (C), and STLldR (D). Figure S2: Amino acid sequences of FILLac0N0C. Figure S3: Spectral properties of FILLac0N0C. Figure S4: Heat map of FILLac10N0C variants with different artificial linkers added between STLldR and fluorescent proteins to ΔRmax. Figure S5: In vitro characterization of FILLac10N0C. Figure S6: HPLC analysis of the chirality of lactate in different fermentation samples. Figure S7: HPLC analysis of the chirality of lactate in Jiaosu and yogurt samples. Figure S8: Dose-response curve of FILLac10N0C for increasing concentrations (100 nM to 10 mM) of d-lactate. Figure S9: Dose-response curve of FILLac10N0C for increasing concentrations (100 nM to 10 mM) of l-lactate after stored at –80 ℃ for six months. Table S1: Strains and plasmids used in this study. Table S2: Evaluation of the performance of FILLac10N0C for quantification of l-lactate in various biological samples. Table S3: Evaluation of the accuracy of FILLac10N0C for quantification of l-lactate in biological samples.

Author Contributions

Methodology, X.X. and Z.K.; investigation, X.X., R.X., S.H., and Z.K.; validation, X.X., R.X. and S.H.; formal analysis, X.X. and R.X.; data curation, X.X., R.X., Z.K., and W.Z.; writing—original draft preparation, X.X.; software, S.H. and Q.W.; writing—review and editing, X.X., C.L., X.W., P.X., C.M. and C.G., C.L.: supervision, C.L., C.M. and C.G.; resources, C.L., Q.W., C.M. and C.G.; funding acquisition, W.Z., C.M. and C.G.; conceptualization, C.G.; project administration, C.M. All authors have read and agreed to the published version of the manuscript.

Funding

This work was supported by the grants of National Key R&D Program of China (2019YFA0904800), the National Natural Science Foundation of China (31970056), the Natural Science Foundation of Shandong Provincial (ZR2020MC005), and State Key Laboratory of Microbial Technology Open Projects Fund (M2021-12).

Institutional Review Board Statement

Not applicable.

Informed Consent Statement

Not applicable.

Data Availability Statement

Not applicable.

Acknowledgments

We thank Nannan Dong and Chengjia Zhang from Core Facilities for Life and Environmental Sciences (State Key Laboratory of Microbial Technology, Shandong University) for assistance in microbial fermentation.

Conflicts of Interest

The authors declare no conflict of interest.

References

  1. Hofvendahl, K.; Hahn-Hagerdal, B. Factors affecting the fermentative lactic acid production from renewable resources. Enzyme Microb. Technol. 2000, 26, 87–107. [Google Scholar] [CrossRef] [PubMed]
  2. Faubert, B.; Li, K.Y.; Cai, L.; Hensley, C.T.; Kim, J.; Zacharias, L.G.; Yang, C.D.; Do, Q.N.; Doucette, S.; Burguete, D.; et al. Lactate metabolism in human lung tumors. Cell 2017, 171, 358. [Google Scholar] [CrossRef] [PubMed] [Green Version]
  3. Chrusch, C.; Bands, C.; Bose, D.; Li, X.; Jacobs, H.; Duke, K.; Bautista, E.; Eschun, G.; Light, R.B.; Mink, S.N. Impaired hepatic extraction and increased splanchnic production contribute to lactic acidosis in canine sepsis. Am. J. Respir. Crit. Care Med. 2000, 161, 517–526. [Google Scholar] [CrossRef] [PubMed]
  4. Kliegel, A.; Losert, H.; Sterz, F.; Holzer, M.; Zeiner, A.; Havel, C.; Laggner, A.N. Serial lactate determinations for prediction of outcome after cardiac arrest. Medicine 2004, 83, 274–279. [Google Scholar] [CrossRef]
  5. Murphy, N.D.; Kodakat, S.K.; Wendon, J.A.; Jooste, C.A.; Muiesan, P.; Rela, M.; Heaton, N.D. Liver and intestinal lactate metabolism in patients with acute hepatic failure undergoing liver transplantation. Crit. Care Med. 2001, 29, 2111–2118. [Google Scholar] [CrossRef]
  6. Gamella, M.; Campuzano, S.; Conzuelo, F.; Curiel, J.A.; Munoz, R.; Reviejo, A.J.; Pingarron, J.M. Integrated multienzyme electrochemical biosensors for monitoring malolactic fermentation in wines. Talanta 2010, 81, 925–933. [Google Scholar] [CrossRef] [Green Version]
  7. Pundir, C.S.; Narwal, V.; Batra, B. Determination of lactic acid with special emphasis on biosensing methods: A review. Biosens. Bioelectron. 2016, 86, 777–790. [Google Scholar] [CrossRef]
  8. Castro-Aguirre, E.; Iniguez-Franco, F.; Samsudin, H.; Fang, X.; Auras, R. Poly (lactic acid)-Mass production, processing, industrial applications, and end of life. Adv. Drug Deliver. Rev. 2016, 107, 333–366. [Google Scholar] [CrossRef] [Green Version]
  9. Rawoof, S.; Kumar, P.S.; Vo, D.; Devaraj, K.; Mani, Y.; Devaraj, T.; Subramanian, S. Production of optically pure lactic acid by microbial fermentation: A review. Environ. Chem. Lett. 2021, 19, 539–556. [Google Scholar] [CrossRef]
  10. Yuzer, E.; Dogan, V.; Kilic, V.; Sen, M. Smartphone embedded deep learning approach for highly accurate and automated colorimetric lactate analysis in sweat. Sensor. Actuat. B-Chem. 2022, 371, 132489. [Google Scholar] [CrossRef]
  11. Promphet, N.; Rattanawaleedirojn, P.; Siralertmukul, K.; Soatthiyanon, N.; Potiyaraj, P.; Thanawattano, C.; Hinestroza, J.P.; Rodthongkum, N. Non-invasive textile based colorimetric sensor for the simultaneous detection of sweat pH and lactate. Talanta 2019, 192, 424–430. [Google Scholar] [CrossRef] [PubMed]
  12. Dias, A.; Silva, R.; Arruda, M. A sequential injection system for indirect spectrophotometric determination of lactic acid in yogurt and fermented mash samples. Microchem. J. 2010, 96, 151–156. [Google Scholar] [CrossRef]
  13. Zhang, X.M.; Ding, S.S.; Cao, S.M.; Zhu, A.W.; Shi, G.Y. Functional surface engineering of quantum dot hydrogels for selective fluorescence imaging of extracellular lactate release. Biosens. Bioelectron. 2016, 80, 315–322. [Google Scholar] [CrossRef]
  14. Matoori, S.; Mooney, D.J. Development of a liposomal near-infrared fluorescence lactate assay for human blood. Biomaterials 2022, 283, 121475. [Google Scholar] [CrossRef] [PubMed]
  15. Milagres, M.P.; Brandao, S.; Magalhaes, M.A.; Minim, V.; Minim, L.A. Development and validation of the high performance liquid chromatography-ion exclusion method for detection of lactic acid in milk. Food Chem. 2012, 135, 1078–1082. [Google Scholar] [CrossRef] [PubMed] [Green Version]
  16. Hsieh, C.L.; Koga, R.; Furusho, A.; Akita, T.; Mita, M.; Ide, T.; Lee, J.A.; Hamase, K. Enantioselective and simultaneous determination of lactate and 3-hydroxybutyrate in human plasma and urine using a narrow-bore online two-dimensional high-performance liquid chromatography system. J. Sep. Sci. 2018, 41, 1298–1306. [Google Scholar] [CrossRef]
  17. Jackson, T.C.; Zhang, Y.V.; Sime, P.J.; Phipps, R.P.; Kottmann, R.M. Development of an accurate and sensitive method for lactate analysis in exhaled breath condensate by LC MS/MS. J. Chromatogr. B. 2017, 1061, 468–473. [Google Scholar] [CrossRef]
  18. Zhang, W.; Guo, C.; Jiang, K.Z.; Ying, M.F.; Hu, X. Quantification of lactate from various metabolic pathways and quantification issues of lactate isotopologues and isotopmers. Sci. Rep. 2017, 7, 8489. [Google Scholar] [CrossRef] [Green Version]
  19. Rattu, G.; Khansili, N.; Maurya, V.K.; Krishna, P.M. Lactate detection sensors for food, clinical and biological applications: A review. Environ. Chem. Lett. 2021, 19, 1135–1152. [Google Scholar] [CrossRef]
  20. Poletti, F.; Zanfrognini, B.; Favaretto, L.; Quintano, V.; Sun, J.H.; Treossi, E.; Melucci, M.; Palermo, V.; Zanardi, C. Continuous capillary-flow sensing of glucose and lactate in sweat with an electrochemical sensor based on functionalized graphene oxide. Sensor. Actuat. B-Chem. 2021, 344, 130253. [Google Scholar] [CrossRef]
  21. Zhang, Q.W.; Jiang, D.F.; Xu, C.S.; Ge, Y.C.; Liu, X.H.; Wei, Q.Q.; Huang, L.P.; Ren, X.Q.; Wang, C.D.; Wang, Y. Wearable electrochemical biosensor based on molecularly imprinted Ag nanowires for noninvasive monitoring lactate in human sweat. Sensor. Actuat. B-Chem. 2020, 320, 128325. [Google Scholar] [CrossRef]
  22. Bott-Neto, J.L.; Martins, T.S.; Buscaglia, L.A.; Santiago, P.; Fernandez, P.S.; Machado, S.; Oliveira, O.N. A portable system for photoelectrochemical detection of lactate on TiO2 nanoparticles and [Ni(salen)] polymeric film. Sensor. Actuat. B-Chem. 2021, 345, 130390. [Google Scholar] [CrossRef]
  23. Ma, Y.S.; Wang, Y.; Liu, Y.J.; Shi, L.J.; Yang, D.Z. Towards a transdermal membrane biosensor for the detection of lactate in body fluids. Sensor. Actuat. B-Chem. 2020, 308, 127645. [Google Scholar] [CrossRef]
  24. Ma, Y.S.; Wang, Y.; Liu, Y.J.; Shi, L.J.; Yang, D.Z. A cascade-triggered ratiometric fluorescent sensor based on nanocomposite for lactate determination. Sensor. Actuat. B-Chem. 2022, 355, 131295. [Google Scholar] [CrossRef]
  25. Zhang, X.; Hu, Y.; Yang, X.; Tang, Y.; Han, S.; Kang, A.; Deng, H.; Chi, Y.; Zhu, D.; Lu, Y. FÖrster resonance energy transfer (FRET)-based biosensors for biological applications. Biosens. Bioelectron. 2019, 138, 111314. [Google Scholar] [CrossRef]
  26. San Martín, A.; Ceballo, S.; Ruminot, I.; Lerchundi, R.; Frommer, W.B.; Barros, L.F. A genetically encoded FRET lactate sensor and its use to detect the Warburg effect in single cancer cells. PLoS ONE 2013, 8, e57712. [Google Scholar] [CrossRef]
  27. Bekdash, R.; Quejada, J.R.; Ueno, S.; Kawano, F.; Morikawa, K.; Klein, A.D.; Matsumoto, K.; Lee, T.C.; Nakanishi, K.; Chalan, A.; et al. GEM-IL: A highly responsive fluorescent lactate indicator. Cell Rep. Methods 2021, 1, 100092. [Google Scholar] [CrossRef]
  28. Harada, K.; Chihara, T.; Hayasaka, Y.; Mita, M.; Takizawa, M.; Ishida, K.; Arai, M.; Tsuno, S.; Matsumoto, M.; Ishihara, T.; et al. Green fluorescent protein-based lactate and pyruvate indicators suitable for biochemical assays and live cell imaging. Sci. Rep. 2020, 10, 19562. [Google Scholar] [CrossRef]
  29. Nasu, Y.; Murphy-Royal, C.; Wen, Y.R.; Haidey, J.N.; Molina, R.S.; Aggarwal, A.; Zhang, S.C.; Kamijo, Y.; Paquet, M.E.; Podgorski, K.; et al. A genetically encoded fluorescent biosensor for extracellular l-lactate. Nat. Commun. 2021, 12, 7058. [Google Scholar] [CrossRef]
  30. Wellbourne-Wood, J.; Briquet, M.; Alessandri, M.; Binda, F.; Touya, M.; Chatton, J.Y. Evaluation of hydroxycarboxylic acid receptor 1 (HCAR1) as a building block for genetically encoded extracellular lactate biosensors. Biosensors 2022, 12, 143. [Google Scholar] [CrossRef]
  31. Koveal, D.; Rosen, P.C.; Meyer, D.J.; Diaz-Garcia, C.M.; Wang, Y.C.; Cai, L.H.; Chou, P.J.; Weitz, D.A.; Yellen, G. A high-throughput multiparameter screen for accelerated development and optimization of soluble genetically encoded fluorescent biosensors. Nat. Commun. 2022, 13, 2919. [Google Scholar] [CrossRef] [PubMed]
  32. Xiao, D.; Hu, C.; Xu, X.; Lü, C.; Wang, Q.; Zhang, W.; Gao, C.; Xu, P.; Wang, X.; Ma, C. A d,l-lactate biosensor based on allosteric transcription factor LldR and amplified luminescent proximity homogeneous assay. Biosens. Bioelectron. 2022, 211, 114378. [Google Scholar] [CrossRef] [PubMed]
  33. Kang, Z.Q.; Zhang, M.M.; Gao, K.Y.; Zhang, W.; Meng, W.S.; Liu, Y.D.; Xiao, D.; Guo, S.T.; Ma, C.Q.; Gao, C.; et al. An l-2-hydroxyglutarate biosensor based on specific transcriptional regulator LhgR. Nat. Commun. 2021, 12, 3619. [Google Scholar] [CrossRef]
  34. Xia, Y.Z.; Li, K.; Li, J.J.; Wang, T.Q.; Gu, L.C.; Xun, L.Y. T5 exonuclease-dependent assembly offers a low-cost method for efficient cloning and site-directed mutagenesis. Nucleic Acids Res. 2019, 47, e15. [Google Scholar] [CrossRef] [PubMed] [Green Version]
  35. van Hijum, S.A.; Medema, M.H.; Kuipers, O.P. Mechanisms and evolution of control logic in prokaryotic transcriptional regulation. Microbiol. Mol. Biol. Rev. 2009, 73, 481–509. [Google Scholar] [CrossRef] [Green Version]
  36. Fernandez-Lopez, R.; Ruiz, R.; de la Cruz, F.; Moncalian, G. Transcription factor-based biosensors enlightened by the analyte. Front. Microbiol. 2015, 6, 648. [Google Scholar] [CrossRef] [Green Version]
  37. Xiao, D.; Zhang, W.; Guo, X.T.; Liu, Y.D.; Hu, C.X.; Guo, S.T.; Kang, Z.Q.; Xu, X.Z.; Ma, C.Q.; Gao, C.; et al. A d-2-hydroxyglutarate biosensor based on specific transcriptional regulator DhdR. Nat. Commun. 2021, 12, 7108. [Google Scholar] [CrossRef]
  38. Jiang, T.; Gao, C.; Ma, C.; Xu, P. Microbial lactate utilization: Enzymes, pathogenesis, and regulation. Trends Microbiol. 2014, 22, 589–599. [Google Scholar] [CrossRef]
  39. Gillis, C.C.; Winter, M.G.; Chanin, R.B.; Zhu, W.H.; Spiga, L.; Winter, S.E. Host-derived metabolites modulate transcription of Salmonella genes involved in l-lactate utilization during gut colonization. Infect. Immun. 2019, 87, e00773–18. [Google Scholar] [CrossRef] [Green Version]
  40. Augustiniene, E.; Valanciene, E.; Matulis, P.; Syrpas, M.; Jonuskiene, I.; Malys, N. Bioproduction of l- and d-lactic acids: Advances and trends in microbial strain application and engineering. Crit. Rev. Biotechnol. 2022, 42, 342–360. [Google Scholar] [CrossRef]
  41. Plessas, S.; Bosnea, L.; Psarianos, C.; Koutinas, A.A.; Marchant, R.; Banat, I.M. Lactic acid production by mixed cultures of Kluyveromyces marxianus, Lactobacillus delbrueckii ssp. bulgaricus and Lactobacillus helveticus. Bioresour. Technol. 2008, 99, 5951–5955. [Google Scholar] [CrossRef] [PubMed]
  42. Sun, Z.H.; Harris, H.; McCann, A.; Guo, C.Y.; Argimon, S.; Zhang, W.Y.; Yang, X.W.; Jeffery, I.B.; Cooney, J.C.; Kagawa, T.F.; et al. Expanding the biotechnology potential of lactobacilli through comparative genomics of 213 strains and associated genera. Nat. Commun. 2015, 6, 8322. [Google Scholar] [CrossRef] [PubMed] [Green Version]
  43. Dicks, L.; DuPlessis, E.M.; Dellaglio, F.; Lauer, E. Reclassification of Lactobacillus casei subsp. casei ATCC 393 and Lactobacillus rhamnosus ATCC 15820 as Lactobacillus zeae nom. rev., designation of ATCC 334 as the neotype of L. casei subsp. casei, and rejection of the Lactobacillus paracasei. Int. J. Syst. Bacteriol. 1996, 46, 337–340. [Google Scholar] [CrossRef] [PubMed] [Green Version]
  44. Okano, K.; Yoshida, S.; Tanaka, T.; Ogino, C.; Fukuda, H.; Kondo, A. Homo-d-lactic acid fermentation from arabinose by redirection of the phosphoketolase pathway to the pentose phosphate pathway in l-lactate dehydrogenase gene-deficient Lactobacillus plantarum. Appl. Environ. Microbiol. 2009, 75, 5175–5178. [Google Scholar] [CrossRef] [PubMed] [Green Version]
  45. Hosnedlova, B.; Sochor, J.; Baron, M.; Bjorklund, G.; Kizek, R. Application of nanotechnology based-biosensors in analysis of wine compounds and control of wine quality and safety: A critical review. Crit. Rev. Food Sci. 2020, 60, 3271–3289. [Google Scholar] [CrossRef] [PubMed]
  46. Manoj, D.; Shanmugasundaram, S.; Anandharamakrishnan, C. Nanosensing and nanobiosensing: Concepts, methods, and applications for quality evaluation of liquid foods. Food Control 2021, 126, 108017. [Google Scholar] [CrossRef]
  47. Hui, S.; Ghergurovich, J.M.; Morscher, R.J.; Jang, C.; Teng, X.; Lu, W.Y.; Esparza, L.A.; Reya, T.; Zhan, L.; Guo, J.; et al. Glucose feeds the TCA cycle via circulating lactate. Nature 2017, 551, 115. [Google Scholar] [CrossRef] [Green Version]
  48. Monroe, G.R.; van Eerde, A.M.; Tessadori, F.; Duran, K.J.; Savelberg, S.; van Alfen, J.C.; Terhal, P.A.; van der Crabben, S.N.; Lichtenbelt, K.D.; Fuchs, S.A.; et al. Identification of human d-lactate dehydrogenase deficiency. Nat. Commun. 2019, 10, 1477. [Google Scholar] [CrossRef] [Green Version]
  49. McHale, C.; Keating, E.; O'Donovan, H.; Slattery, E. d-lactic acidosis secondary to short bowel syndrome. Postgrad. Med. J. 2003, 79, 110–112. [Google Scholar] [CrossRef] [Green Version]
  50. Adeva-Andany, M.; Lopez-Ojen, M.; Funcasta-Calderon, R.; Ameneiros-Rodriguez, E.; Donapetry-Garcia, C.; Vila-Altesor, M.; Rodriguez-Seijas, J. Comprehensive review on lactate metabolism in human health. Mitochondrion 2014, 17, 76–100. [Google Scholar] [CrossRef]
  51. Engqvist, M.; Drincovich, M.F.; Flugge, U.I.; Maurino, V.G. Two d-2-hydroxy-acid dehydrogenases in Arabidopsis thaliana with catalytic capacities to participate in the last reactions of the methylglyoxal and beta-oxidation pathways. J. Biol. Chem. 2009, 284, 25026–25037. [Google Scholar] [CrossRef] [PubMed] [Green Version]
  52. Becker-Kettern, J.; Paczia, N.; Conrotte, J.F.; Kay, D.P.; Guignard, C.; Jung, P.P.; Linster, C.L. Saccharomyces cerevisiae forms d-2-hydroxyglutarate and couples its degradation to d-lactate formation via a cytosolic transhydrogenase. J. Biol. Chem. 2016, 291, 6036–6058. [Google Scholar] [CrossRef] [PubMed]
Figure 1. Identification of the l-lactate specific recognition element for biosensor construction. (A) Analysis of the interactions of EcLldR, PaLldR, PfLldR, and STLldR with l-lactate and d-lactate by FTS assays. The ΔTm values refer to the changes in the Tm of different LldRs in absence or presence of 1 mM d-lactate or l-lactate. (B) Comparison of the interaction of STLldR with increasing concentrations (10, 50, 100, 500, and 1000 μM) of l-lactate and d-lactate. (C) Specificity analysis of STLldR. The ΔTm values of STLldR were measured in the presence of 1 mM l-lactate, d-lactate, pyruvate, oxaloacetate, acetate, glyoxylate, citrate, isocitrate, d-malate, l-malate, succinate, fumarate, cis-aconitate, 2-ketoglutarate, d-2-hydroxyglutarate, l-2-hydroxyglutarate, l-glutamate. (D) Schematic of the regulatory mechanism of the l-lactate utilization in S. Typhimurium LT2. STLldR represses the expression of lldPRD genes. l-Lactate serves as the effector of STLldR and prevents STLldR binding to the promoter region of lldPRD operon. The direction of gene translation in the lldPRD operon is indicated by the arrow. LldP, lactate permease; LldR, transcription regulator; LldD, l-lactate dehydrogenase. All data shown are mean ± standard deviations. (s.d.) (n = 3 independent experiments).
Biosensors 12 01111 g001
Figure 2. Design and optimization of FILLac. (A) Schematic representation of the predicted conformational changes of the l-lactate biosensor FILLac in the presence or absence of l-lactate. The structure of STLldR shown was predicted based on its amino acid sequence, and the structures of mTFP and Venus shown were downloaded from PDB (PDB ID: 4R6D for mTFP and 3AKO for Venus). (B) Dose-response curve of FILLac0N0C for increasing concentration (10 nM to 1 mM) of l-lactate. The fluorescence emission ratio (Venus to mTFP) of FILLac0N0C decreased after l-lactate binding. (C) Heat map of variants with N-terminal or C-terminal amino acid truncations of STLldR to ΔRmax. The color indicates the value of ΔRmax, and white indicates undetected variants. (D) Comparison of the ΔRmax of biosensor variants based on the N-terminal amino acid truncation of STLldR. (E) Dose-response curve of the optimized variant FILLac10N0C for increasing concentration (10 nM to 1 mM) of l-lactate. All data shown are mean ± s.d. (n = 3 independent experiments).
Biosensors 12 01111 g002
Figure 3. In-vitro characterization of FILLac10N0C. (A) Fluorescence emission spectra of FILLac10N0C in the absence of l-lactate (black) and in the presence of 100 μM l-lactate (red) with excitation at 430 nm. (B) Specificity analysis of FILLac10N0C. The fluorescence emission ratio changes of FILLac10N0C were determined in the presence of 50 μM l-lactate, d-lactate, pyruvate, oxaloacetate, acetate, glyoxylate, citrate, isocitrate, d-malate, l-malate, succinate, fumarate, cis-aconitate, 2-ketoglutarate, d-2-hydroxyglutarate, l-2-hydroxyglutarate, l-glutamate, Na+, K+, Ca2+, Mg2+, NH4+, glucose, and fructose. (C) pH stability analysis of FILLac10N0C. Fluorescence emission ratios of FILLac10N0C in the presence of l-lactate (0, 1, 10, and 100 μM) were determined at different pH values. (D) Temperature stability analysis of FILLac10N0C. Dose-response curves of FILLac10N0C for increasing concentration (10 nM to 1 mM) of l-lactate were determined at different temperatures, ranging from 25 °C to 45 °C. All data shown are mean ± s.d. (n = 3 independent experiments). The significance of the data was analyzed by a two-tailed, unpaired t-test; ****, p < 0.0001; ns, no significant difference (p ≥ 0.05).
Biosensors 12 01111 g003
Figure 4. Performance of FILLac10N0C in l-lactate quantitation. (A) Comparison of the quantitative analysis of l-lactate by using HPLC and FILLac10N0C. Concentrations detected by HPLC were used as control (x-axis). The black dashed line is a reference line with a slope of 1. (B) Comparison of the quantitative analysis of l-lactate by using SBA-40D bioanalyzer and FILLac10N0C. Concentrations detected by SBA-40D bioanalyzer were used as control (x-axis). The black dashed line is a reference line with a slope of 1. (C) Quantification of l-lactate by HPLC, SBA-40D bioanalyzer and FILLac10N0C. Standard concentrations of l-lactate are 2, 4, 20, 40, 100, 160, and 200 mM. All data shown are mean ± s.d. (n = 3 independent experiments). The significance of the data was analyzed by a two-tailed, unpaired t-test; ns, no significant difference (p ≥ 0.05).
Biosensors 12 01111 g004
Figure 5. Quantification of l-lactate in various samples using the sensor FILLac10N0C. (A) Comparison of the quantification results of lactate in fermentation samples produced by L. bulgaricus ATCC 11842, L. plantarum ATCC 14917 and L. casei ATCC 334 by HPLC, SBA-40D bioanalyzer, and FILLac10N0C. (B) Comparison of the quantification results of lactate in three Jiaosu samples by HPLC, SBA-40D bioanalyzer and FILLac10N0C. (C) Comparison of the quantification results of lactate in three yogurt samples by HPLC, SBA-40D bioanalyzer and FILLac10N0C. All data shown are mean ± s.d. (n = 3 independent experiments). The significance of the data was analyzed by a two-tailed, unpaired t-test; **, p < 0.01; ***, p < 0.001; ****, p < 0.0001; ns, no significant difference (p ≥ 0.05).
Biosensors 12 01111 g005
Figure 6. Schematic of the detection and application of FILLac10N0C. The l-lactate concentration in different biological samples can be quantified by mixing the FILLac10N0C with microvolume samples in black 96-well microplates and detected by a fluorescence microplate detector. The FILLac10N0C may be widely used in the fields of food safety and quality control, industry fermentation, clinical diagnostics, and cell culture processes.
Biosensors 12 01111 g006
Publisher’s Note: MDPI stays neutral with regard to jurisdictional claims in published maps and institutional affiliations.

