Development and Application of an SPR Nanobiosensor Based on AuNPs for the Detection of SARS-CoV-2 on Food Surfaces

 , ,
, ,  , ,
, ,  ,
, 
Abstract
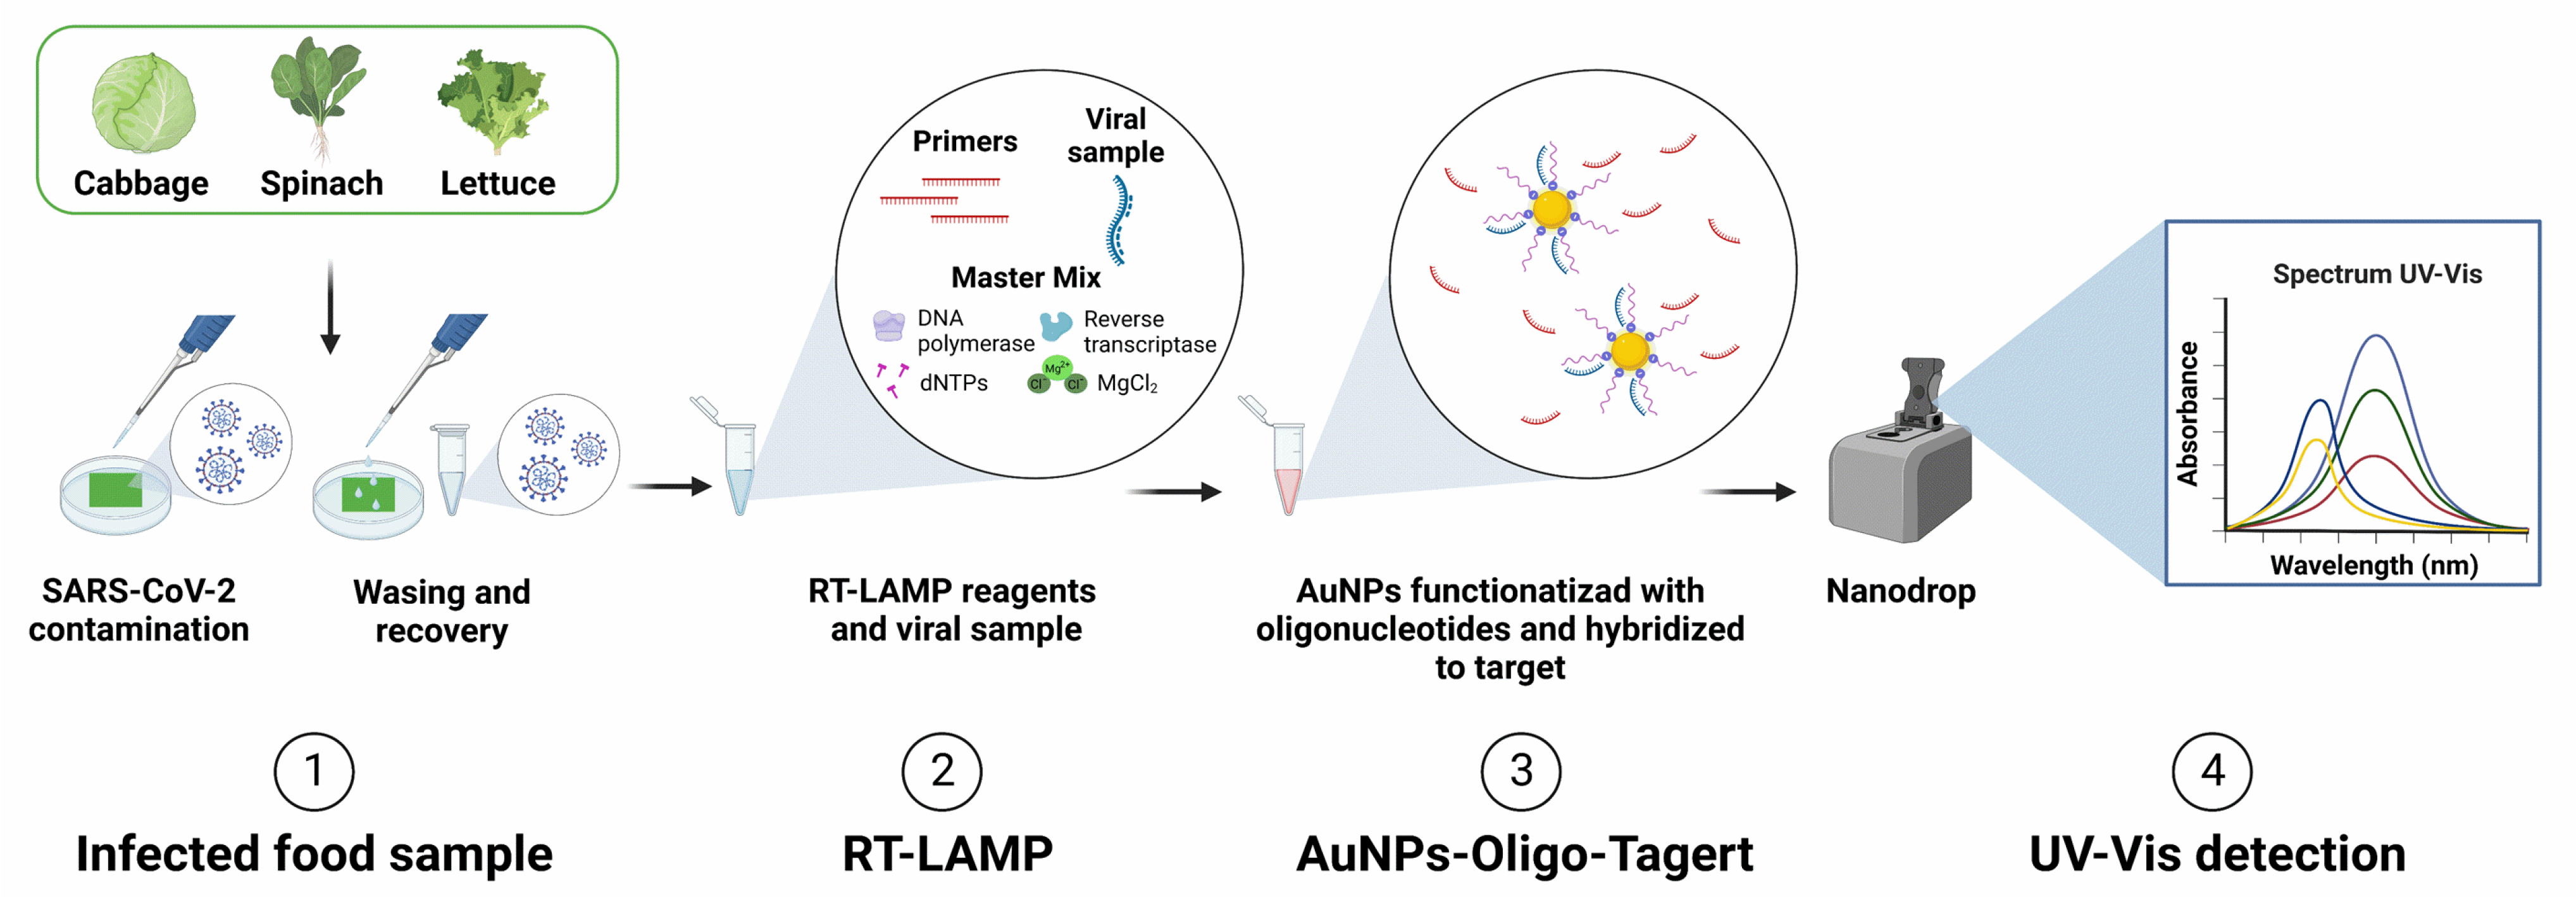
:1. Introduction
2. Methodology
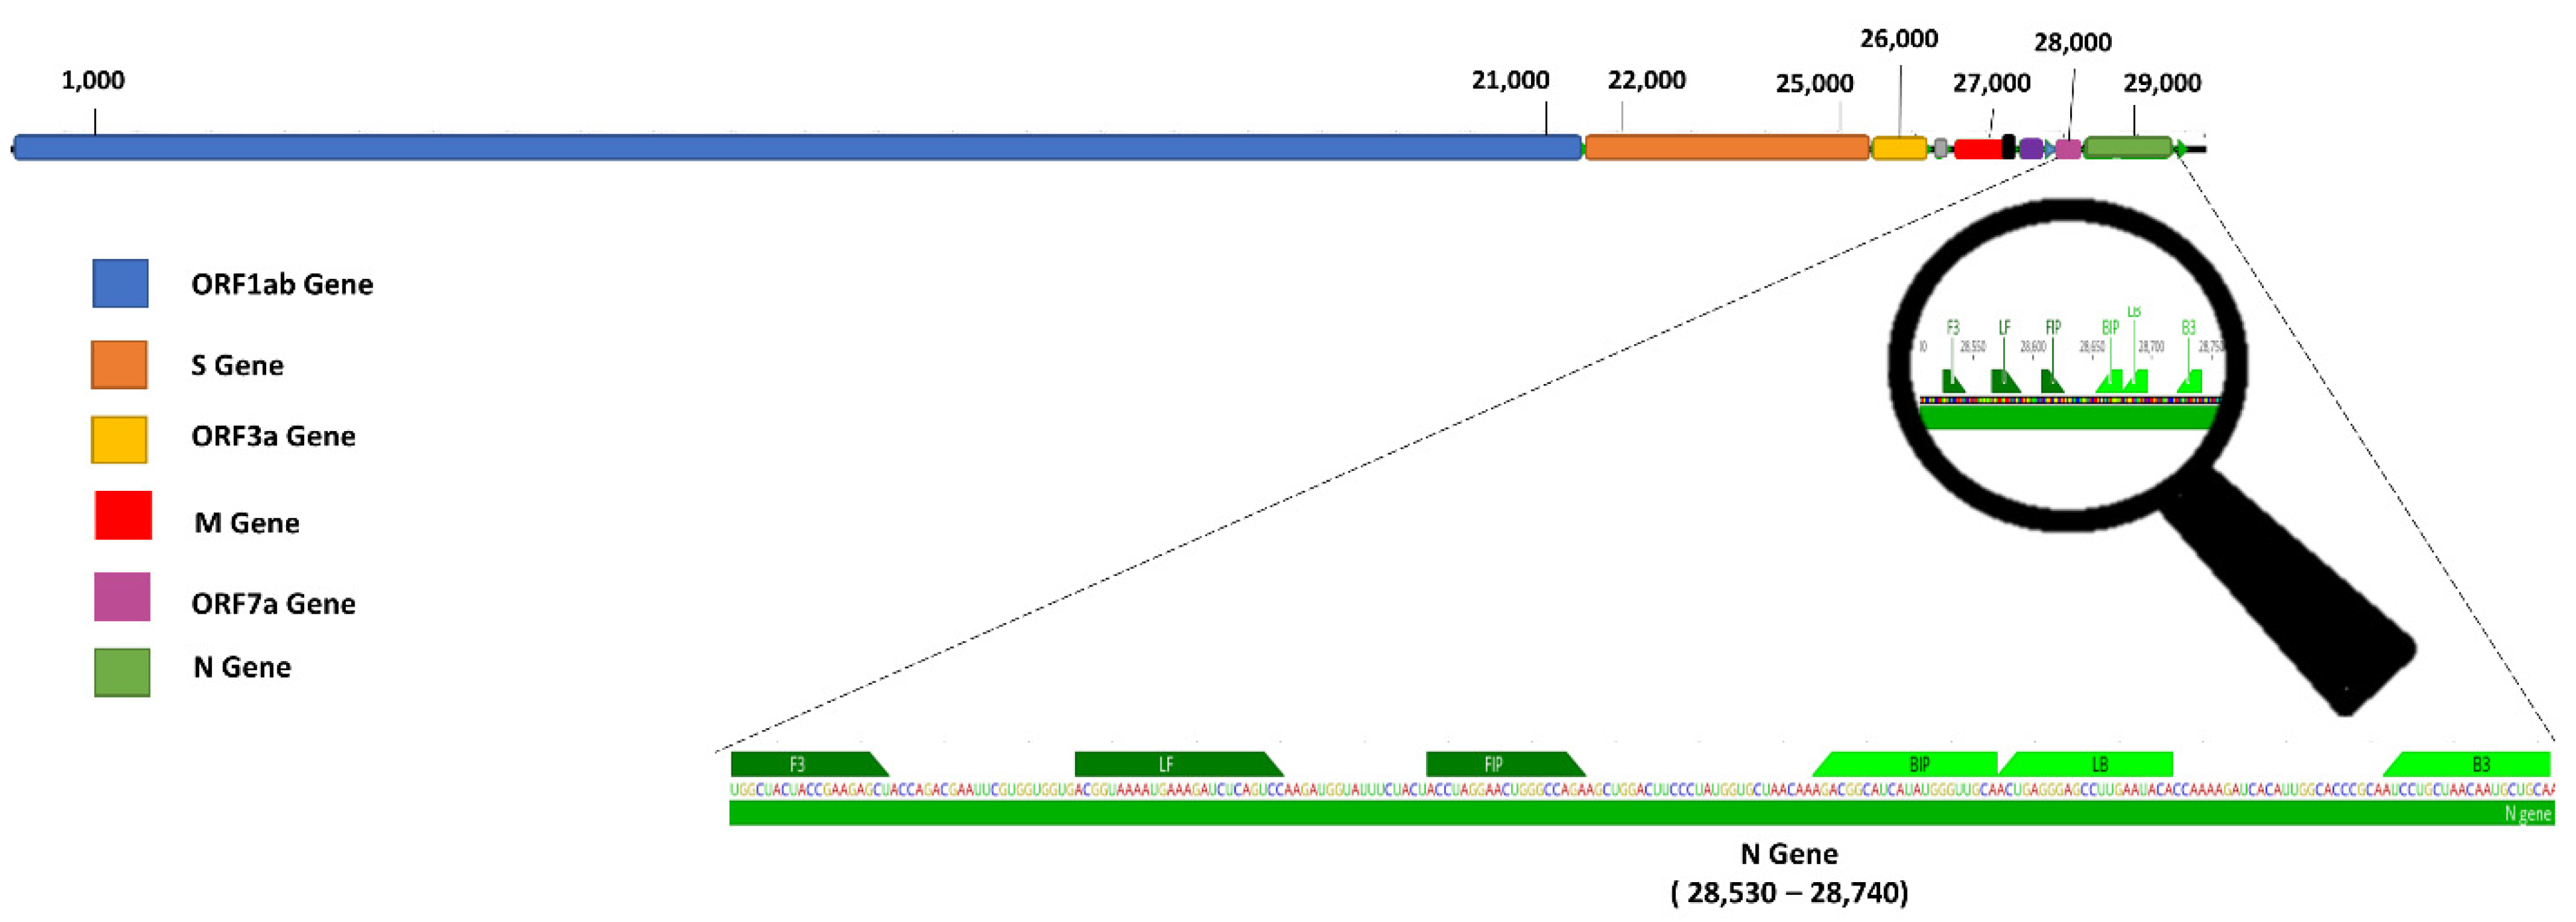
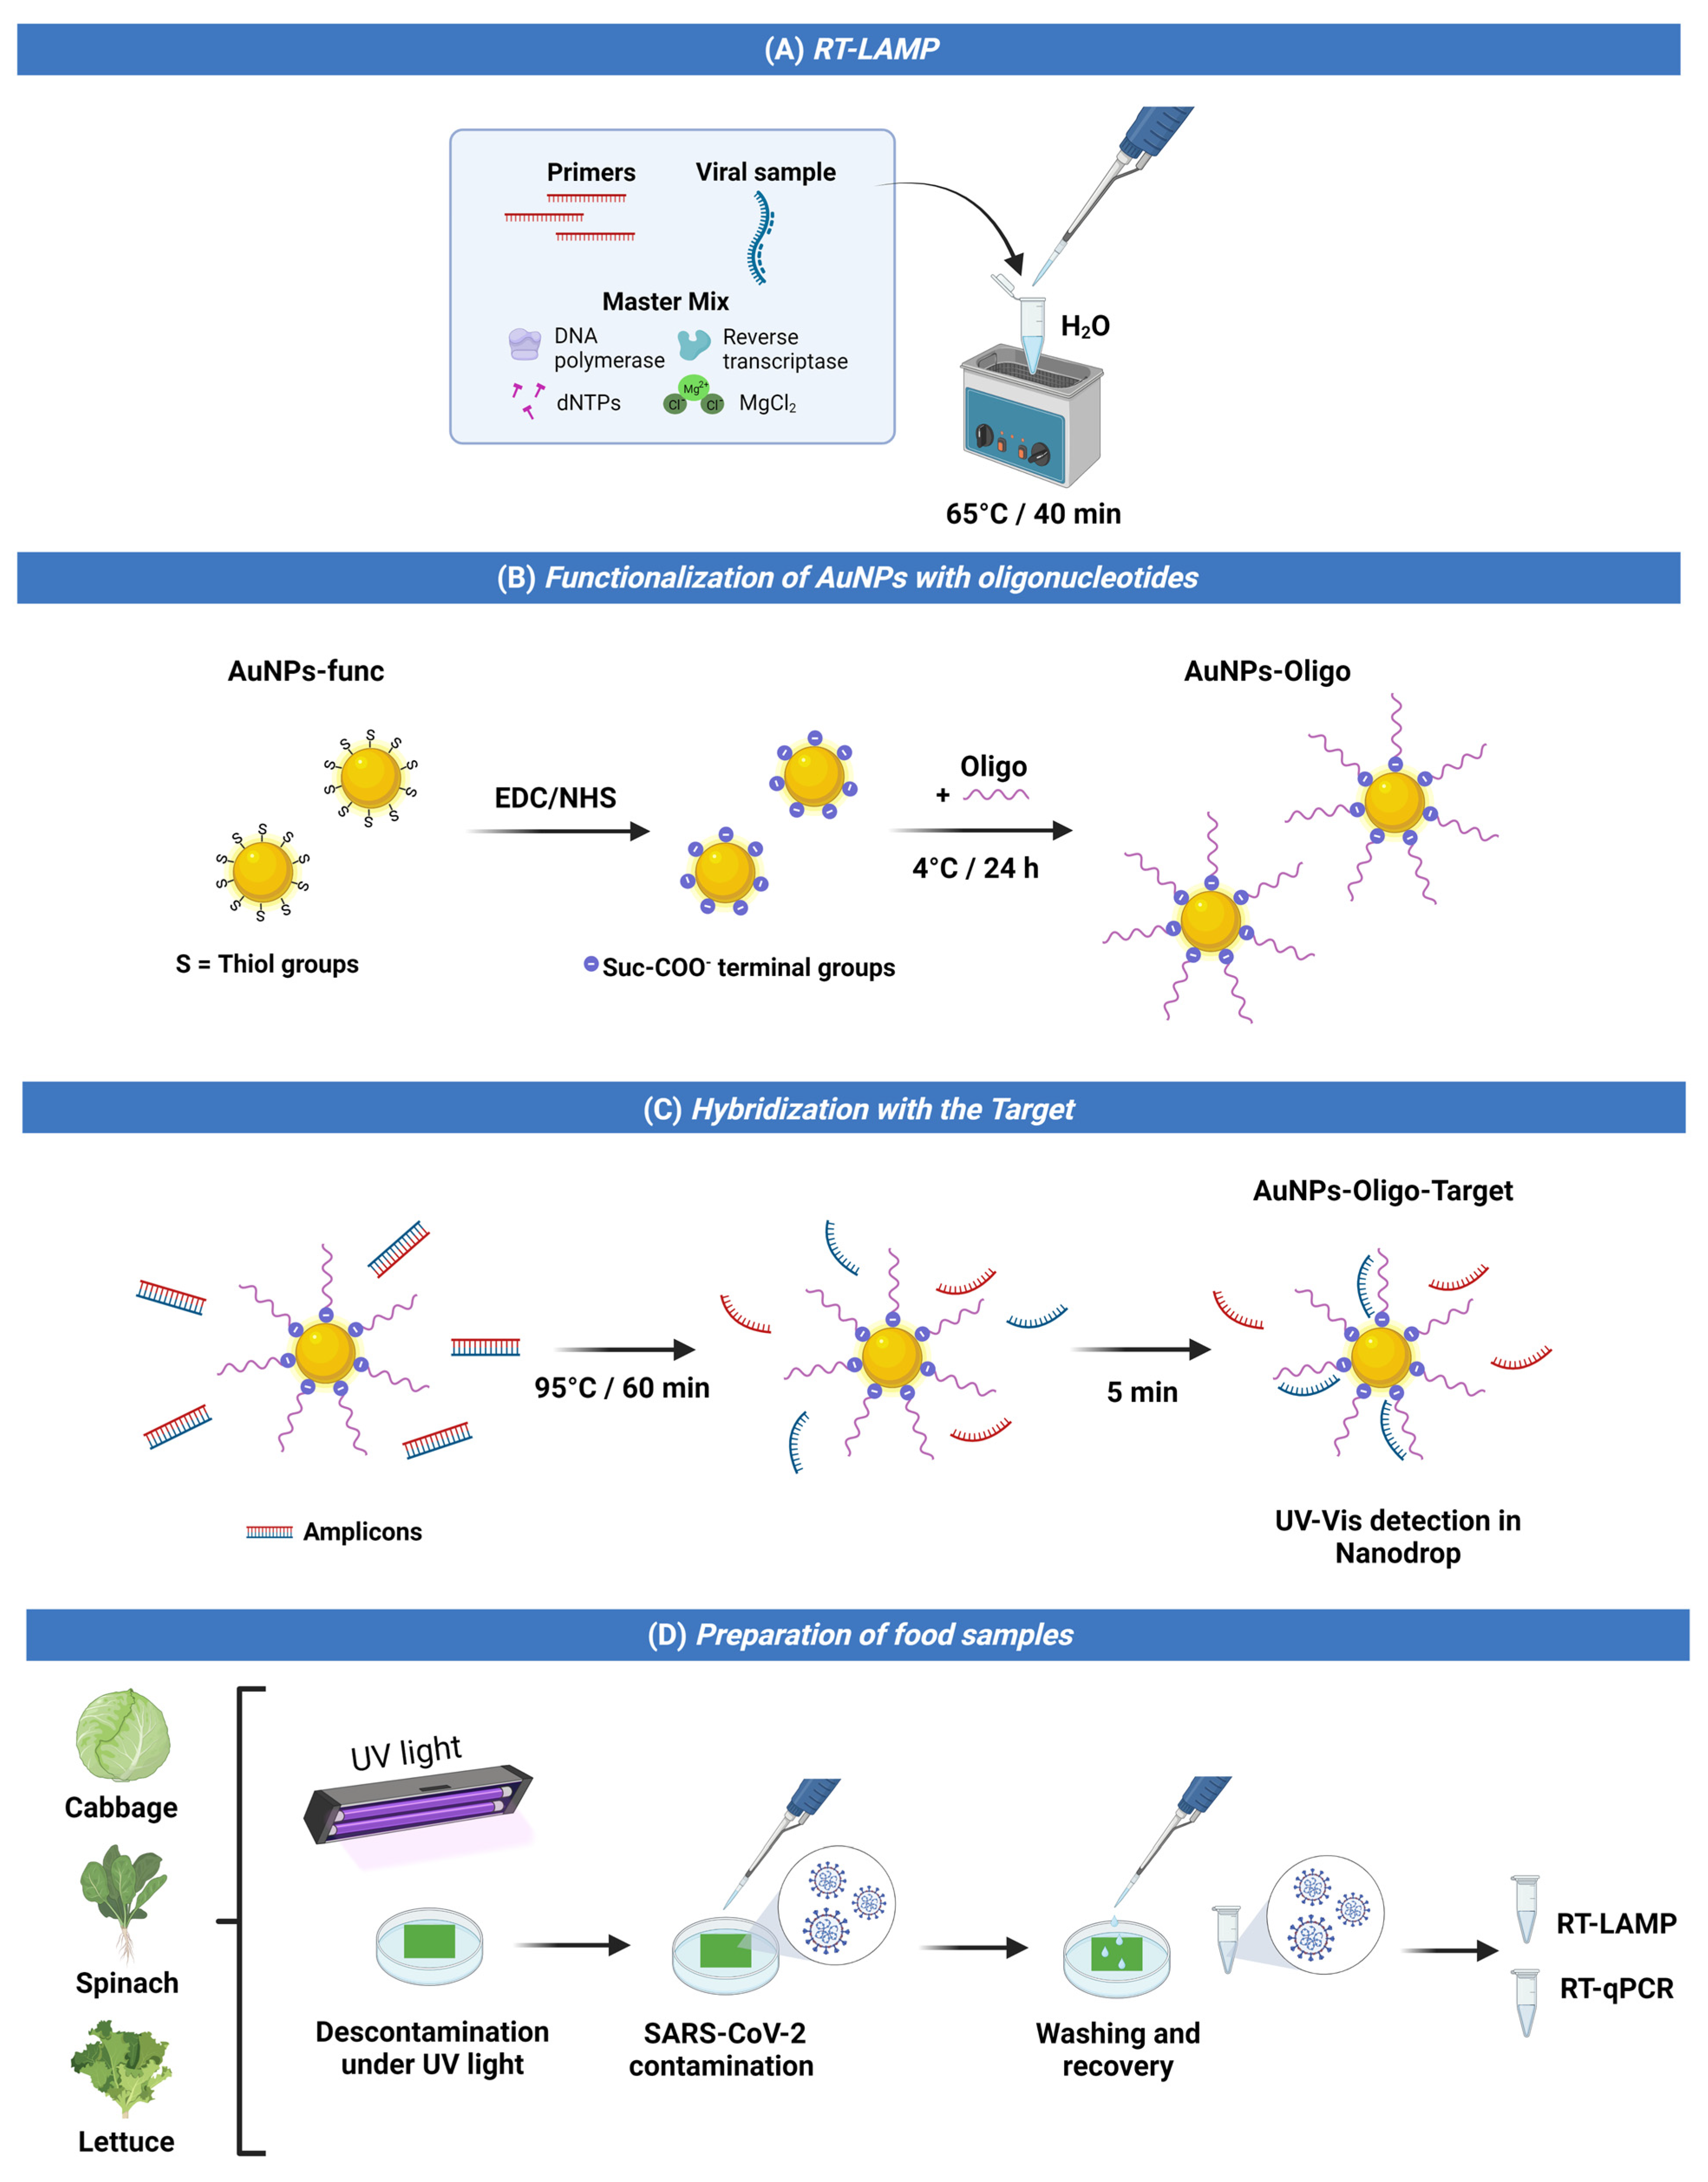
2.1. RT-LAMP
2.2. Quantitative Real-Time RT-qPCR
2.3. AuNP Functionalization with Oligonucleotides
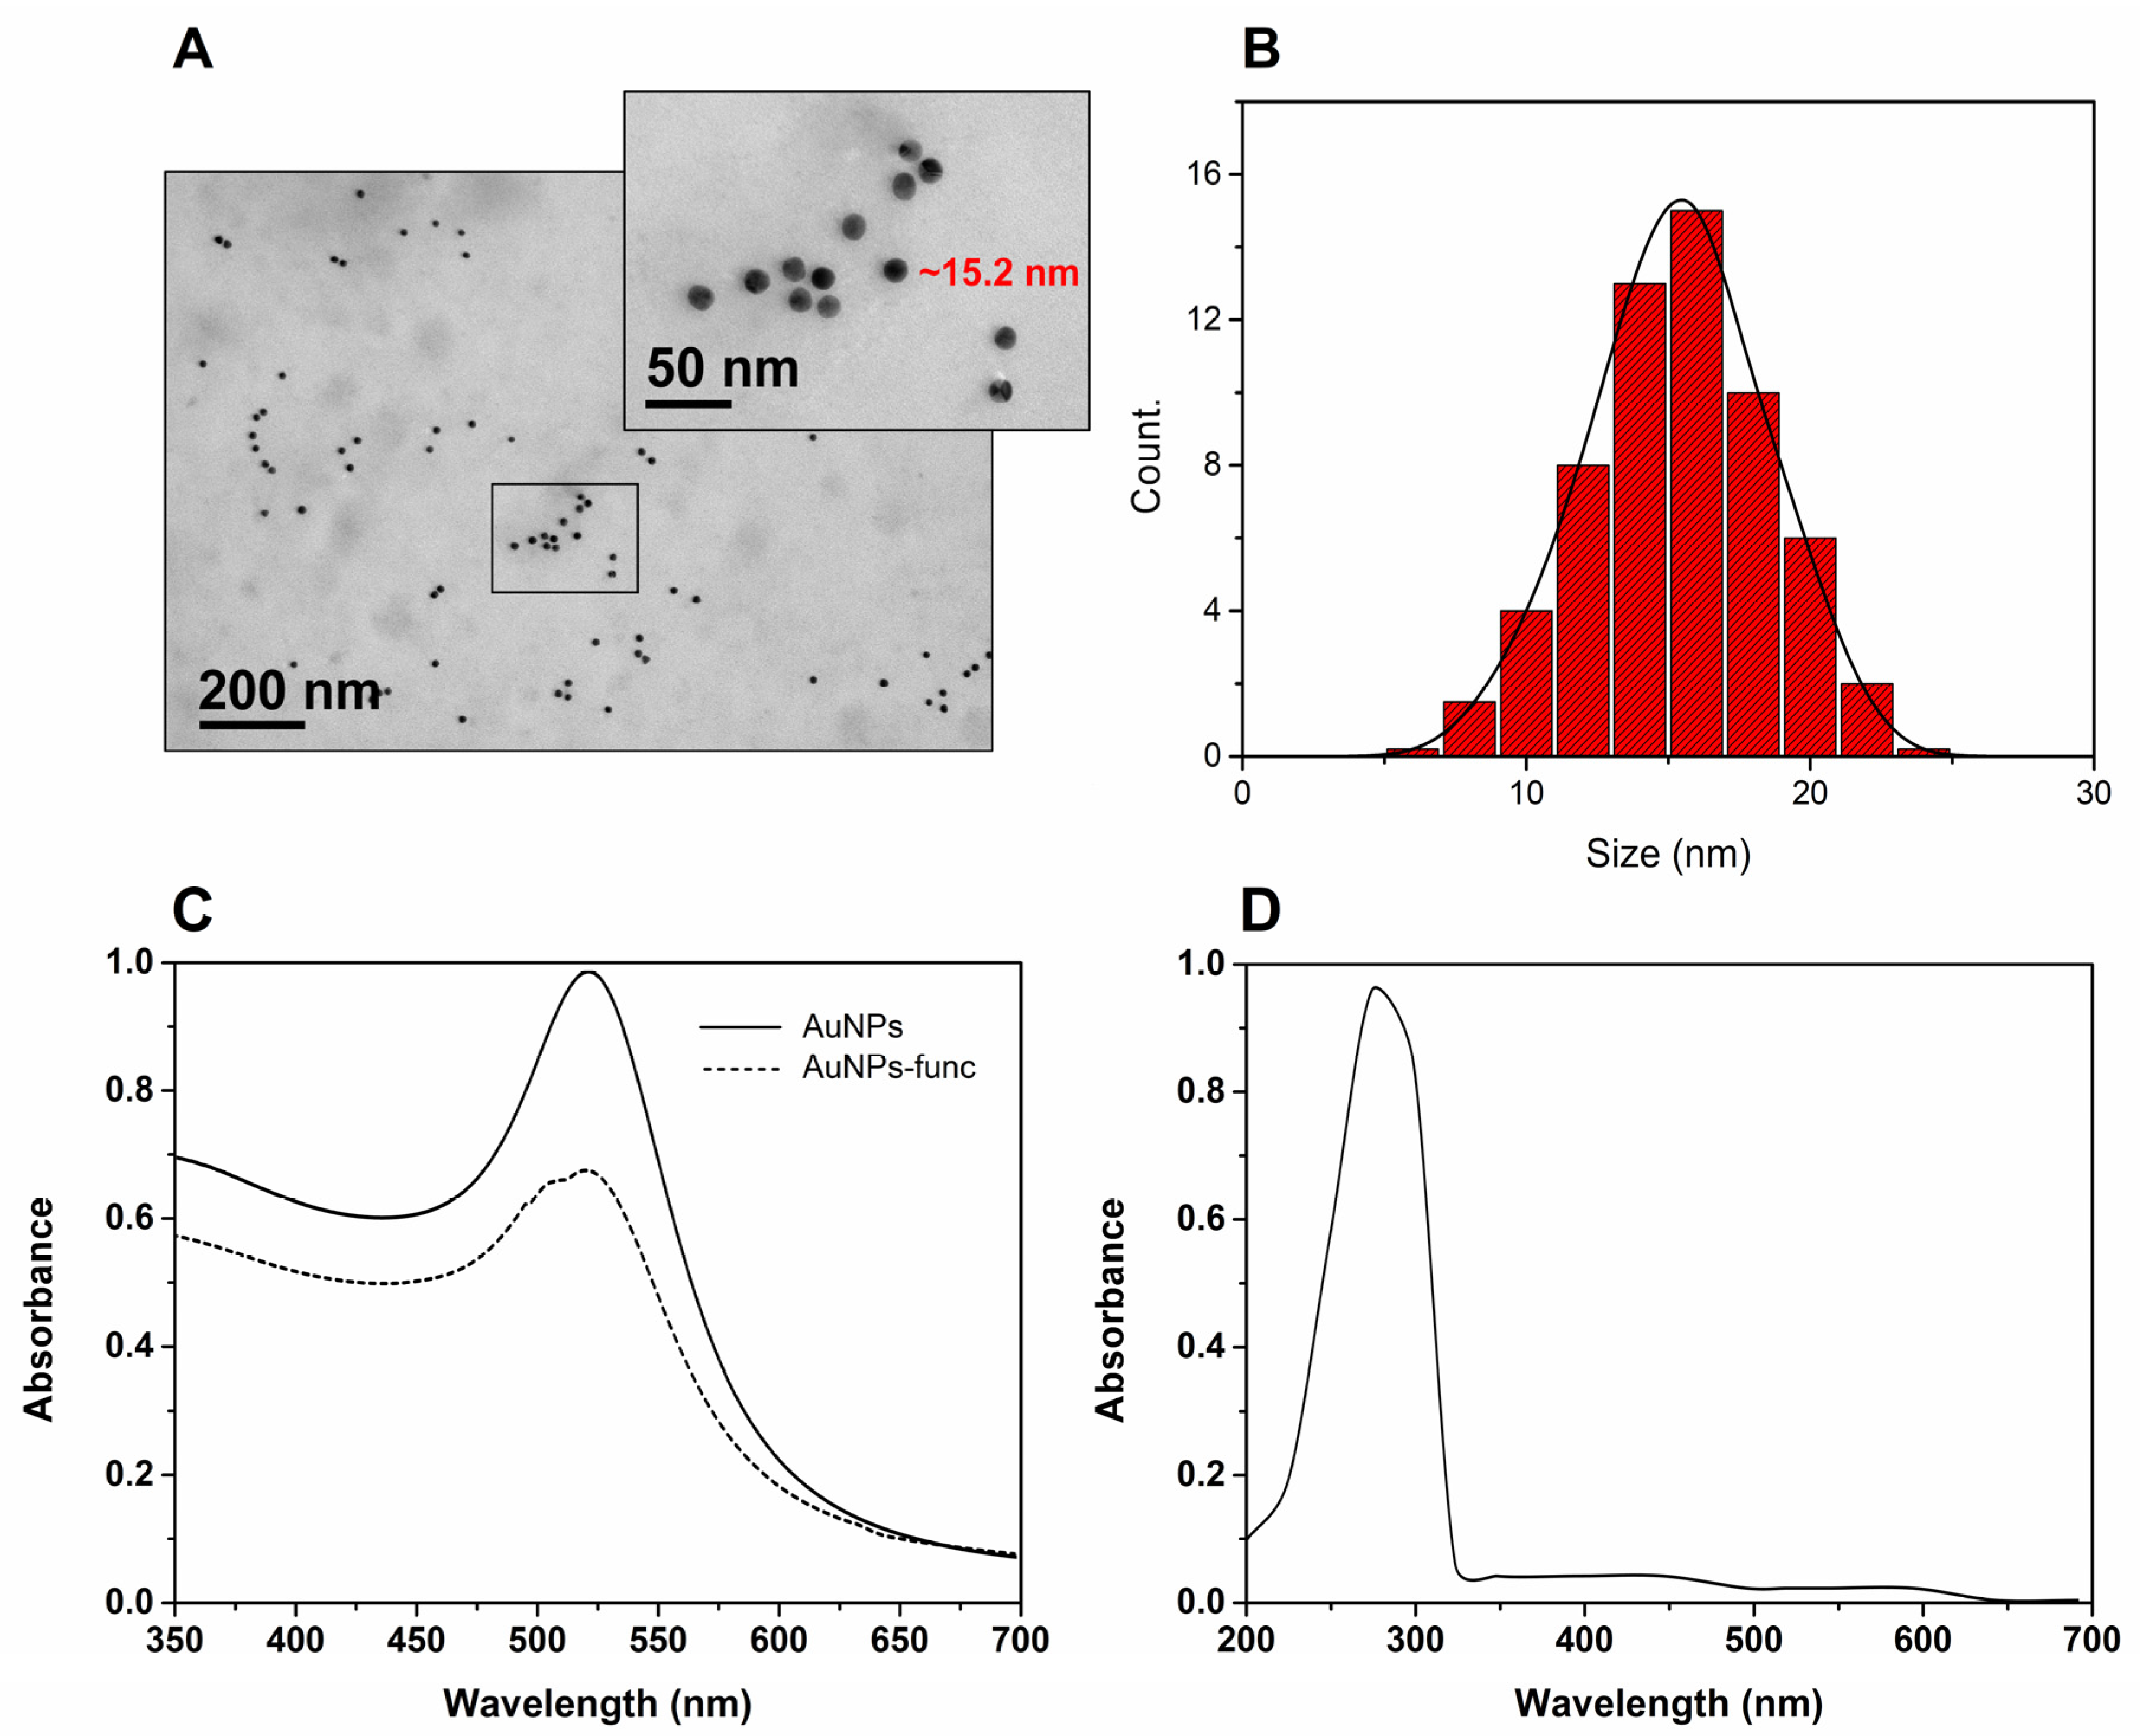
2.4. Transmission Electron Microscopy (TEM) Analysis
2.5. Target Hybridization
2.6. Food Sample Preparation
3. Results and Discussion
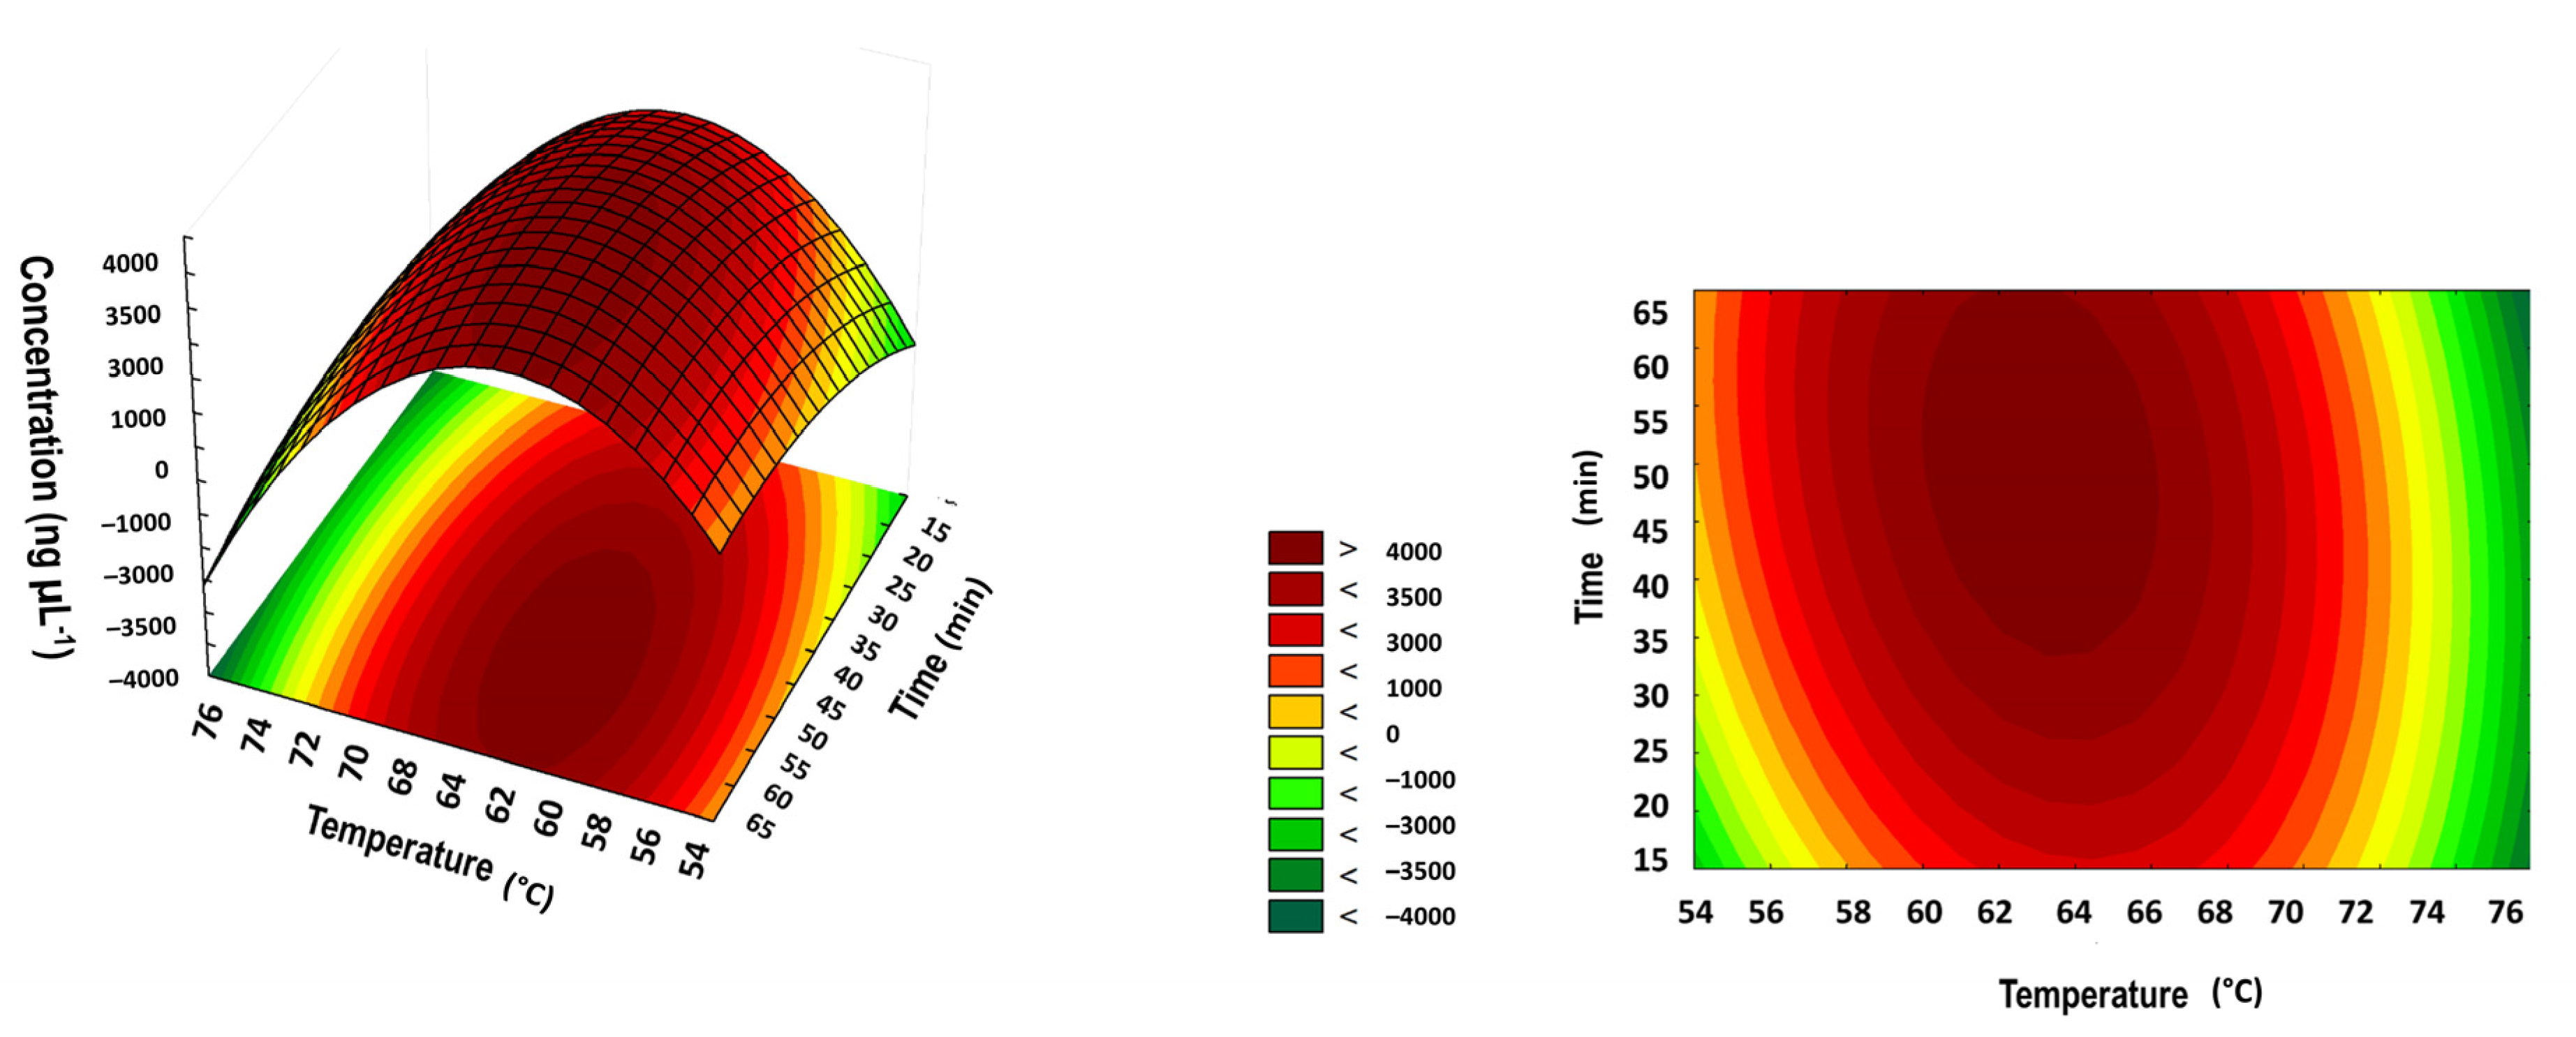
3.1. RT-LAMP Parameter Optimization
3.2. AuNP Functionalization and AuNP-Oligo-Target Hybridization
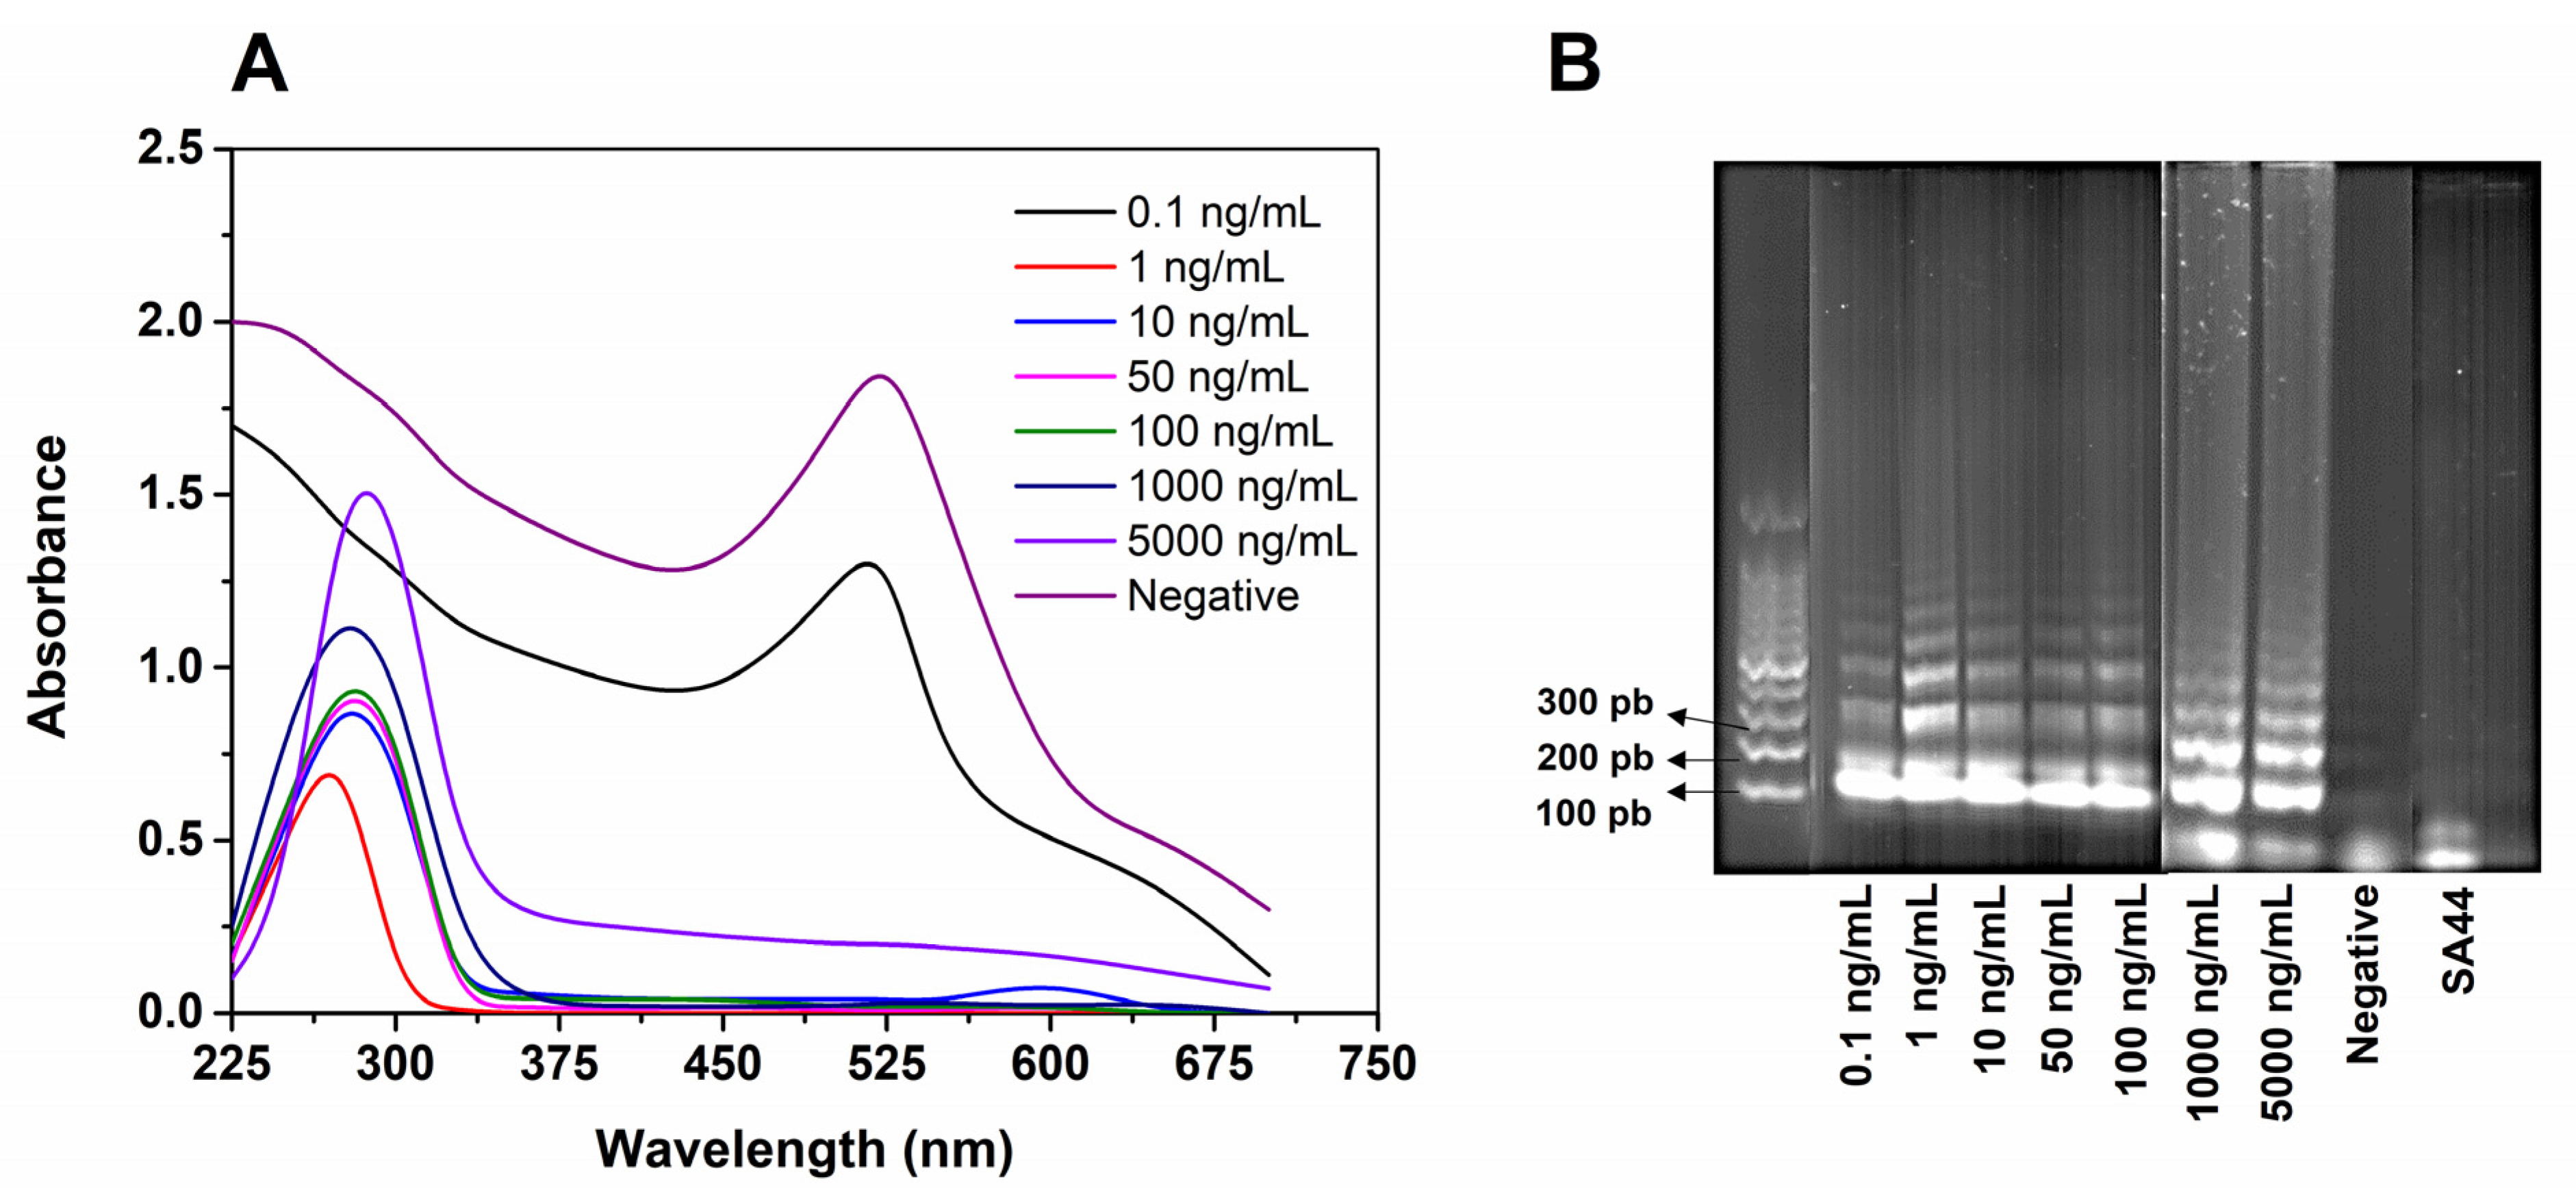
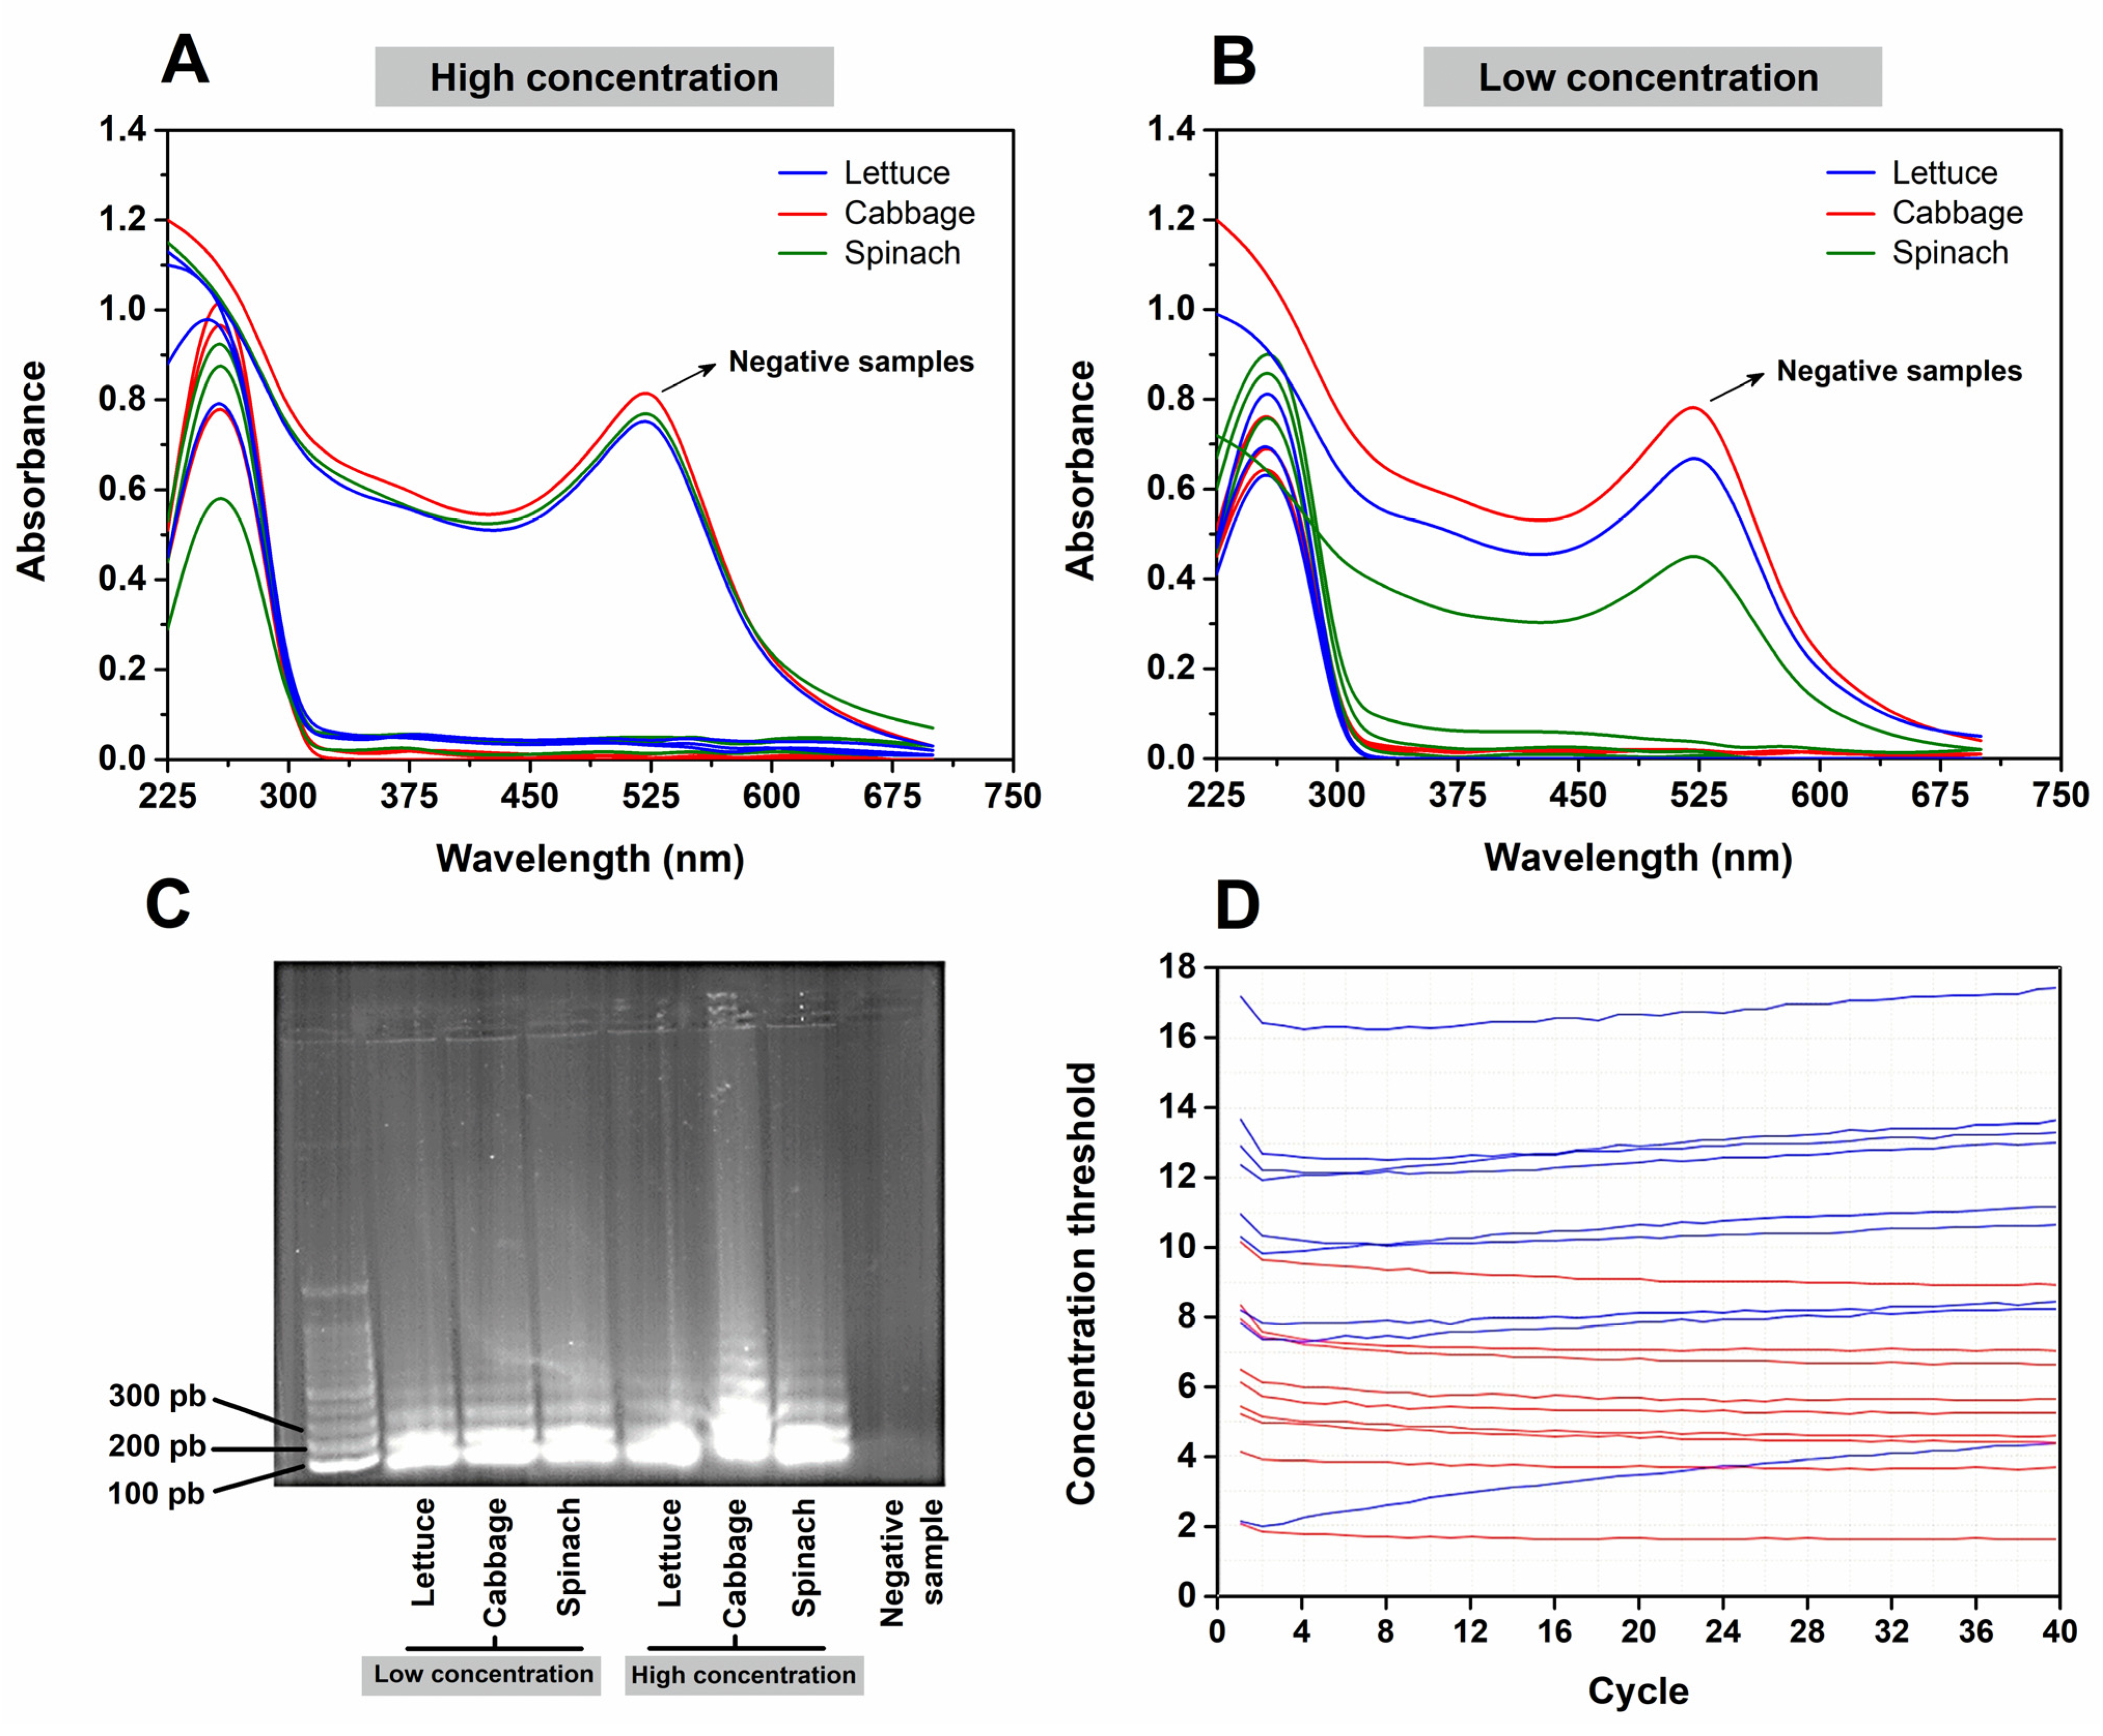
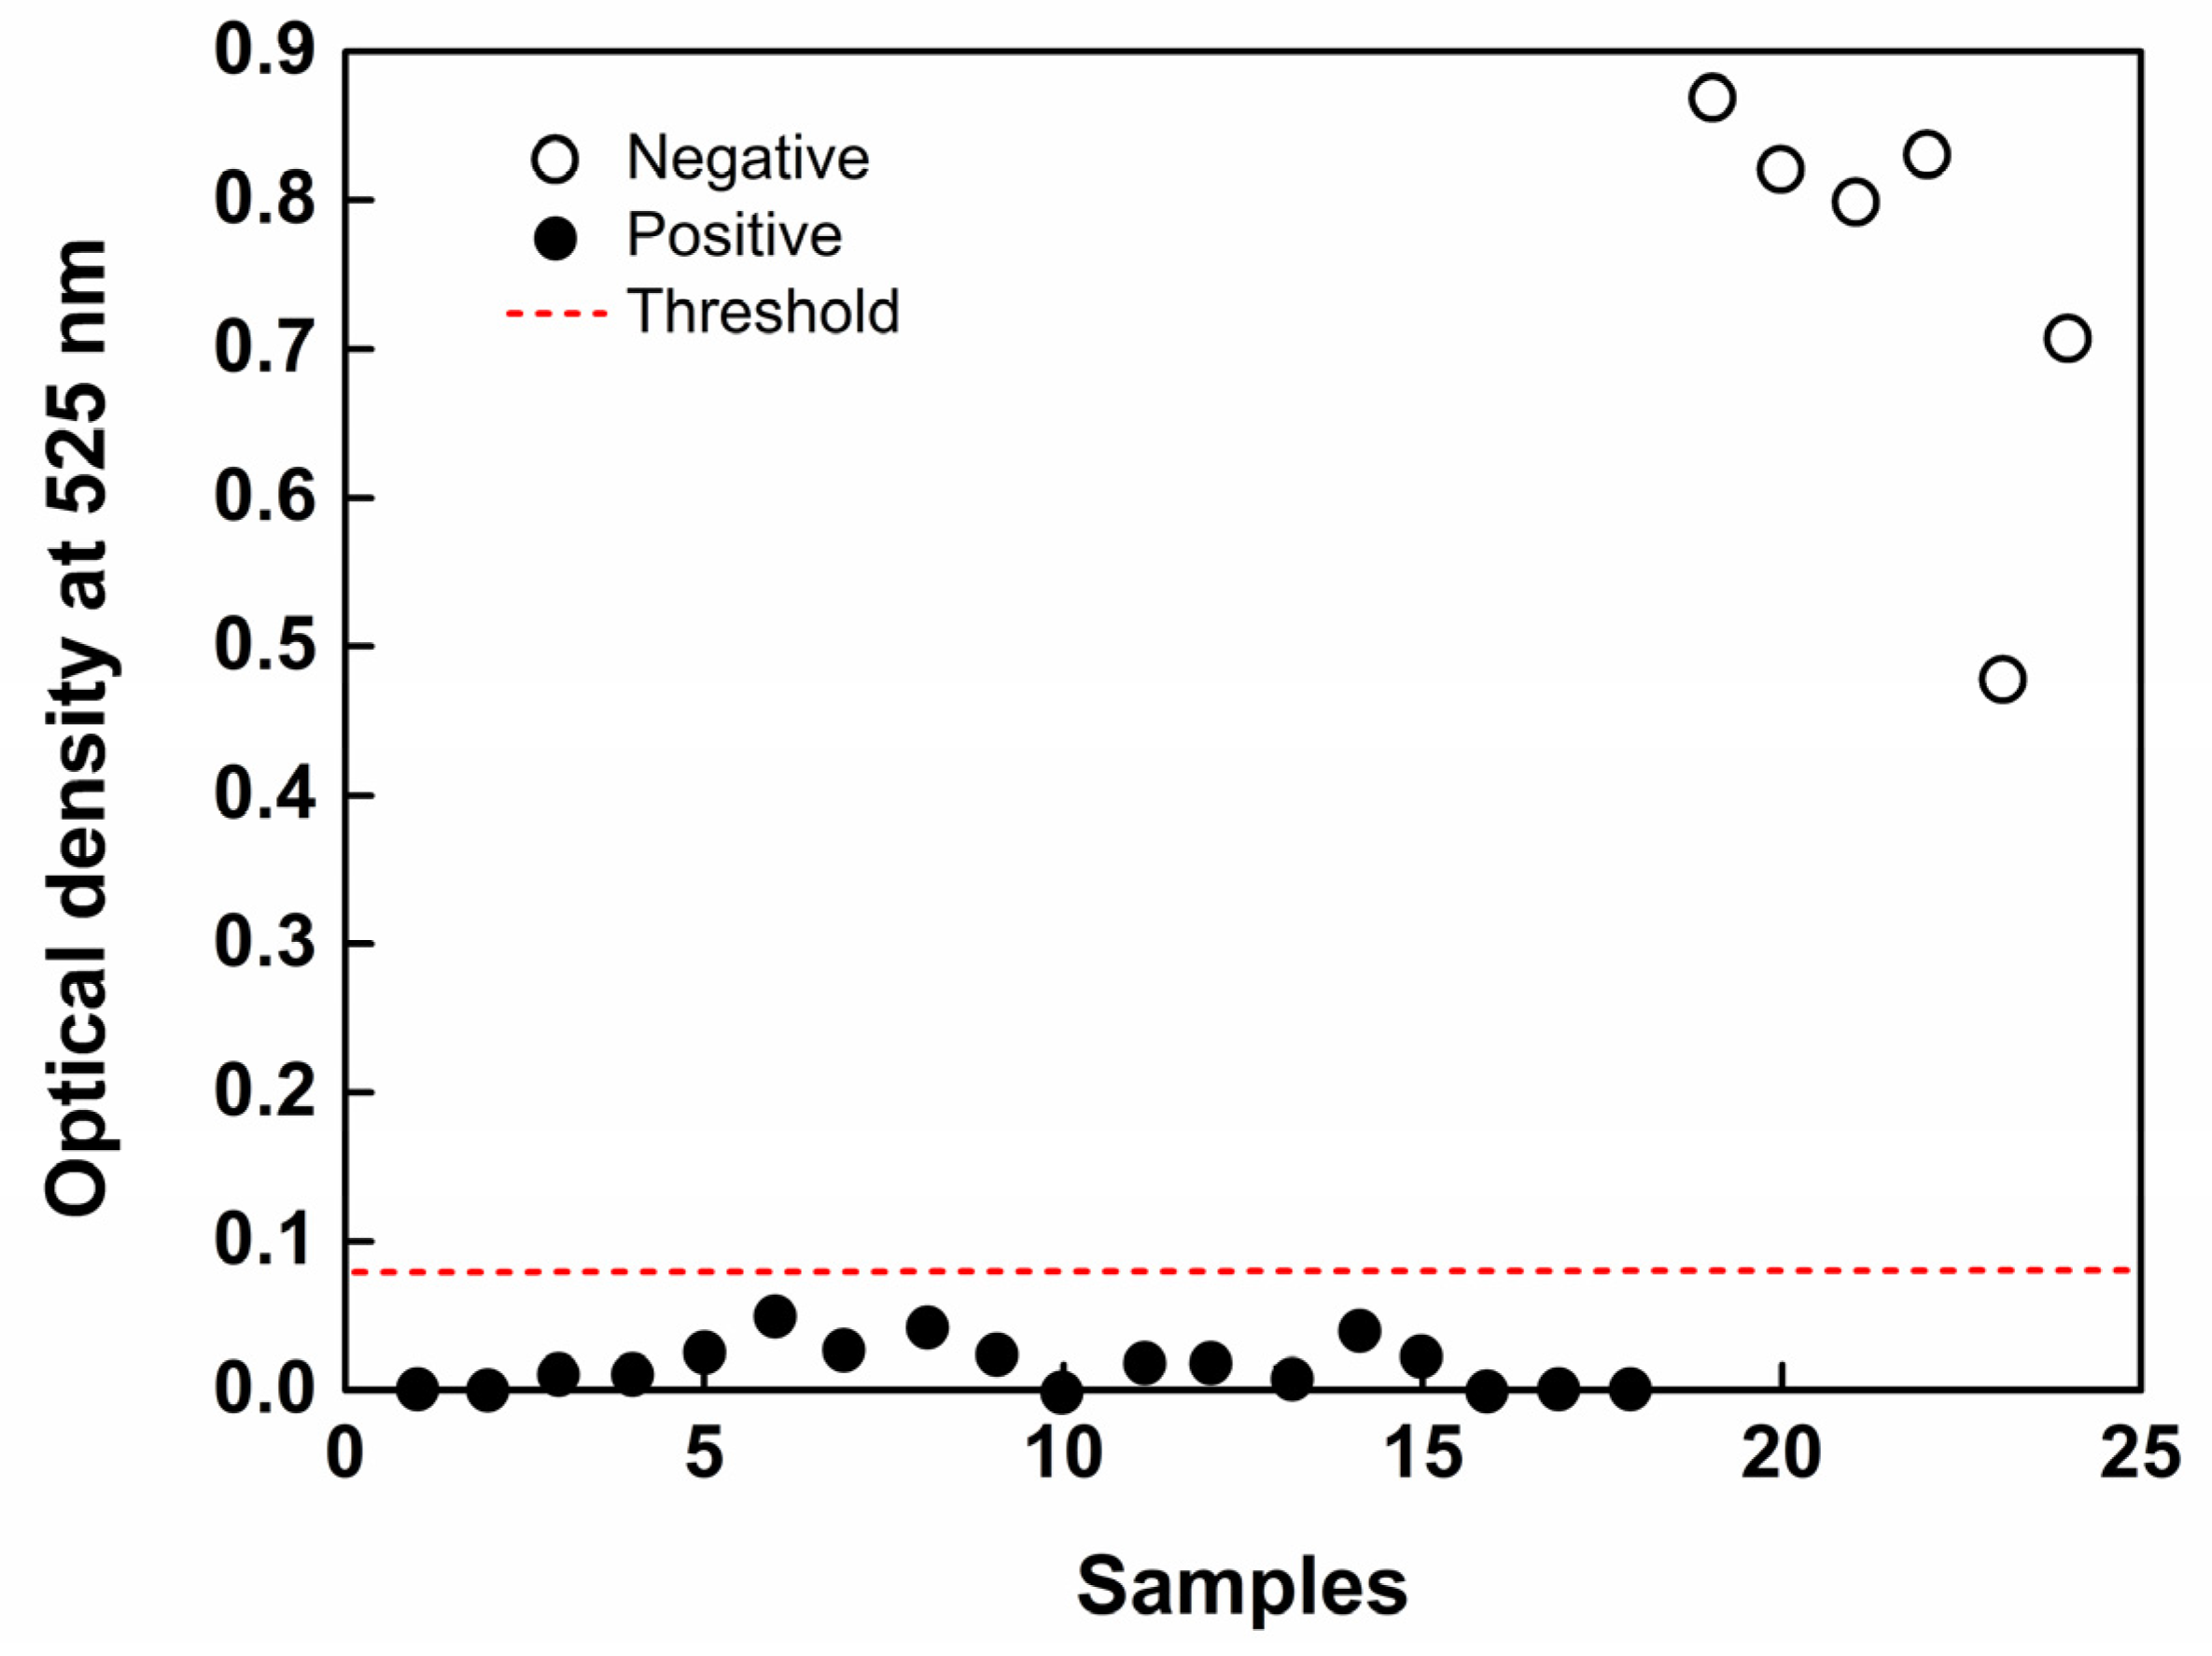
3.3. Determining Biosensor LOD for Application in Food Samples
4. Conclusions
Author Contributions
Funding
Institutional Review Board Statement
Informed Consent Statement
Data Availability Statement
Conflicts of Interest
References
- WHO. WHO Coronavirus (COVID-19) Dashboard 2022. Available online: https://covid19.who.int/ (accessed on 30 September 2022).
- Jia, M.; Taylor, T.M.; Senger, S.M.; Ovissipour, R.; Bertke, A.S. SARS-CoV-2 Remains Infectious on Refrigerated Deli Food, Meats, and Fresh Produce for up to 21 Days. Foods 2022, 11, 286. [Google Scholar] [CrossRef] [PubMed]
- Poggio, C.; Colombo, M.; Arciola, C.R.; Greggi, T.; Scribante, A.; Dagna, A. Copper-alloy surfaces and cleaning regimens against the spread of SARS-CoV-2 in dentistry and orthopedics. From fomites to anti-infective nanocoatings. Materials 2020, 13, 3244. [Google Scholar] [CrossRef] [PubMed]
- Erkoc, P.; Ulucan-Karnak, F. Nanotechnology-Based Antimicrobial and Antiviral Surface Coating Strategies. Prosthesis 2021, 3, 25–52. [Google Scholar] [CrossRef]
- Kampf, G.; Todt, D.; Pfaender, S.; Steinmann, E. Persistence of coronaviruses on inanimate surfaces and their inactivation with biocidal agents. J. Hosp. Infect. 2020, 104, 246–251. [Google Scholar] [CrossRef] [Green Version]
- Liu, P.; Yang, M.; Zhao, X.; Guo, Y.; Wang, L.; Zhang, J.; Lei, W.; Han, W.; Jiang, F.; Liu, W.J.; et al. Cold-chain transportation in the frozen food industry may have caused a recurrence of COVID-19 cases in destination: Successful isolation of SARS-CoV-2 virus from the imported frozen cod package surface. Biosaf. Health 2020, 2, 199–201. [Google Scholar] [CrossRef]
- Hu, L.; Gao, J.; Yao, L.; Zeng, L.; Liu, Q.; Zhou, Q.; Zhang, H.; Lu, D.; Fu, J.; Liu, Q.S.; et al. Evidence of Foodborne Transmission of the Coronavirus (COVID-19) through the Animal Products Food Supply Chain. Environ. Sci. Technol. 2021, 55, 2713–2716. [Google Scholar] [CrossRef]
- WHO-China WHO-Convened Global Study of Origins of SARS- CoV-2: China Part. Infect. Dis. Immun. 2021, 1, 125–132. [CrossRef]
- Castro, J.R. Chinese Authorities Say Coronavirus Found Chicken Brazilian Poultry 2020. Available online: https://brazilian.report/business/2020/08/13/chinese-authorities-say-coronavirus-found-chicken-brazilian-poultry/ (accessed on 15 October 2022).
- Pang, X.; Ren, L.; Wu, S.; Ma, W.; Yang, J.; Di, L.; Li, J.; Xiao, Y.; Kang, L.; Du, S.; et al. Cold-chain food contamination as the possible origin of COVID-19 resurgence in Beijing. Natl. Sci. Rev. 2020, 7, 1861–1864. [Google Scholar] [CrossRef]
- Bai, L.; Wang, Y.; Wang, Y.; Wu, Y.; Li, N.; Liu, Z. Controlling COVID-19 Transmission due to Contaminated. China CDC Wkly. 2019, 3, 30–33. [Google Scholar] [CrossRef]
- Mohkhedkar, M.; Venigalla SS, K.; Janakiraman, V. Autoantigens that may explain postinfection autoimmune manifestations in patients with coronavirus disease 2019 displaying neurological conditions. J. Infect. Dis. 2021, 223, 536–537. [Google Scholar] [CrossRef]
- Lino, A.; Cardoso, M.A.; Gonçalves, H.M.R.; Martins-Lopes, P. SARS-CoV-2 Detection Methods. Chemosensors 2022, 10, 221. [Google Scholar] [CrossRef]
- Mangla, B.; Chauhan, S.; Kathuria, S.; Patra, S.; Shukla, S.K.; Hussain, C.M. Current Scenario of Pandemic COVID-19: Overview, Diagnosis, and Future Prospective. In Detection and Analysis of SARS Coronavirus: Advanced Biosensors for Pandemic Viruses and Related Pathogens; John Wiley & Sons, Inc: Hoboken, NJ, USA, 2021; pp. 43–45. [Google Scholar] [CrossRef]
- Sheikhzadeh, E.; Eissa, S.; Ismail, A.; Zourob, M. Diagnostic techniques for COVID-19 and new developments. Talanta 2020, 220, 121392. [Google Scholar] [CrossRef] [PubMed]
- Zhu, X.; Wang, X.; Han, L.; Chen, T.; Wang, L.; Li, H.; Li, S.; He, L.; Fu, X.; Chen, S.; et al. Multiplex reverse transcription loop-mediated isothermal amplification combined with nanoparticle-based lateral flow biosensor for the diagnosis of COVID-19. Biosens. Bioelectron. 2020, 166, 112437. [Google Scholar] [CrossRef] [PubMed]
- Huang, X.; Tang, G.; Ismail, N.; Wang, X. Developing RT-LAMP assays for rapid diagnosis of SARS-CoV-2 in saliva. EBioMedicine 2022, 75, 103736. [Google Scholar] [CrossRef]
- Ali, Z.; Aman, R.; Mahas, A.; Rao, G.S.; Tehseen, M.; Marsic, T.; Salunke, R.; Subudhi, A.K.; Hala, S.M.; Hamdan, S.M.; et al. iSCAN: An RT-LAMP-coupled CRISPR-Cas12 module for rapid, sensitive detection of SARS-CoV-2. Virus Res. 2020, 288, 198129. [Google Scholar] [CrossRef]
- Becherer, L.; Borst, N.; Bakheit, M.; Frischmann, S.; Zengerle, R.; Von Stetten, F. Loop-mediated isothermal amplification (LAMP)-review and classification of methods for sequence-specific detection. Anal. Methods 2020, 12, 717–746. [Google Scholar] [CrossRef] [Green Version]
- González-González, E.; Lara-Mayorga, I.M.; Rodríguez-Sánchez, I.P.; Zhang, Y.S.; Martínez-Chapa, S.O.; De Santiago, G.T.; Alvarez, M.M. Colorimetric loop-mediated isothermal amplification (LAMP) for cost-effective and quantitative detection of SARS-CoV-2: The change in color in LAMP-based assays quantitatively correlates with viral copy number. Anal. Methods 2021, 13, 169–178. [Google Scholar] [CrossRef]
- Nawattanapaiboon, K.; Pasomsub, E.; Prombun, P.; Wongbunmak, A.; Jenjitwanich, A.; Mahasupachai, P.; Vetcho, P.; Chayrach, C.; Manatjaroenlap, N.; Samphaongern, C.; et al. Colorimetric reverse transcription loop-mediated isothermal amplification (RT-LAMP) as a visual diagnostic platform for the detection of the emerging coronavirus SARS-CoV-2. Analyst 2021, 146, 471–477. [Google Scholar] [CrossRef]
- Baek, Y.H.; Um, J.; Antigua, K.J.C.; Park, J.H.; Kim, Y.; Oh, S.; Kim, Y.; Choi, W.S.; Kim, S.G.; Jeong, J.H.; et al. Development of a reverse transcription-loop-mediated isothermal amplification as a rapid early-detection method for novel SARS-CoV-2. Emerg. Microbes Infect. 2020, 9, 998–1007. [Google Scholar] [CrossRef]
- Aoki, M.N.; de Oliveira Coelho, B.; Góes, L.G.B.; Minoprio, P.; Durigon, E.L.; Morello, L.G.; Marchini, F.K.; Riediger, I.N.; do Carmo Debur, M.; Nakaya, H.I.; et al. Colorimetric RT-LAMP SARS-CoV-2 diagnostic sensitivity relies on color interpretation and viral load. Sci. Rep. 2021, 11, 9026. [Google Scholar] [CrossRef]
- De Oliveira, K.G.; Estrela, P.F.N.; Mendes, G.D.M.; Dos Santos, C.A.; Silveira-Lacerda, E.D.P.; Duarte, G.R.M. Rapid molecular diagnostics of COVID-19 by RT-LAMP in a centrifugal polystyrene-Toner based microdevice with end-point visual detection. Analyst 2021, 146, 1178–1187. [Google Scholar] [CrossRef] [PubMed]
- Pishva, P.; Yuce, M. Nanomaterials to tackle the COVID-19 pandemic. Emergent Mater. 2021, 4, 211–229. [Google Scholar] [CrossRef] [PubMed]
- Tessaro, L.; Aquino, A.; de Almeida Rodrigues, P.; Joshi, N.; Ferrari, R.G.; Conte-Junior, C.A. Nucleic Acid-Based Nanobiosensor (NAB) Used for Salmonella Detection in Foods: A Systematic Review. Nanomaterials 2022, 12, 821. [Google Scholar] [CrossRef]
- Behera, B.C.; Mishra, R.R.; Thatoi, H. Recent biotechnological tools for diagnosis of corona virus disease: A review. Biotechnol. Prog. 2021, 37, e3078. [Google Scholar] [CrossRef] [PubMed]
- Tessaro, L.; Aquino, A.; de Carvalho, A.P.A.; Conte-Junior, C.A. A systematic review on gold nanoparticles based-optical biosensors for Influenza virus detection. Sens. Actuators Rep. 2021, 3, 100060. [Google Scholar] [CrossRef]
- Tessaro, L.; Aquino, A.; Panzenhagen, P.; Joshi, N.; Conte-Junior, C.A. A systematic review of the advancement on colorimetric nanobiosensors for SARS-CoV-2 detection. J. Pharm. Biomed. Anal. 2022, 222, 115087. [Google Scholar] [CrossRef] [PubMed]
- Zhang, Y.; Odiwuor, N.; Xiong, J.; Sun, L.; Nyaruaba, R.O.; Wei, H.; Tanner, N.A.; Tanner, N. Rapid Molecular Detection of SARS-CoV-2 (COVID-19) Virus RNA Using Colorimetric LAMP. medRxiv 2020, 2. [Google Scholar] [CrossRef]
- Pires, N.M.M.; Dong, T.; Hanke, U.; Hoivik, N. Recent developments in optical detection technologies in lab-on-a-chip devices for biosensing applications. Sensors (Switzerland) 2014, 14, 15458–15479. [Google Scholar] [CrossRef] [Green Version]
- Wilson, R. The use of gold nanoparticles in diagnostics and detection. Chem. Soc. Rev. 2008, 37, 2028–2045. [Google Scholar] [CrossRef]
- Cao, X.; Ye, Y.; Liu, S. Gold nanoparticle-based signal amplification for biosensing. Anal. Biochem. 2011, 417, 1–16. [Google Scholar] [CrossRef]
- Zhou, C.; Lin, C.; Hu, Y.; Zan, H.; Xu, X.; Sun, C.; Zou, H.; Li, Y. Sensitive fluorescence biosensor for SARS-CoV-2 nucleocapsid protein detection in cold-chain food products based on DNA circuit and g-CNQDs@Zn-MOF. LWT 2022, 169, 114032. [Google Scholar] [CrossRef] [PubMed]
- Georgiou, P.G.; Guy, C.S.; Hasan, M.; Ahmad, A.; Richards, S.J.; Baker, A.N.; Thakkar, N.V.; Walker, M.; Pandey, S.; Anderson, N.R.; et al. Plasmonic Detection of SARS-CoV-2 Spike Protein with Polymer-Stabilized Glycosylated Gold Nanorods. ACS Macro Lett. 2022, 11, 317–322. [Google Scholar] [CrossRef] [PubMed]
- Karakus, E.; Erdemir, E.; Demirbilek, N.; Liv, L. Colorimetric and electrochemical detection of SARS-CoV-2 spike antigen with a gold nanoparticle-based biosensor. Anal. Chim. Acta 2021, 1182, 338939. [Google Scholar] [CrossRef] [PubMed]
- Moitra, P.; Alafeef, M.; Alafeef, M.; Alafeef, M.; Dighe, K.; Frieman, M.B.; Pan, D.; Pan, D.; Pan, D. Selective Naked-Eye Detection of SARS-CoV-2 Mediated by N Gene Targeted Antisense Oligonucleotide Capped Plasmonic Nanoparticles. ACS Nano 2020, 14, 7617–7627. [Google Scholar] [CrossRef] [PubMed]
- Behrouzi, K.; Lin, L. Gold nanoparticle based plasmonic sensing for the detection of SARS-CoV-2 nucleocapsid proteins. Biosens. Bioelectron. 2022, 195, 113669. [Google Scholar] [CrossRef]
- Han, H.; Wang, C.; Yang, X.; Zheng, S.; Cheng, X.; Liu, Z.; Zhao, B.; Xiao, R. Rapid field determination of SARS-CoV-2 by a colorimetric and fluorescent dual-functional lateral flow immunoassay biosensor. Sens. Actuators B Chem. 2022, 351, 130897. [Google Scholar] [CrossRef]
- Büyüksünetçi, Y.T.; Çitil, B.E.; Tapan, U.; Anık, Ü. Development and application of a SARS-CoV-2 colorimetric biosensor based on the peroxidase-mimic activity of γ-Fe2O3 nanoparticles. Microchim. Acta 2021, 188, 335. [Google Scholar] [CrossRef]
- Seo, G.; Lee, G.; Kim, M.J.; Baek, S.H.; Choi, M.; Ku, K.B.; Lee, C.S.; Jun, S.; Park, D.; Kim, H.G.; et al. Rapid Detection of COVID-19 Causative Virus (SARS-CoV-2) in Human Nasopharyngeal Swab Specimens Using Field-Effect Transistor-Based Biosensor. ACS Nano 2020, 14, 5135–5142. [Google Scholar] [CrossRef] [Green Version]
- Mahari, S.; Roberts, A.; Shahdeo, D.; Gandhi, S. eCovSens-Ultrasensitive Novel In-House Built Printed Circuit Board Based Electrochemical Device for Rapid Detection of nCovid-19 antigen, a spike protein domain 1 of SARS-CoV-2. Biorxiv 2020. [Google Scholar] [CrossRef]
- Qiu, G.; Gai, Z.; Tao, Y.; Schmitt, J.; Kullak-Ublick, G.A.; Wang, J. Dual-Functional Plasmonic Photothermal Biosensors for Highly Accurate Severe Acute Respiratory Syndrome Coronavirus 2 Detection. ACS Nano 2020, 14, 5268–5277. [Google Scholar] [CrossRef]


| Sequence | Pb | |
|---|---|---|
| FIP | TCTGGCCCAGTTCCTAGGTAGTCCAGACGAATTCGTGGTGG | 41 |
| BIP | AGACGGCATCATATGGGTTGCACGGGTGCCAATGTGATCT | 40 |
| F3 | TGGCTACTACCGAAGAGCT | 19 |
| B3 | TGCAGCATTGTTAGCAGGAT | 20 |
| LF | GGACTGAGATCTTTCATTTTACCGT | 25 |
| LB | ACTGAGGGAGCCTTGAATACA | 21 |
| Biosensor Technology | Recognition Element | LOD | SEN | SPE | Concentration Range | Time | Sample | Reference |
|---|---|---|---|---|---|---|---|---|
| SPR (UV–Vis) | Oligo | 1.0 ng·mL−1 | 100% | high | 0.1–50 × 103 ng·mL−1 | 100 min | Cabbage, lettuce and spinach | This work |
| Fluorescence | Aptamer | 1.0 pg·mL−1 | 100% | good | 5.0–1.0 × 10³ pg·mL−1 | 30 min | Cherry, frozen shrimp, salmon, and frozen fish | [34] |
| LSPR (UV–Vis) | NeuNAc | 40 µg.mL−1 | - | - | 9400–6 × 10⁵ ng·mL−1 | - | Nasal swabs | [35] |
| Colorimetric or UV–Vis | Antibody | 48 pg·mL−1 | - | high | 250–1000 ng·mL−1 | 10 min | Saliva | [36] |
| SPR–colorimetric | ASOS | 180 ng·mL−1 | - | - | 200–3 × 10³ ng·mL−1 | 10 min | Patient samples | [37] |
| LSPR (UV–Vis) | Antigen | 150 ng·mL−1 | * | 150–650 ng·mL−1 | 10 min | Clinical | [38] | |
| Colorimetric | Antibory | 1.0 ng·mL−1 | - | high | 0.1–100 ng·mL−1 | 30 min | Throat and nose swabs | [39] |
| Colorimetric | ACE2 | 154 ng·mL−1 | 96 | 98 | 10−3–103 ng·mL−1 | 3 min | Nasal | [40] |
| FET | Antibody | 160 PFU mL−1 | - | - | - | >1 min | Clinical | [41] |
| Electrochemical | Antibody | 0.09 pM | high | 1 fM–1 µM | 30 s | - | [42] | |
| PPT+LSPR | cDNA | 0.22 pM | - | - | 1 pM–1 nM | - | - | [43] |
Publisher’s Note: MDPI stays neutral with regard to jurisdictional claims in published maps and institutional affiliations. |
© 2022 by the authors. Licensee MDPI, Basel, Switzerland. This article is an open access article distributed under the terms and conditions of the Creative Commons Attribution (CC BY) license (https://creativecommons.org/licenses/by/4.0/).
Share and Cite
Tessaro, L.; Aquino, A.; Panzenhagen, P.; Ochioni, A.C.; Mutz, Y.S.; Raymundo-Pereira, P.A.; Vieira, I.R.S.; Belem, N.K.R.; Conte-Junior, C.A. Development and Application of an SPR Nanobiosensor Based on AuNPs for the Detection of SARS-CoV-2 on Food Surfaces. Biosensors 2022, 12, 1101. https://doi.org/10.3390/bios12121101
Tessaro L, Aquino A, Panzenhagen P, Ochioni AC, Mutz YS, Raymundo-Pereira PA, Vieira IRS, Belem NKR, Conte-Junior CA. Development and Application of an SPR Nanobiosensor Based on AuNPs for the Detection of SARS-CoV-2 on Food Surfaces. Biosensors. 2022; 12(12):1101. https://doi.org/10.3390/bios12121101
Chicago/Turabian StyleTessaro, Leticia, Adriano Aquino, Pedro Panzenhagen, Alan Clavelland Ochioni, Yhan S. Mutz, Paulo A. Raymundo-Pereira, Italo Rennan Sousa Vieira, Natasha Kilsy Rocha Belem, and Carlos Adam Conte-Junior. 2022. "Development and Application of an SPR Nanobiosensor Based on AuNPs for the Detection of SARS-CoV-2 on Food Surfaces" Biosensors 12, no. 12: 1101. https://doi.org/10.3390/bios12121101