Prediction of Individual Dynamic Thermal Sensation in Subway Commute Using Smart Face Mask


Abstract
:1. Introduction
2. Materials and Methods
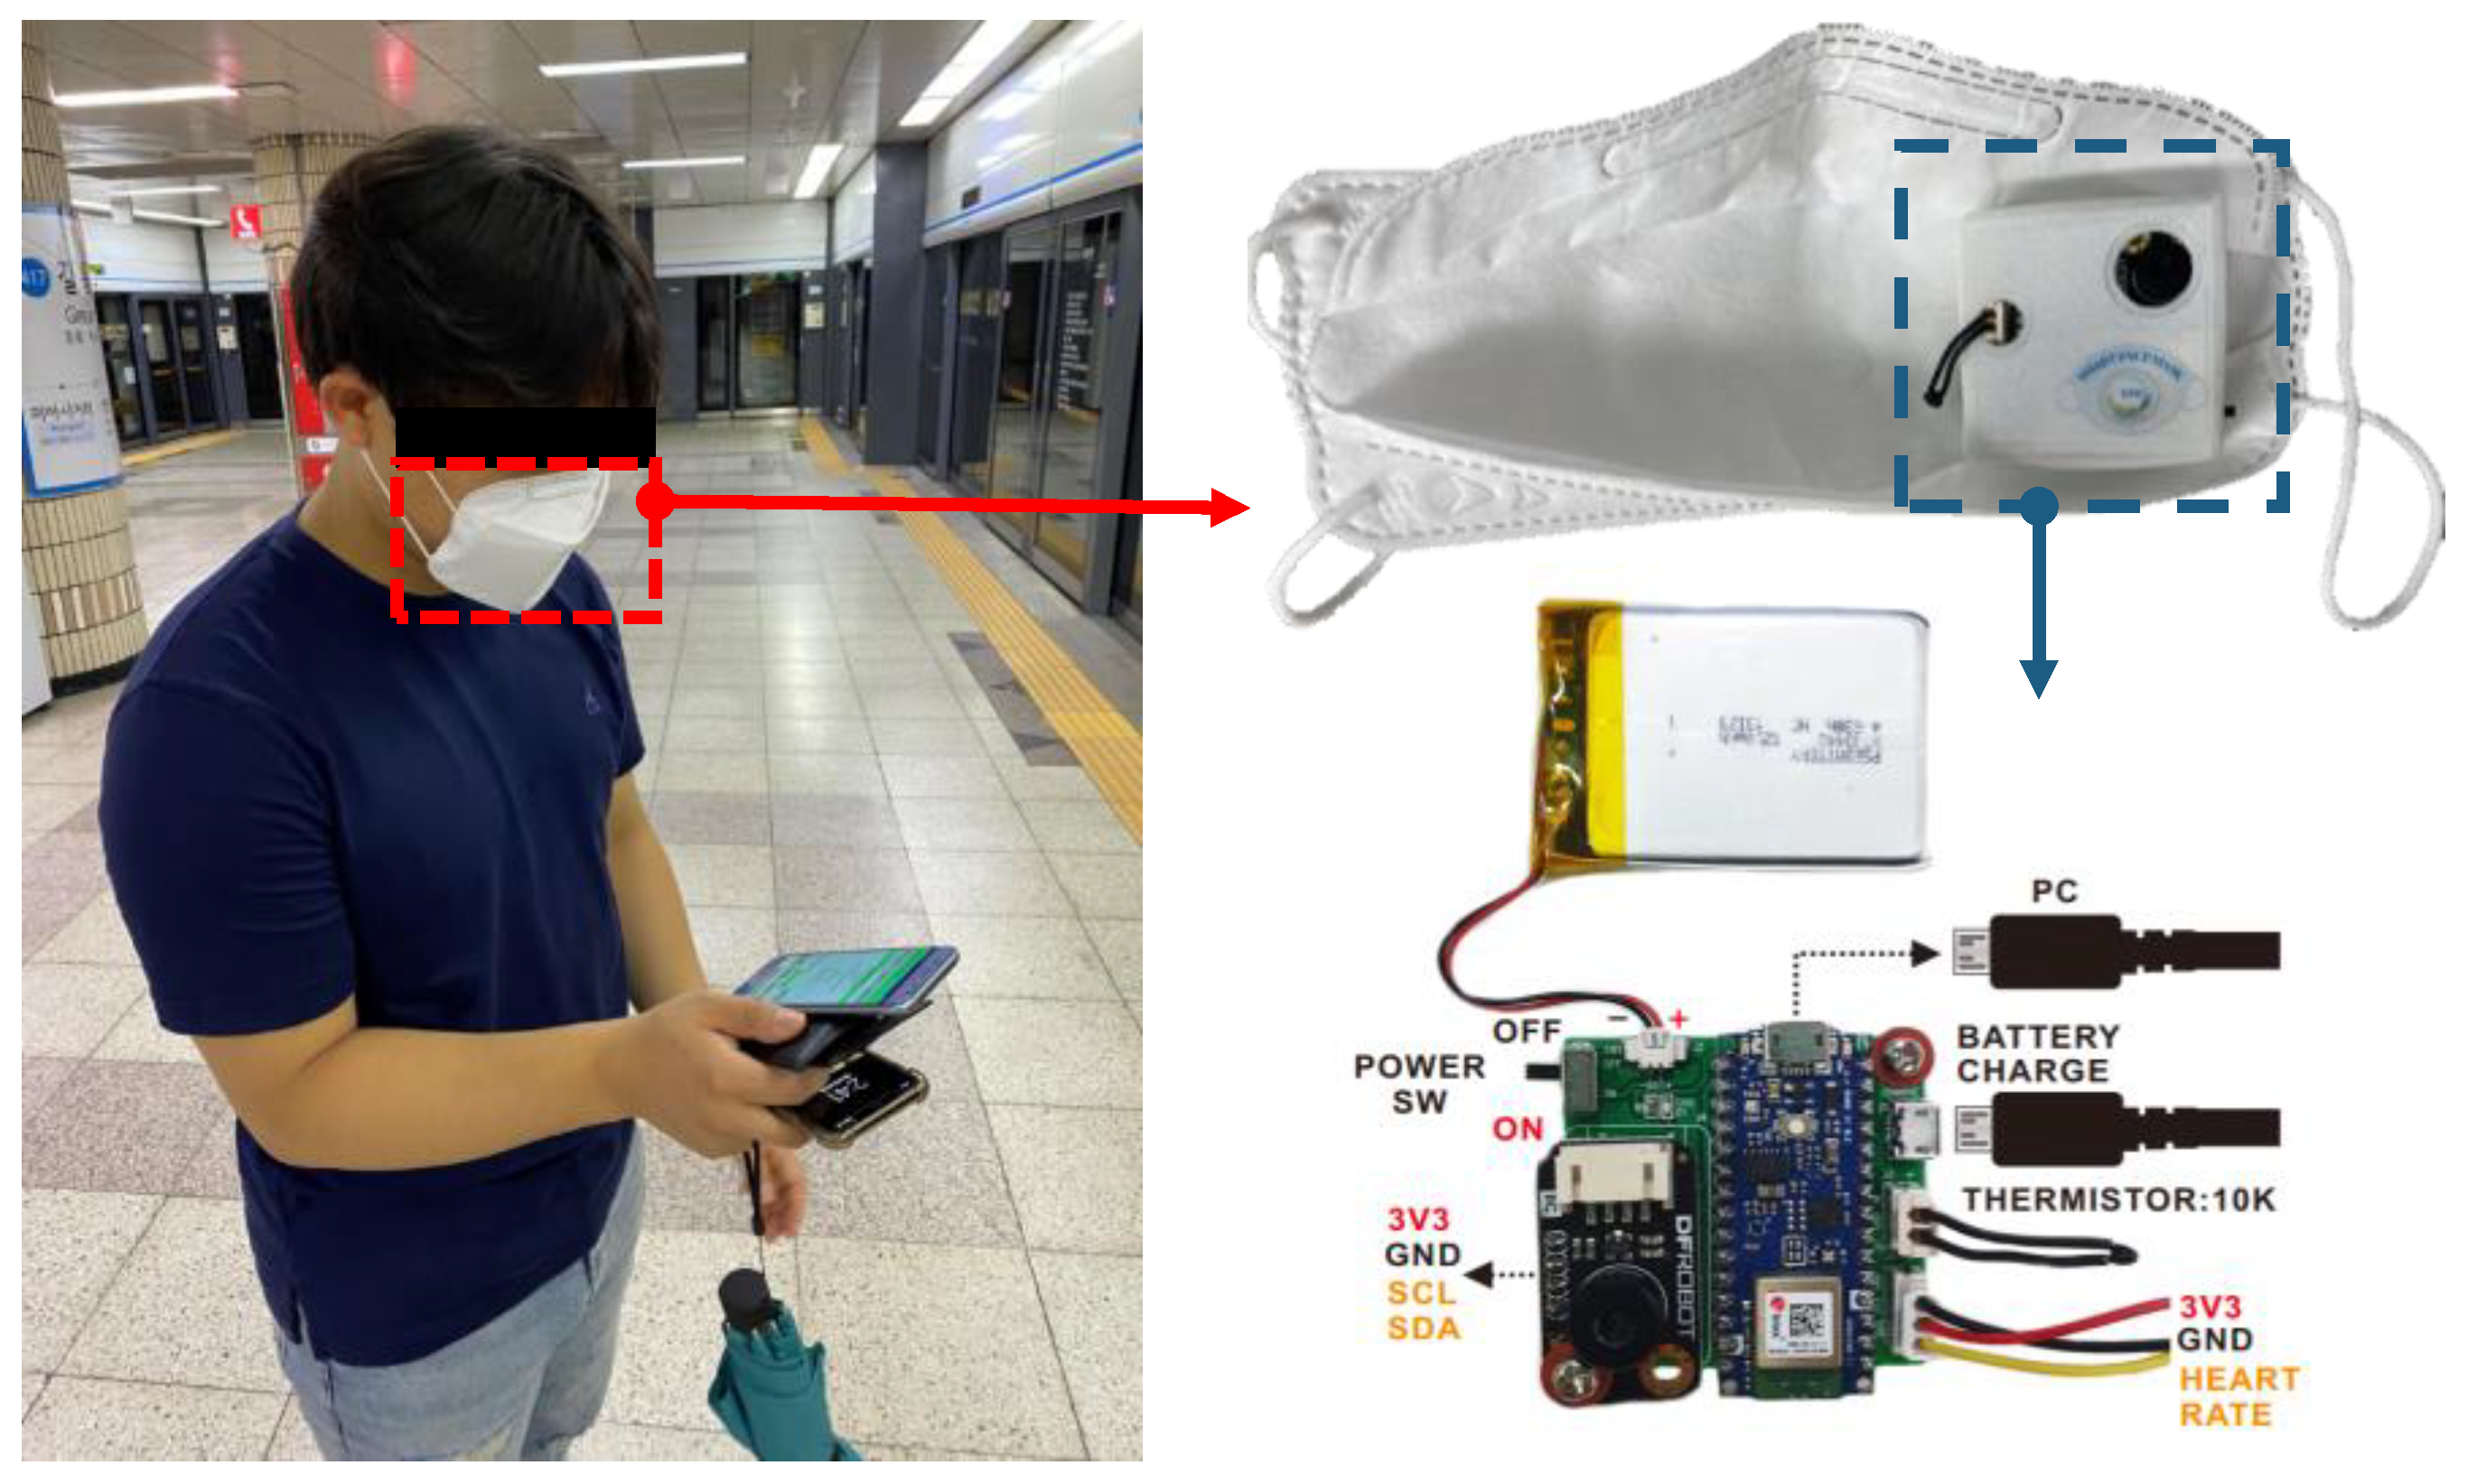
2.1. Smart Face Mask
2.1.1. Sensors
- It should be as non-invasive as possible.
- Analog data should be easily accessible.
- It should be as comfortable as possible for use in daily life and should be portable.
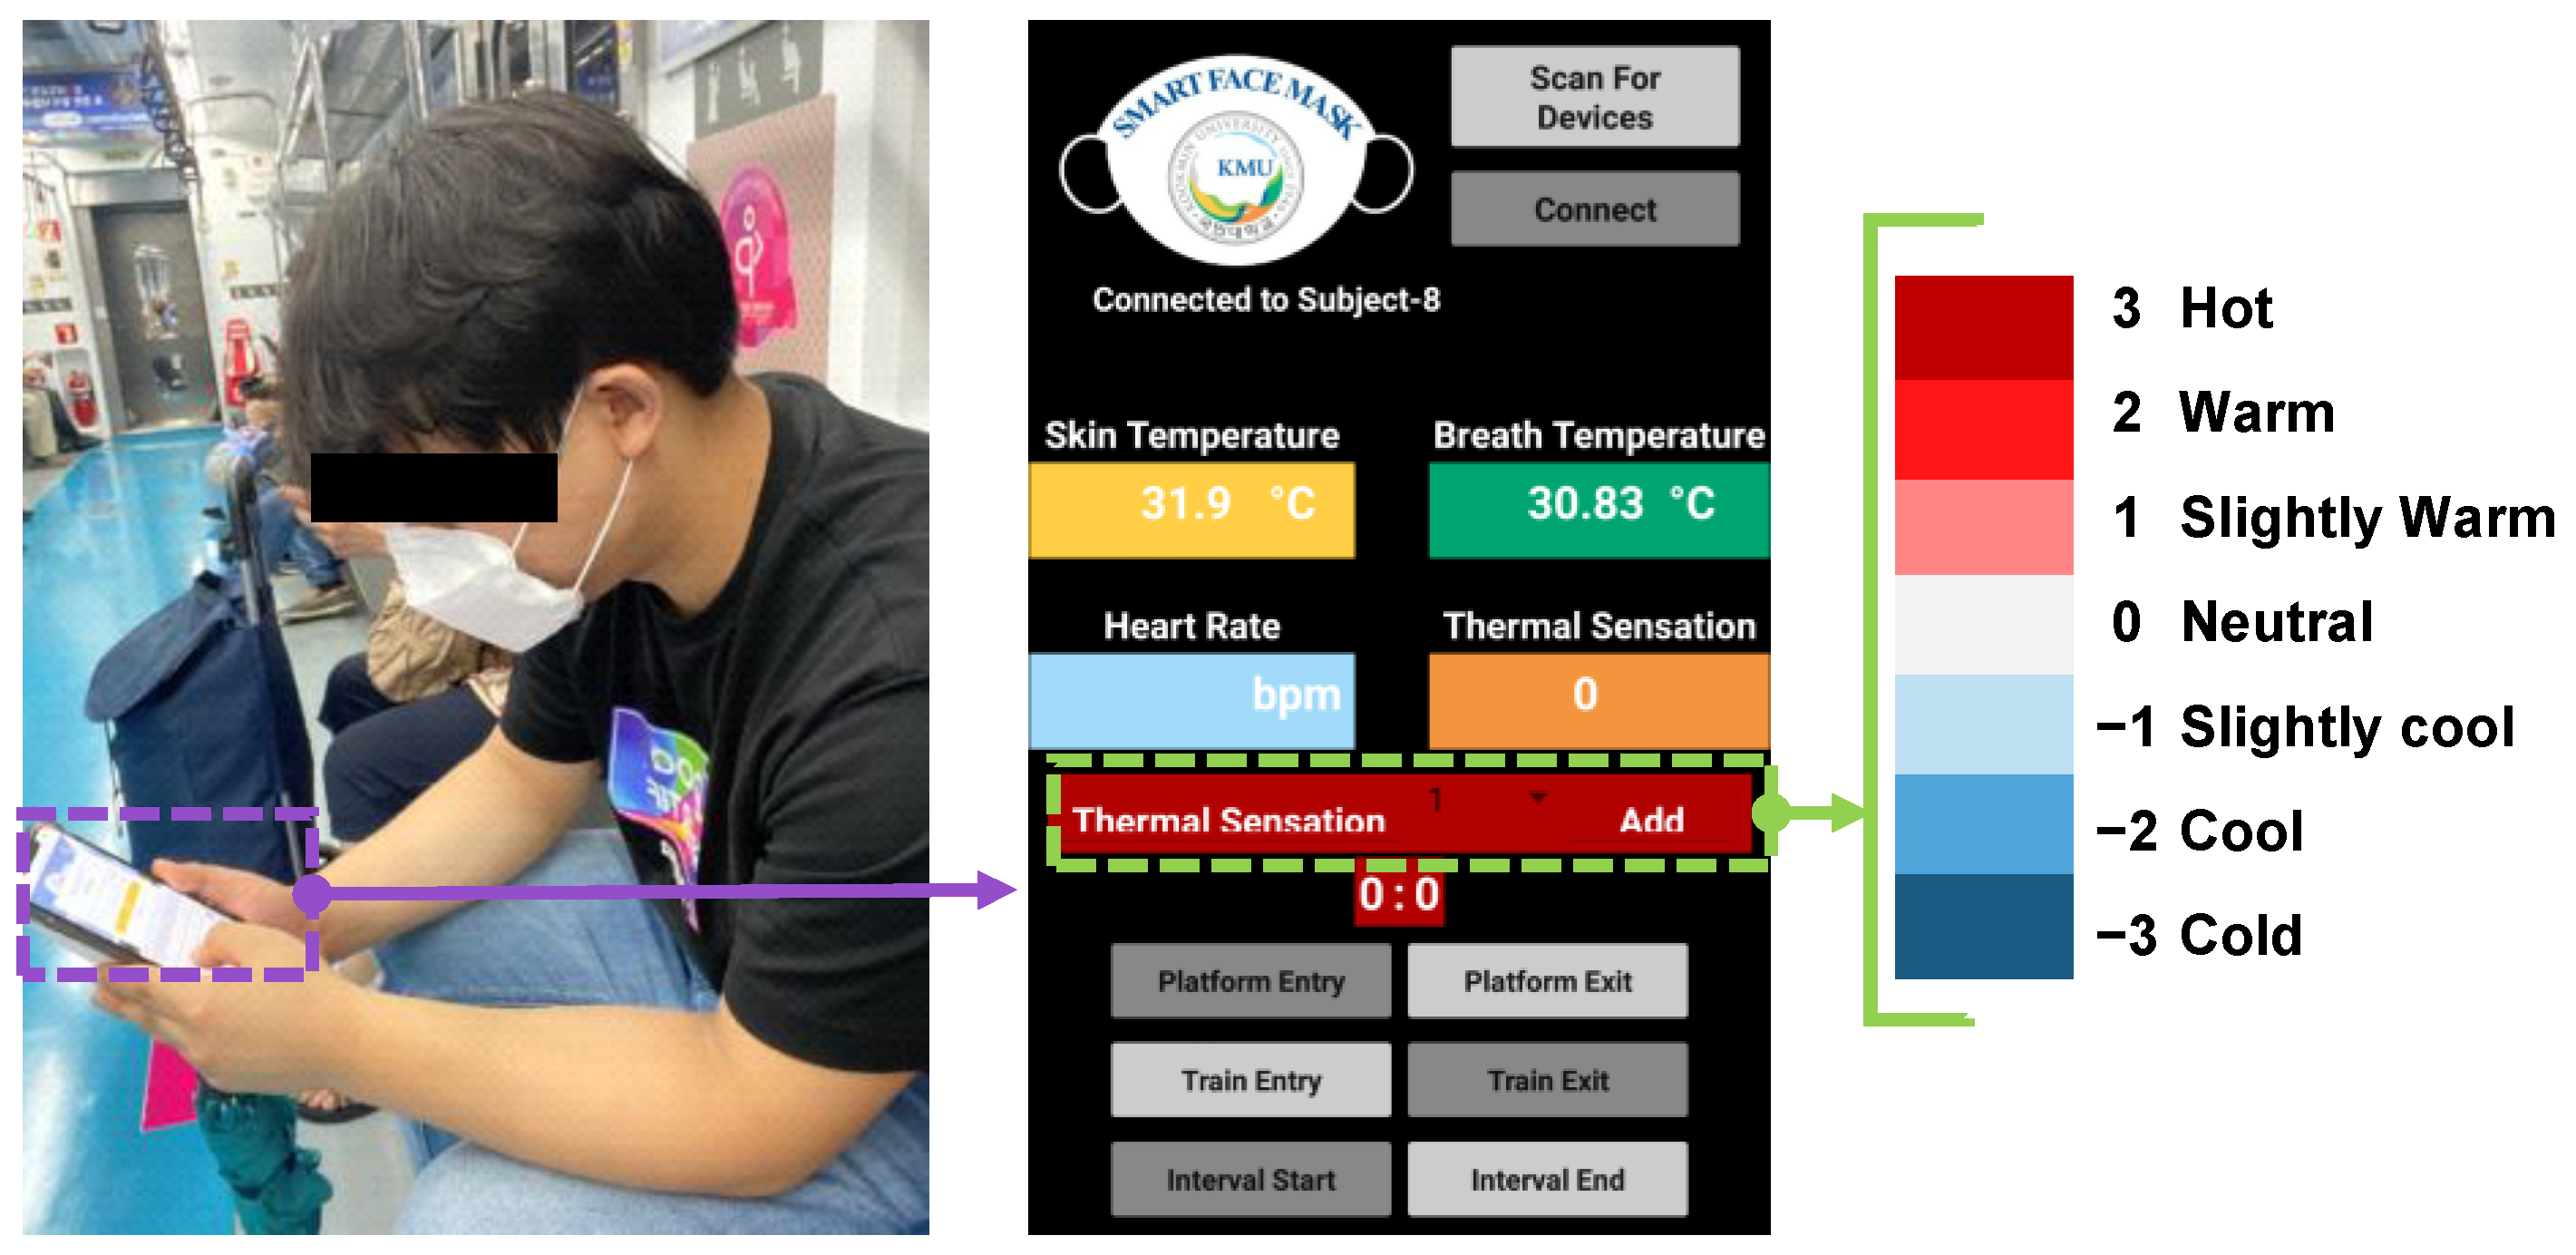
2.1.2. Mobile Application Development
2.2. Participants Selection
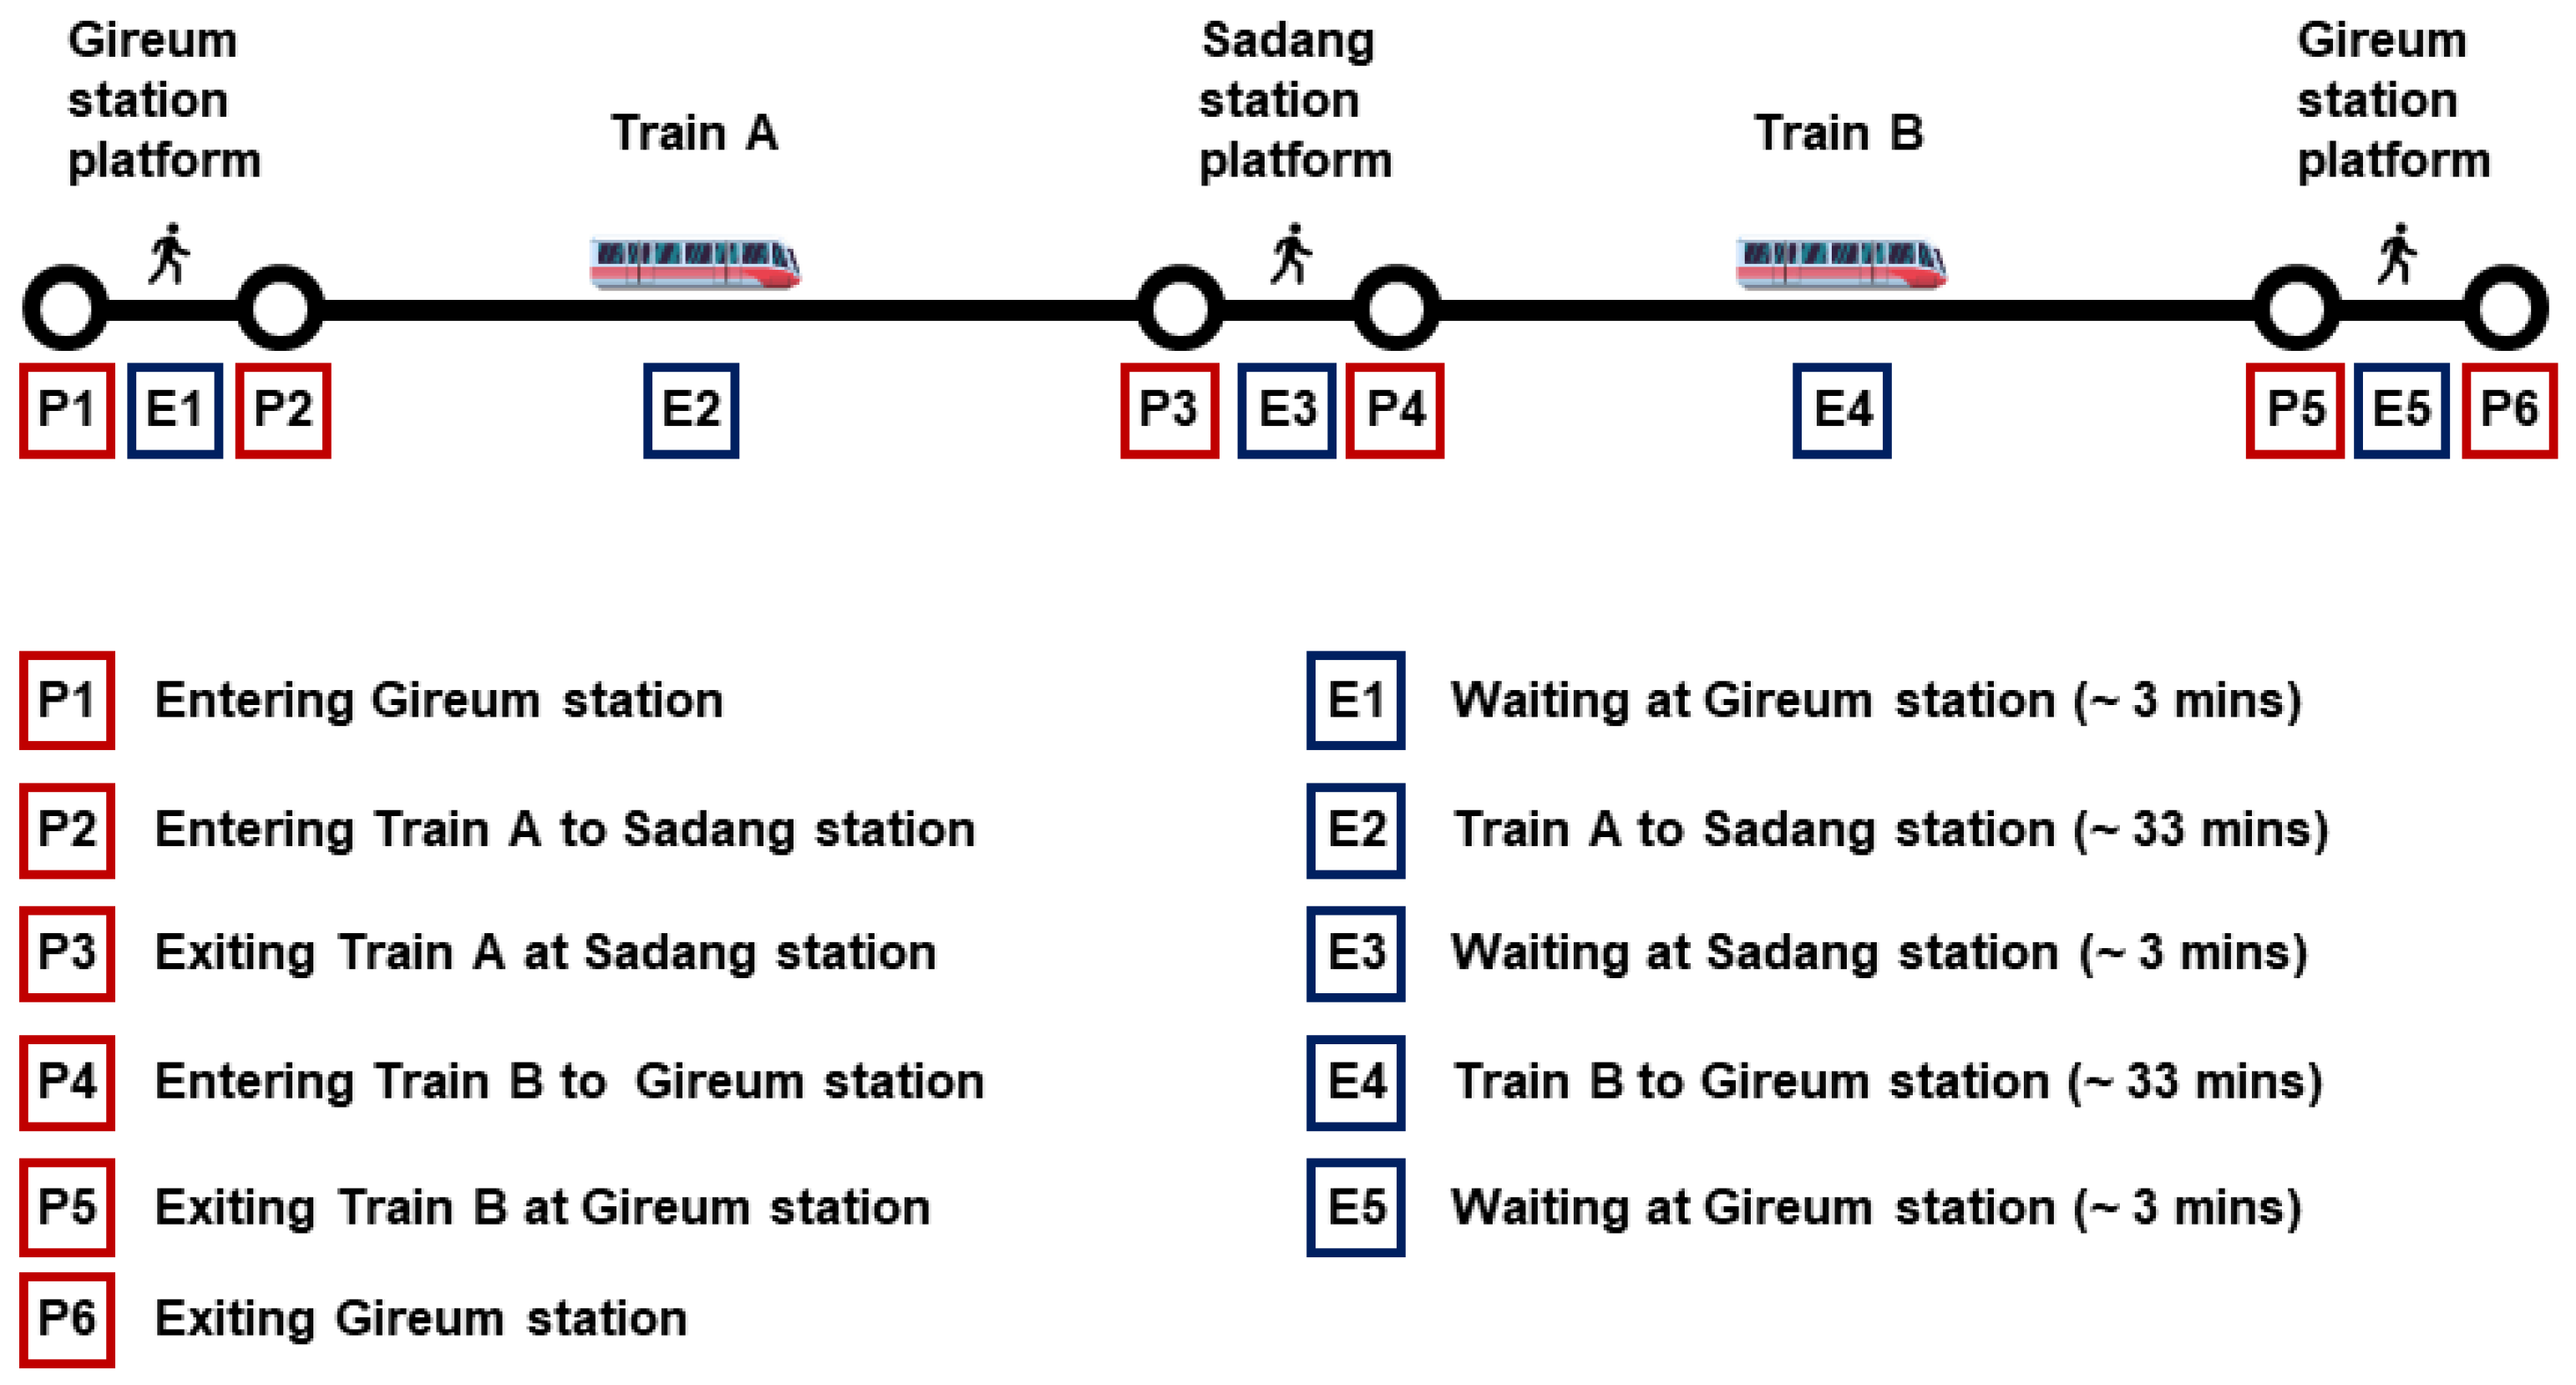
2.3. Experimental Procedure
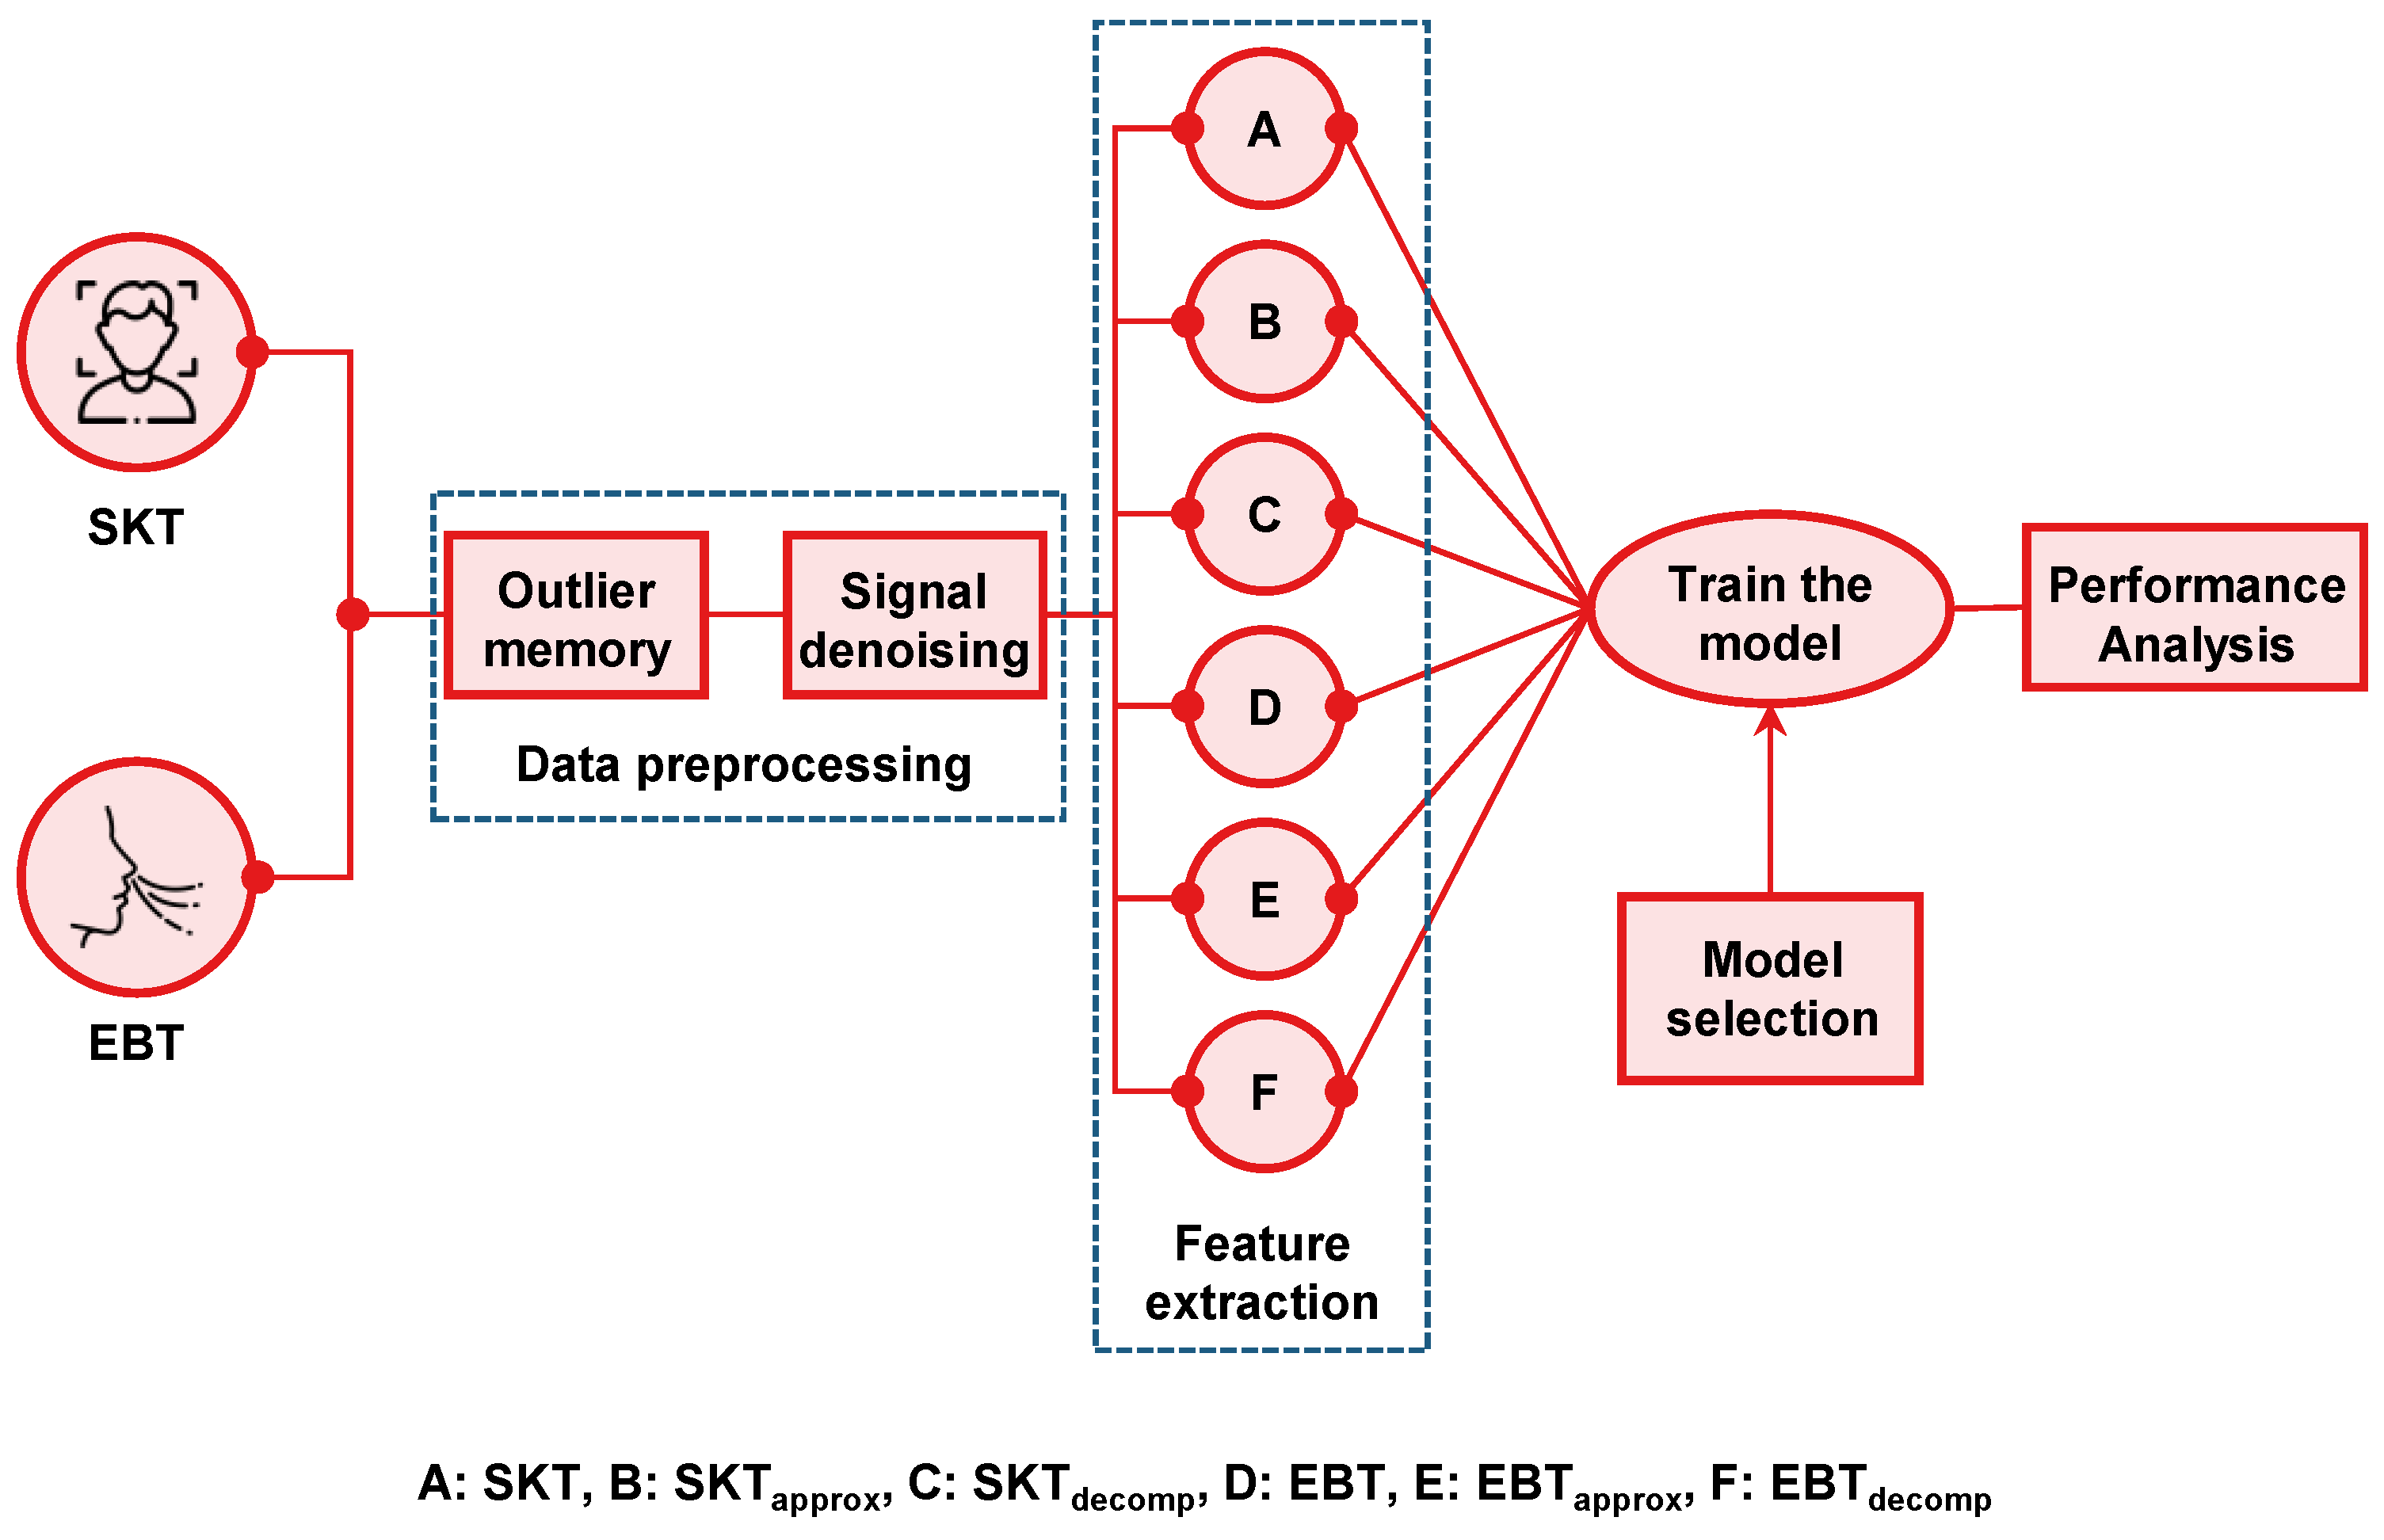
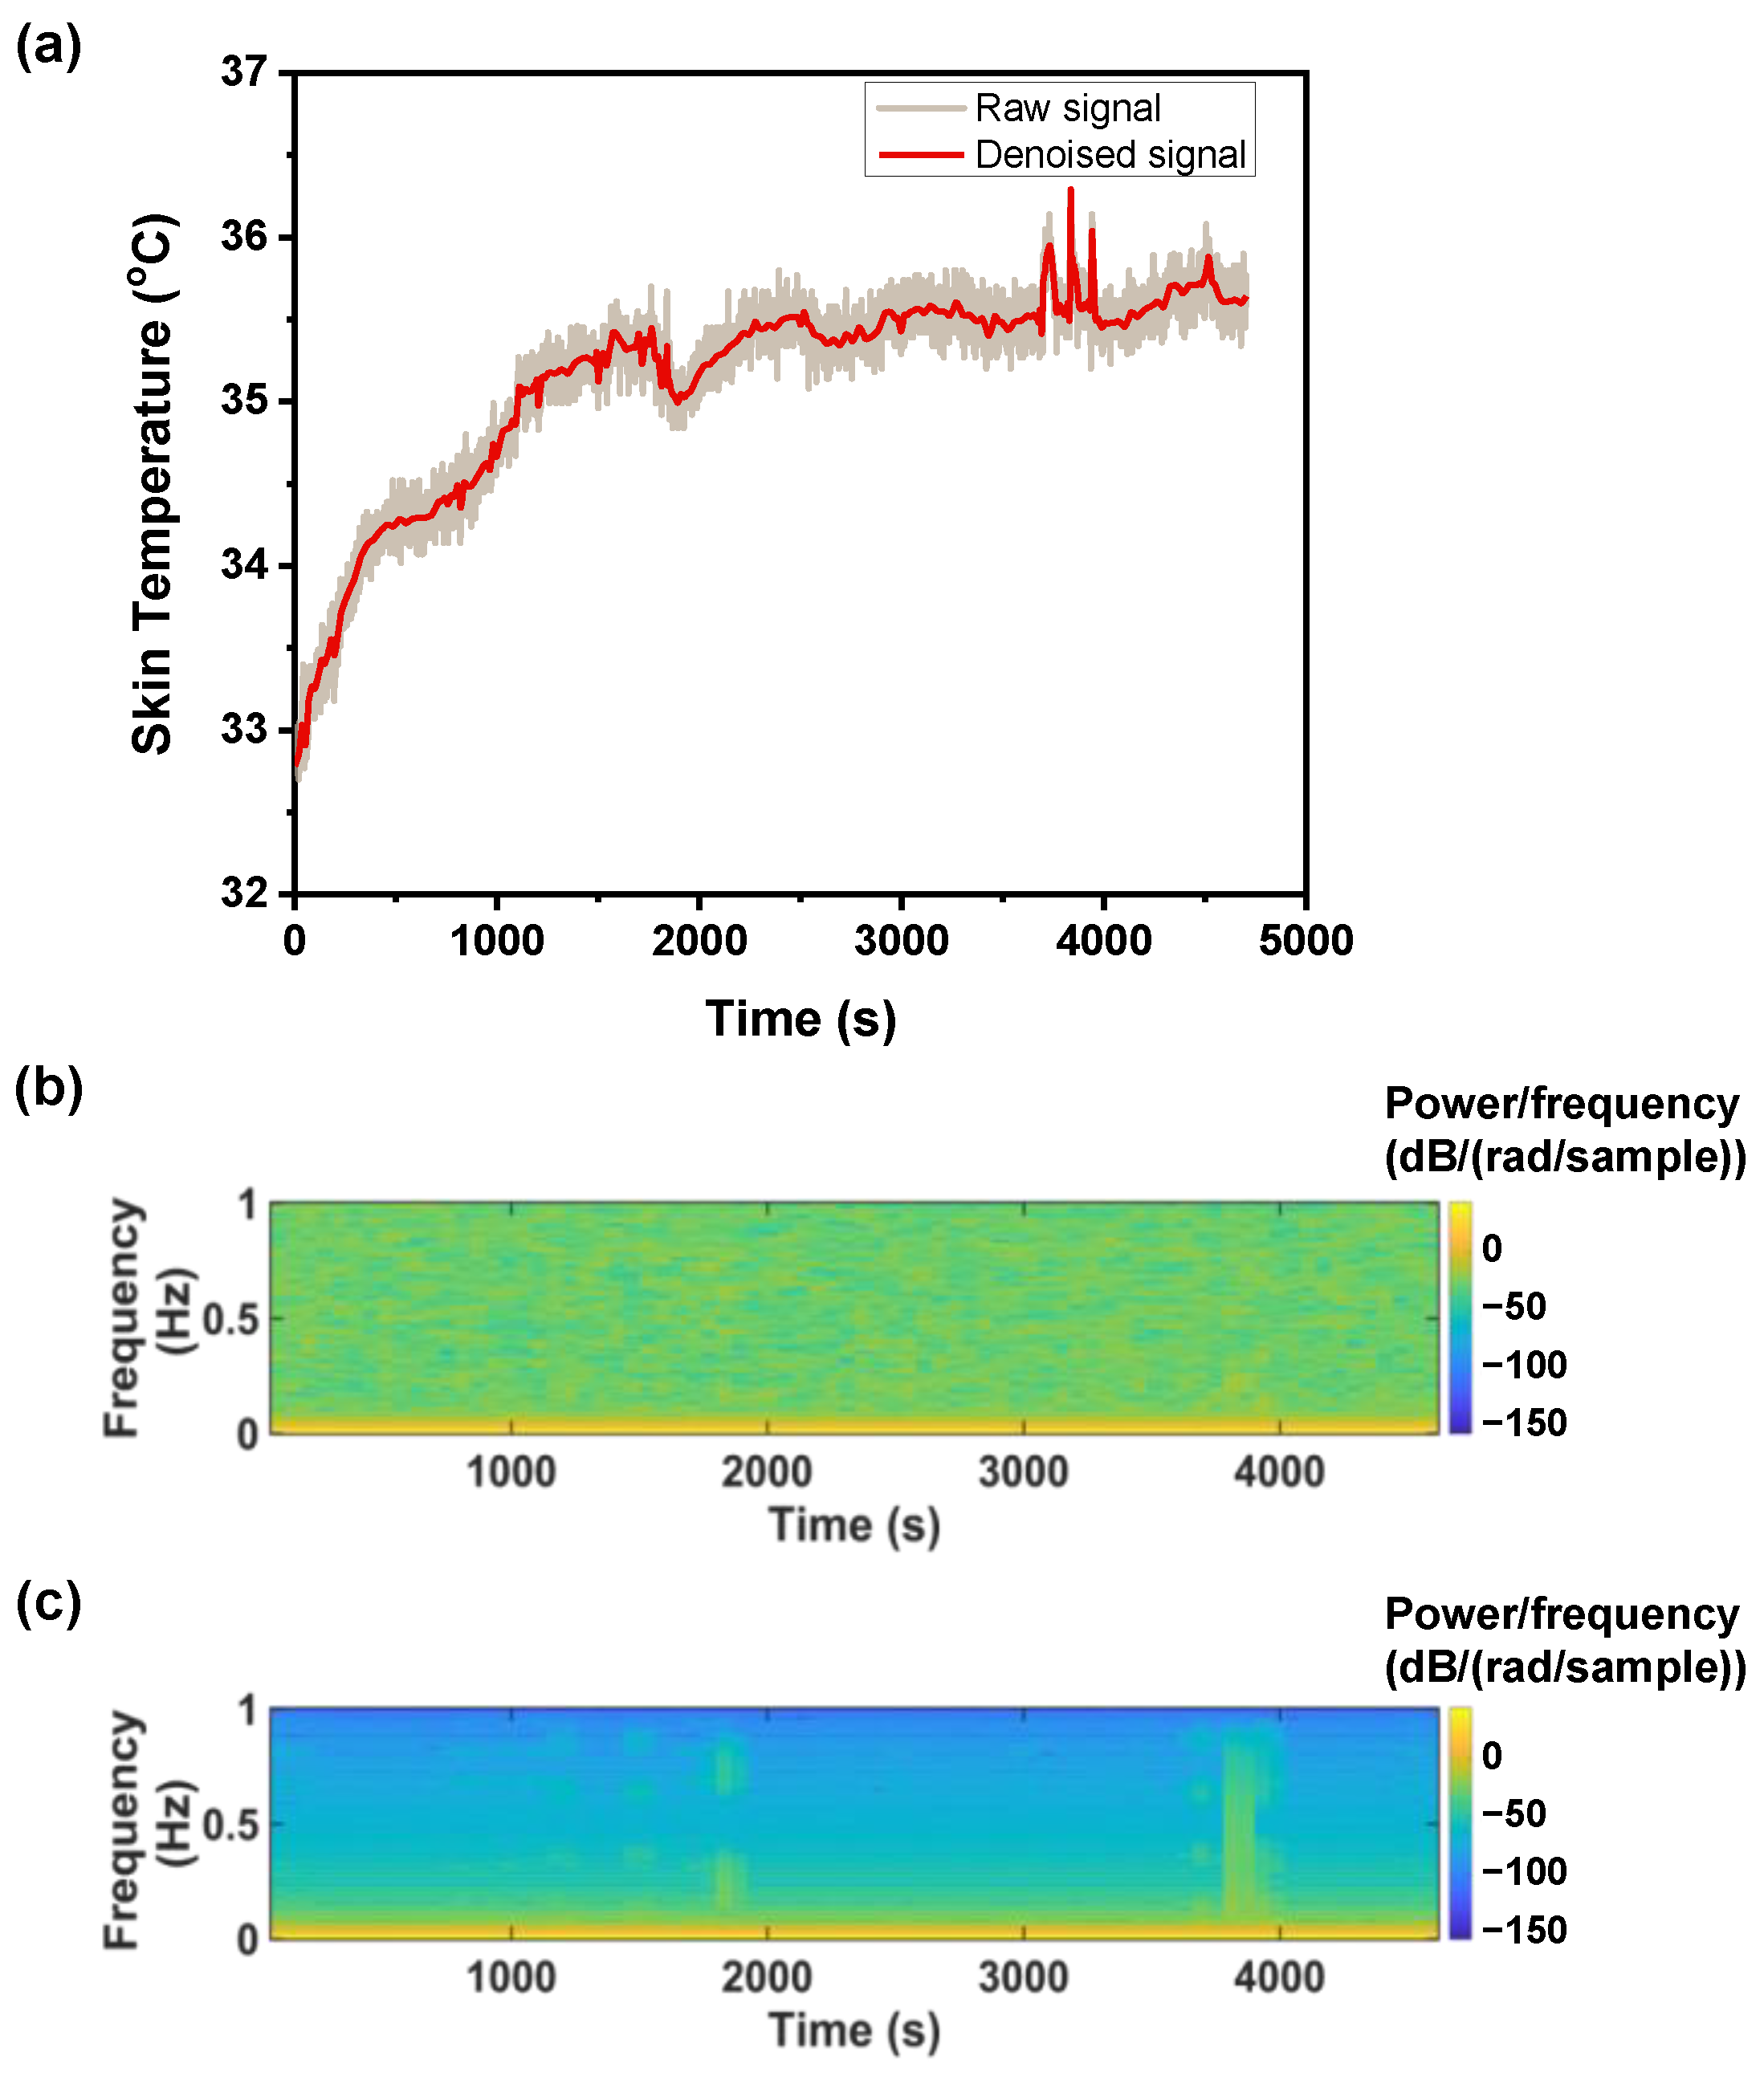
2.4. Data Collection and Analysis
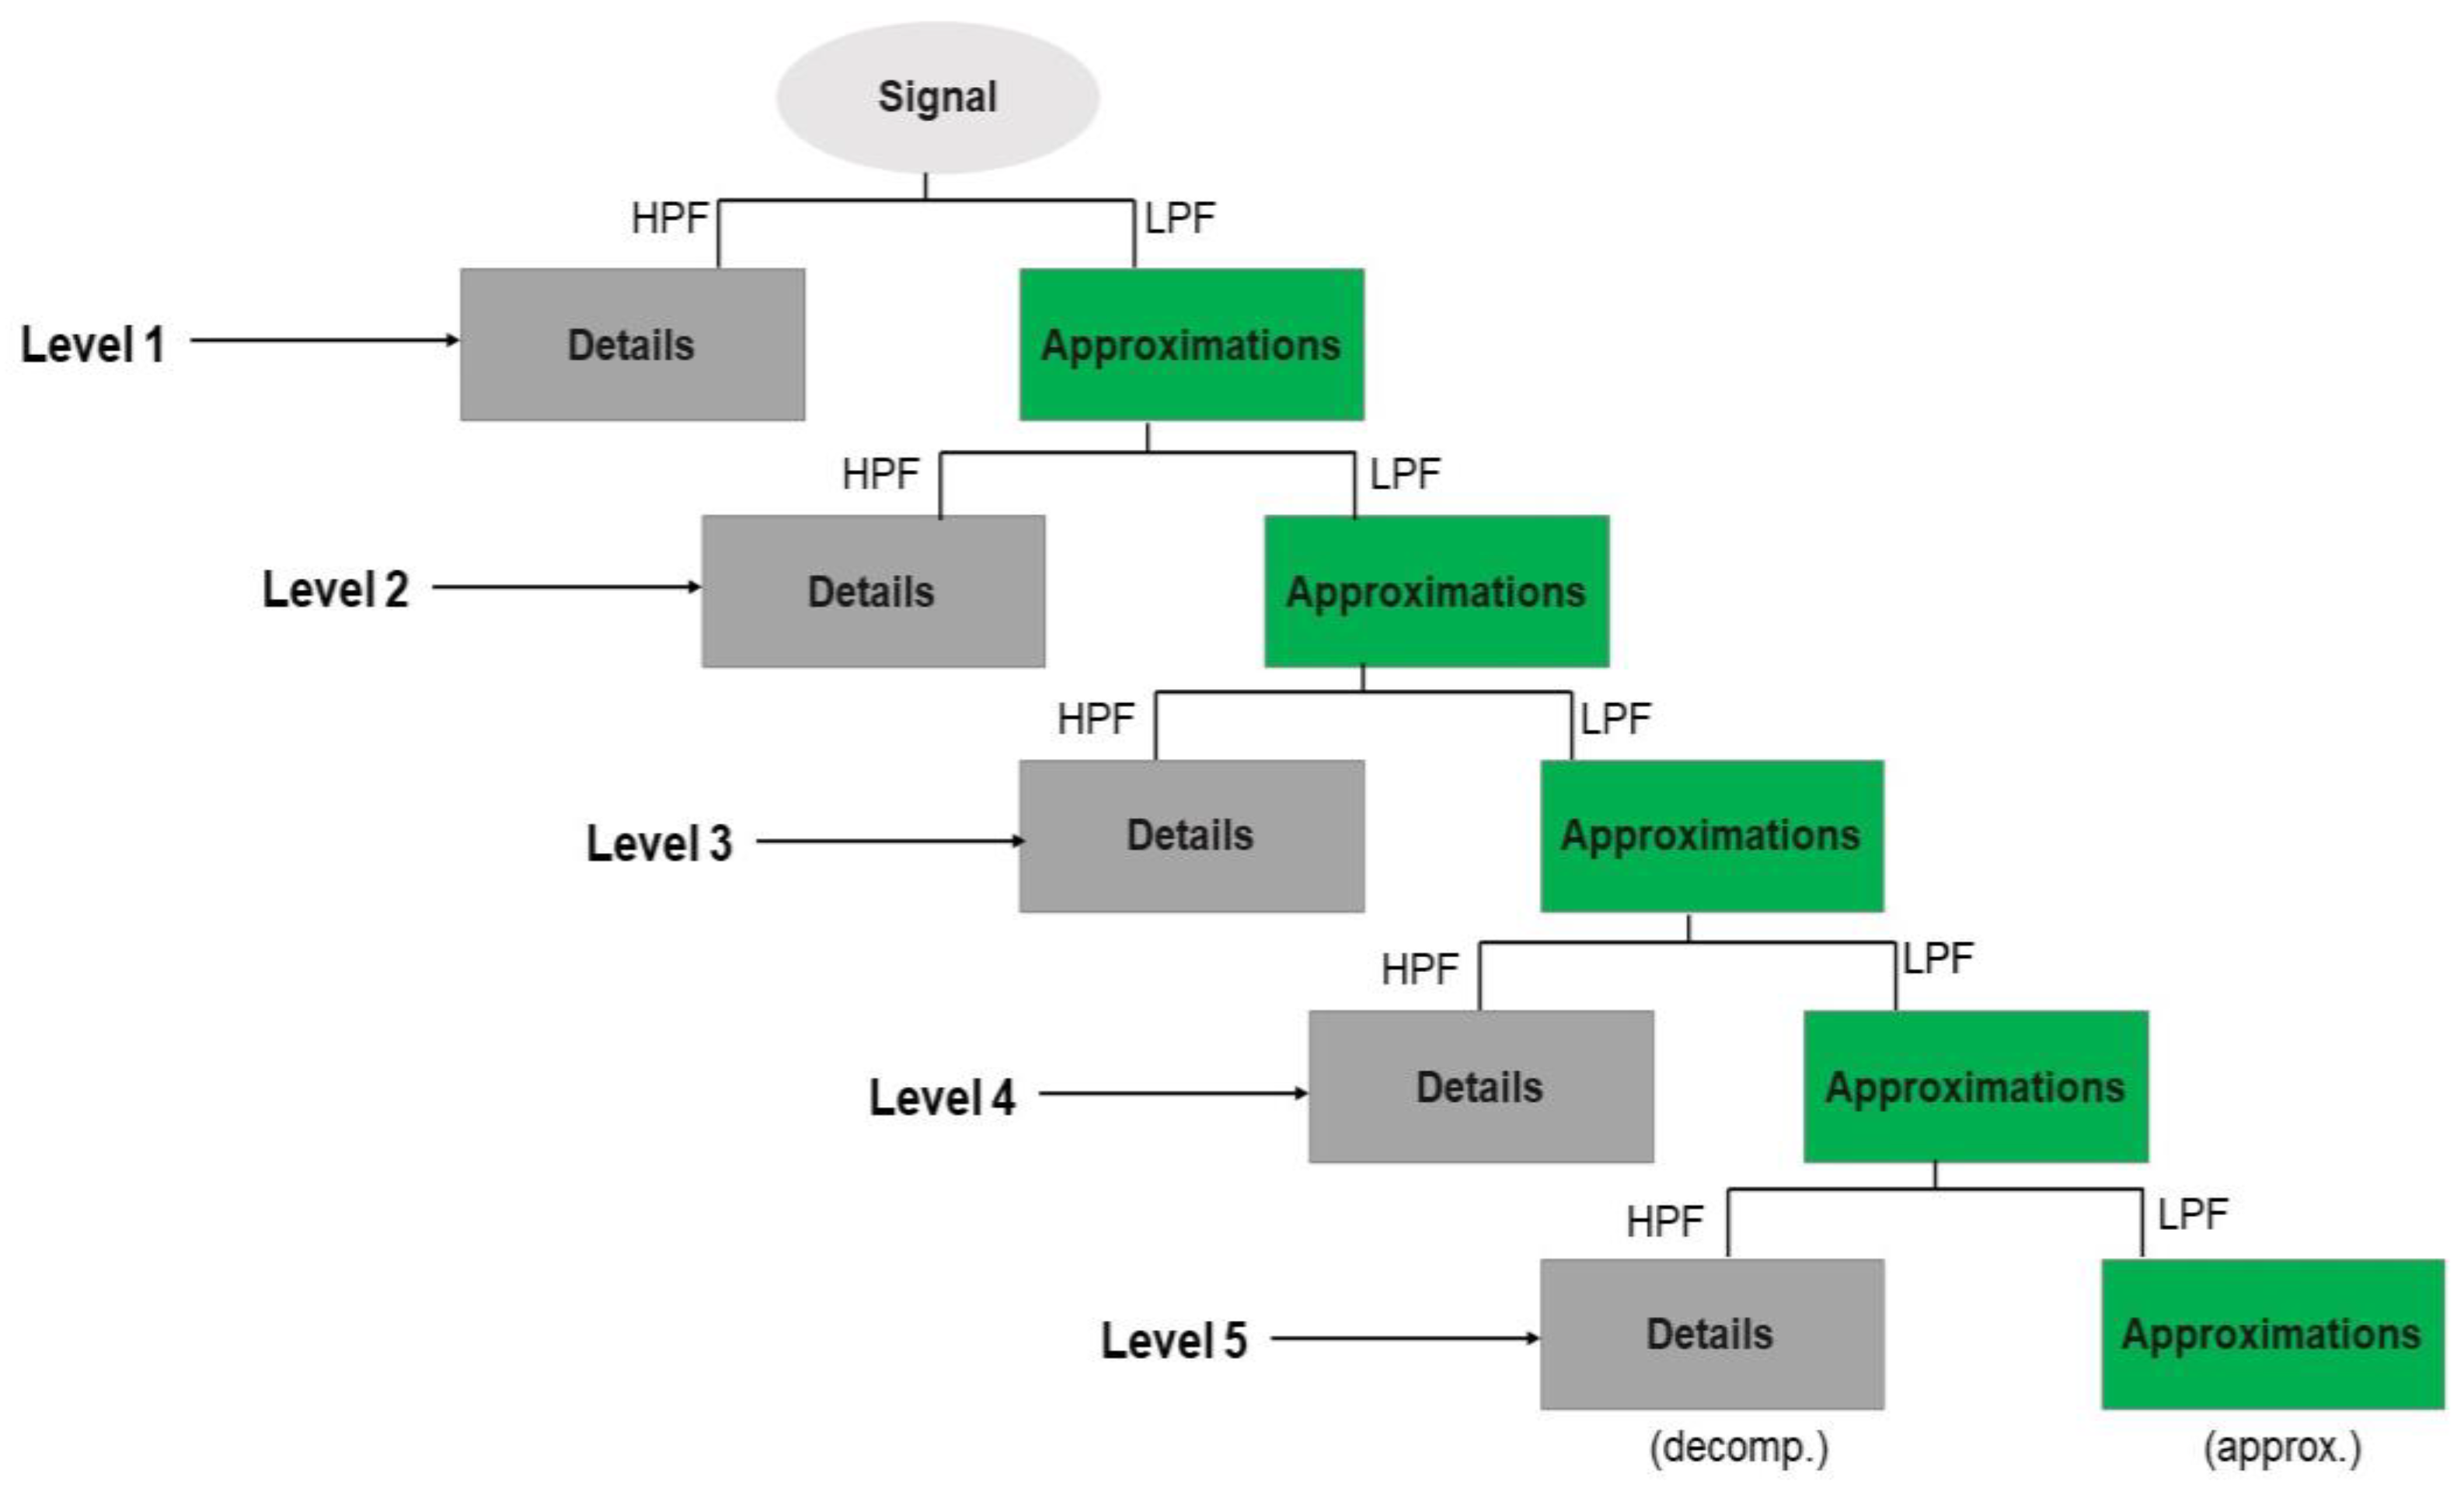
| Algorithm 1: Pseudo-code for wavelet-based feature creation |
| Algorithm To Construct Features Vector |
| Input: recorded SKT, EBT, and TSVs Output: table with two more features for each signal, and TSVs Begin: read data table; FOR each SKT: IF (SKT is outlier OR null): remove the row; END IF; END FOR; FOR each EBT: IF (EBT is outlier OR null): remove the row; END IF; END FOR; denoise SKT and EBT using MATLAB function; decompose SKT and EBT using wavelet decomposition function; reconstruct SKT approximation and details; reconstruct EBT approximation and details; make table with SKT, EBT, associated approximation and details, and TSV; END; |
3. Results and Discussion
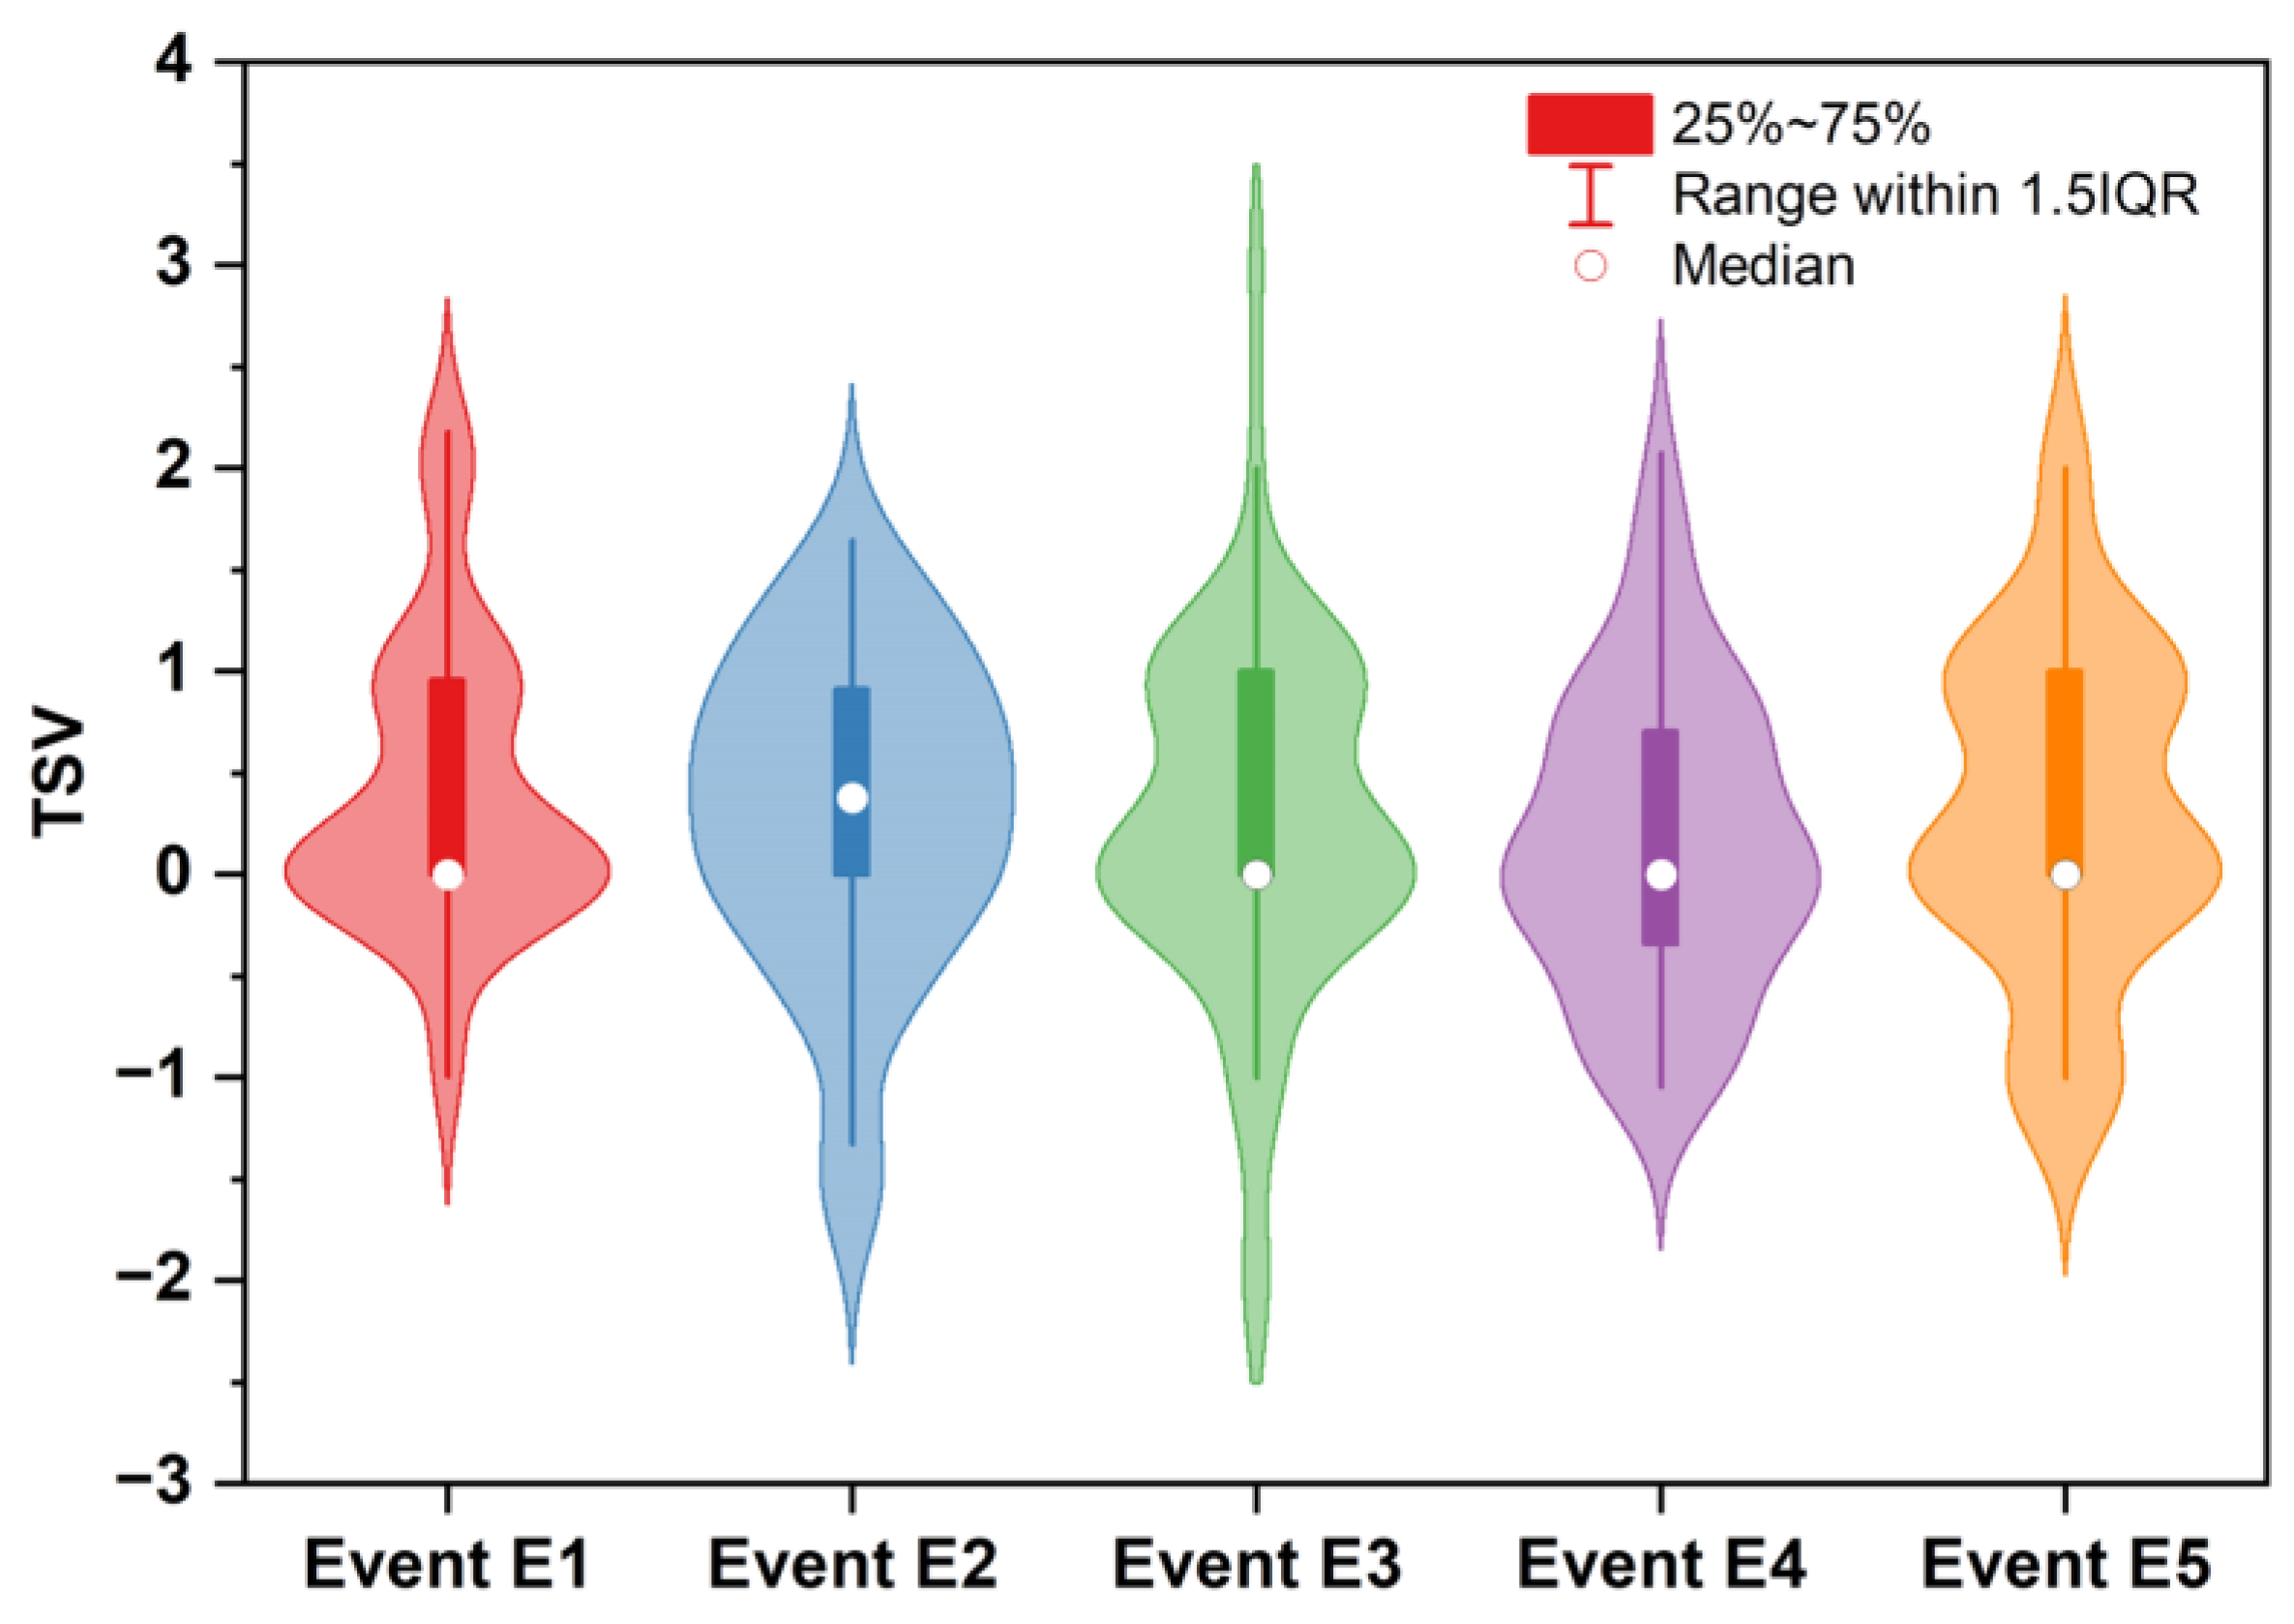
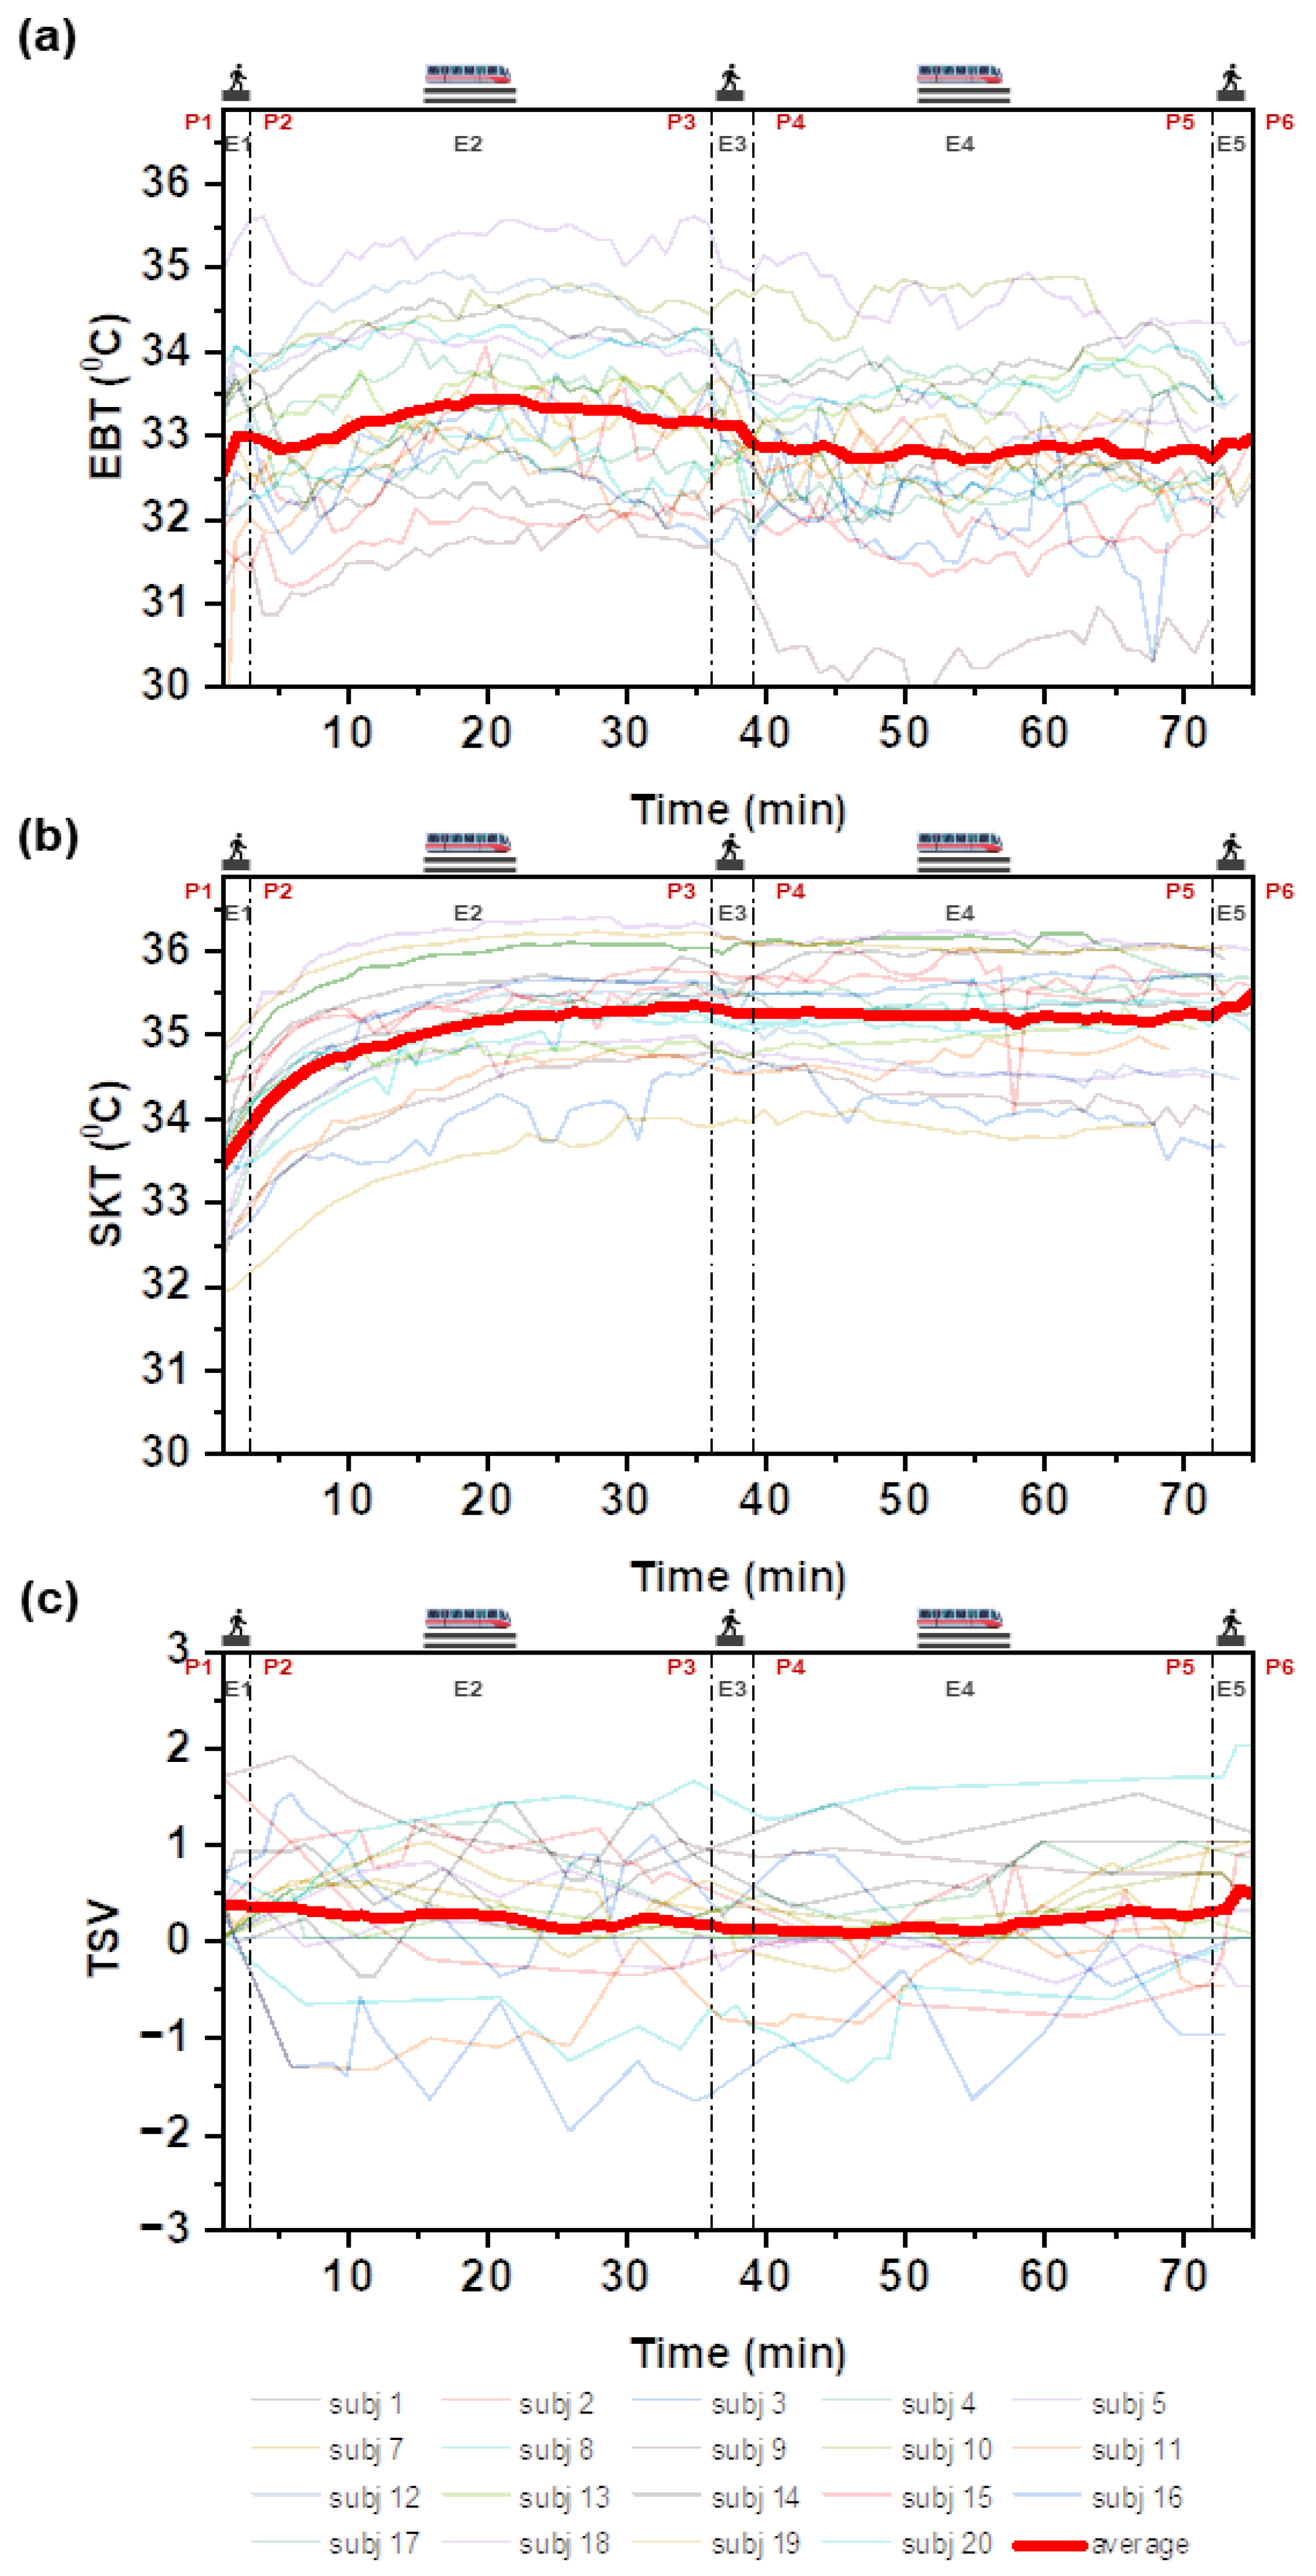
3.1. Analysis of Physiological and Psychological Datasets during Subway Commute
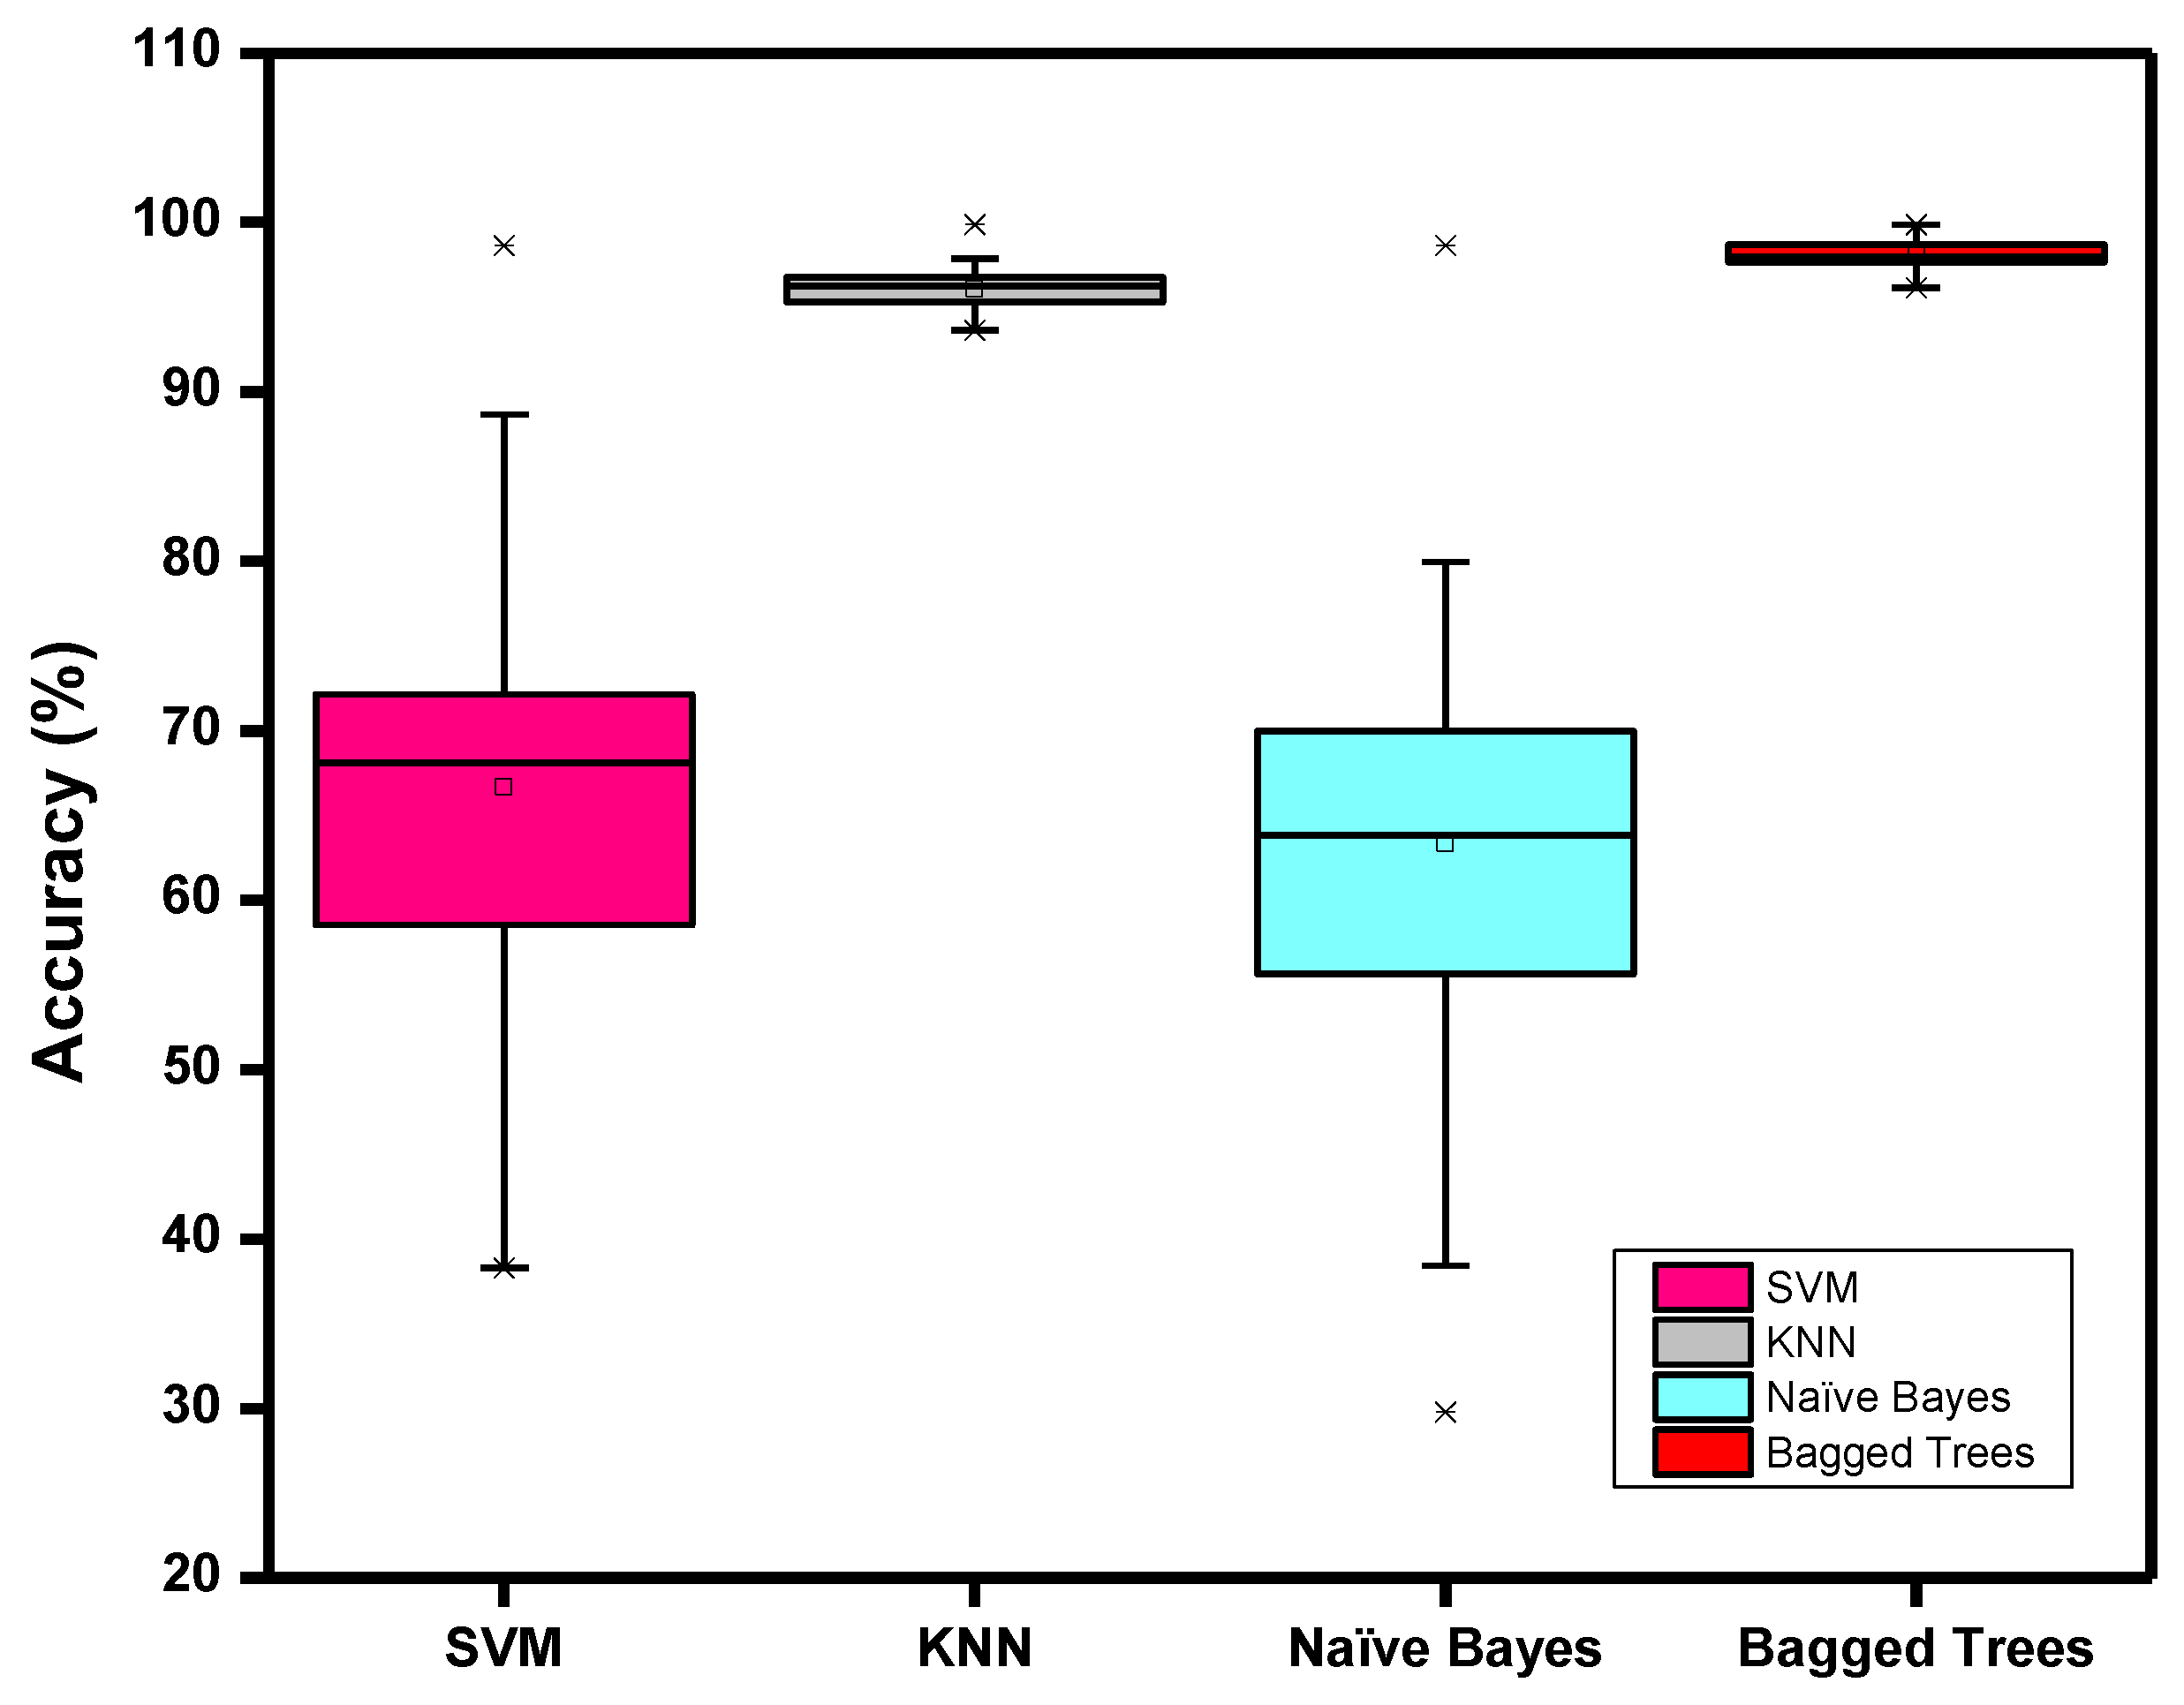
3.2. Personalized Thermal Comfort Model
4. Conclusions
Supplementary Materials
Author Contributions
Funding
Institutional Review Board Statement
Informed Consent Statement
Data Availability Statement
Conflicts of Interest
Appendix A


| Station | Morning | Evening | During Experiment | |
|---|---|---|---|---|
| Gireum | Entering | 2269 | 678 | 763 |
| Exiting | 575 | 2050 | 1094 | |
| Sadang | Entering | 2133 | 1081 | 914 |
| Exiting | 831 | 1742 | 1046 | |
References
- Huang, K.; Lu, S.; Li, X.; Chen, W. Using random forests to predict passengers’ thermal comfort in underground train carriages. Indoor Built Environ. 2022. Online ahead of print. [Google Scholar] [CrossRef]
- Pan, S.; Liu, Y.; Xie, L.; Wang, X.; Yuan, Y.; Jia, X. A thermal comfort field study on subway passengers during air-conditioning season in Beijing. Sustain. Cities Soc. 2020, 61, 102218. [Google Scholar] [CrossRef]
- Wu, L.; Xia, H.; Wang, X.; Dong, Q.; Lin, C.; Liu, X.; Liang, R. Indoor air quality and passenger thermal comfort in Beijing metro transfer stations. Transp. Res. D Transp. Environ. 2020, 78, 102217. [Google Scholar] [CrossRef]
- Li, Y.; Geng, S.; Chen, F.; Li, C.; Zhang, X.; Dong, X. Evaluation of thermal sensation among customers: Results from field investigations in underground malls during summer in Nanjing, China. Build. Environ. 2018, 136, 28–37. [Google Scholar] [CrossRef]
- Wu, P.; Zhang, Y.; Fang, Z.; Gao, Y. Comparison of thermal comfort in different kinds of building spaces: Field study in Guangzhou, China. Indoor Built Environ. 2021, 31, 186–202. [Google Scholar] [CrossRef]
- Fang, Z.; Feng, X.; Xu, X.; Zhou, X.; Lin, Z.; Ji, Y. Investigation into outdoor thermal comfort conditions by different seasonal field surveys in China, Guangzhou. Int. J. Biometeorol. 2019, 63, 1357–1368. [Google Scholar] [CrossRef]
- Lai, D.; Liu, W.; Gan, T.; Liu, K.; Chen, Q. A review of mitigating strategies to improve the thermal environment and thermal comfort in urban outdoor spaces. Sci. Total. Environ. 2019, 661, 337–353. [Google Scholar] [CrossRef] [PubMed]
- Huang, Z.; Gou, Z.; Cheng, B. An investigation of outdoor thermal environments with different ground surfaces in the hot summer-cold winter climate region. J. Build. Eng. 2020, 27, 100994. [Google Scholar] [CrossRef]
- Yang, J.; Shi, B.; Xia, G.; Xue, Q.; Cao, S.-J. Impacts of Urban Form on Thermal Environment Near the Surface Region at Pedestrian Height: A Case Study Based on High-Density Built-Up Areas of Nanjing City in China. Sustainability 2020, 12, 1737. [Google Scholar] [CrossRef] [Green Version]
- Li, B.; Yu, W.; Liu, M.; Li, N. Climatic Strategies of Indoor Thermal Environment for Residential Buildings in Yangtze River Region, China. Indoor Built Environ. 2011, 20, 101–111. [Google Scholar] [CrossRef]
- Djamila, H.; Chu, C.-M.; Kumaresan, S. Field study of thermal comfort in residential buildings in the equatorial hot-humid climate of Malaysia. Build. Environ. 2013, 62, 133–142. [Google Scholar] [CrossRef]
- Manu, S.; Shukla, Y.; Rawal, R.; Thomas, L.E.; de Dear, R. Field studies of thermal comfort across multiple climate zones for the subcontinent: India Model for Adaptive Comfort (IMAC). Build. Environ. 2016, 98, 55–70. [Google Scholar] [CrossRef] [Green Version]
- Indraganti, M.; Ooka, R.; Rijal, H.B.; Brager, G.S. Adaptive model of thermal comfort for offices in hot and humid climates of India. Build. Environ. 2014, 74, 39–53. [Google Scholar] [CrossRef]
- Han, J.; Yang, W.; Zhou, J.; Zhang, G.; Zhang, Q.; Moschandreas, D.J. A comparative analysis of urban and rural residential thermal comfort under natural ventilation environment. Energy Build. 2009, 41, 139–145. [Google Scholar] [CrossRef]
- Soebarto, V.; Bennetts, H. Thermal comfort and occupant responses during summer in a low to middle income housing development in South Australia. Build. Environ. 2014, 75, 19–29. [Google Scholar] [CrossRef]
- Wang, Z.; Zhang, L.; Zhao, J.; He, Y.; Li, A. Thermal responses to different residential environments in Harbin. Build. Environ. 2011, 46, 2170–2178. [Google Scholar] [CrossRef]
- Pereira, L.D.; Raimondo, D.; Corgnati, S.P.; da Silva, M.G. Assessment of indoor air quality and thermal comfort in Portuguese secondary classrooms: Methodology and results. Build. Environ. 2014, 81, 69–80. [Google Scholar] [CrossRef]
- Chien, C.-H.; Jang, J.-Y.; Chen, Y.-H.; Wu, S.-C. 3-D numerical and experimental analysis for airflow within a passenger compartment. Int. J. Automot. Technol. 2008, 9, 437–445. [Google Scholar] [CrossRef]
- Martinho, N.A.G.; Silva, M.C.G.; Ramos, J.A.E. Evaluation of thermal comfort in a vehicle cabin. Proc. Inst. Mech. Eng. Part D J. Automob. Eng. 2004, 218, 159–166. [Google Scholar] [CrossRef]
- Zhou, X.; Lai, D.; Chen, Q. Experimental investigation of thermal comfort in a passenger car under driving conditions. Build. Environ. 2019, 149, 109–119. [Google Scholar] [CrossRef]
- Jung, W.; Jazizadeh, F. Comparative assessment of HVAC control strategies using personal thermal comfort and sensitivity models. Build. Environ. 2019, 158, 104–119. [Google Scholar] [CrossRef]
- Zhang, H.; Dai, L.; Xu, G.; Li, Y.; Chen, W.; Tao, W.-Q. Studies of air-flow and temperature fields inside a passenger compartment for improving thermal comfort and saving energy. Part I: Test/numerical model and validation. Appl. Therm. Eng. 2009, 29, 2022–2027. [Google Scholar] [CrossRef]
- Ferdyn-Grygierek, J. Indoor environment quality in the museum building and its effect on heating and cooling demand. Energy Build. 2014, 85, 32–44. [Google Scholar] [CrossRef]
- Yau, Y.H.; Chew, B.T.; Saifullah, A.Z.A. A Field Study on Thermal Comfort of Occupants and Acceptable Neutral Temperature at the National Museum in Malaysia. Indoor Built Environ. 2013, 22, 433–444. [Google Scholar] [CrossRef]
- Pavlin, B.; Pernigotto, G.; Cappelletti, F.; Bison, P.; Vidoni, R.; Gasparella, A. Real-Time Monitoring of Occupants’ Thermal Comfort through Infrared Imaging: A Preliminary Study. Buildings 2017, 7, 10. [Google Scholar] [CrossRef]
- Ghahramani, A.; Castro, G.; Becerik-Gerber, B.; Yu, X. Infrared thermography of human face for monitoring thermoregulation performance and estimating personal thermal comfort. Build. Environ. 2016, 109, 1–11. [Google Scholar] [CrossRef] [Green Version]
- Chaudhuri, T.; Soh, Y.C.; Li, H.; Xie, L. Machine learning driven personal comfort prediction by wearable sensing of pulse rate and skin temperature. Build. Environ. 2020, 170, 106615. [Google Scholar] [CrossRef]
- Liu, S.; Schiavon, S.; Das, H.P.; Jin, M.; Spanos, C.J. Personal thermal comfort models with wearable sensors. Build. Environ. 2019, 162, 106281. [Google Scholar] [CrossRef] [Green Version]
- Goto, T.; Toftum, J.; de Dear, R.; Fanger, P.O. Thermal sensation and thermophysiological responses to metabolic step-changes. Int. J. Biometeorol. 2006, 50, 323–332. [Google Scholar] [CrossRef]
- Aryal, A.; Becerik-Gerber, B. Thermal comfort modeling when personalized comfort systems are in use: Comparison of sensing and learning methods. Build. Environ. 2020, 185, 107316. [Google Scholar] [CrossRef]
- Wang, D.; Zhang, H.; Arens, E.; Huizenga, C. Observations of upper-extremity skin temperature and corresponding overall-body thermal sensations and comfort. Build. Environ. 2007, 42, 3933–3943. [Google Scholar] [CrossRef] [Green Version]
- Liu, W.; Lian, Z.; Deng, Q. Use of mean skin temperature in evaluation of individual thermal comfort for a person in a sleeping posture under steady thermal environment. Indoor Built Environ. 2015, 24, 489–499. [Google Scholar] [CrossRef]
- Sim, S.Y.; Koh, M.J.; Joo, K.M.; Noh, S.; Park, S.; Kim, Y.H.; Park, K.S. Estimation of Thermal Sensation Based on Wrist Skin Temperatures. Sensors 2016, 16, 420. [Google Scholar] [CrossRef] [PubMed] [Green Version]
- Han, J.; Kwon, S.-B.; Chun, C. Indoor environment and passengers’ comfort in subway stations in Seoul. Build. Environ. 2016, 104, 221–231. [Google Scholar] [CrossRef]
- Kim, Y.; Han, J.; Chun, C. Evaluation of comfort in subway stations via electroencephalography measurements in field experiments. Build. Environ. 2020, 183, 107130. [Google Scholar] [CrossRef]
- Abbaspour, M.; Jafari, M.J.; Mansouri, N.; Moattar, F.; Nouri, N.; Allahyari, M. Thermal comfort evaluation in Tehran metro using Relative Warmth Index. Int. J. Environ. Sci. Technol. 2008, 5, 297–304. [Google Scholar] [CrossRef] [Green Version]
- Katavoutas, G.; Assimakopoulos, M.N.; Asimakopoulos, D.N. On the determination of the thermal comfort conditions of a metropolitan city underground railway. Sci. Total. Environ. 2016, 566–567, 877–887. [Google Scholar] [CrossRef]
- Zhang, Y.; Li, X. Monitoring and analysis of subway tunnel thermal environment: A case study in Guangzhou, China. Sustain. Cities Soc. 2020, 55, 102057. [Google Scholar] [CrossRef]
- Yang, B.; Yang, C.; Ni, L.; Wang, Y.; Yao, Y. Investigation on thermal environment of subway stations in severe cold region of China: A case study in Harbin. Build. Environ. 2022, 212, 108761. [Google Scholar] [CrossRef]
- Fakir, H.; Kim, J.K. Prediction of individual thermal sensation from exhaled breath temperature using a smart face mask. Build. Environ. 2022, 207, 108507. [Google Scholar] [CrossRef]
- Megri, F.; Megri, A.C.; Djabri, R. An integrated fuzzy support vector regression and the particle swarm optimization algorithm to predict indoor thermal comfort. Indoor Built Environ. 2016, 25, 1248–1258. [Google Scholar] [CrossRef]
- Blockly|Google Developers, (n.d.). Available online: https://developers.google.com/blockly/ (accessed on 12 October 2022).
- Rafiee, J.; Rafiee, M.; Prause, N.; Schoen, M. Wavelet basis functions in biomedical signal processing. Expert Syst. Appl. 2011, 38, 6190–6201. [Google Scholar] [CrossRef]
- Akay, M. Wavelets in Biomedical Engineering. Ann. Biomed. Eng. 1995, 23, 531–542. [Google Scholar] [CrossRef] [PubMed]
- Easwaramoorthy, D.; Uthayakumar, R. Analysis of biomedical EEG signals using wavelet transforms and multifractal analysis. In Proceedings of the 2010 IEEE International Conference on Communication Control and Computing Technologies, ICCCCT, Nagercoil, India, 7–9 October 2010; pp. 544–549. [Google Scholar] [CrossRef]
- Kumar, N.; Alam, K.; Siddiqi, A.H. Wavelet Transform for Classification of EEG Signal using SVM and ANN. Biomed. Pharmacol. J. 2017, 10, 2061–2069. [Google Scholar] [CrossRef]
- Arens, E.; Zhang, H.; Huizenga, C. Partial- and whole-body thermal sensation and comfort— Part I: Uniform environmental conditions. J. Therm. Biol. 2006, 31, 53–59. [Google Scholar] [CrossRef] [Green Version]
- Zhang, H.; Arens, E.; Huizenga, C.; Han, T. Thermal sensation and comfort models for non-uniform and transient environments: Part I: Local sensation of individual body parts. Build. Environ. 2010, 45, 380–388. [Google Scholar] [CrossRef] [Green Version]
- Zhang, H.; Arens, E.; Huizenga, C.; Han, T. Thermal sensation and comfort models for non-uniform and transient environments, part II: Local comfort of individual body parts. Build. Environ. 2010, 45, 389–398. [Google Scholar] [CrossRef] [Green Version]
- Zhang, H.; Arens, E.; Huizenga, C.; Han, T. Thermal sensation and comfort models for non-uniform and transient environments, part III: Whole-body sensation and comfort. Build. Environ. 2010, 45, 399–410. [Google Scholar] [CrossRef] [Green Version]
- Reeder, B.; David, A. Health at hand: A systematic review of smart watch uses for health and wellness. J. Biomed. Inform. 2016, 63, 269–276. [Google Scholar] [CrossRef]
- Ye, Z.; Ling, Y.; Yang, M.; Xu, Y.; Zhu, L.; Yan, Z.; Chen, P.-Y. A Breathable, Reusable, and Zero-Power Smart Face Mask for Wireless Cough and Mask-Wearing Monitoring. ACS Nano 2022, 16, 5874–5884. [Google Scholar] [CrossRef]
- Lu, Q.; Chen, H.; Zeng, Y.; Xue, J.; Cao, X.; Wang, N.; Wang, Z. Intelligent facemask based on triboelectric nanogenerator for respiratory monitoring. Nano Energy 2022, 91, 106612. [Google Scholar] [CrossRef]
- Zhong, J.; Li, Z.; Takakuwa, M.; Inoue, D.; Hashizume, D.; Jiang, Z.; Shi, Y.; Ou, L.; Nayeem, O.G.; Umezu, S.; et al. Smart Face Mask Based on an Ultrathin Pressure Sensor for Wireless Monitoring of Breath Conditions. Adv. Mater. 2022, 34, 2107758. [Google Scholar] [CrossRef]
- Escobedo, P.; Fernández-Ramos, M.D.; López-Ruiz, N.; Moyano-Rodríguez, O.; Martínez-Olmos, A.; de Vargas-Sansalvador, I.M.P.; Carvajal, M.A.; Capitán-Vallvey, L.F.; Palma, A.J. Smart facemask for wireless CO2 monitoring. Nat. Commun. 2022, 13, 72. [Google Scholar] [CrossRef]
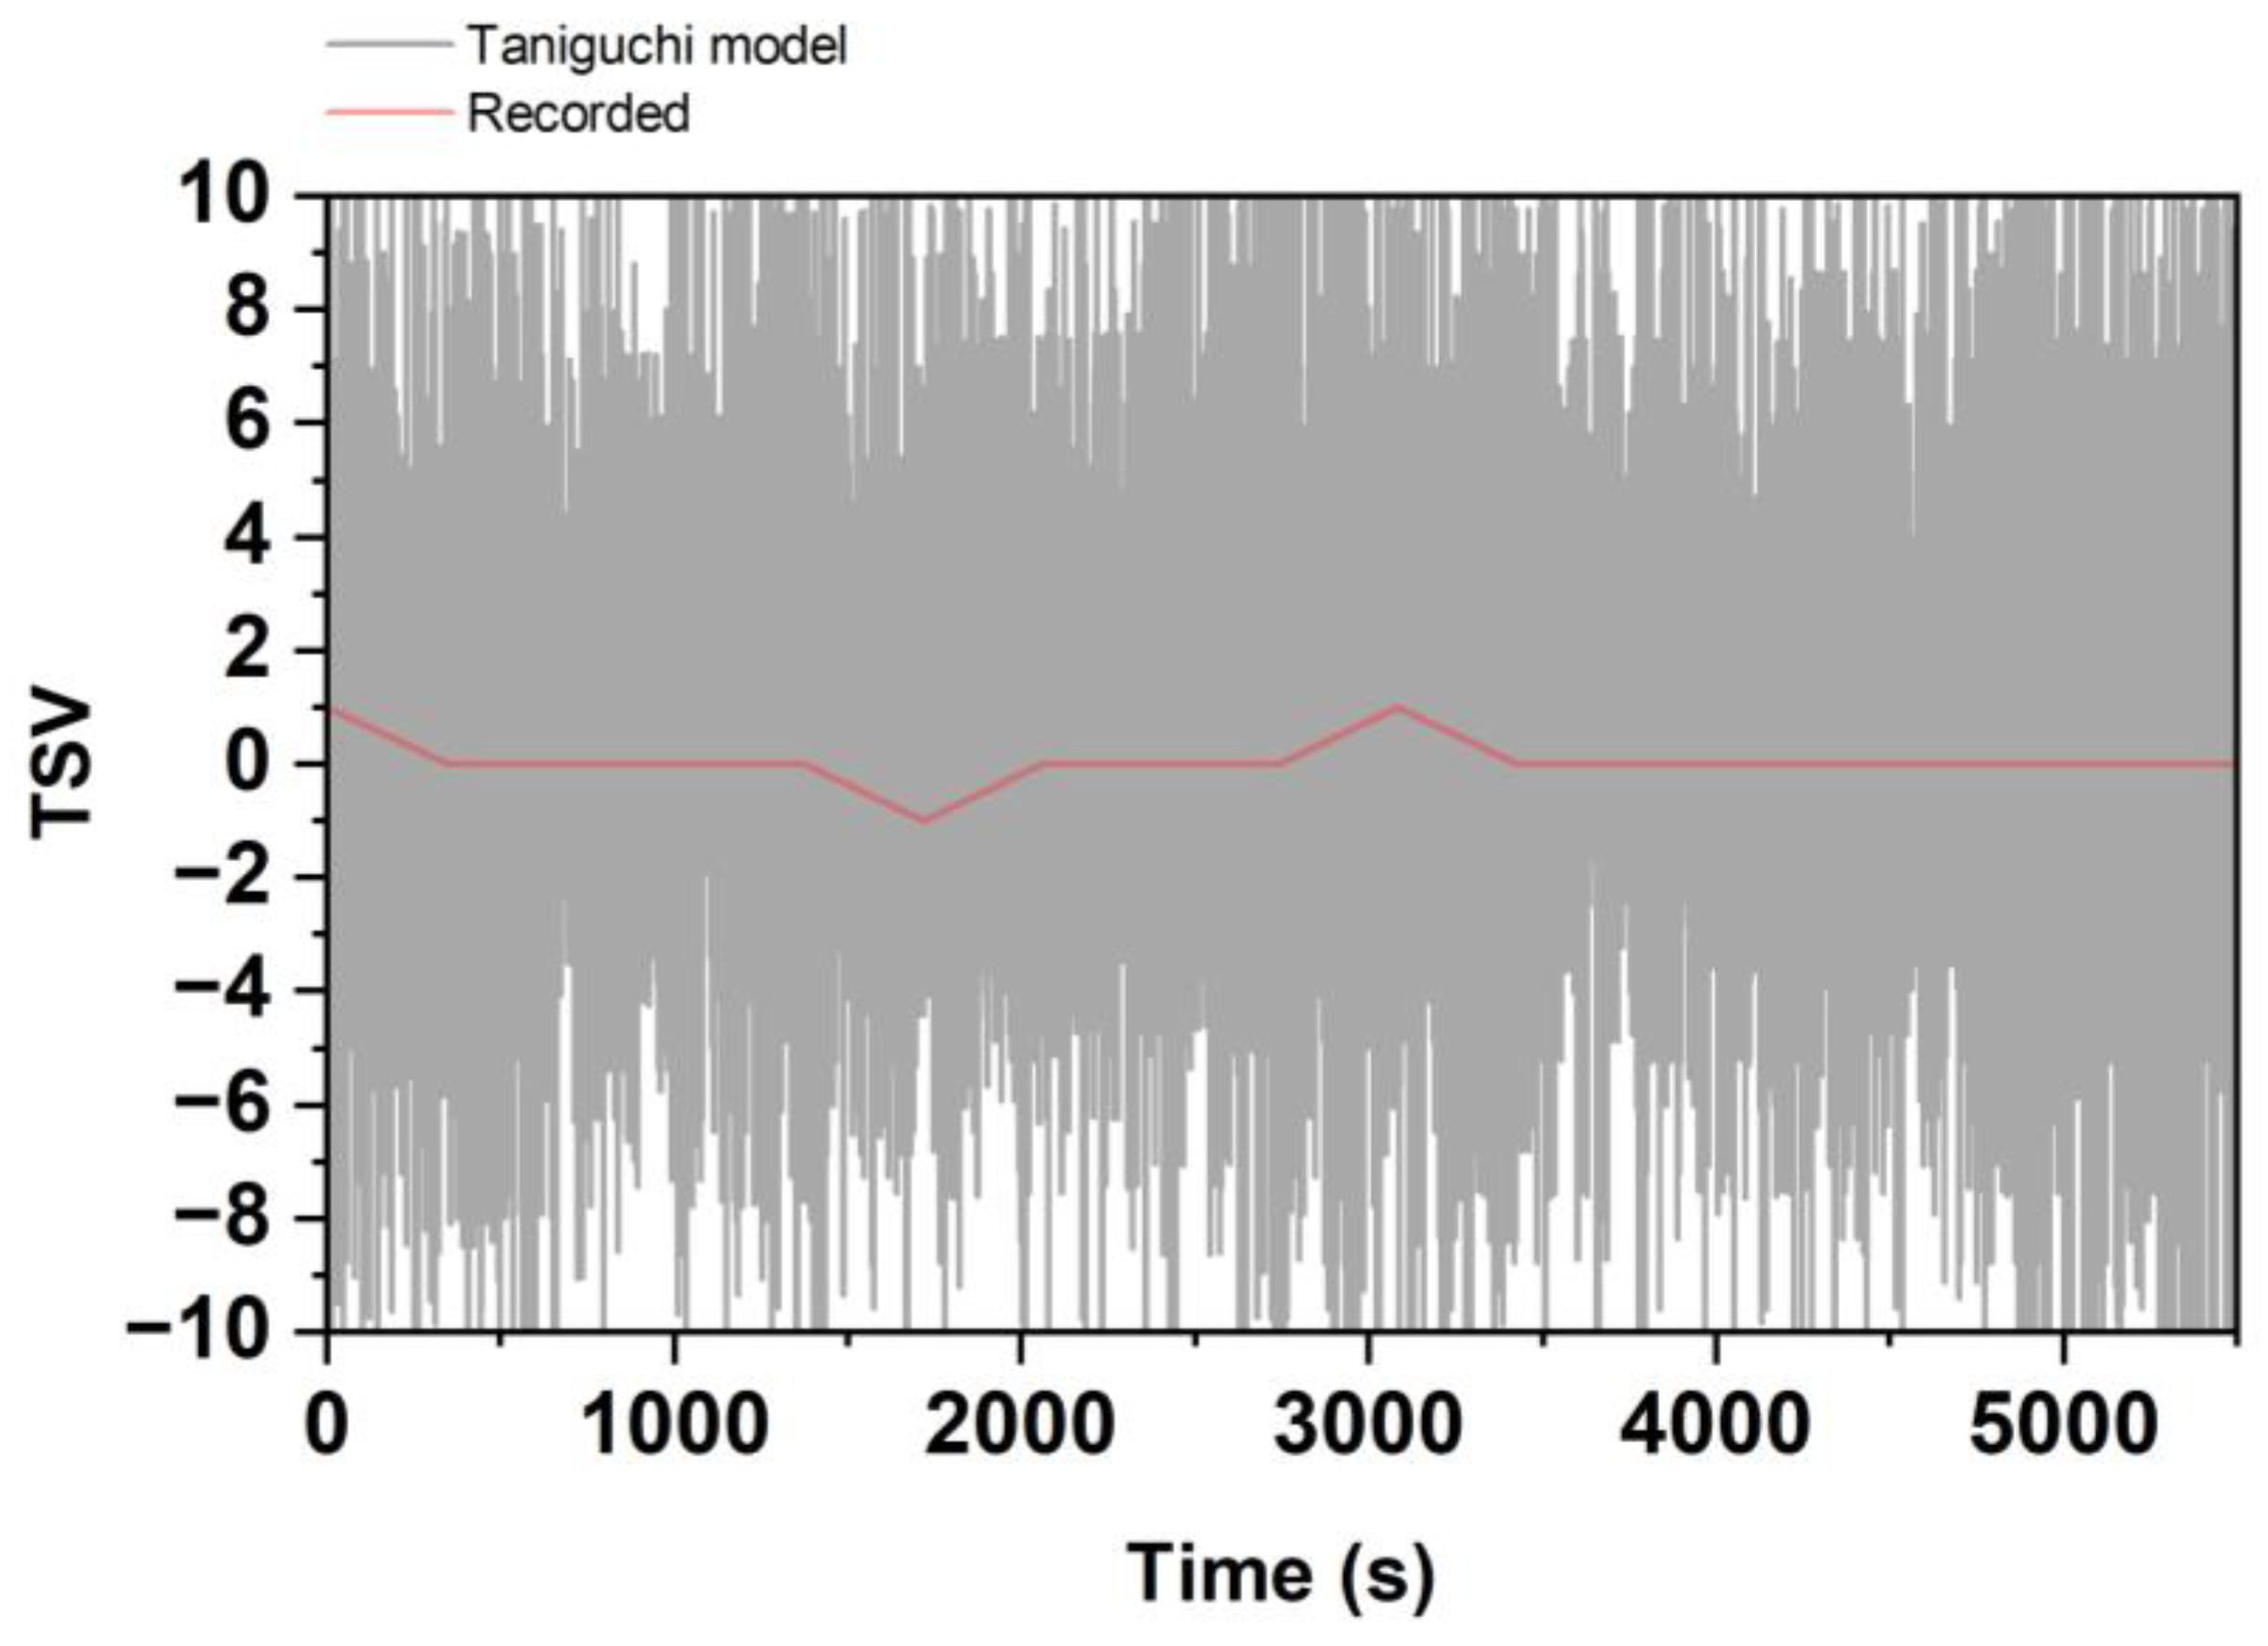
- Taniguchi, Y.; Aoki, H.; Fujikake, K.; Tanaka, H.; Kitada, M. Study on Car Air Conditioning System Controlled by Car Occupants’ Skin Temperatures—Part 1: Research on a Method of Quantitative Evaluation of Car Occupants’ Thermal Sensations by Skin Temperatures; SAE Technical Papers; SAE International: Warrendale, PA, USA, 1992. [Google Scholar] [CrossRef]
- Ates, H.C.; Yetisen, A.K.; Güder, F.; Dincer, C. Wearable devices for the detection of COVID-19. Nat. Electron. 2021, 4, 13–14. [Google Scholar] [CrossRef]
- Güder, F.; Ainla, A.; Redston, J.; Mosadegh, B.; Glavan, A.; Martin, T.J.; Whitesides, G.M. Paper-Based Electrical Respiration Sensor. Angew. Chem. 2016, 128, 5821–5826. [Google Scholar] [CrossRef] [Green Version]
- Maier, D.; Laubender, E.; Basavanna, A.; Schumann, S.; Güder, F.; Urban, G.A.; Dincer, C. Toward Continuous Monitoring of Breath Biochemistry: A Paper-Based Wearable Sensor for Real-Time Hydrogen Peroxide Measurement in Simulated Breath. ACS Sens. 2019, 4, 2945–2951. [Google Scholar] [CrossRef]
- Ye, Z.; Wang, J.; Hua, H.; Zhou, X.; Li, Q. Precise Detection and Quantitative Prediction of Blood Glucose Level With an Electronic Nose System. IEEE Sens. J. 2022, 22, 12452–12459. [Google Scholar] [CrossRef]
- Information on the Number of Passengers Getting On and Off in Seoul Metro from January to November in 2021. Available online: http://www.seoulmetro.co.kr/kr/board.do?menuIdx=551&bbsIdx=2213351 (accessed on 9 November 2022).


| Measurement | Sensor | Specification |
|---|---|---|
| Facial skin temperature | Infrared MLX90614-DCC | Operating voltage: 3.3–5 V, accuracy: ±0.2 °C, interface: I2C, response time: 0.15 s |
| Exhaled breath temperature | Thermistor NXFT15XH103FA2B130 | Resistance at 25 °C: 10 KΩ, operating range: −40–125 °C, accuracy: ±0.8 °C, response time: 4 s |
| Number of Participants | Age (Years) | Height (cm) | Weight (kg) |
|---|---|---|---|
| 20 | 23.1 ± 5 | 174.4 ± 5.5 | 77 ± 30 |
| ID | SKT | SKTapprox | SKTdecomp | EBT | EBTapprox | EBTdecomp |
|---|---|---|---|---|---|---|
| 1 | 0.016 | 0.013 | 0.009 | 0.767 ** | 0.775 ** | −0.011 |
| 2 | 0.472 ** | 0.473 ** | 0.003 | 0.133 ** | 0.131 ** | 0.002 |
| 3 | 0.118 ** | 0.117 ** | 0.054 ** | 0.231 ** | 0.216 ** | 0.021 |
| 4 | 0.302 ** | 0.304 ** | −0.001 | 0.06 ** | 0.058 ** | 0.018 |
| 5 | 0.608 ** | 0.622 ** | 0.001 | 0.325 ** | 0.337 ** | 0.001 |
| 6 | - | - | - | - | - | - |
| 7 | 0.619 ** | 0.621 ** | −0.003 | 0.4 ** | 0.414 ** | 0.004 |
| 8 | 0.012 | 0.007 | 0.008 | 0.078 ** | 0.075 ** | 0.007 |
| 9 | −0.401 ** | −0.402 ** | −0.008 | −0.097 ** | −0.107 ** | −0.001 |
| 10 | 0.249 ** | 0.247 ** | 0.002 | 0.252 ** | 0.253 ** | −0.002 |
| 11 | 0.147 ** | 0.154 ** | −0.019 | −0.255 ** | −0.264 ** | −0.005 |
| 12 | - | - | - | - | - | - |
| 13 | 0.43 ** | 0.43 ** | 0.013 | 0.397 ** | 0.4 ** | 0.017 |
| 14 | 0.468 ** | 0.468 ** | 0.011 | −0.068 ** | −0.066 ** | −0.006 |
| 15 | 0.022 | 0.021 | −0.003 | 0.218 ** | 0.217 ** | 0.008 |
| 16 | 0.084 ** | 0.083 ** | 0.004 | 0.005 | 0.005 | −0.001 |
| 17 | −0.141 ** | −0.141 ** | 0.009 | 0.04 ** | 0.042 ** | −0.02 |
| 18 | −0.217 ** | −0.221 ** | −0.003 | 0.29 ** | 0.29 ** | −0.006 |
| 19 | 0.489 ** | 0.491 ** | −0.004 | 0.223 ** | 0.226 ** | 0.005 |
| 20 | 0.348 ** | 0.348 ** | −0.004 | 0.001 | 0.003 | −0.001 |
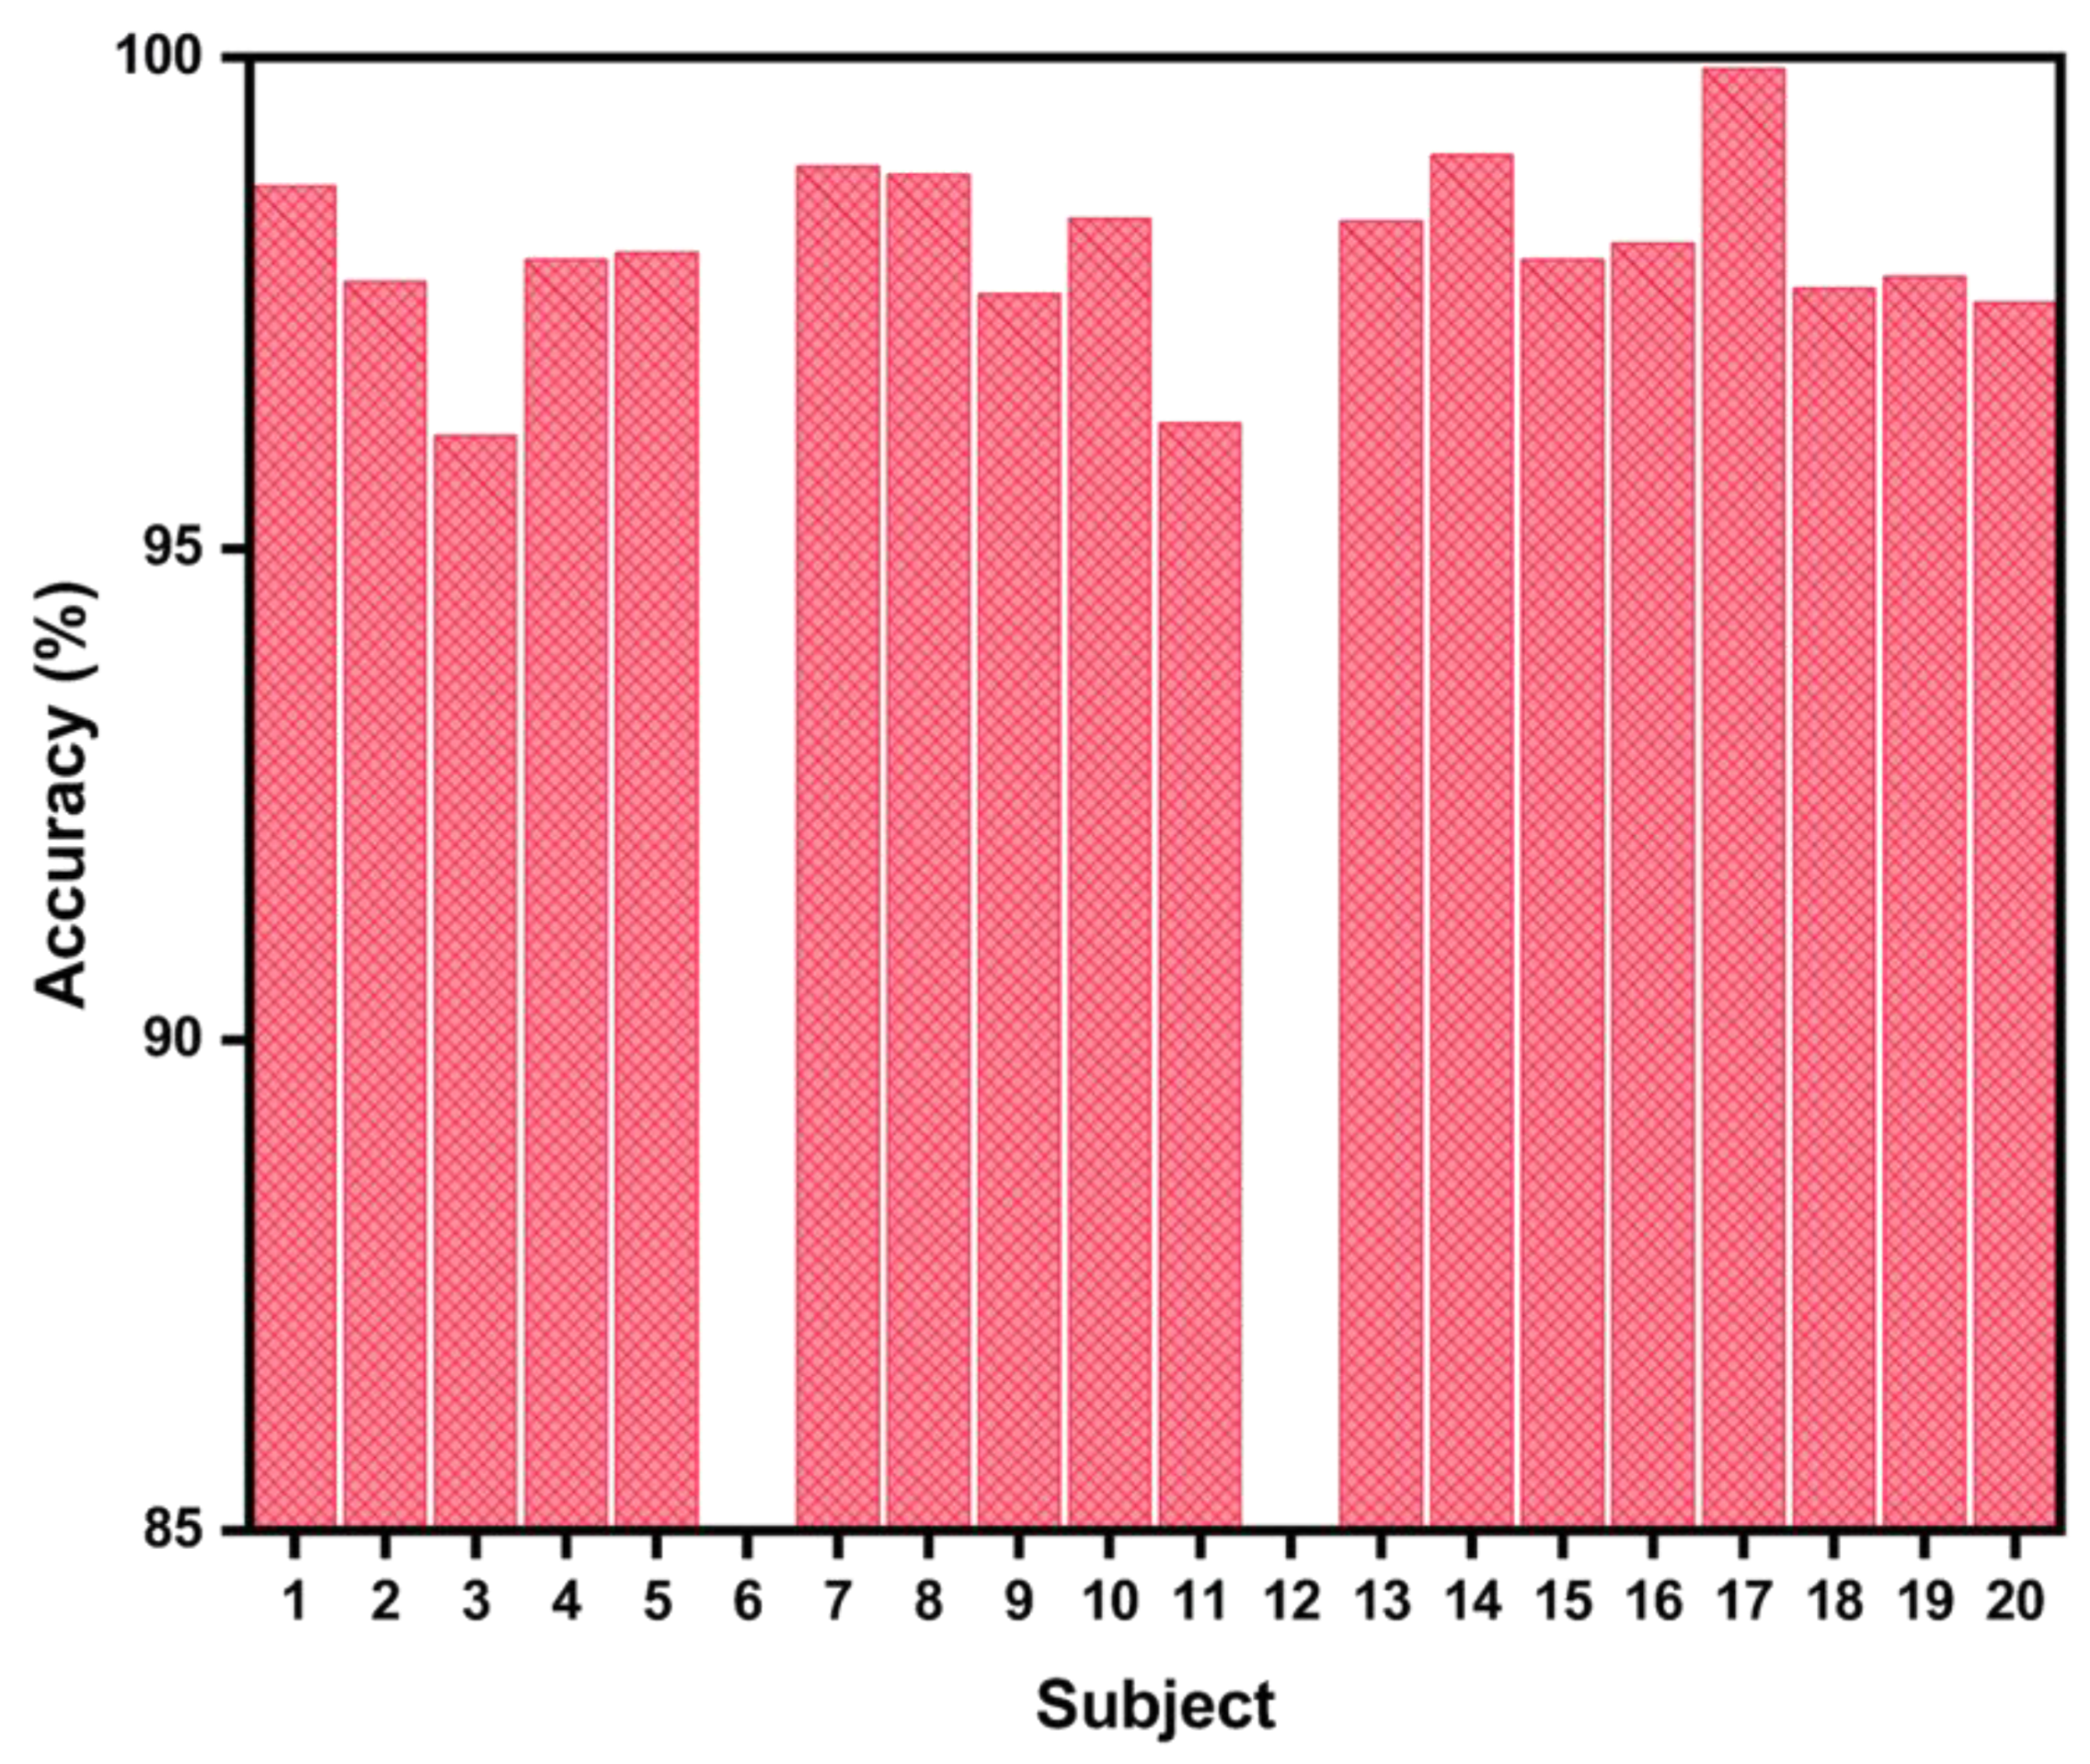
| ID | Precision (%) | Recall (%) | f-1 Score (%) | Accuracy (%) |
|---|---|---|---|---|
| 1 | 97.40912879 | 97.405359 | 97.40108 | 98.69067 |
| 2 | 95.49638989 | 95.5277754 | 95.50511 | 97.7176 |
| 3 | 92.50089658 | 92.6493112 | 92.47093 | 96.14679 |
| 4 | 95.92654775 | 95.9369586 | 95.93012 | 97.94101 |
| 5 | 96.07387951 | 96.0685809 | 96.07052 | 98.01398 |
| 6 | - | - | - | - |
| 7 | 97.79543872 | 97.8439462 | 97.80826 | 98.8894 |
| 8 | 97.63298034 | 97.6421645 | 97.63427 | 98.80881 |
| 9 | 95.25275546 | 95.2461255 | 95.24822 | 97.59388 |
| 10 | 96.7478617 | 96.7516882 | 96.74953 | 98.35943 |
| 11 | 92.69322156 | 92.7050666 | 92.69831 | 96.27451 |
| 12 | - | - | - | - |
| 13 | 96.70350709 | 96.7725463 | 96.72947 | 98.33398 |
| 14 | 98.02587008 | 98.0287653 | 98.02712 | 99.00717 |
| 15 | 95.92848156 | 95.9575363 | 95.93169 | 97.93935 |
| 16 | 96.25907571 | 96.2621746 | 96.2548 | 98.10875 |
| 17 | 99.77315689 | 99.7731569 | 99.77316 | 99.88392 |
| 18 | 95.34922926 | 95.3577003 | 95.35017 | 97.64471 |
| 19 | 95.5944613 | 95.6120342 | 95.60206 | 97.76786 |
| 20 | 95.07726541 | 95.0968453 | 95.07749 | 97.50459 |
Publisher’s Note: MDPI stays neutral with regard to jurisdictional claims in published maps and institutional affiliations. |
© 2022 by the authors. Licensee MDPI, Basel, Switzerland. This article is an open access article distributed under the terms and conditions of the Creative Commons Attribution (CC BY) license (https://creativecommons.org/licenses/by/4.0/).
Share and Cite
Fakir, M.H.; Yoon, S.E.; Mohizin, A.; Kim, J.K. Prediction of Individual Dynamic Thermal Sensation in Subway Commute Using Smart Face Mask. Biosensors 2022, 12, 1093. https://doi.org/10.3390/bios12121093
Fakir MH, Yoon SE, Mohizin A, Kim JK. Prediction of Individual Dynamic Thermal Sensation in Subway Commute Using Smart Face Mask. Biosensors. 2022; 12(12):1093. https://doi.org/10.3390/bios12121093
Chicago/Turabian StyleFakir, Md Hasib, Seong Eun Yoon, Abdul Mohizin, and Jung Kyung Kim. 2022. "Prediction of Individual Dynamic Thermal Sensation in Subway Commute Using Smart Face Mask" Biosensors 12, no. 12: 1093. https://doi.org/10.3390/bios12121093