Classification of Mental Stress from Wearable Physiological Sensors Using Image-Encoding-Based Deep Neural Network

 , ,
, ,  and
and 
Abstract
:1. Introduction
- The present work encodes a multivariate time series dataset to time series images which resulted in promising accuracies achieved in both training as well as testing phases.
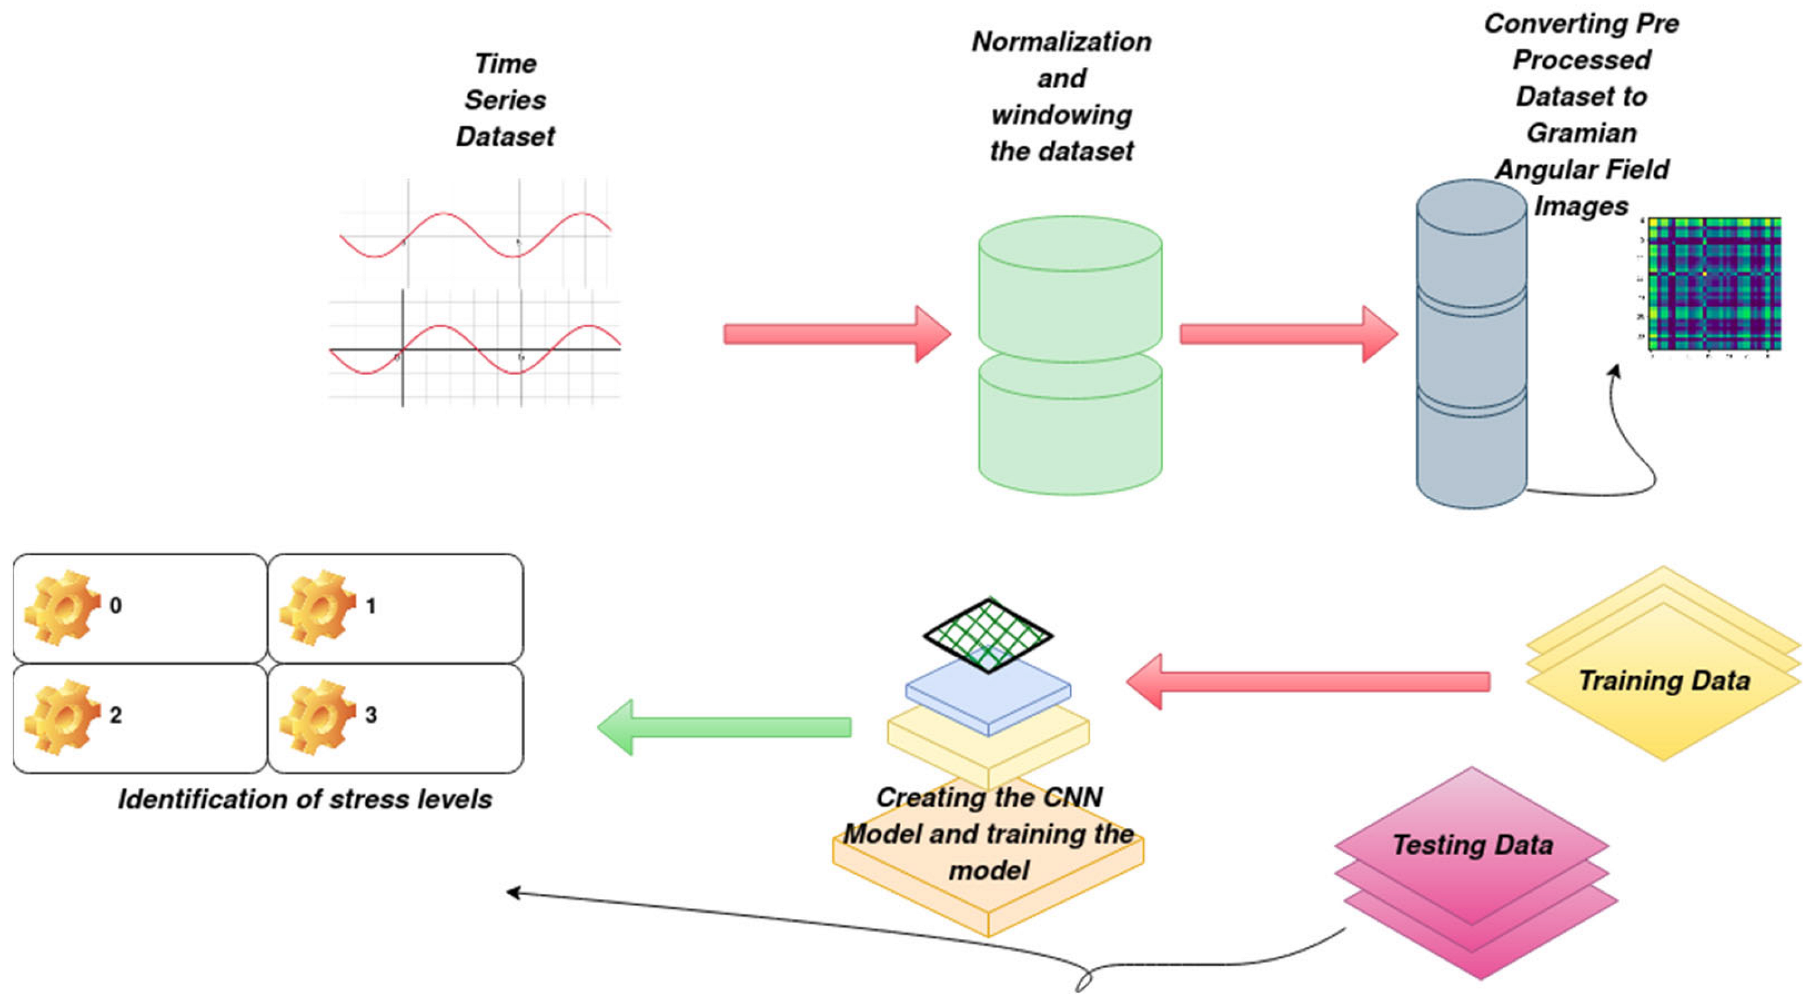
- The work properly groups the multivariate time series dataset which is being experimented on for the first time and converts it to Gramian Angular Field (GAF) images successfully before training the normalized data with the help of a convolutional neural network (CNN). An overview of our proposed pipeline for mental stress detection is illustrated in Figure 1.
- The proposed image-encoding-based deep neural network model is tested on two standard benchmark stress recognition datasets, namely WESAD [12] and SWELL [13]. This resulted in better classification accuracies which proved that the model is capable of showing good performances on any time series dataset.
2. Literature Review
Time Series Images
3. Datasets Used
4. Proposed Methodology
4.1. Extracting Dataset and Normalization
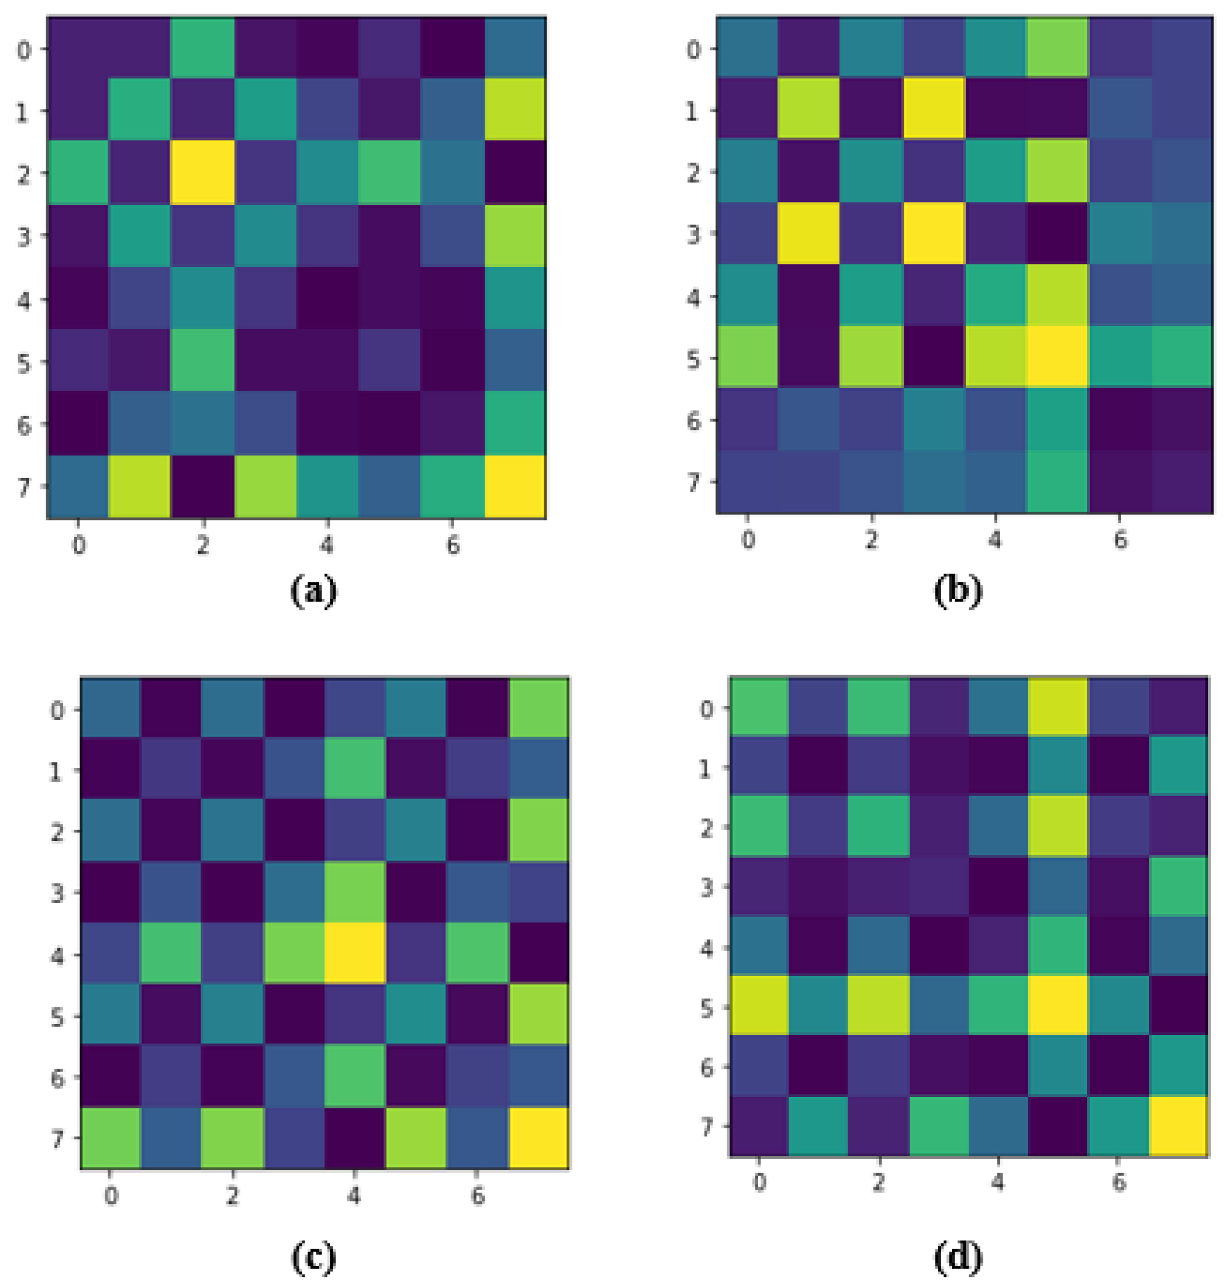
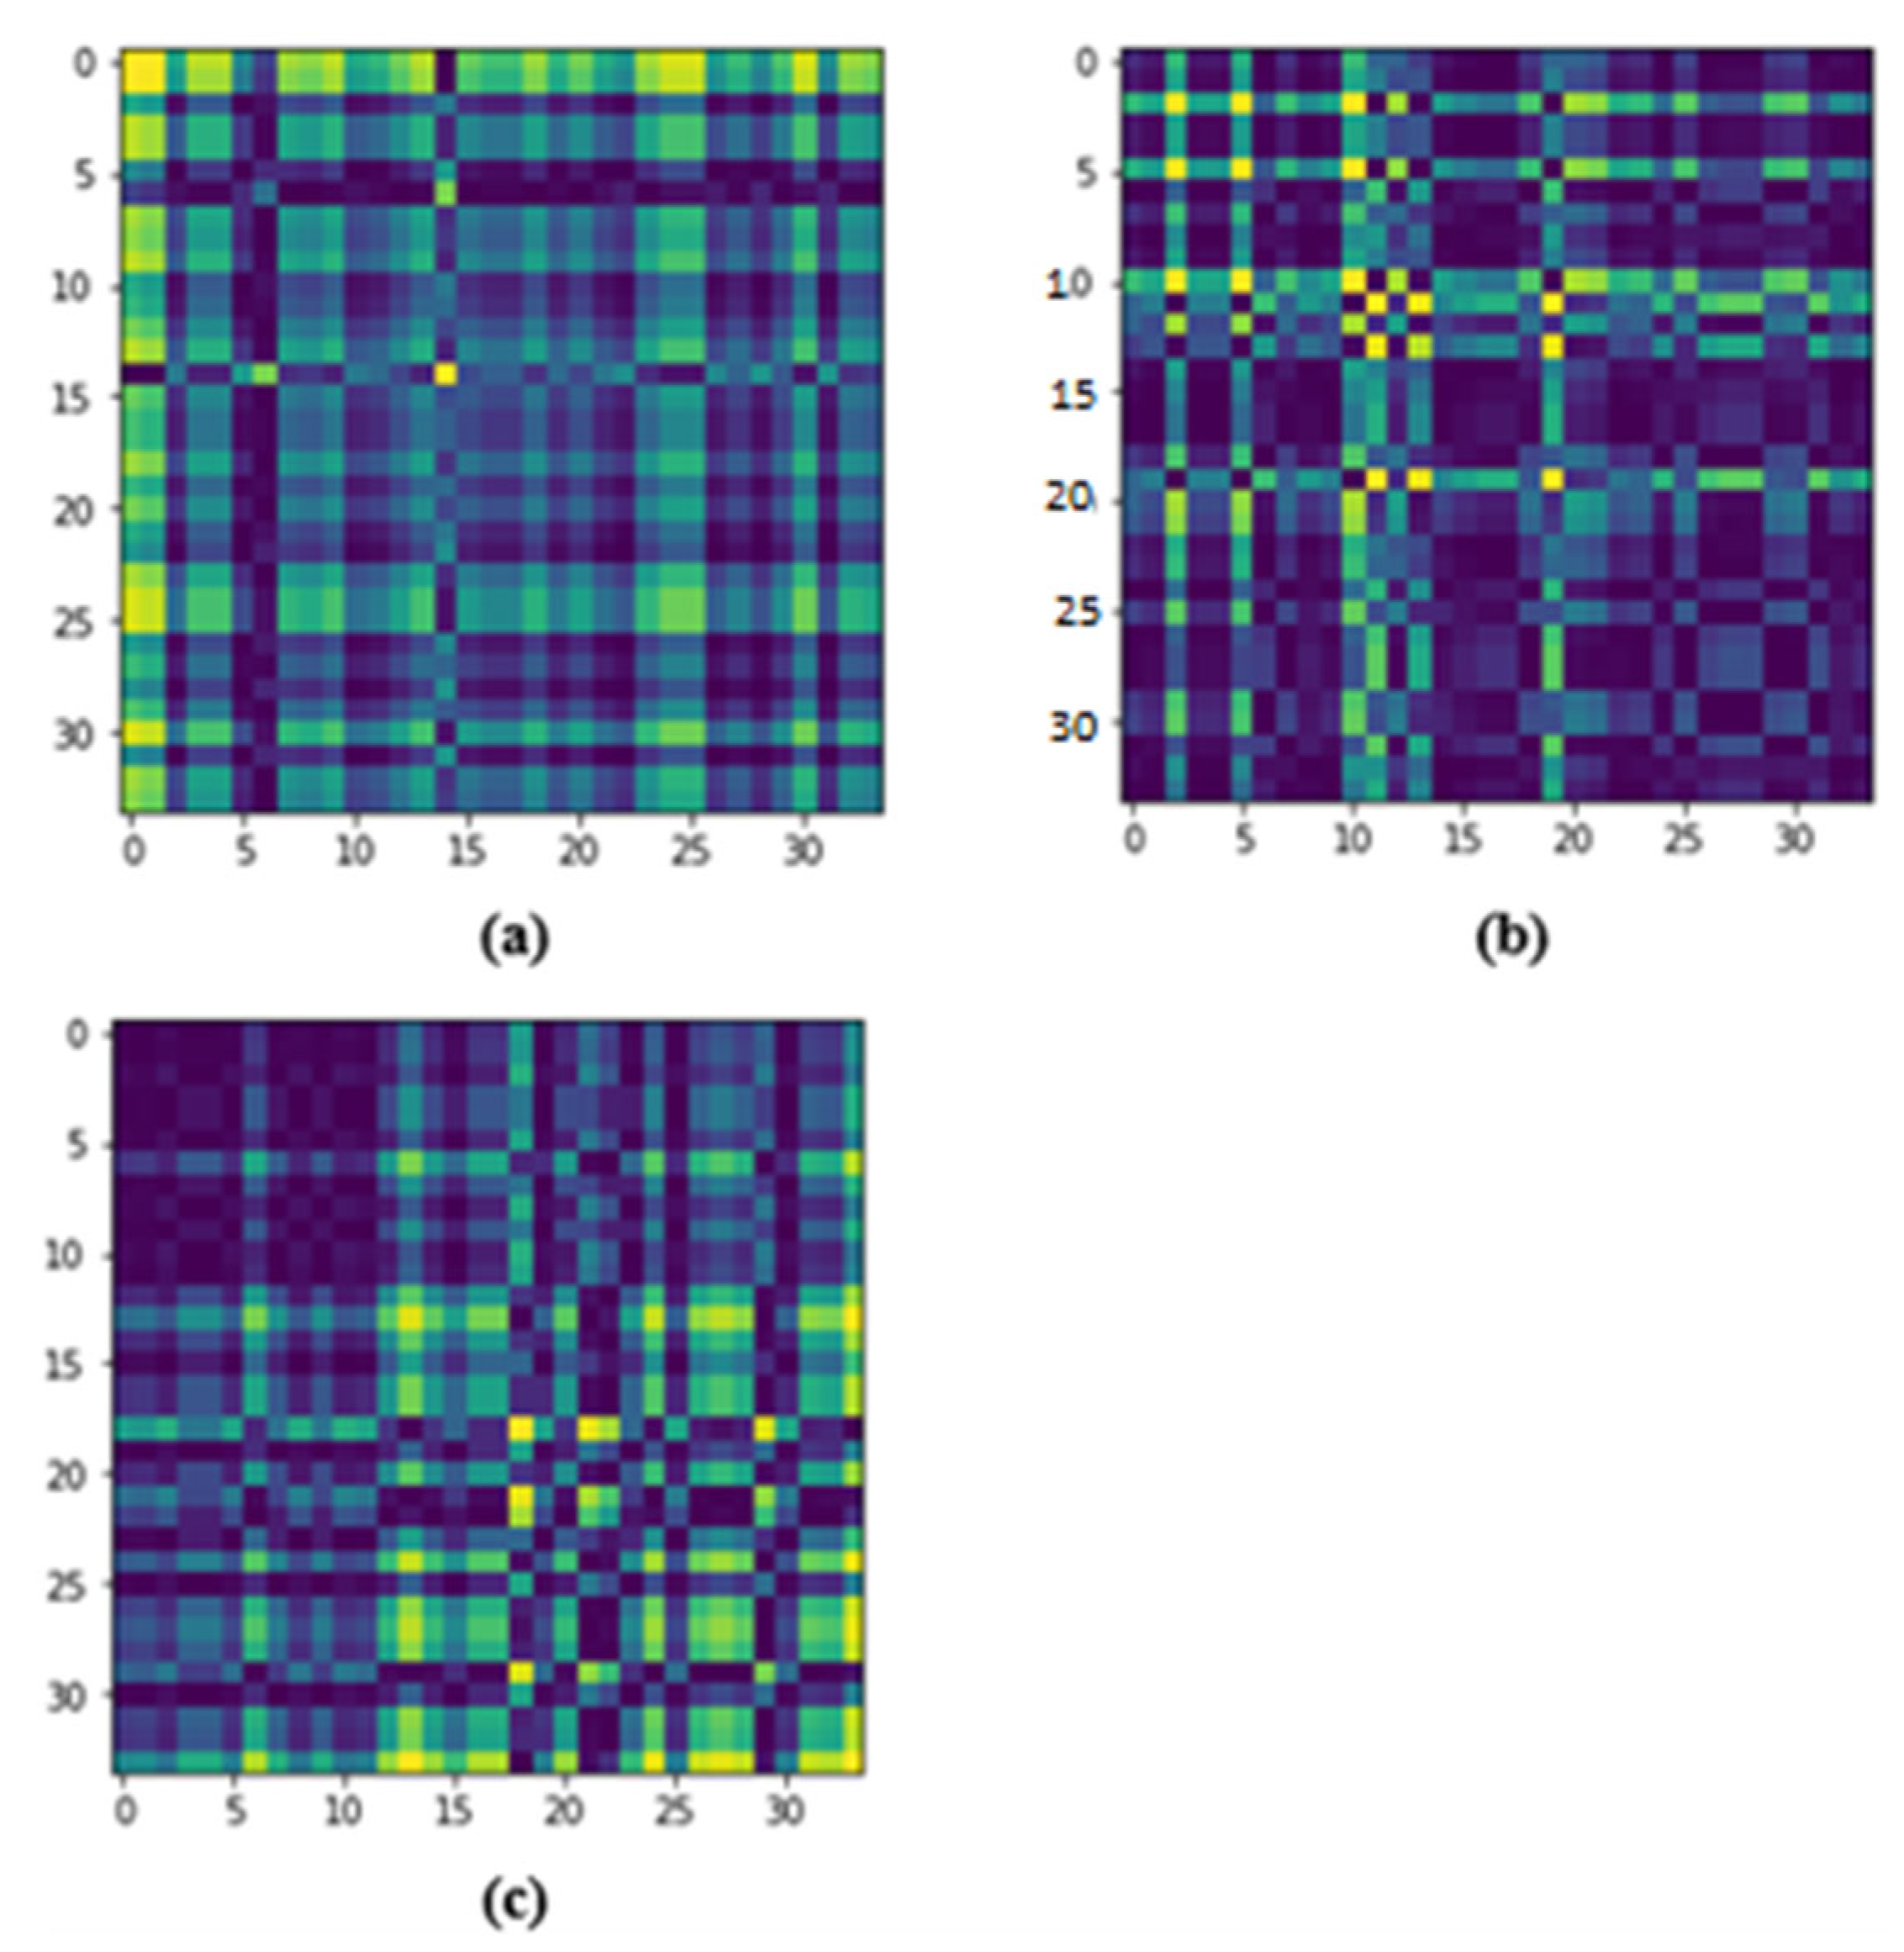
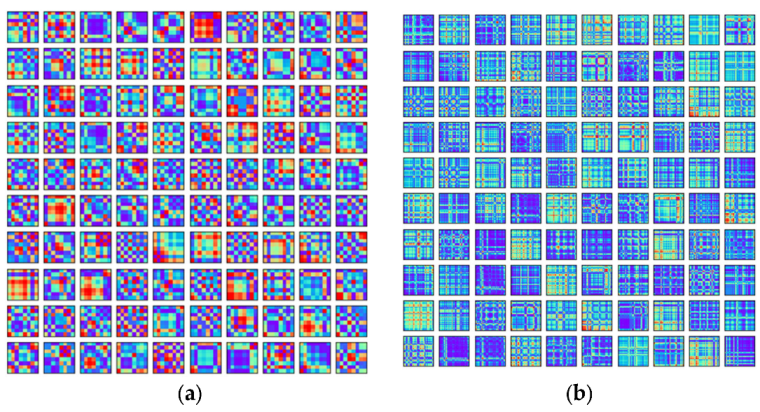
4.2. Encoding Dataset to Time Series Images
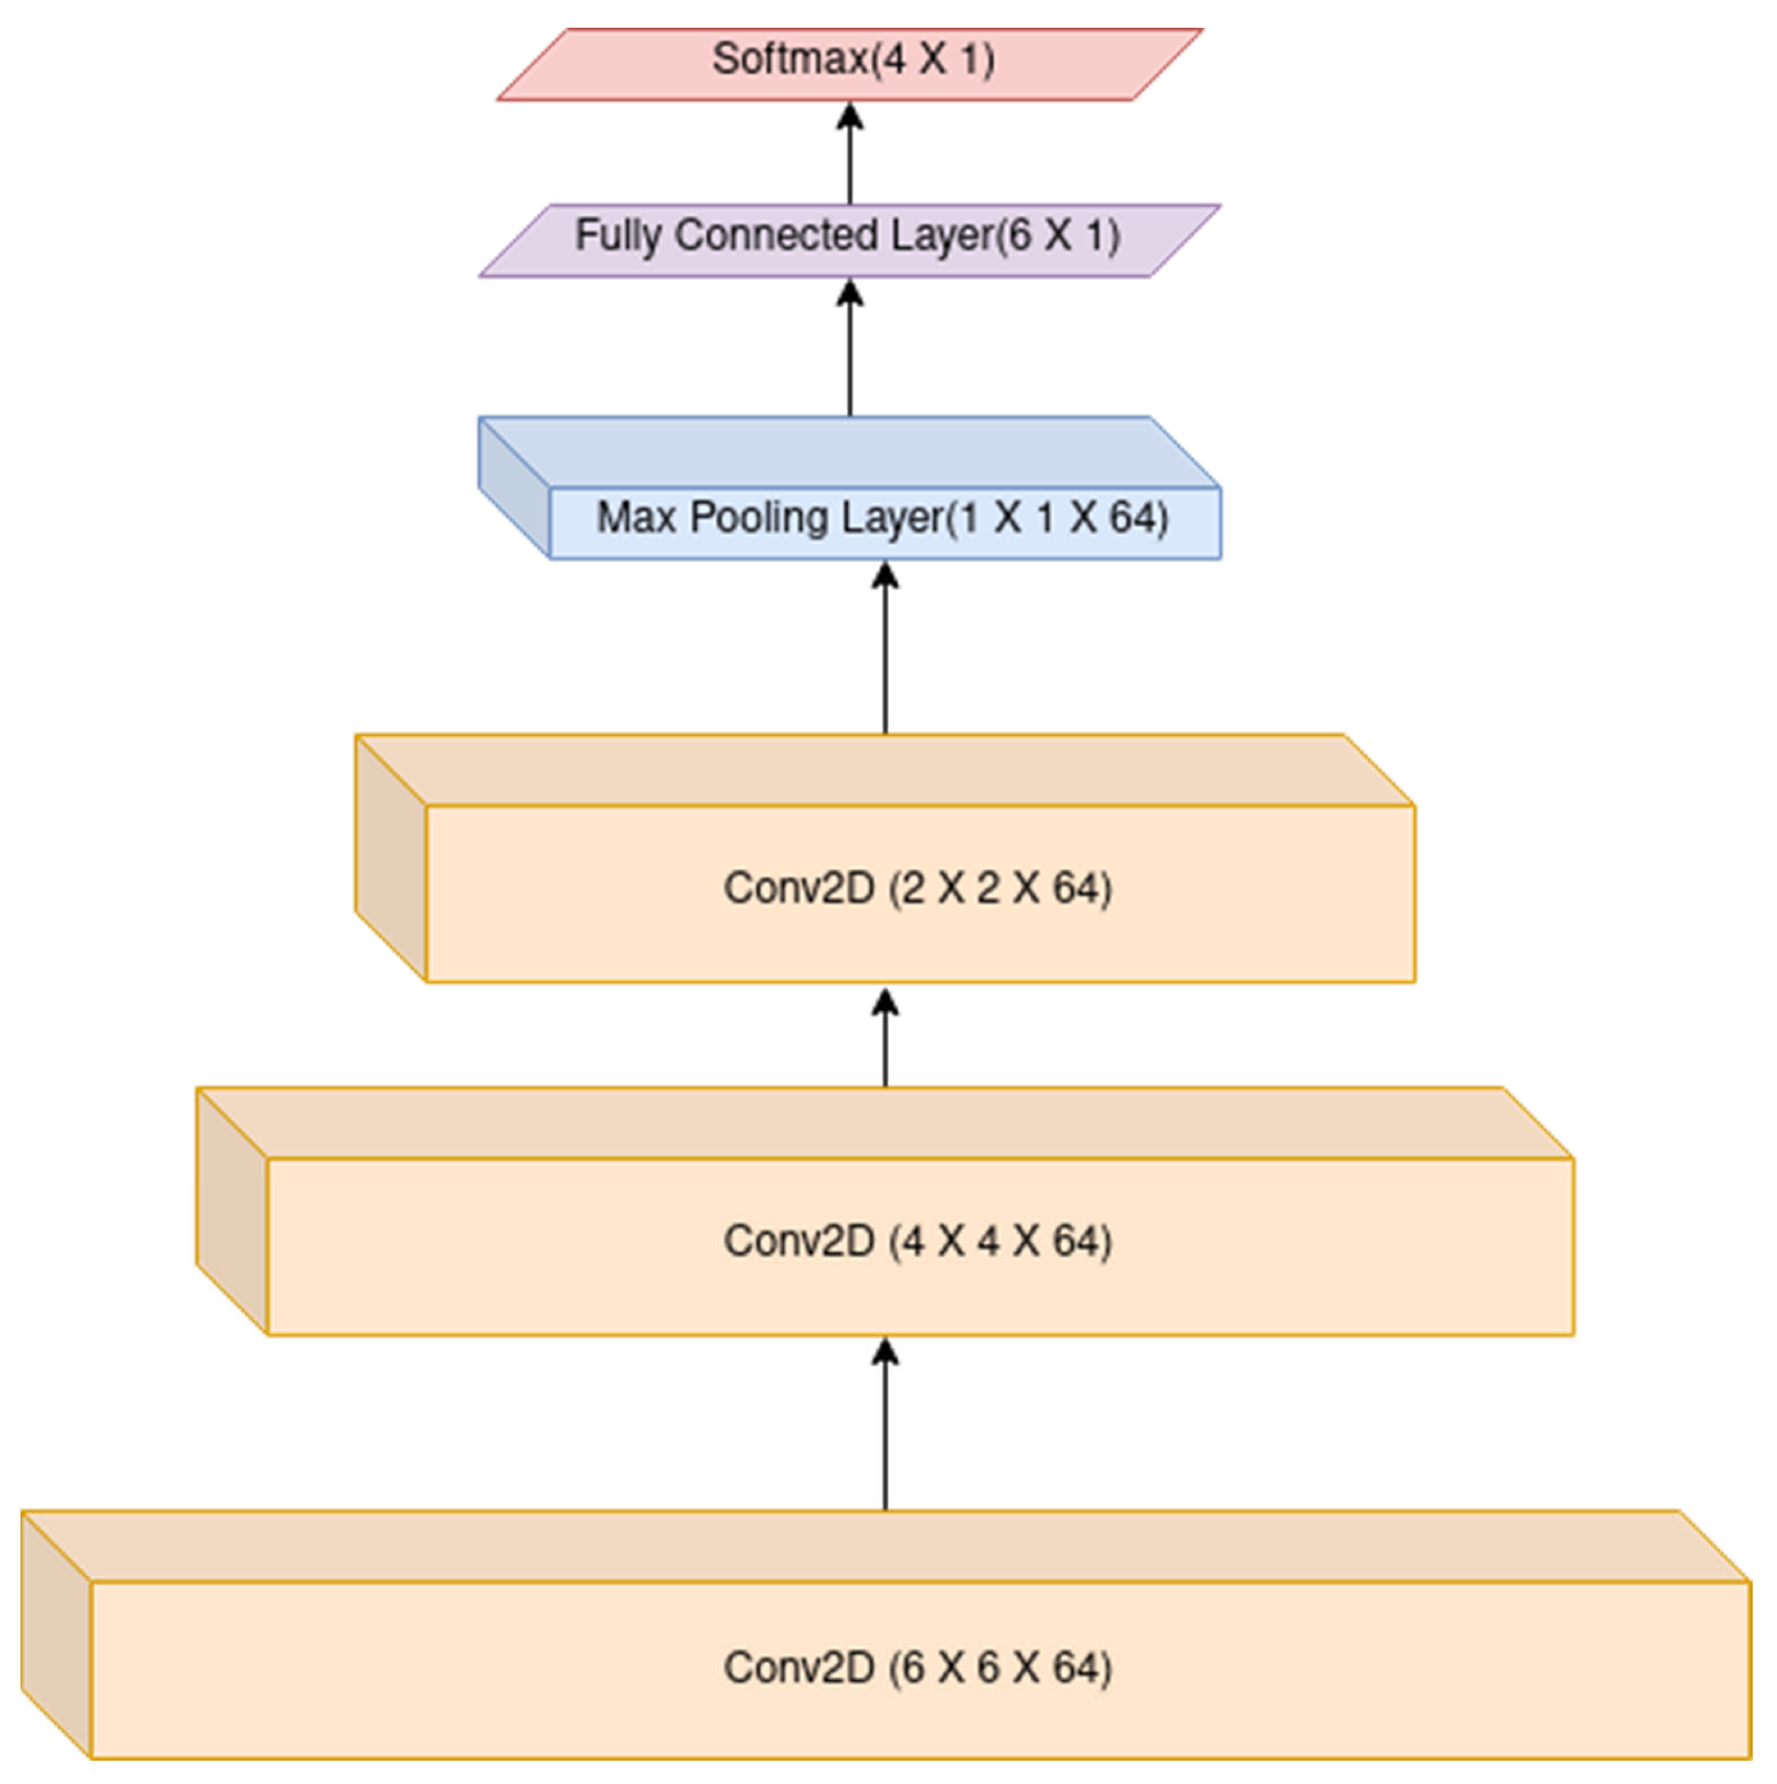
4.3. Creating the CNN Model
5. Results and Discussion
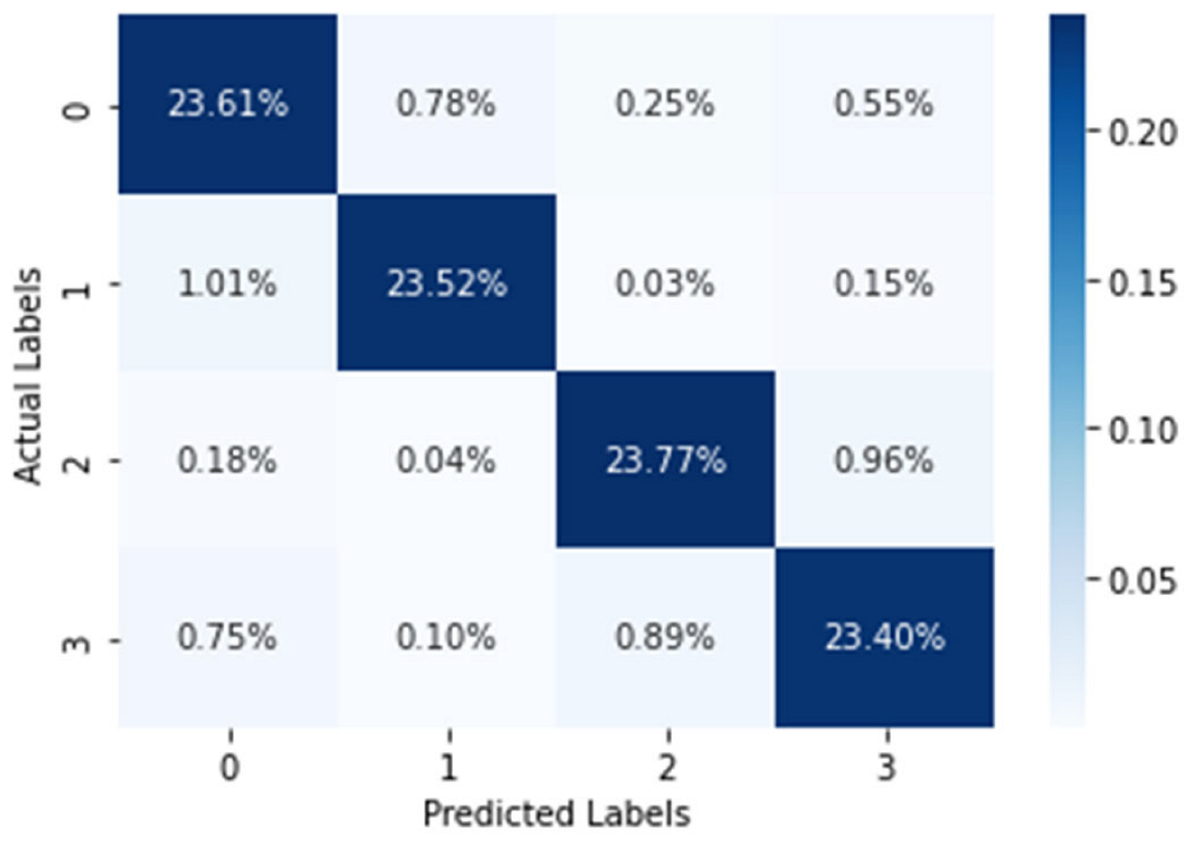
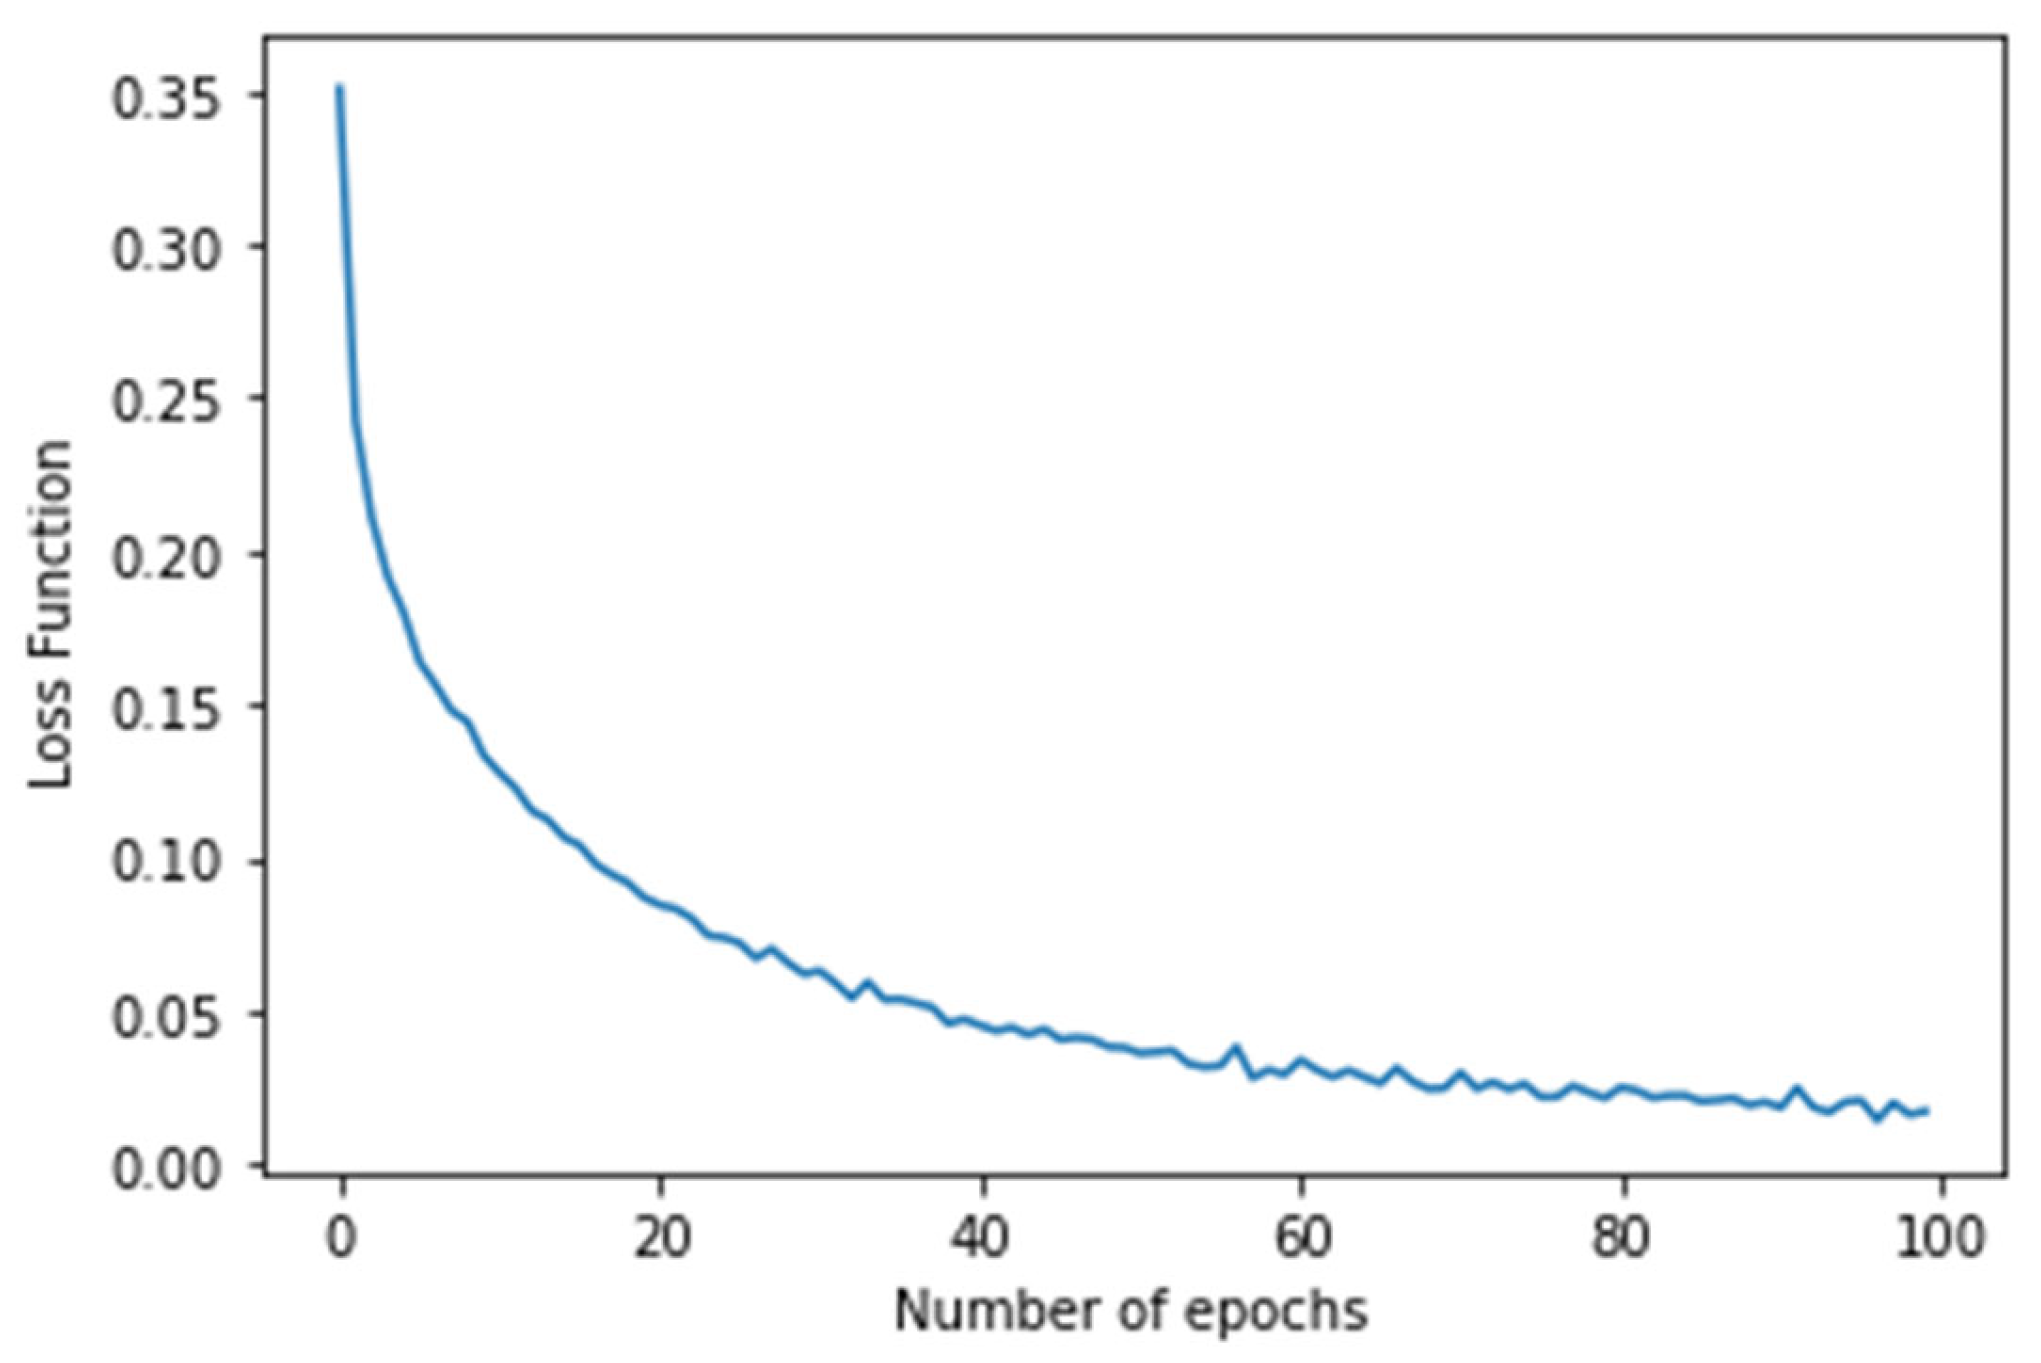
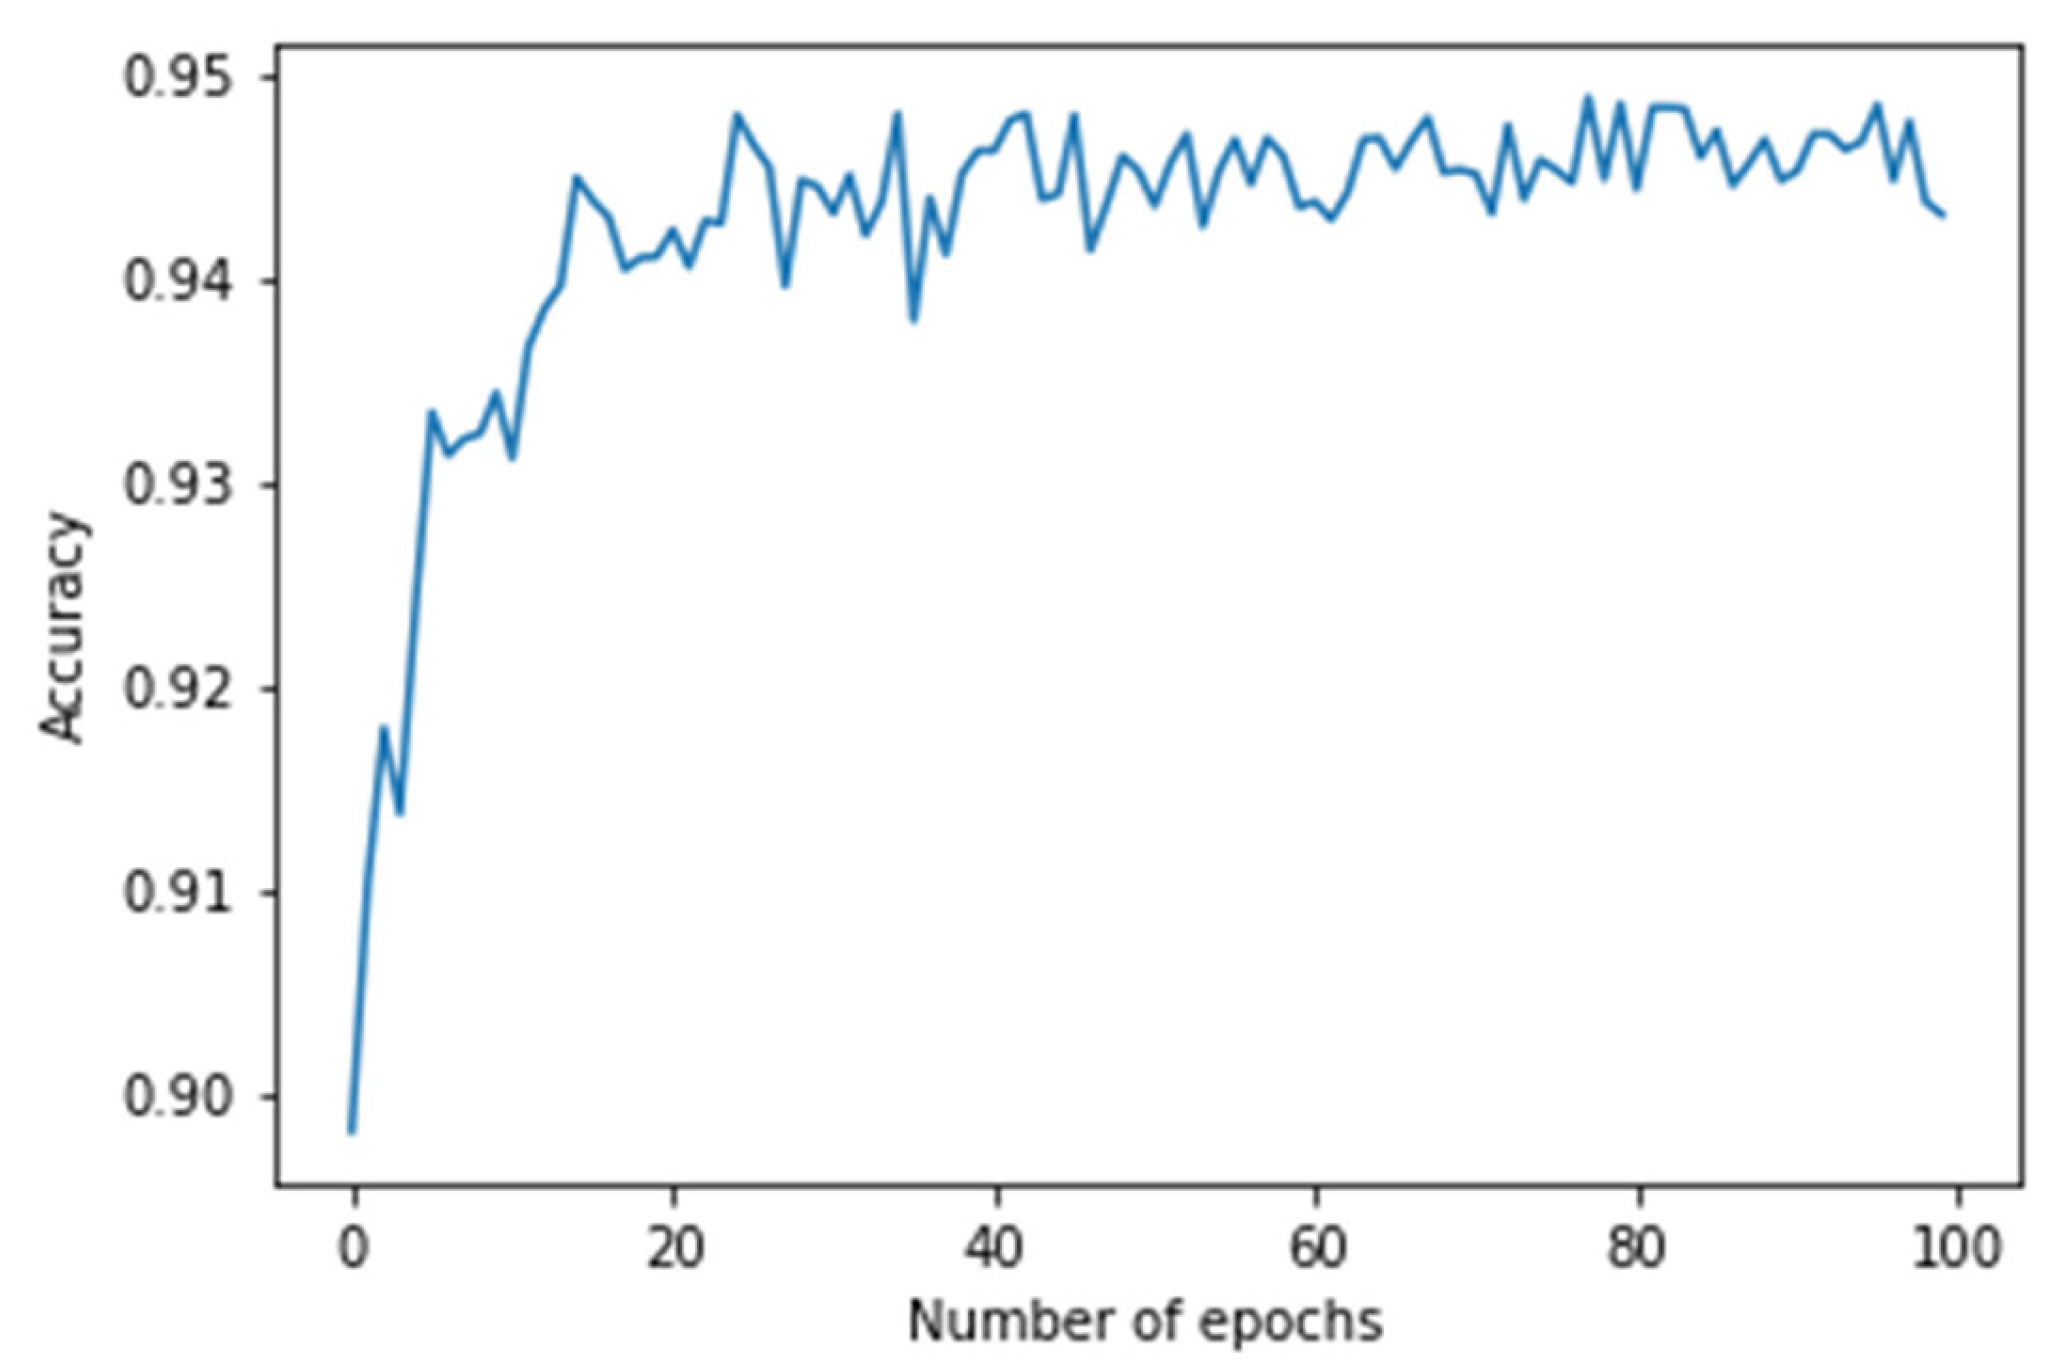
5.1. WESAD Dataset
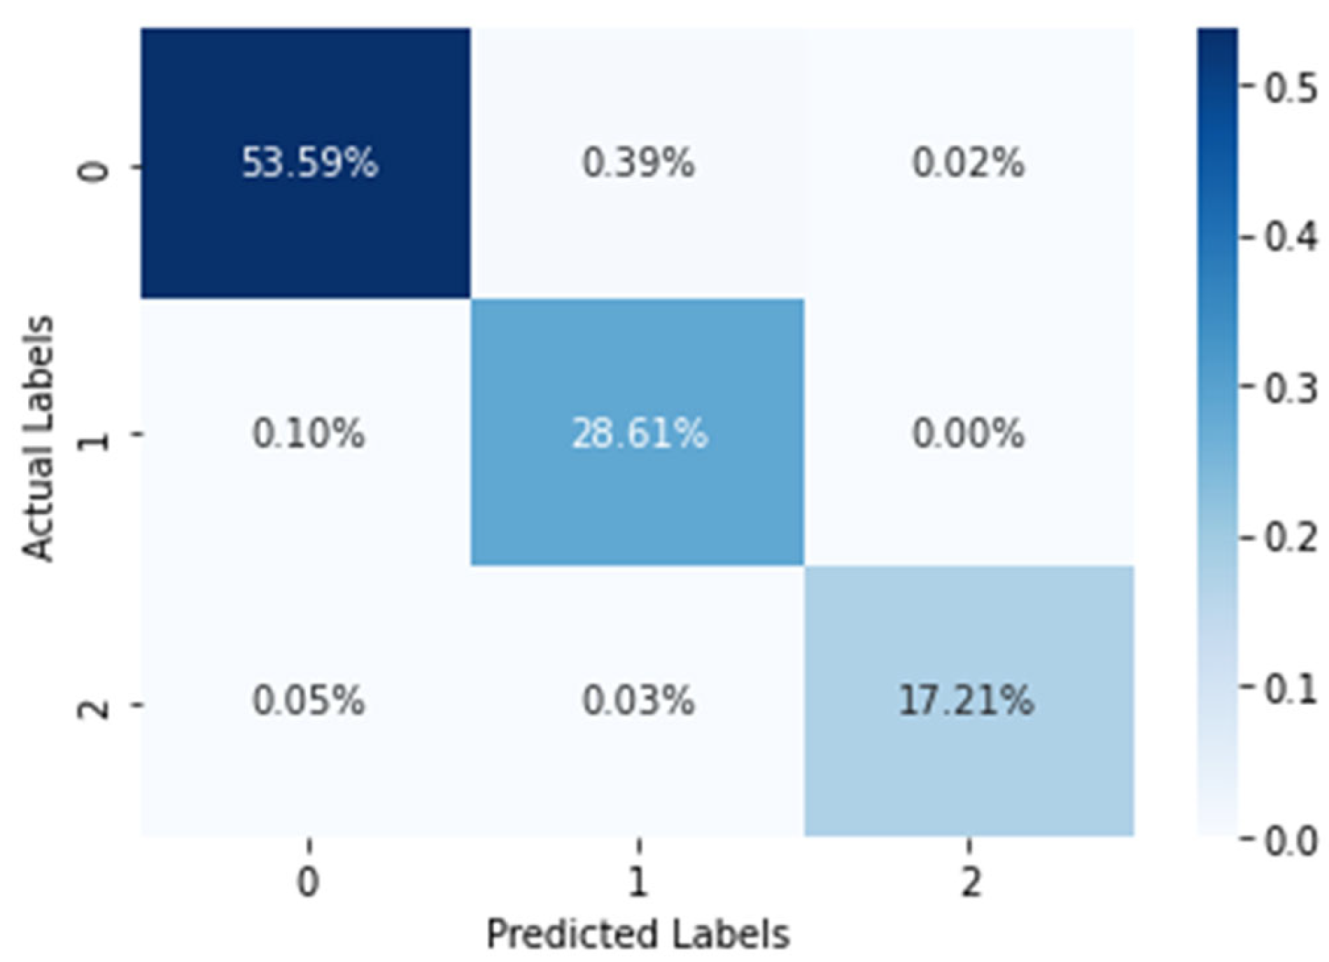
5.2. SWELL Dataset
5.3. Summarization of Results
5.4. Comparison with Existing Stress Recognition Models
6. Conclusions and Future Works
Author Contributions
Funding
Institutional Review Board Statement
Informed Consent Statement
Data Availability Statement
Code Availability Statement
Conflicts of Interest
References
- Depression. Available online: https://www.who.int/news-room/fact-sheets/detail/depression (accessed on 10 October 2022).
- Bobade, P.; Vani, M. Stress detection with machine learning and deep learning using multimodal physiological data. In Proceedings of the 2020 Second International Conference on Inventive Research in Computing Applications (ICIRCA), Coimbatore, India, 15–17 July 2020; pp. 51–57. [Google Scholar]
- Stress Symptoms. Available online: https://www.webmd.com/balance/stress-management/stress-symptoms-effects_of-stress-on-the-body (accessed on 10 October 2022).
- Stress Effects on the Body. Available online: https://www.apa.org/topics/stress/body (accessed on 10 October 2022).
- Alberdi, A.; Aztiria, A.; Basarab, A. Towards an automatic early stress recognition system for office environments based on multimodal measurements: A review. J. Biomed. Inform. 2016, 59, 49–75. [Google Scholar] [CrossRef] [PubMed]
- Wijsman, J.; Grundlehner, B.; Liu, H.; Penders, J.; Hermens, H. Wearable physiological sensors reflect mental stress state in office-like situations. In Proceedings of the 2013 Humaine Association Conference on Affective Computing and Intelligent Interaction, Geneva, Switzerland, 2–5 September 2013; pp. 600–605. [Google Scholar]
- Liao, W.; Zhang, W.; Zhu, Z.; Ji, Q. A real-time human stress monitoring system using dynamic bayesian network. In Proceedings of the 2005 IEEE Computer Society Conference on Computer Vision and Pattern Recognition (CVPR’05)-Workshops, San Diego, CA, USA, 21–23 September 2005; p. 70. [Google Scholar]
- Heart Rate Variability. Available online: https://www.sciencedirect.com/topics/medicine-and-dentistry/heart-rate-variability (accessed on 10 October 2022).
- Okada, Y.; Yoto, T.Y.; Suzuki, T.A.; Sakuragawa, S.; Mineta, H.; Sugiura, T. Wearable ECG recorder with acceleration sensors for measuring daily stress. In Proceedings of the 5th Kuala Lumpur International Conference on Biomedical Engineering 2011, Kuala Lumpur, Malaysia, 20–23 June 2011; Springer: Berlin, Heidelberg; pp. 371–374. [Google Scholar]
- Carneiro, D.; Castillo, J.C.; Novais, P.; Fernández-Caballero, A.; Neves, J. Multimodal behavioral analysis for non-invasive stress detection. Expert Syst. Appl. 2012, 39, 13376–13389. [Google Scholar] [CrossRef] [Green Version]
- Sharma, N.; Gedeon, T. Objective measures, sensors and computational techniques for stress recognition and classification: A survey. Comput. Methods Programs Biomed. 2012, 108, 1287–1301. [Google Scholar] [CrossRef] [PubMed]
- Philip Schmidt, A.; Reiss, R. Duerichen, Kristof Van Laerhoven, Introducing WESAD, a multimodal dataset for wearable Stress and Affect Detection. In Proceedings of the International Conference on Multimodal Interaction 2018, Boulder, CO, USA, 16–20 October 2018. [Google Scholar]
- SWELL Dataset. Available online: https://www.kaggle.com/datasets/qiriro/swell-heart-rate-variability-hrv (accessed on 10 October 2022).
- De Souza, A.; Melchiades, M.B.; Rigo, S.J.; Ramos, G.D.O. MoStress: A Sequence Model for Stress Classification. In Proceedings of the 2022 International Joint Conference on Neural Networks (IJCNN), Padua, Italy, 18–23 July 2022; pp. 1–8. [Google Scholar]
- Rashid, N.; Mortlock, T.; Al Faruque, M.A. SELF-CARE: Selective Fusion with Context-Aware Low-Power Edge Computing for Stress Detection. In Proceedings of the 2022 18th International Conference on Distributed Computing in Sensor Systems (DCOSS), Marina del Rey, Los Angeles, CA, USA, 30 May 2022–1 June 2022; pp. 49–52. [Google Scholar]
- Sah, R.K.; Ghasemzadeh, H. Stress Classification and Personalization: Getting the most out of the least. arXiv 2021, arXiv:2107.05666. [Google Scholar]
- Ghosh, S.; Mukhopadhyay, S.; Gupta, R. A New Physiology-based Objective Mental Stress Detection Technique with Reduced Feature Set and Class Imbalanced Dataset Management. In Proceedings of the 2021 IEEE International Conference on Technology, Research, and Innovation for Betterment of Society (TRIBES), Raipur, India, 17–19 December 2021; pp. 1–6. [Google Scholar]
- Chatterjee, D.; Dutta, S.; Shaikh, R.; Saha, S.K. A lightweight deep neural network for detection of mental states from physiological signals. Innov. Syst. Softw. Eng. 2022, 1–8. [Google Scholar] [CrossRef]
- Sharma, R.; Rani, S.; Gupta, D. Stress detection using machine learning classifiers in internet of things environment. J. Comput. Theor. Nanosci. 2019, 16, 4214–4219. [Google Scholar]
- Ragav, A.; Gudur, G.K. Bayesian active learning for wearable stress and affect detection. arXiv 2020, arXiv:2012.02702. [Google Scholar]
- Appiah, A.B. Detection and Monitoring of Work-Related Stress Using Heart Rate Variability. Master’s Thesis, Department of Information Engineering, Universita Politecnica Delle Marche, Ancona, Italy, 2022. [Google Scholar]
- Koldijk, S.; Neerincx, M.A.; Kraaij, W. Detecting work stress in offices by combining unobtrusive sensors. IEEE Trans. Affect. Comput. 2016, 9, 227–239. [Google Scholar] [CrossRef] [Green Version]
- Nkurikiyeyezu, K.; Shoji, K.; Yokokubo, A.; Lopez, G. Thermal Comfort and Stress Recognition in Office Environment. In Proceedings of the 12th International Joint Conference on Biomedical Engineering Systems and Technologies, Prague, Czech Republic, 22–24 February 2019; pp. 256–263. [Google Scholar]
- Shotton, J.; Sharp, T.; Kohli, P.; Nowozin, S.; Winn, J.; Criminisi, A. Decision jungles: Compact and rich models for classification. Adv. Neural Inf. Process. Syst. 2013, 26, 1–9. [Google Scholar]
- Encoding Time Series as Images. Available online: https://medium.com/analytics-vidhya/encoding-time-series-as-images-b043becbdbf3 (accessed on 20 September 2022).
- Gram Matrix. Available online: https://en.wikipedia.org/wiki/Gram_matrix (accessed on 20 September 2022).
- Classification: Precision and Recall. Available online: https://developers.google.com/machine-learning/crash-course/classification/precision-and-recall (accessed on 9 October 2022).
- F Score. Available online: https://deepai.org/machine-learning-glossary-and-terms/f-score (accessed on 9 October 2022).
- Garg, P.; Santhosh, J.; Dengel, A.; Ishimaru, S. Stress Detection by Machine Learning and Wearable Sensors. In Proceedings of the 26th International Conference on Intelligent User Interfaces-Companion, College Station, TX, USA, 14–17 April 2021; pp. 43–45. [Google Scholar]
- Wang, Z.; Oates, T. Encoding time series as images for visual inspection and classification using tiled convolutional neural networks. In Proceedings of the Workshops at the Twenty-Ninth AAAI Conference on Artificial Intelligence, 25–30 January 2015. [Google Scholar]
- Hatami, N.; Gavet, Y.; Debayle, J. Classification of time-series images using deep convolutional neural networks. In Proceedings of the Tenth international conference on machine vision (ICMV 2017), Vienna, Austria, 13–15 November 2017; Volume 10696, pp. 242–249. [Google Scholar]
- Chen, J.H.; Tsai, Y.C. Encoding candlesticks as images for pattern classification using convolutional neural networks. Financ. Innov. 2020, 6, 26. [Google Scholar] [CrossRef]
- Xu, H.; Li, J.; Yuan, H.; Liu, Q.; Fan, S.; Li, T.; Sun, X. Human activity recognition based on Gramian angular field and deep convolutional neural network. IEEE Access 2020, 8, 199393–199405. [Google Scholar]
- Bragin, A.D.; Spitsyn, V.G. Electroencephalogram analysis based on gramian angular fieldtransformation. In Proceedings of the 29th International Conference on Computer Graphics and Vision (GraphiCon 2019), Bryansk, Russia, 23–26 September 2019; pp. 273–275. [Google Scholar]
- Walambe, R.; Nayak, P.; Bhardwaj, A.; Kotecha, K. Employing Multimodal Machine Learning for Stress Detection. J. Healthc. Eng. 2021, 2021, 9356452. [Google Scholar]
- Han, B.; Zhang, H.; Sun, M.; Wu, F. A New Bearing Fault Diagnosis Method Based on Capsule Network and Markov Transition Field/Gramian Angular Field. Sensors 2021, 21, 7762. [Google Scholar] [PubMed]
- Kumar, A.; Sharma, K.; Sharma, A. Hierarchical deep neural network for mental stress state detection using IoT based biomarkers. Pattern Recognit. Lett. 2021, 145, 81–87. [Google Scholar] [CrossRef]
- Gil-Martin, M.; San-Segundo, R.; Mateos, A.; Ferreiros-Lopez, J. Human stress detection with wearable sensors using convolutional neural networks. IEEE Aerosp. Electron. Syst. Mag. 2022, 37, 60–70. [Google Scholar] [CrossRef]
- Eren, E.; Navruz, T.S. Stress Detection with Deep Learning Using BVP and EDA Signals. In Proceedings of the 2022 International Congress on Human-Computer Interaction, Optimization and Robotic Applications (HORA), Ankara, Turkey, 9–11 June 2022; pp. 1–7. [Google Scholar]
- Jambhale, K.; Mahajan, S.; Rieland, B.; Banerjee, N.; Dutt, A.; Kadiyala, S.P.; Vinjamuri, R. Identifying Biomarkers for Accurate Detection of Stress. Sensors 2022, 22, 8703. [Google Scholar] [CrossRef] [PubMed]
- Iqbal, T.; Redon-Lurbe, P.; Simpkin, A.J.; Elahi, A.; Ganly, S.; Wijns, W.; Shahzad, A. A sensitivity analysis of biophysiological responses of stress for wearable sensors in connected health. IEEE Access 2021, 9, 93567–93579. [Google Scholar]
- Mohammadi, A.; Fakharzadeh, M.; Baraeinejad, B. An Integrated Human Stress Detection Sensor Using Supervised Algorithms. IEEE Sens. J. 2022, 22, 8216–8223. [Google Scholar] [CrossRef]
- Khan, N.; Sarkar, N. Semi-Supervised Generative Adversarial Network for Stress Detection Using Partially Labeled Physiological Data. arXiv 2022, arXiv:2206.14976. [Google Scholar]
- Albaladejo-González, M.; Ruipérez-Valiente, J.A.; Gómez Mármol, F. Evaluating different configurations of machine learning models and their transfer learning capabilities for stress detection using heart rate. J. Ambient. Intell. Humaniz. Comput. 2022, 1–11. [Google Scholar] [CrossRef]


| Layer (Type) | Activation Function | Output Shape | Parameters |
|---|---|---|---|
| Conv 2D 1 | ReLU | (None,6,6,64) | 640 |
| Batch Normalization | - | (None,6,6,64) | 256 |
| Conv 2D 2 | ReLU | (None,4,4,64) | 36,928 |
| Batch Normalization | - | (None,4,4,64) | 256 |
| Conv 2D 2 | ReLU | (None,2,2,64) | 36,928 |
| Batch Normalization | - | (None,2,2,64) | 256 |
| Max Pooling Layer | - | (None,1,1,64) | 0 |
| Flatten | - | (None,64) | 0 |
| Dense Layer 1 | - | (None,6) | 390 |
| Output Dense Layer | Softmax | (None,4) | 28 |
| Stress Level | Accuracy | Precision | Recall | F1 Score |
|---|---|---|---|---|
| Meditation (0) | 94.55% | 0.92 | 0.95 | 0.93 |
| Baseline (1) | 95.15% | 0.97 | 0.95 | 0.96 |
| Stress (2) | 97.06% | 0.95 | 0.97 | 0.96 |
| Amusement (3) | 92.36% | 0.95 | 0.92 | 0.94 |
| Average | 94.77% | 0.95 | 0.95 | 0.95 |
| Stress Level | Accuracy | Precision | Recall | F1 Score |
|---|---|---|---|---|
| No Stress (0) | 99.84% | 0.99 | 1.00 | 1.00 |
| Time Pressure (1) | 99.20% | 1.00 | 0.99 | 0.99 |
| Interruption (2) | 99.14% | 1.00 | 0.99 | 0.99 |
| Average | 99.39% | 0.99 | 0.99 | 0.99 |
| Dataset | Training Accuracy | Testing Accuracy | F1 Score | Precision | Recall |
|---|---|---|---|---|---|
| WESAD | 99.43% | 94.77% | 0.95 | 0.95 | 0.95 |
| SWELL | 99.50% | 99.39% | 0.99 | 0.99 | 0.99 |
| Research Work [Ref.] | Model Used | Year of Publication | Testing Accuracy |
|---|---|---|---|
| Stress Detection with Machine Learning and Deep Learning using Multimodal Physiological Data. [4] | Machine learning techniques (K-Nearest Neighbour, Linear Discriminant Analysis, Random Forest, Decision Tree, AdaBoost, and Kernel Support Vector Machine) | 2020 | 84.32% |
| Stress Classification and Personalization: Getting the most out of the least. [16] | CNN | 2021 | 92.85% |
| A New Physiology-based Objective Mental Stress Detection Technique with Reduced Feature Set and Class Imbalanced Dataset Management. [17] | Machine learning techniques (Random Forest Classifier, Randomized Tree (ERT)) | 2021 | 97.08% |
| MoStress: a Sequence Model for Stress Classification. [14] | RNN | 2022 | 86% |
| Semi-Supervised Generative Adversarial Network for Stress Detection Using Partially Labeled Physiological Data. [43] | Semi-supervised learning (SSL) model | 2022 | 90.31% |
| Evaluating different configurations of machine learning models and their transfer learning capabilities for stress detection using heart rate [44] | Artificial Intelligence (AI) models, Supervised Multi-Layer Perceptron (MLP) | 2022 | 88.89% |
| Proposed work | CNN using GAF images | 2022 | 94.8% |
| Research Work | Model Used | Year of Publication | Testing Accuracy |
|---|---|---|---|
| Stress Detection Using Machine Learning Classifiers in Internet of Things Environment [19] | Machine learning methods along with IoT and cloud computing | 2019 | 98% |
| Bayesian active learning for wearable stress and affect detection [20] | Bayesian neural network technique using Monte-Carlo Dropout | 2020 | 90.38% |
| Employing Multimodal Machine Learning for Stress Detection [35] | Multimodal framework based on AI | 2021 | 96.09% |
| Proposed work | CNN using GAF images | 2022 | 99.39% |
Publisher’s Note: MDPI stays neutral with regard to jurisdictional claims in published maps and institutional affiliations. |
© 2022 by the authors. Licensee MDPI, Basel, Switzerland. This article is an open access article distributed under the terms and conditions of the Creative Commons Attribution (CC BY) license (https://creativecommons.org/licenses/by/4.0/).
Share and Cite
Ghosh, S.; Kim, S.; Ijaz, M.F.; Singh, P.K.; Mahmud, M. Classification of Mental Stress from Wearable Physiological Sensors Using Image-Encoding-Based Deep Neural Network. Biosensors 2022, 12, 1153. https://doi.org/10.3390/bios12121153
Ghosh S, Kim S, Ijaz MF, Singh PK, Mahmud M. Classification of Mental Stress from Wearable Physiological Sensors Using Image-Encoding-Based Deep Neural Network. Biosensors. 2022; 12(12):1153. https://doi.org/10.3390/bios12121153
Chicago/Turabian StyleGhosh, Sayandeep, SeongKi Kim, Muhammad Fazal Ijaz, Pawan Kumar Singh, and Mufti Mahmud. 2022. "Classification of Mental Stress from Wearable Physiological Sensors Using Image-Encoding-Based Deep Neural Network" Biosensors 12, no. 12: 1153. https://doi.org/10.3390/bios12121153