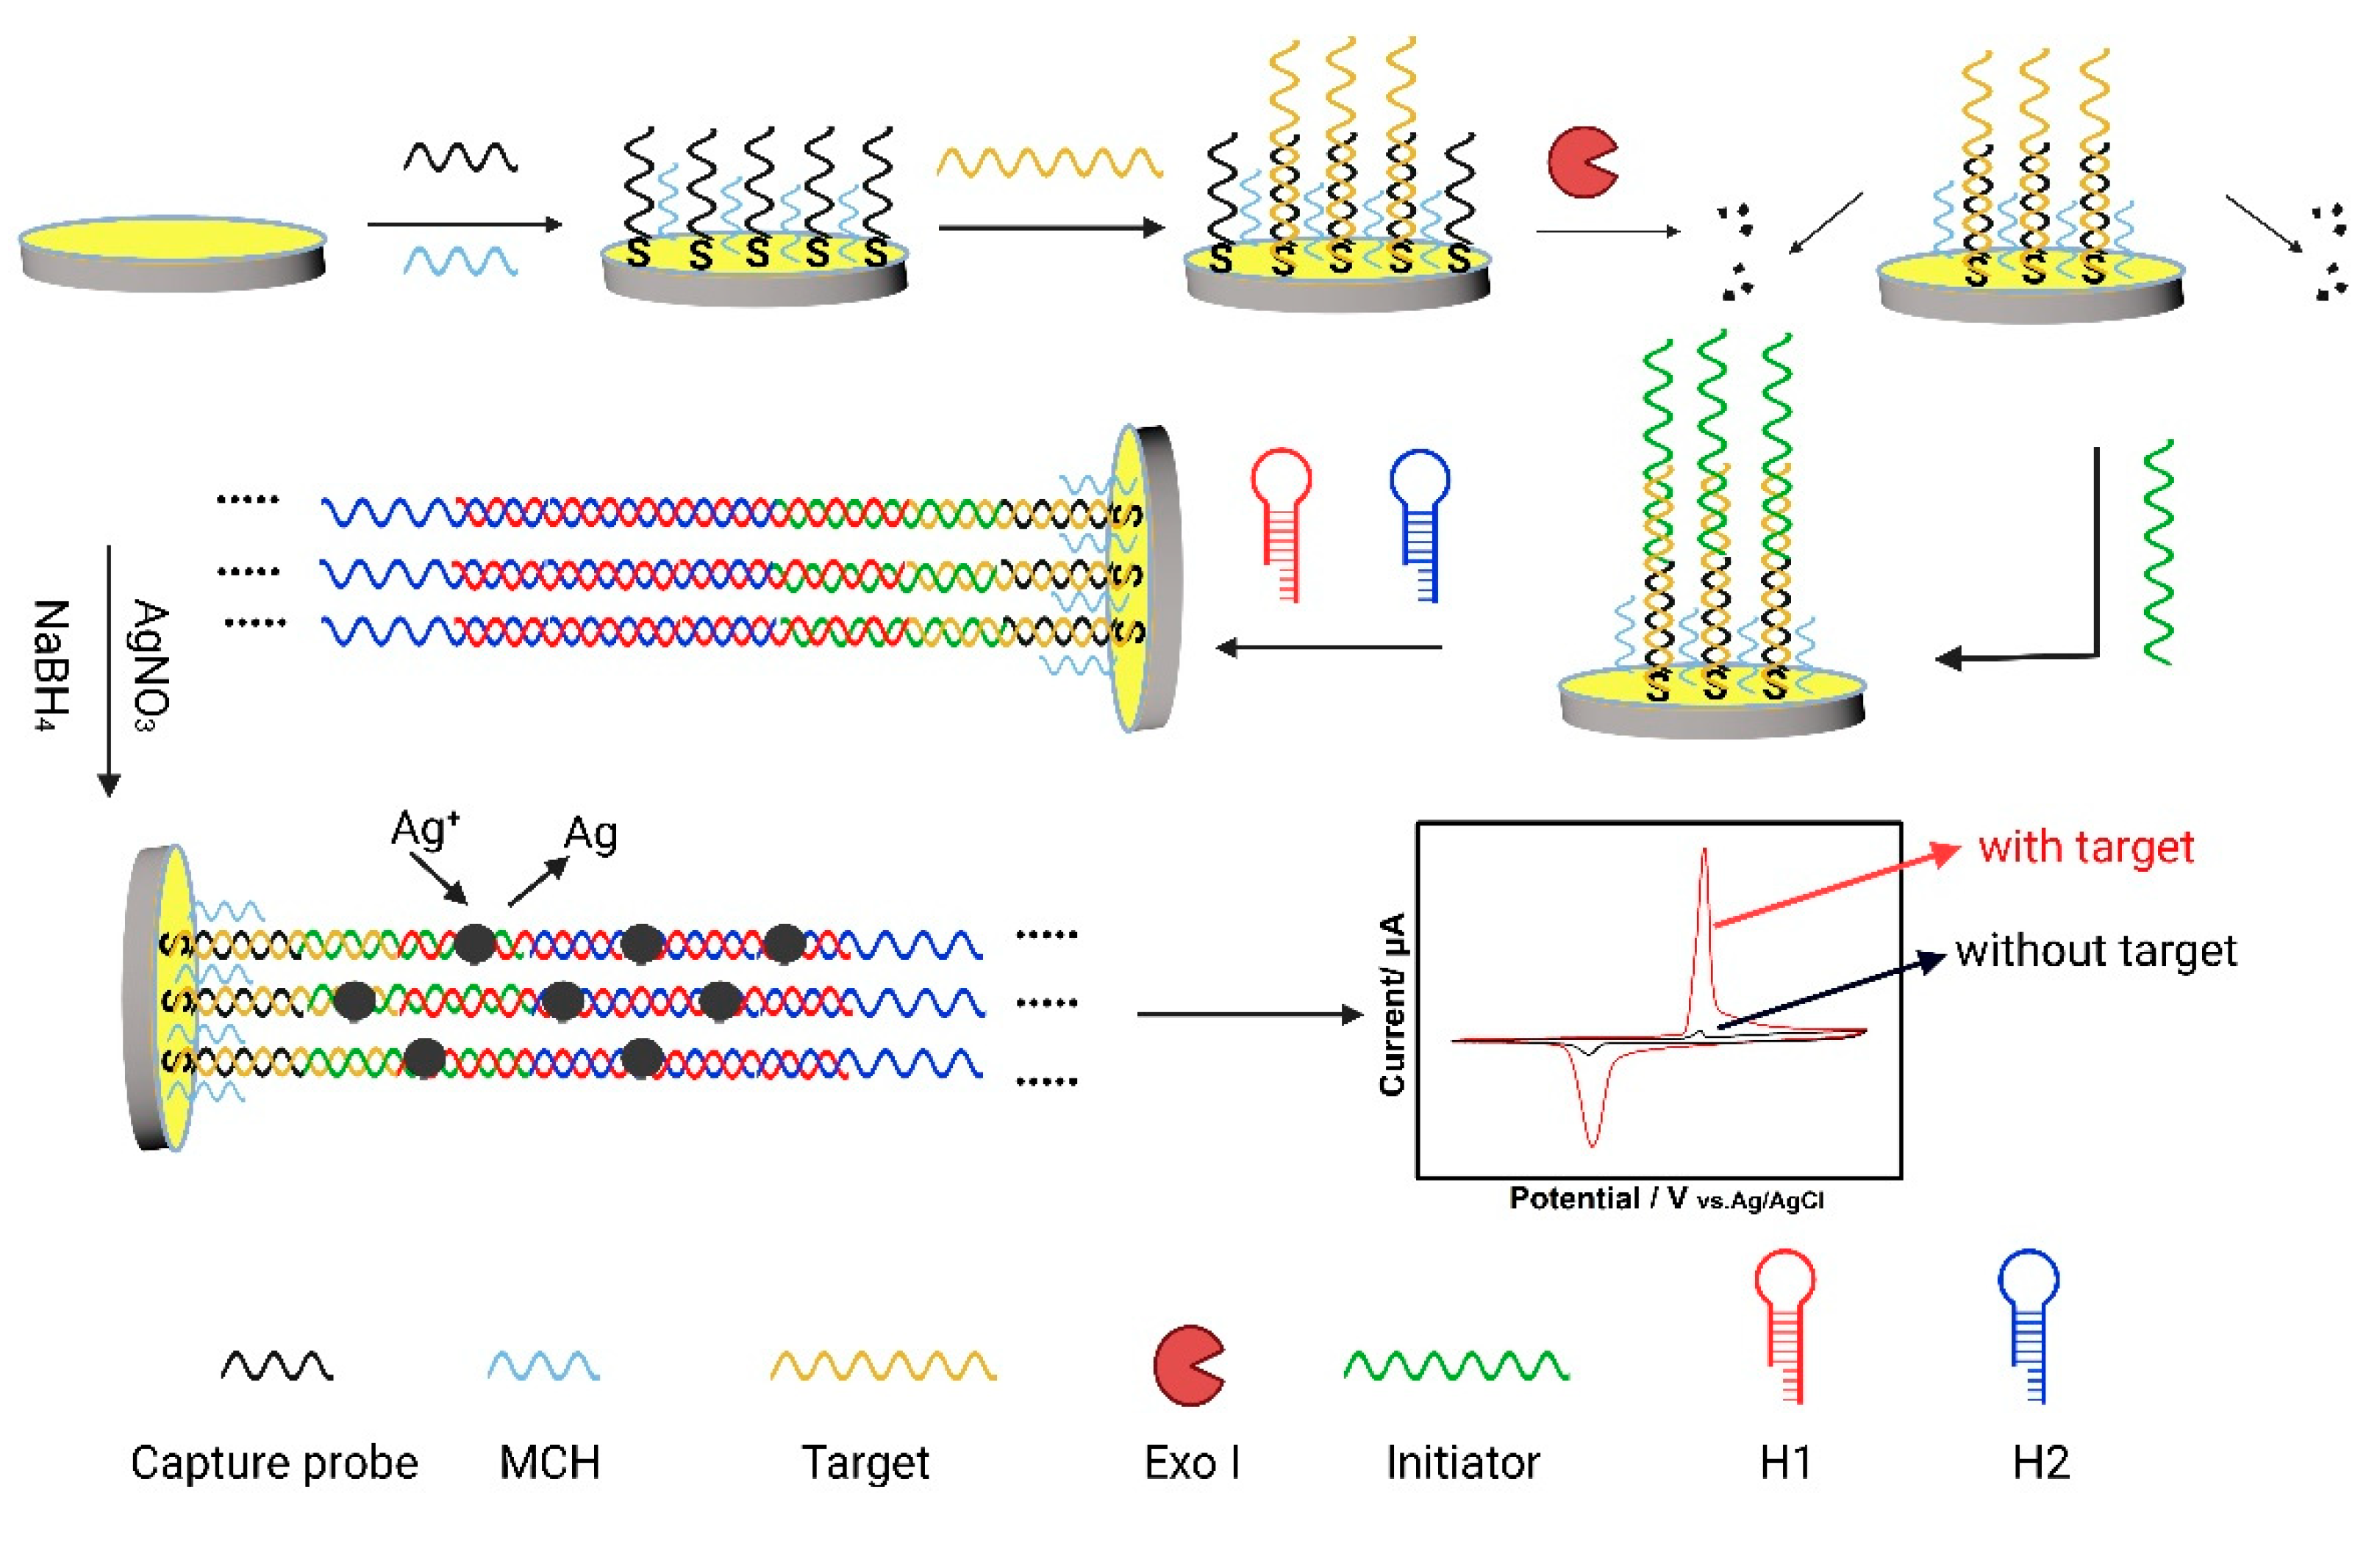
Target Recognition– and HCR Amplification–Induced In Situ Electrochemical Signal Probe Synthesis Strategy for Trace ctDNA Analysis

 , and
, and 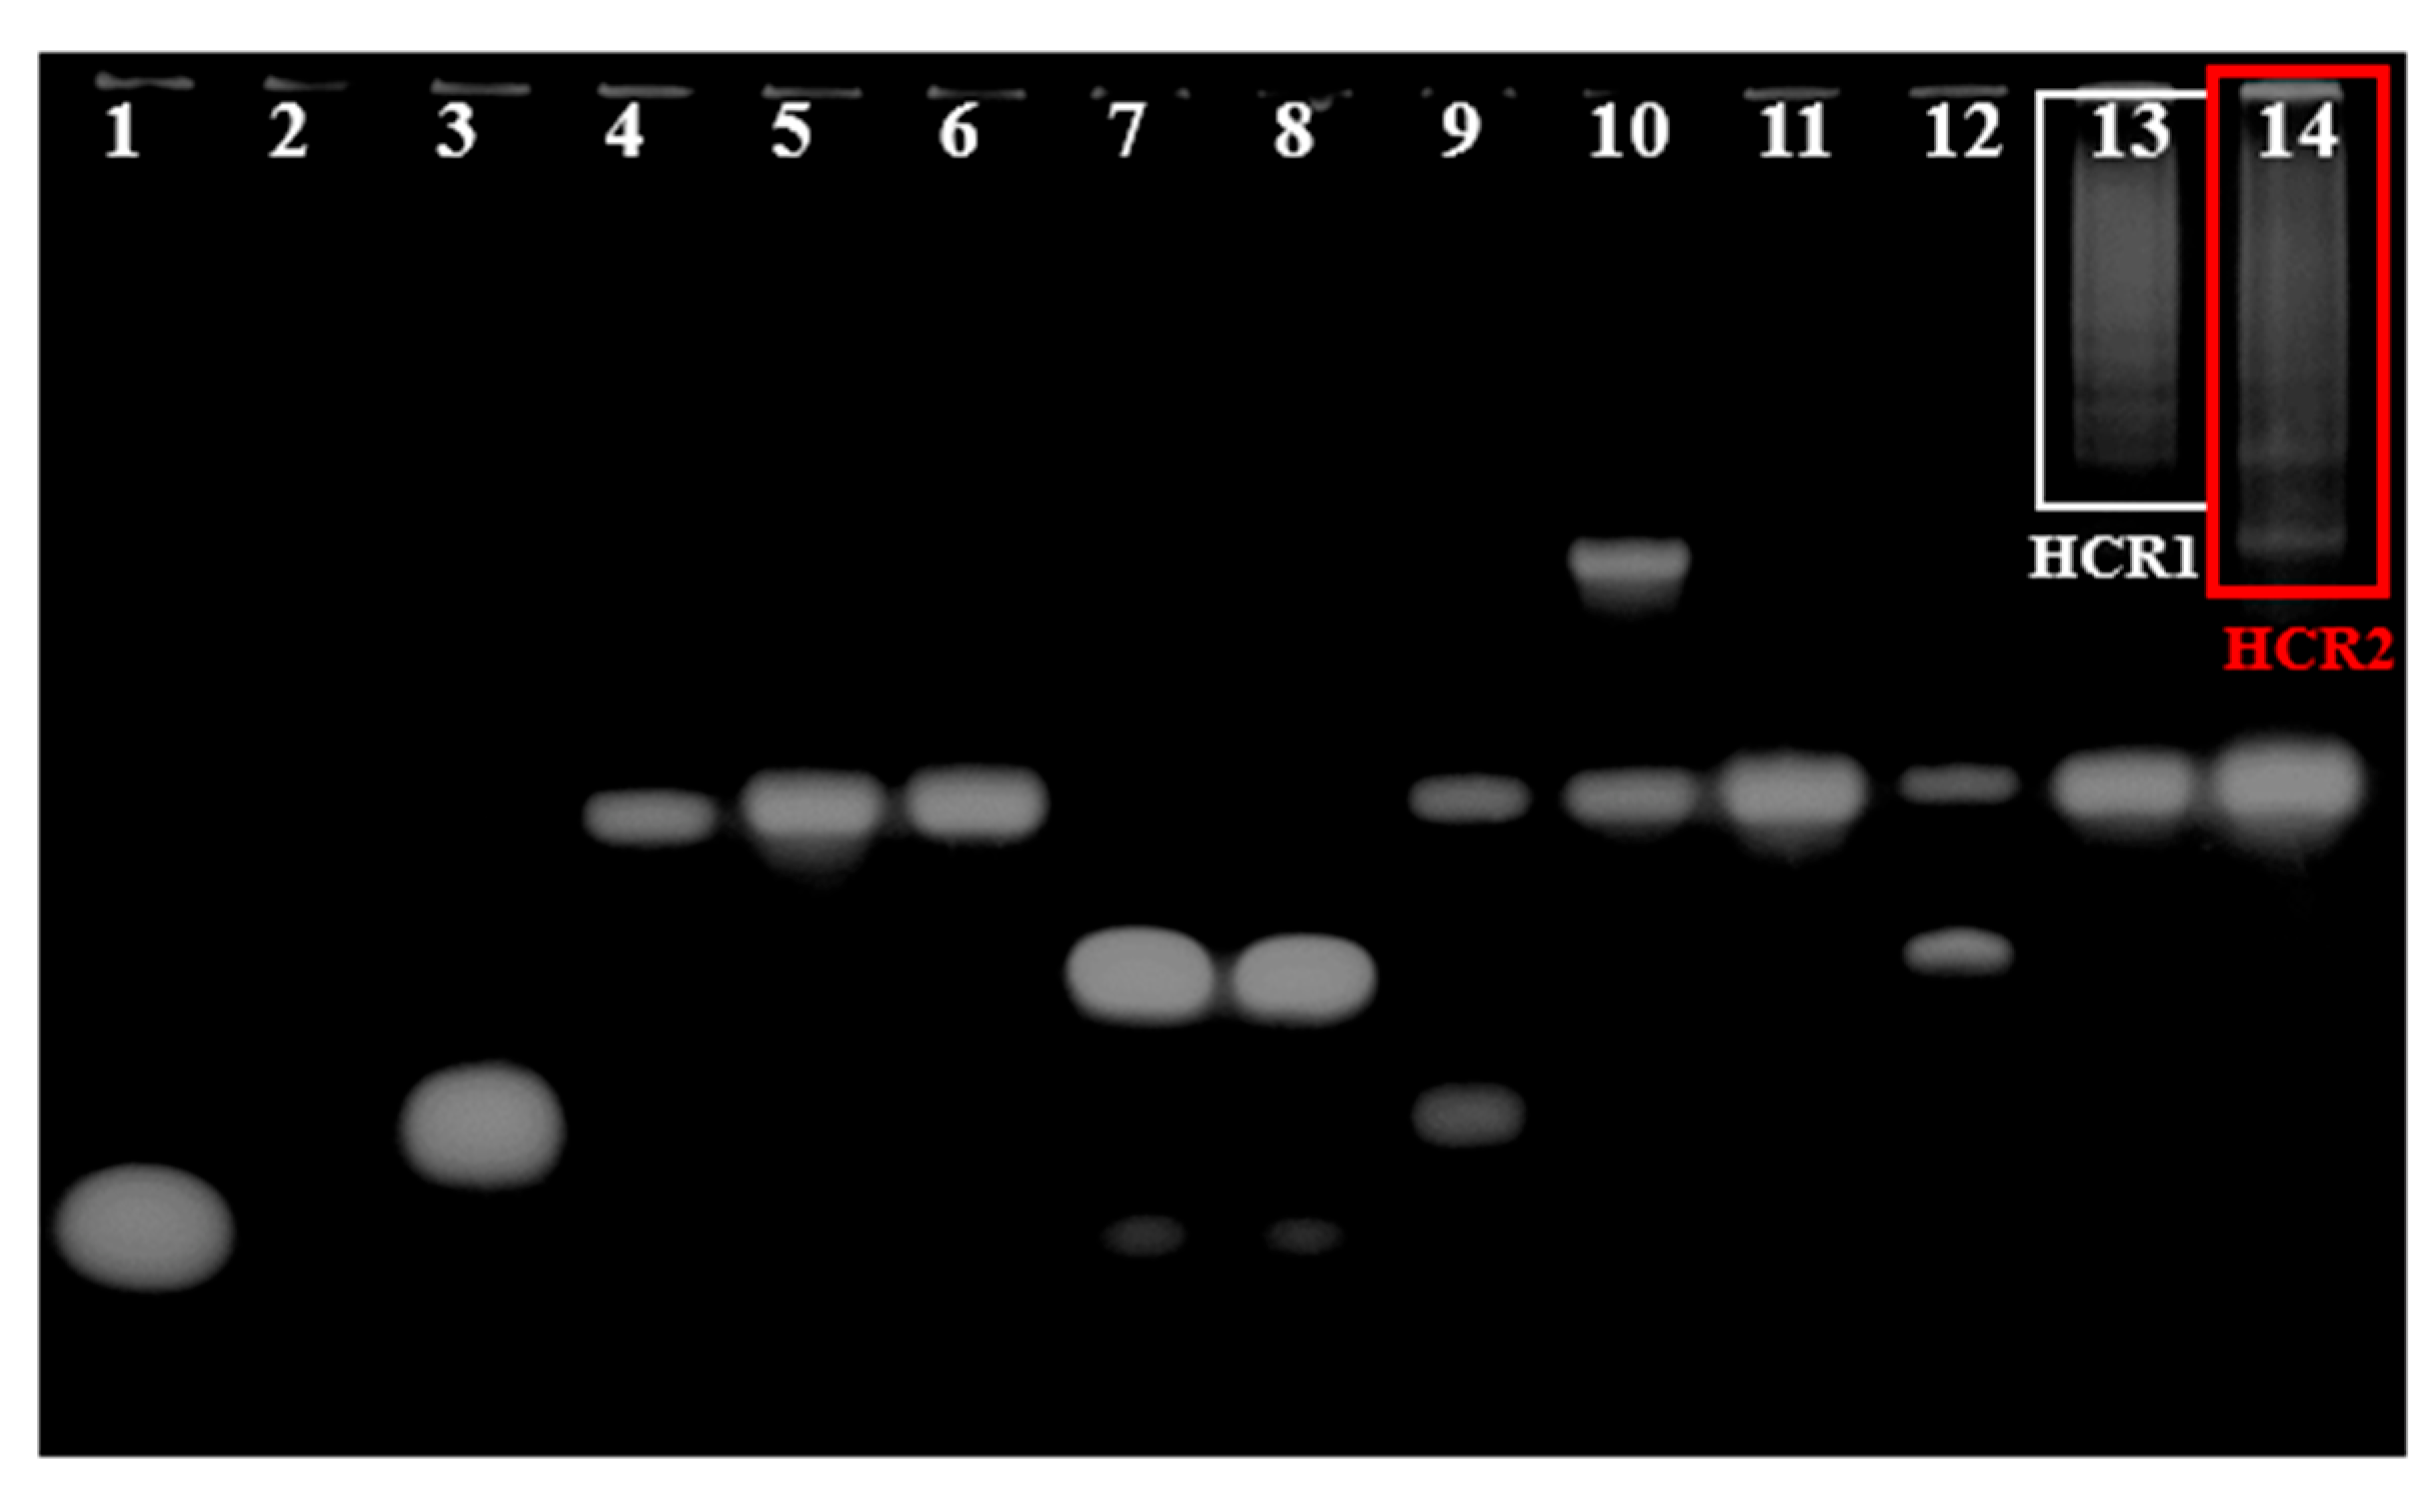
Abstract
:1. Introduction
2. Materials and Methods
2.1. Chemical Reagents and Materials
2.2. Apparatus
2.3. Fabrication of E-DNA Sensor
2.4. Electrochemical Measurements
2.5. Polyacrylamide Gel Electrophoresis (PAGE)
3. Results and Discussion
3.1. Feasibility Study of Exo Ι and HCR Assay (In Liquid Phase)
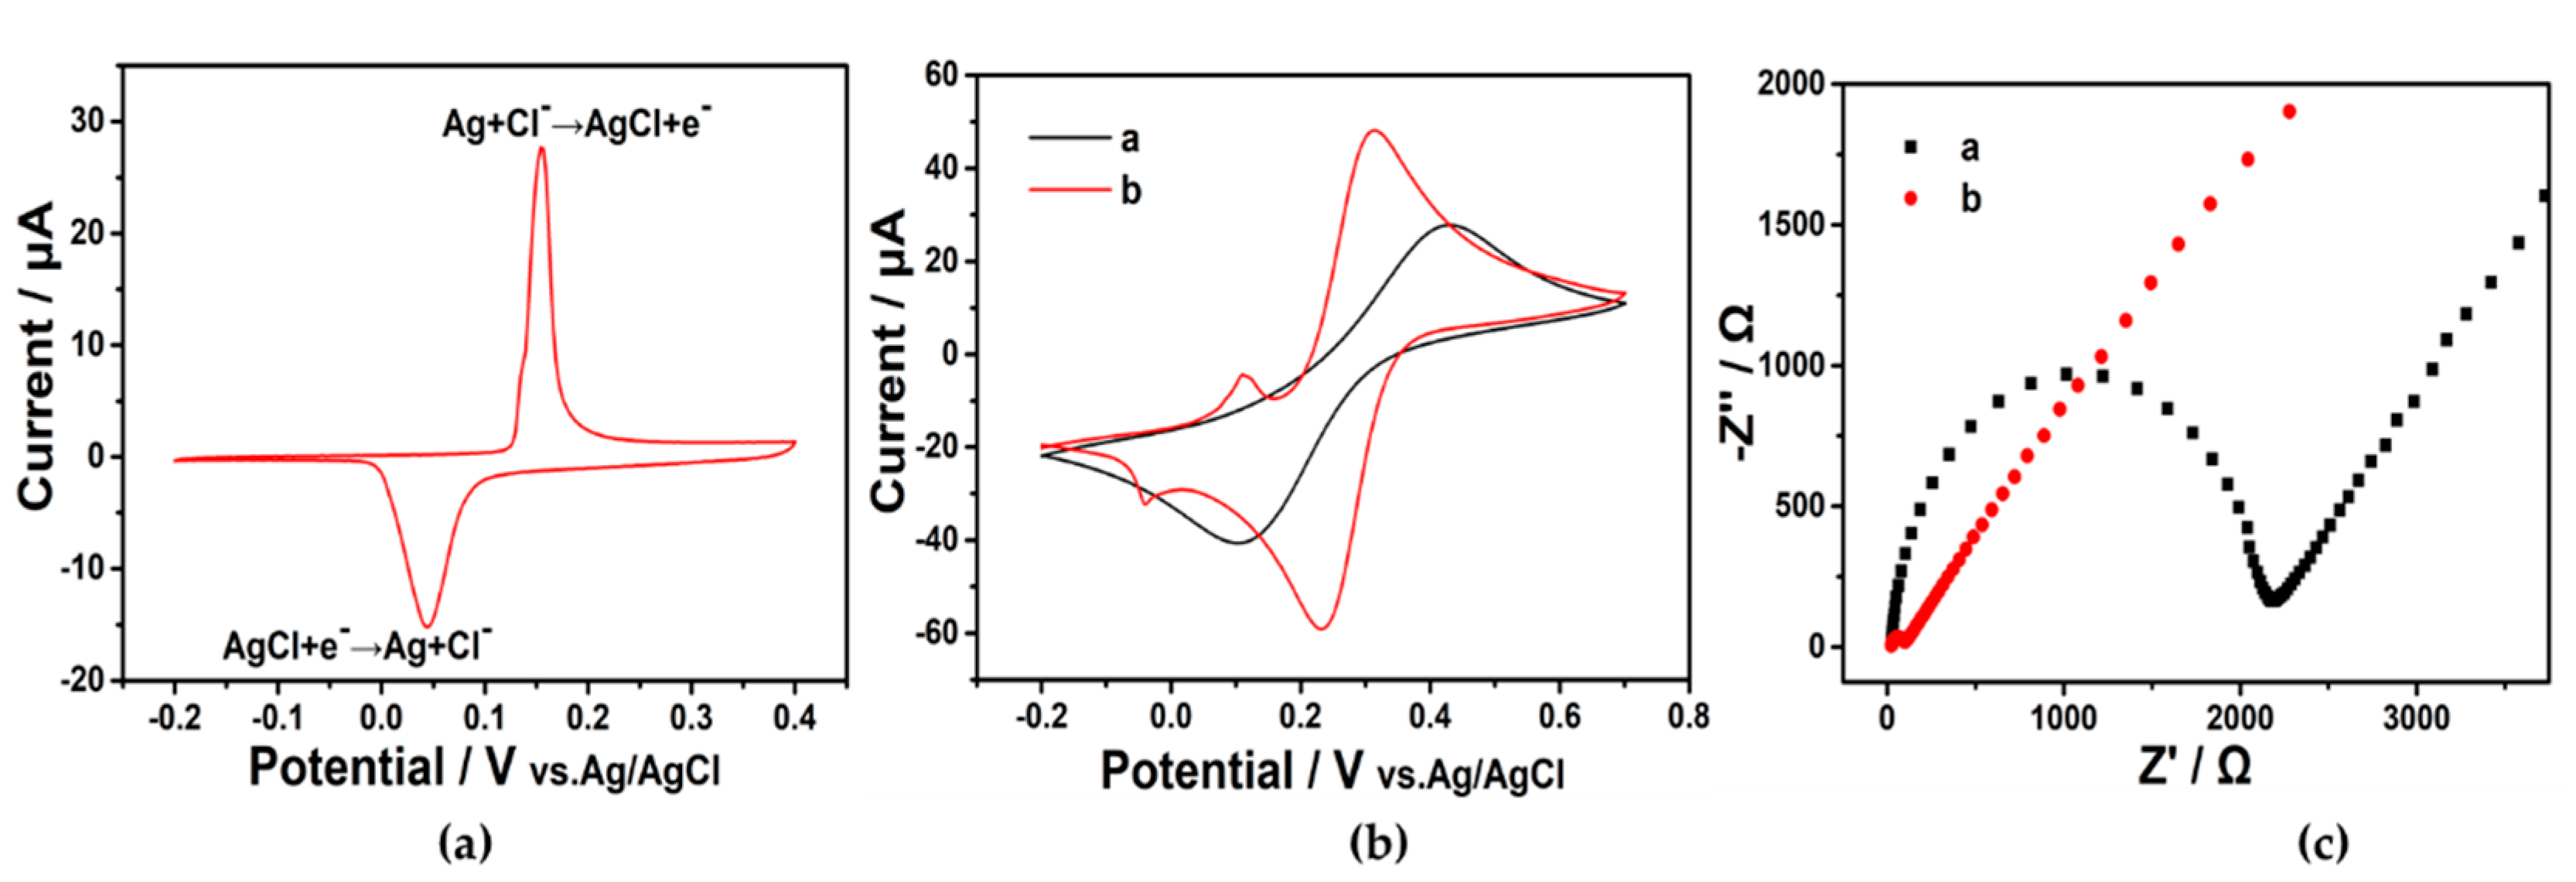
3.2. Verification of DNA Metallization
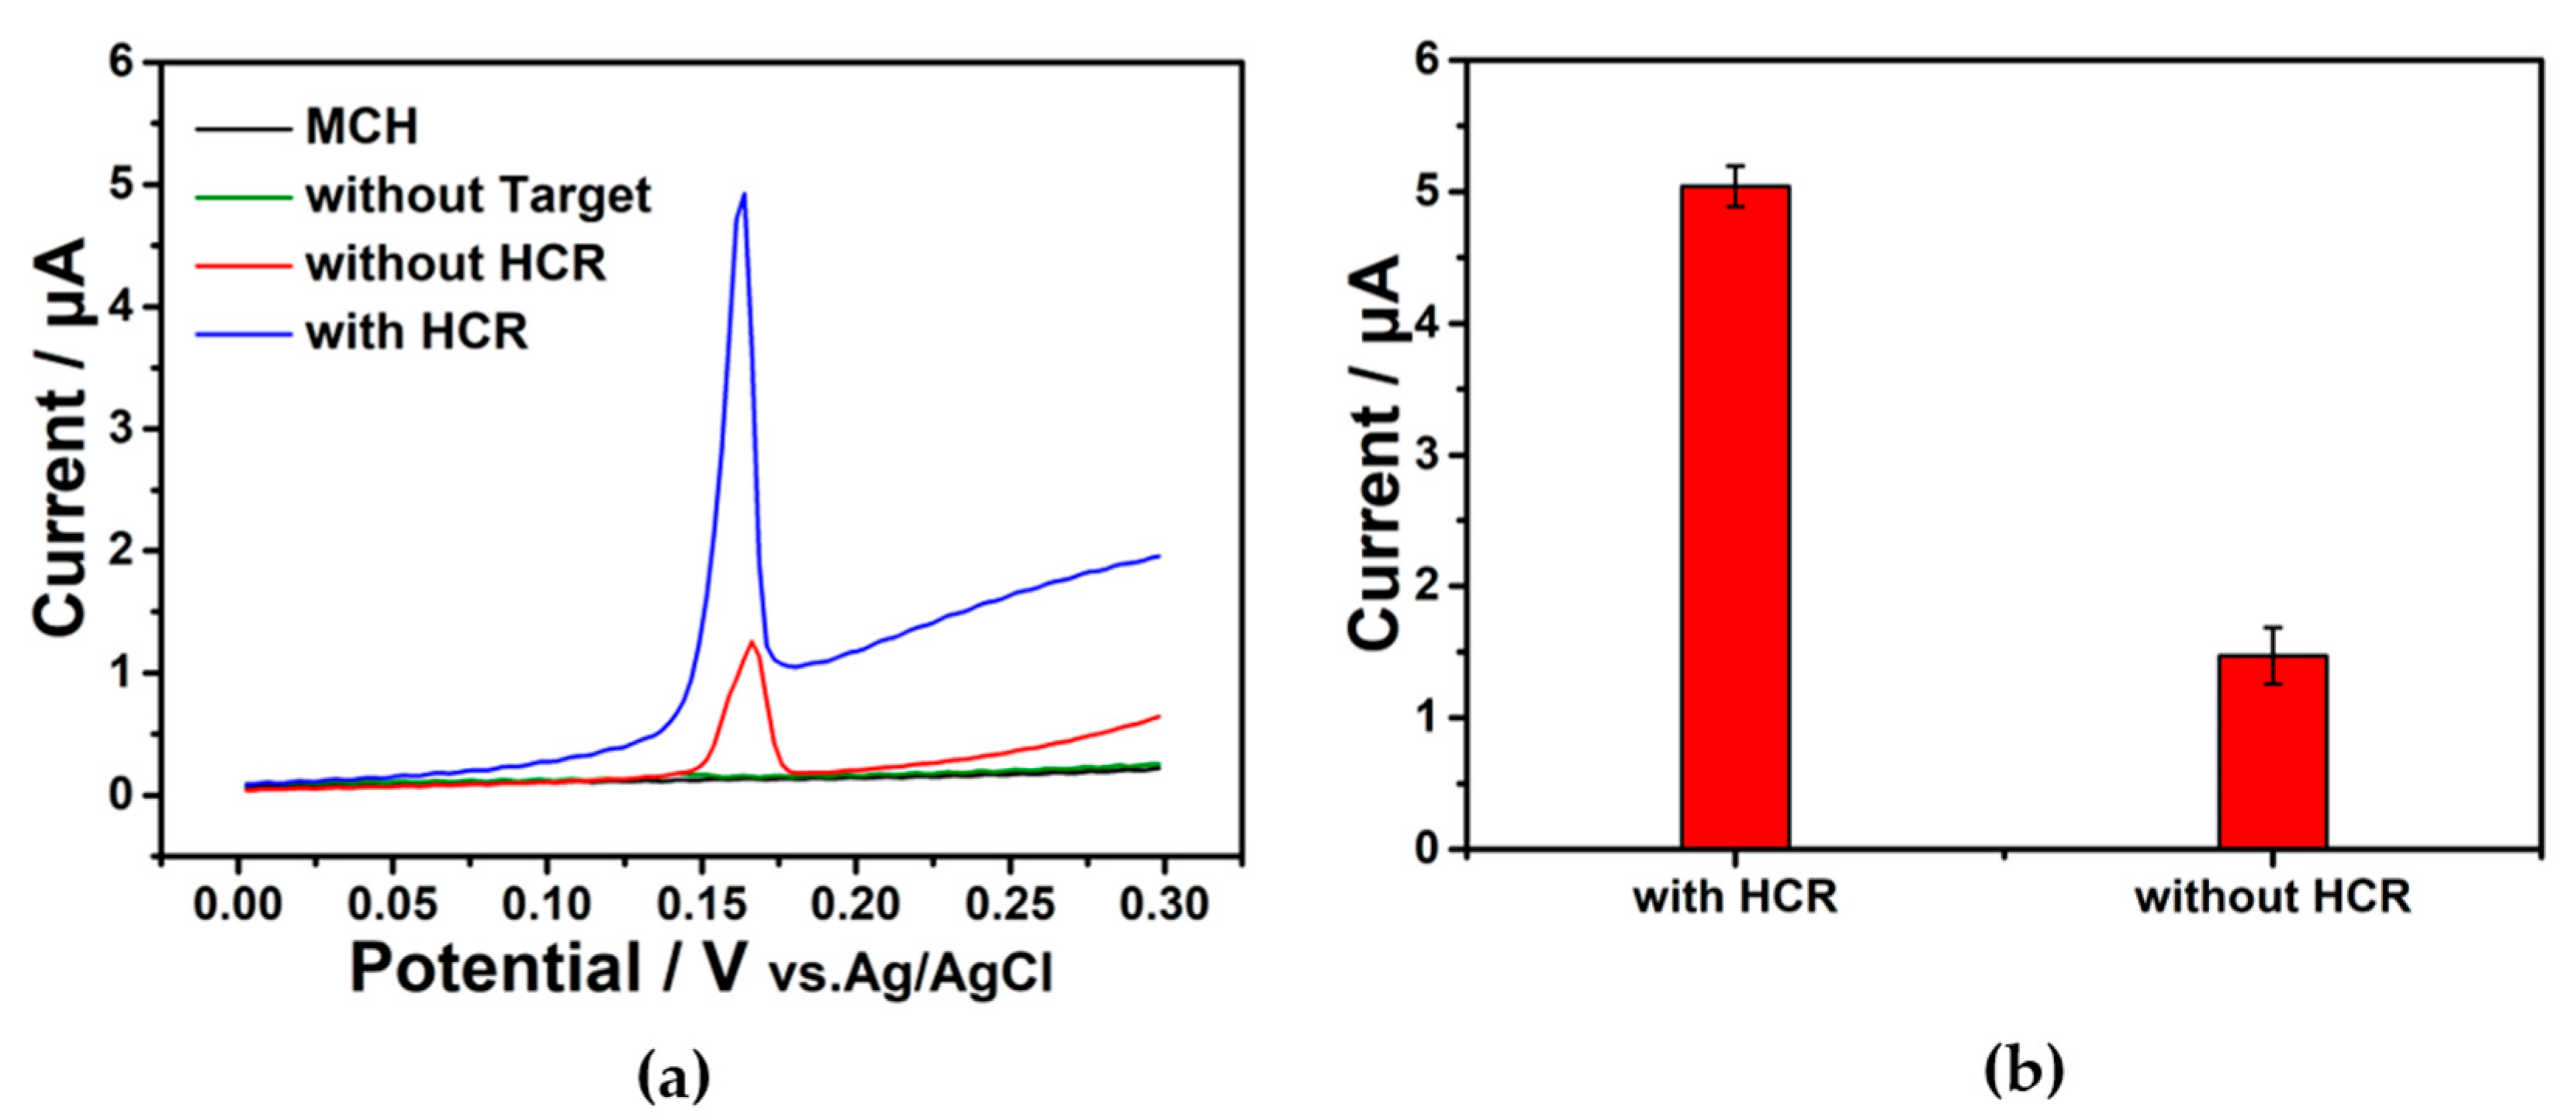
3.3. Exo Ι—Assisted Background Suppression Strategy
3.4. Signal Amplification of HCR
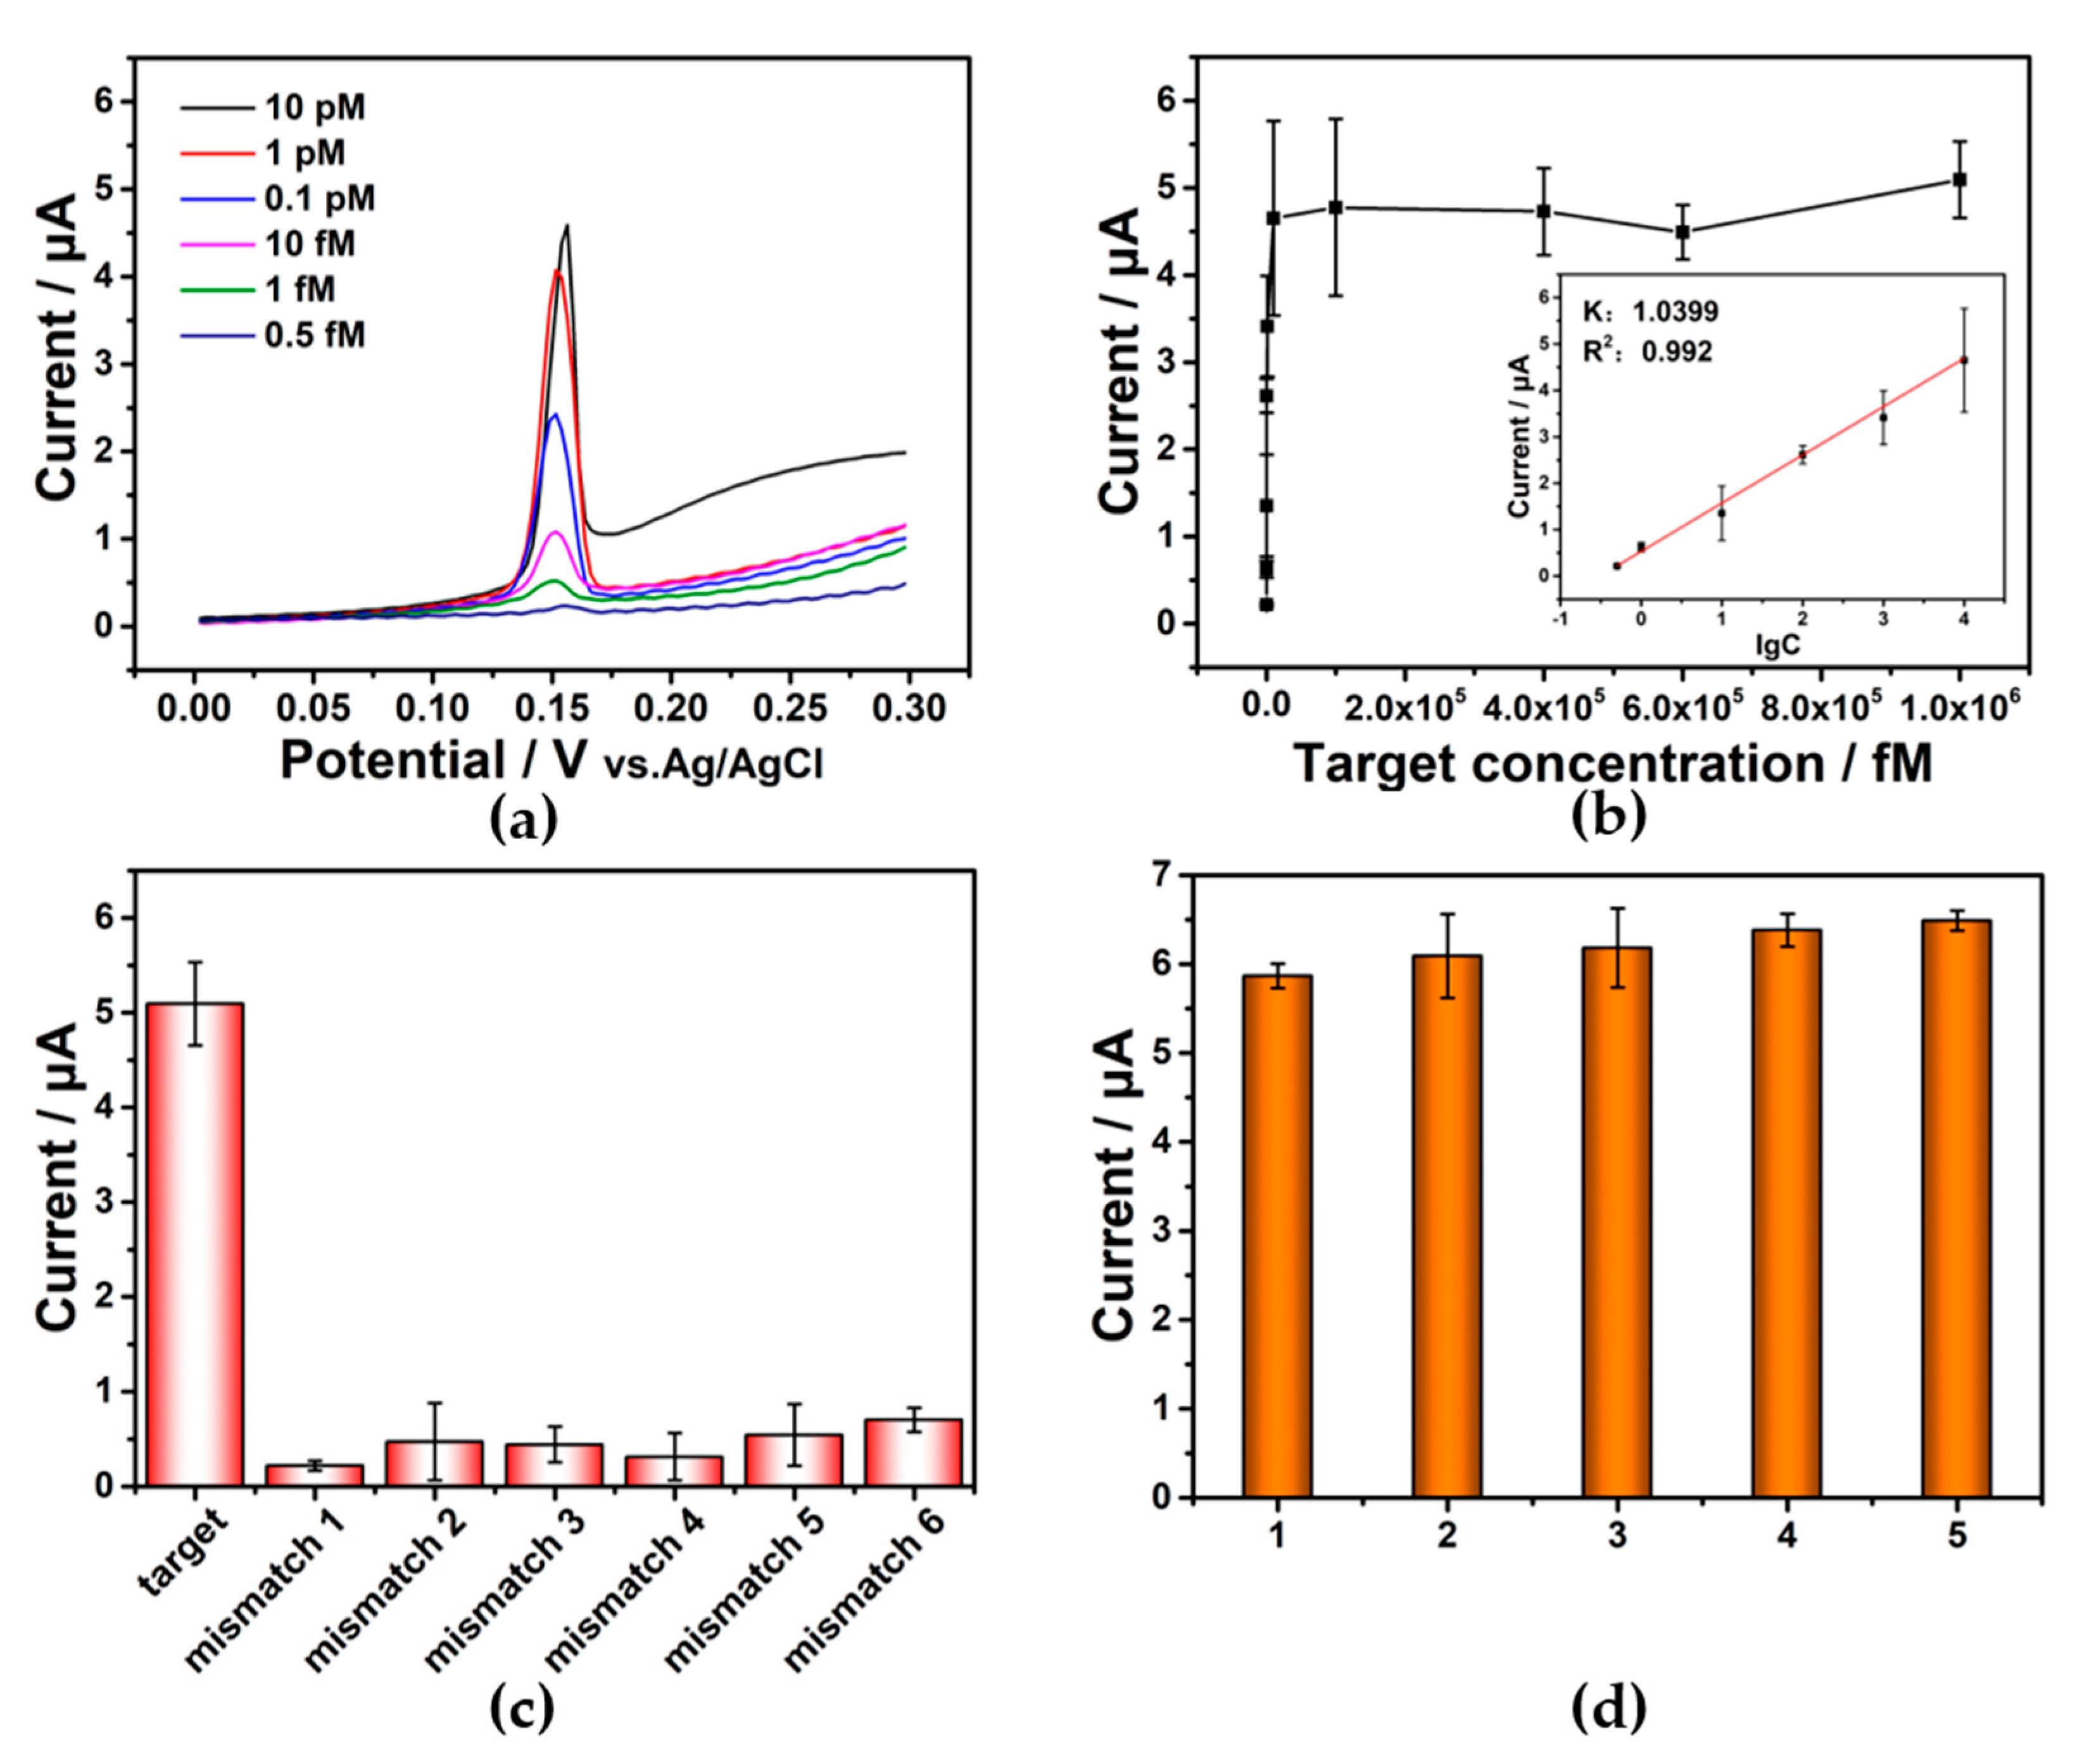
3.5. Performance of the Constructed EC-HCR Sensor
3.6. Real Sample Testing
4. Conclusions
Supplementary Materials
Author Contributions
Funding
Data Availability Statement
Conflicts of Interest
Abbreviations
References
- Ignatiadis, M.; Sledge, G.W.; Jeffrey, S.S. Liquid biopsy enters the clinic-implementation issues and future challenges. Nat. Rev. Clin. Oncol. 2021, 18, 297–312. [Google Scholar] [CrossRef] [PubMed]
- Hofman, P.; Heeke, S.; Alix-Panabières, C.; Pantel, K. Liquid biopsy in the era of immuno-oncology: Is it ready for prime-time use for cancer patients? Ann. Oncol. 2019, 30, 1448–1459. [Google Scholar] [CrossRef] [PubMed] [Green Version]
- Ye, Q.; Ling, S.; Zheng, S.; Xu, X. Liquid biopsy in hepatocellular carcinoma: Circulating tumor cells and circulating tumor DNA. Mol. Cancer 2019, 18, 114. [Google Scholar] [CrossRef]
- Pantel, K.; Alix-Panabieres, C. Liquid biopsy and minimal residual disease—Latest advances and implications for cure. Nat. Rev. Clin. Oncol. 2019, 16, 409–424. [Google Scholar] [CrossRef] [PubMed]
- Siravegna, G.; Marsoni, S.; Siena, S.; Bardelli, A. Integrating liquid biopsies into the management of cancer. Nat. Rev. Clin. Oncol. 2017, 14, 531–548. [Google Scholar] [CrossRef] [PubMed]
- Nagasaka, M.; Uddin, M.H.; Al-Hallak, M.N.; Rahman, S.; Balasubramanian, S.; Sukari, A.; Azmi, A.S. Liquid biopsy for therapy monitoring in early-stage non-small cell lung cancer. Mol. Cancer 2021, 20, 82. [Google Scholar] [CrossRef] [PubMed]
- Stadler, J.C.; Belloum, Y.; Deitert, B.; Sementsov, M.; Heidrich, I.; Gebhardt, C.; Keller, L.; Pantel, K. Current and future clinical applications of ctDNA in immuno-oncology. Cancer Res. 2022, 82, 349–358. [Google Scholar] [CrossRef]
- Wan, J.C.M.; Massie, C.; Garcia-Corbacho, J.; Mouliere, F.; Brenton, J.D.; Caldas, C.; Pacey, S.; Baird, R.; Rosenfeld, N. Liquid biopsies come of age: Towards implementation of circulating tumour DNA. Nat. Rev. Cancer 2017, 17, 223–238. [Google Scholar] [CrossRef]
- Heitzer, E.; Haque, I.S.; Roberts, C.E.S.; Speicher, M.R. Current and future perspectives of liquid biopsies in genomics-driven oncology. Nat. Rev. Genet. 2019, 20, 71–88. [Google Scholar] [CrossRef]
- Li, W.; Liu, J.B.; Hou, L.K.; Yu, F.; Zhang, J.; Wu, W.; Tang, X.M.; Sun, F.; Lu, H.M.; Deng, J.; et al. Liquid biopsy in lung cancer: Significance in diagnostics, prediction, and treatment monitoring. Mol. Cancer. 2022, 21, 25. [Google Scholar] [CrossRef]
- Takegawa, N.; Yonesaka, K.; Sakai, K.; Ueda, H.; Watanabe, S.; Nonagase, Y.; Okuno, T.; Takeda, M.; Maenishi, O.; Tsurutani, J.; et al. HER2 genomic amplification in circulating tumor DNA from patients with cetuximab-resistant colorectal cancer. Oncotarget 2016, 7, 3453–3460. [Google Scholar] [CrossRef] [PubMed] [Green Version]
- Liu, L.; Liu, H.; Shao, D.; Liu, Z.; Wang, J.; Deng, Q.; Tang, H.; Yang, H.; Zhang, Y.; Qiu, Y.; et al. Development and clinical validation of a circulating tumor DNA test for the identification of clinically actionable mutations in nonsmall cell lung cancer. Genes Chromosomes Cancer 2018, 57, 211–220. [Google Scholar] [CrossRef] [PubMed] [Green Version]
- Li, X.; Ye, M.; Zhang, W.; Tan, D.; Jaffrezic-Renault, N.; Yang, X.; Guo, Z. Liquid biopsy of circulating tumor DNA and biosensor applications. Biosens. Bioelectron. 2019, 126, 596–607. [Google Scholar] [CrossRef] [PubMed]
- Quick, J.; Grubaugh, N.D.; Pullan, S.T.; Claro, I.M.; Smith, A.D.; Gangavarapu, K.; Oliveira, G.; Robles-Sikisaka, R.; Rogers, T.F.; Beutler, N.A.; et al. Multiplex PCR method for minion and illumina sequencing of zika and other virus genomes directly from clinical samples. Nat. Protoc. 2017, 12, 1261–1276. [Google Scholar] [CrossRef] [PubMed] [Green Version]
- Van, C.E.; Kohne, C.H.; Lang, I.; Folprecht, G.; Nowacki, M.P.; Cascinu, S.; Shchepotin, I.; Maurel, J.; Cunningham, D.; Tejpar, S.; et al. Cetuximab plus irinotecan, fluorouracil, and leucovorin as first-line treatment for metastatic colorectal cancer: Updated analysis of overall survival according to tumor KRAS and BRAF mutation status. J. Clin. Oncol. 2011, 29, 2011–2019. [Google Scholar]
- Zhang, Z.; Zhu, M.; Chen, Z.; Wang, X.; Chen, G.; Zhang, S. Coaxial sensing bio-amplifier for ultrasensitive detections of circulating tumor DNAs. Biosens. Bioelectron. 2019, 141, 111414. [Google Scholar] [CrossRef]
- Han, C.; Li, W.; Li, Q.; Xing, W.; Luo, H.; Ji, H.; Fang, X.; Luo, Z.; Zhang, L. CRISPR/Cas12a-derived electrochemical aptasensor for ultrasensitive detection of covid-19 nucleocapsid protein. Biosens. Bioelectron. 2022, 200, 113922. [Google Scholar] [CrossRef] [PubMed]
- Eissa, S.; Zourob, M. Development of a low-cost cotton-tipped electrochemical immunosensor for the detection of SARS-COV-2. Anal. Chem. 2021, 93, 1826–1833. [Google Scholar] [CrossRef]
- Chen, Z.; Liu, Y.; Xin, C.; Zhao, J.; Liu, S. A cascade autocatalytic strand displacement amplification and hybridization chain reaction event for label-free and ultrasensitive electrochemical nucleic acid biosensing. Biosens. Bioelectron. 2018, 113, 1–8. [Google Scholar] [CrossRef]
- Zhao, Y.; Chen, F.; Li, Q.; Wang, L.; Fan, C. Isothermal amplification of nucleic acids. Chem. Rev. 2015, 115, 12491–12545. [Google Scholar] [CrossRef]
- Gill, P.; Ghaemi, A. Nucleic acid isothermal amplification technologies: A review. Nucleosides Nucleotides Nucleic Acids 2008, 27, 224–243. [Google Scholar] [CrossRef] [PubMed]
- Bi, S.; Yue, S.; Zhang, S. Hybridization chain reaction: A versatile molecular tool for biosensing, bioimaging, and biomedicine. Chem. Soc. Rev. 2017, 46, 4281–4298. [Google Scholar] [CrossRef] [PubMed]
- Zhu, L.; Ye, J.; Yan, M.; Zhu, Q.; Wang, S.; Huang, J.; Yang, X. Electrochemiluminescence immunosensor based on au nanocluster and hybridization chain reaction signal amplification for ultrasensitive detection of cardiac troponin I. ACS Sens. 2019, 4, 2778–2785. [Google Scholar] [CrossRef] [PubMed]
- Liu, X.; Mao, D.; Song, Y.; Zhu, L.; Isak, A.N.; Lu, C.; Deng, G.; Chen, F.; Sun, F.; Yang, Y.; et al. Computer-aided design of reversible hybridization chain reaction (CAD-HCR) enables multiplexed single-cell spatial proteomics imaging. Sci. Adv. 2022, 8, 0133. [Google Scholar] [CrossRef] [PubMed]
- Chaibun, T.; Puenpa, J.; Ngamdee, T.; Boonapatcharoen, N.; Athamanolap, P.; O’Mullane, A.P.; Vongpunsawad, S.; Poovorawan, Y.; Lee, S.Y.; Lertanantawong, B. Rapid electrochemical detection of coronavirus SARS-Cov-2. Nat. Commun. 2021, 12, 802. [Google Scholar] [CrossRef]
- Wang, J.; Rincon, O.; Polsky, R.; Dominguez, E. Electrochemical detection of DNA hybridization based on DNA-templated assembly of silver cluster. Electrochem. Commun. 2003, 5, 83–86. [Google Scholar] [CrossRef]
- Wu, L.; Wang, J.; Ren, J.; Qu, X. Ultrasensitive telomerase activity detection in circulating tumor cells based on DNA metallization and sharp solid-state electrochemical techniques. Adv. Funct. Mater. 2014, 24, 2727–2733. [Google Scholar] [CrossRef]
- Lehman, I.R. The deoxyribonucleases of escherichia coli. J. Biol. Chem. 1960, 235, 1479–1487. [Google Scholar] [CrossRef]
- Dirks, R.M.; Pierce, N.A. Triggered amplification by hybridization chain reaction. Proc. Natl. Acad. Sci. USA 2004, 101, 15275–15278. [Google Scholar] [CrossRef] [Green Version]
- Steel, A.B.; Herne, T.M.; Tarlov, M.J. Electrochemical quantitation of DNA immobilized on gold. Anal. Chem. 1998, 70, 4670–4677. [Google Scholar]
- Li, D.; Xu, Y.; Fan, L.; Shen, B.; Ding, X.; Yuan, R.; Li, X.; Chen, W. Target-driven rolling walker based electrochemical biosensor for ultrasensitive detection of circulating tumor DNA using doxorubicin@tetrahedron-au tags. Biosens. Bioelectron. 2020, 148, 111826. [Google Scholar] [CrossRef] [PubMed]
- Zhang, J.; Dong, Y.; Zhu, W.; Xie, D.; Zhao, Y.; Yang, D.; Li, M. Ultrasensitive detection of circulating tumor DNA of lung cancer via an enzymatically amplified SERS-based frequency shift assay. ACS Appl. Mater. Interfaces 2019, 11, 18145–18152. [Google Scholar] [CrossRef] [PubMed]
- Feng, Y.; Sun, F.; Wang, N.; Lei, J.; Ju, H. Ru(bpy)(3)(2+) incorporated luminescent polymer dots: Double-enhanced electrochemiluminescence for detection of single-nucleotide polymorphism. Anal. Chem. 2017, 89, 7659–7666. [Google Scholar] [CrossRef]
- Jia, L.P.; Zhao, R.J.; Feng, Z.; Wang, M.Y.; Ma, R.N.; Jia, W.L.; Shang, L.; Zhang, W.; Xue, Q.W.; Wang, H.S. Ultrasensitive electrochemical detection of circulating tumor DNA by hollow polymeric nanospheres and dual enzyme assisted target amplification strategy. Sens. Actuators B Chem. 2022, 350, 130849. [Google Scholar] [CrossRef]
- Guo, L.; Mu, Z.; Yan, B.; Wang, J.; Zhou, J.; Bai, L. A novel electrochemical biosensor for sensitive detection of non-small cell lung cancer ctDNA using NG-PEI-COFTAPB-TFPB as sensing platform and Fe-MOF for signal enhancement. Sens. Actuators B Chem. 2022, 350, 130874. [Google Scholar] [CrossRef]
- Chen, M.; Wu, D.; Tu, S.; Yang, C.; Chen, D.; Xu, Y. CRISPR/Cas9 cleavage triggered ESDR for circulating tumor DNA detection based on a 3d graphene/ AuPtPd nanoflower biosensor. Biosens. Bioelectron. 2020, 173, 112821. [Google Scholar] [CrossRef]
- Chen, K.; Zhao, H.; Wang, Z.; Lan, M. A novel signal amplification label based on aupt alloy nanoparticles supported by high-active carbon for the electrochemical detection of circulating tumor DNA. Anal. Chim. Acta. 2021, 1169, 338628. [Google Scholar] [CrossRef]
- Huang, Y.; Tao, M.; Luo, S.; Yang, C.; Chen, D.; Xu, Y. A novel nest hybridization chain reaction based electrochemical assay for sensitive detection of circulating tumor DNA. Anal. Chim. Acta. 2020, 1107, 40–47. [Google Scholar] [CrossRef]
- Zhou, Q.; Zheng, J.; Qing, Z.; Zheng, M.; Yang, J.; Yang, S.; Ying, L.; Yang, R. Detection of circulating tumor DNA in human blood via DNA-mediated surface-enhanced raman spectroscopy of single-walled carbon nanotubes. Anal. Chem. 2016, 88, 4759–4765. [Google Scholar] [CrossRef]
- Chai, H.; Miao, P. Ultrasensitive assay of ctdna based on DNA triangular prism and three-way junction nanostructures. Chin. Chem. Lett. 2021, 32, 783–786. [Google Scholar] [CrossRef]
- Das, J.; Ivanov, I.; Montermini, L.; Rak, J.; Sargent, E.H.; Kelley, S.O. An electrochemical clamp assay for direct, rapid analysis of circulating nucleic acids in serum. Nat. Chem. 2015, 7, 569–575. [Google Scholar] [CrossRef]
- Xing, S.; Lu, Z.; Huang, Q.; Li, H.; Wang, Y.; Lai, Y.; He, Y.; Deng, M.; Liu, W. An ultrasensitive hybridization chain reaction-amplified CRISPR-Cas 12a aptasensor for extracellular vesicle surface protein quantification. Theranostics 2020, 10, 10262–10273. [Google Scholar] [CrossRef]
- Zhou, J.; Fu, R.; Liu, H.; Liu, Y.; Wang, Y.; Jiao, B.; He, Y.; Tang, H. Integrating multiple hybridization chain reactions on gold nanoparticle and alkaline phosphatase-mediated in situ growth of gold nanobipyramids: An ultrasensitive and high color resolution colorimetric method to detect the meca gene of staphylococcus aureus. J. Hazard. Mater. 2021, 418, 126223. [Google Scholar]
- Wang, C.; Zhou, H.; Zhu, W.P.; Li, H.B.; Jiang, J.H.; Shen, G.L.; Yu, R.Q. Ultrasensitive electrochemical DNA detection based on dual amplification of circular strand-displacement polymerase reaction and hybridization chain reaction. Biosens. Bioelectron. 2013, 47, 324–328. [Google Scholar] [CrossRef]
- Chai, H.; Tang, Y.; Guo, Z.; Miao, P. Ratiometric electrochemical switch for circulating tumor DNA through recycling activation of blocked DNAzymes. Anal. Chem. 2022, 94, 2779–2784. [Google Scholar] [CrossRef]


Publisher’s Note: MDPI stays neutral with regard to jurisdictional claims in published maps and institutional affiliations. |
© 2022 by the authors. Licensee MDPI, Basel, Switzerland. This article is an open access article distributed under the terms and conditions of the Creative Commons Attribution (CC BY) license (https://creativecommons.org/licenses/by/4.0/).
Share and Cite
Cai, A.; Yang, L.; Kang, X.; Liu, J.; Wang, F.; Ji, H.; Wang, Q.; Wu, M.; Li, G.; Zhou, X.; et al. Target Recognition– and HCR Amplification–Induced In Situ Electrochemical Signal Probe Synthesis Strategy for Trace ctDNA Analysis. Biosensors 2022, 12, 989. https://doi.org/10.3390/bios12110989
Cai A, Yang L, Kang X, Liu J, Wang F, Ji H, Wang Q, Wu M, Li G, Zhou X, et al. Target Recognition– and HCR Amplification–Induced In Situ Electrochemical Signal Probe Synthesis Strategy for Trace ctDNA Analysis. Biosensors. 2022; 12(11):989. https://doi.org/10.3390/bios12110989
Chicago/Turabian StyleCai, Aiting, Luxia Yang, Xiaoxia Kang, Jinxia Liu, Feng Wang, Haiwei Ji, Qi Wang, Mingmin Wu, Guo Li, Xiaobo Zhou, and et al. 2022. "Target Recognition– and HCR Amplification–Induced In Situ Electrochemical Signal Probe Synthesis Strategy for Trace ctDNA Analysis" Biosensors 12, no. 11: 989. https://doi.org/10.3390/bios12110989