Application of Raman Spectroscopic Methods in Food Safety: A Review


Abstract
:1. Introduction
2. Raman Spectroscopic Methods
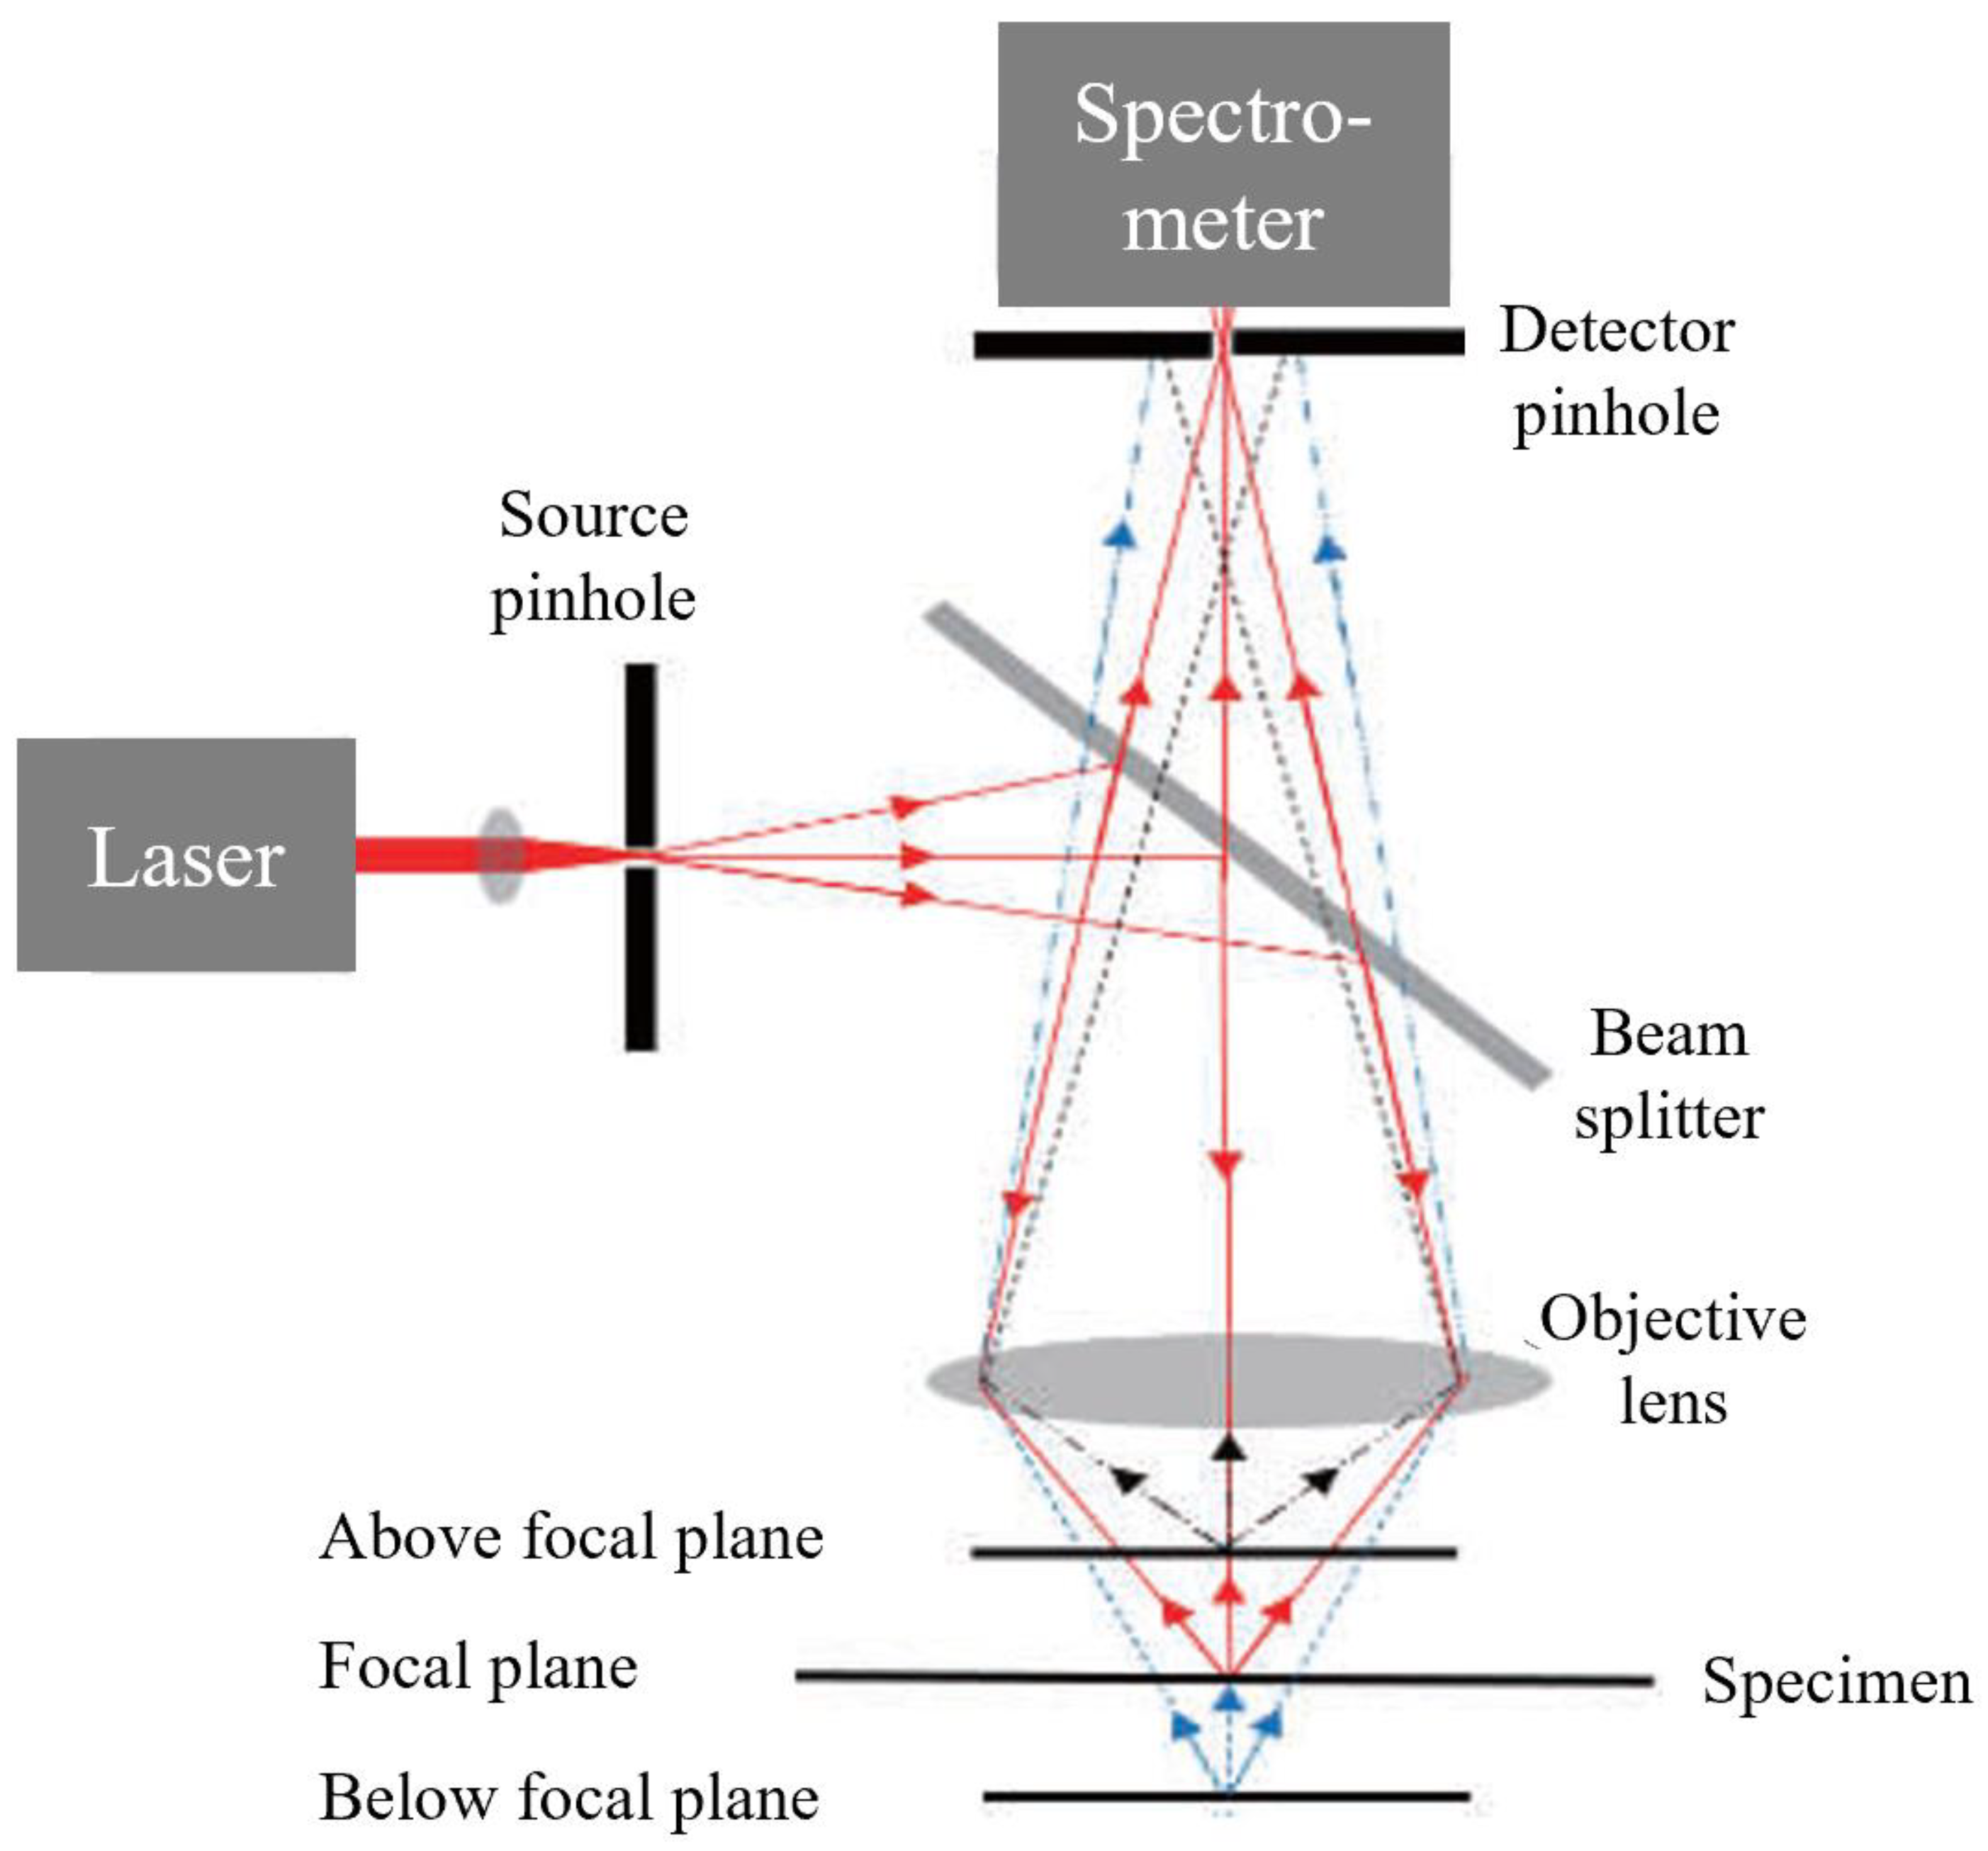
2.1. Raman Microscopy and Micro-Raman Spectroscopy
2.2. Raman Imaging
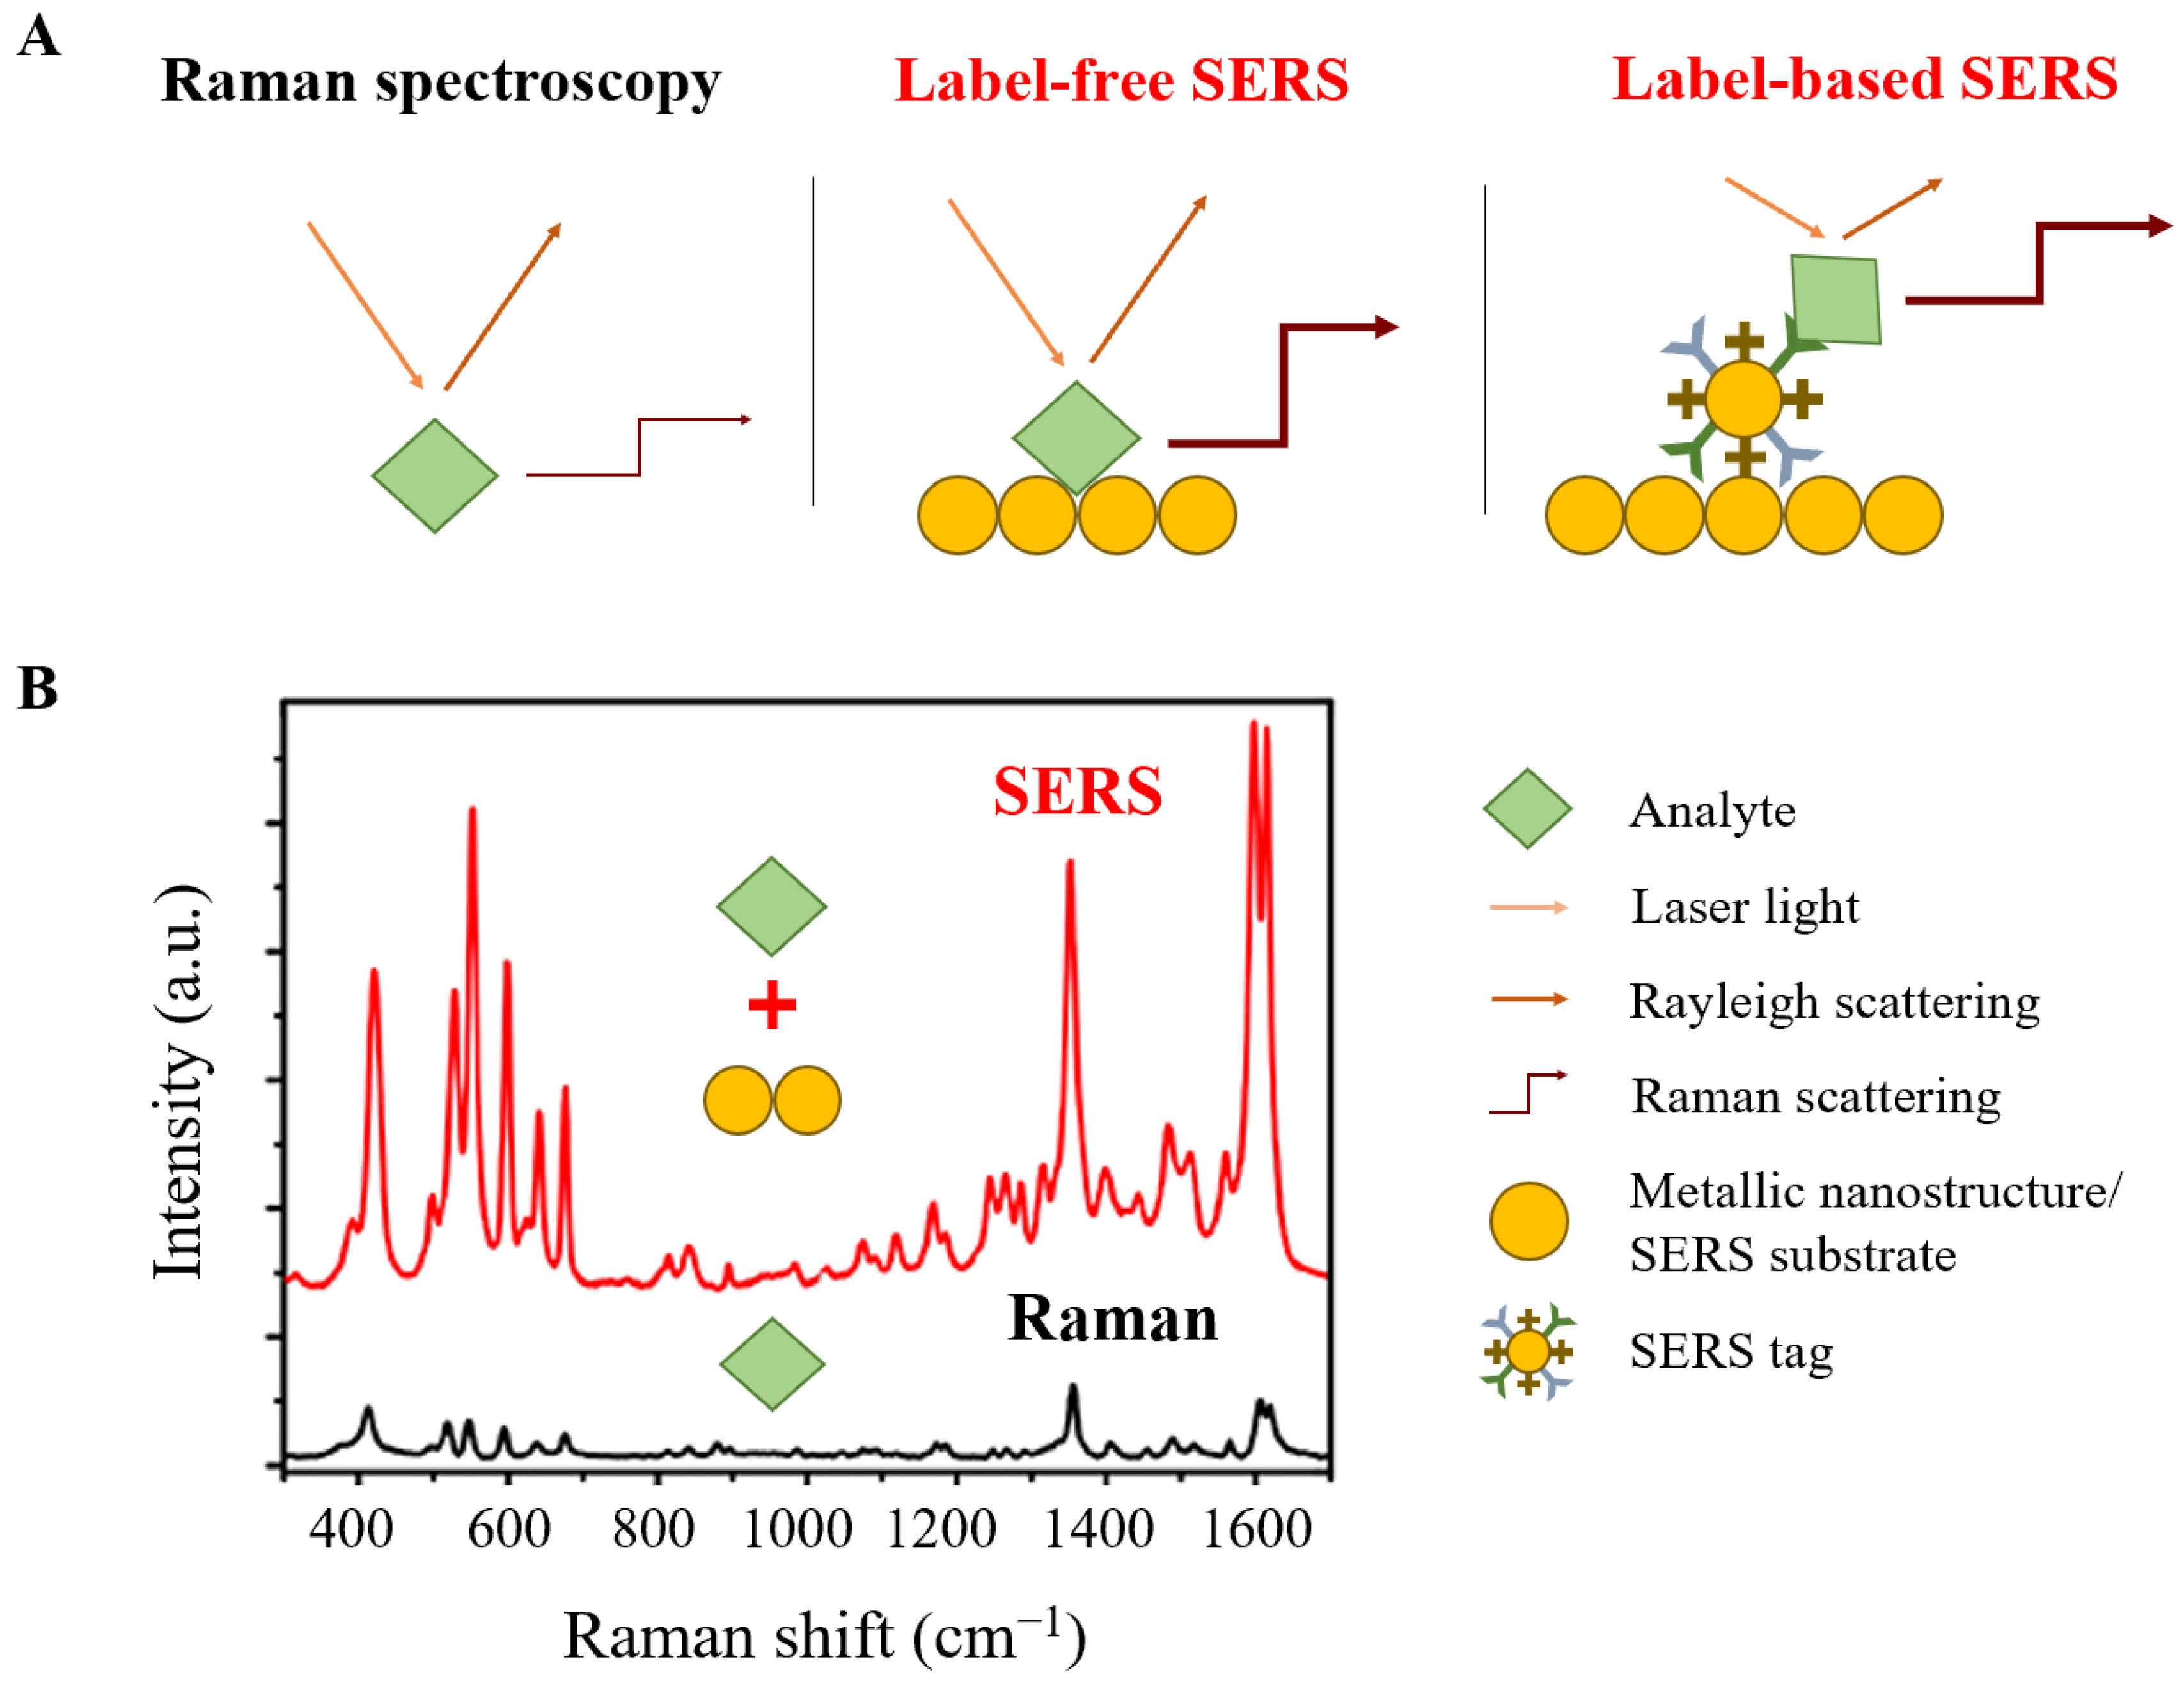
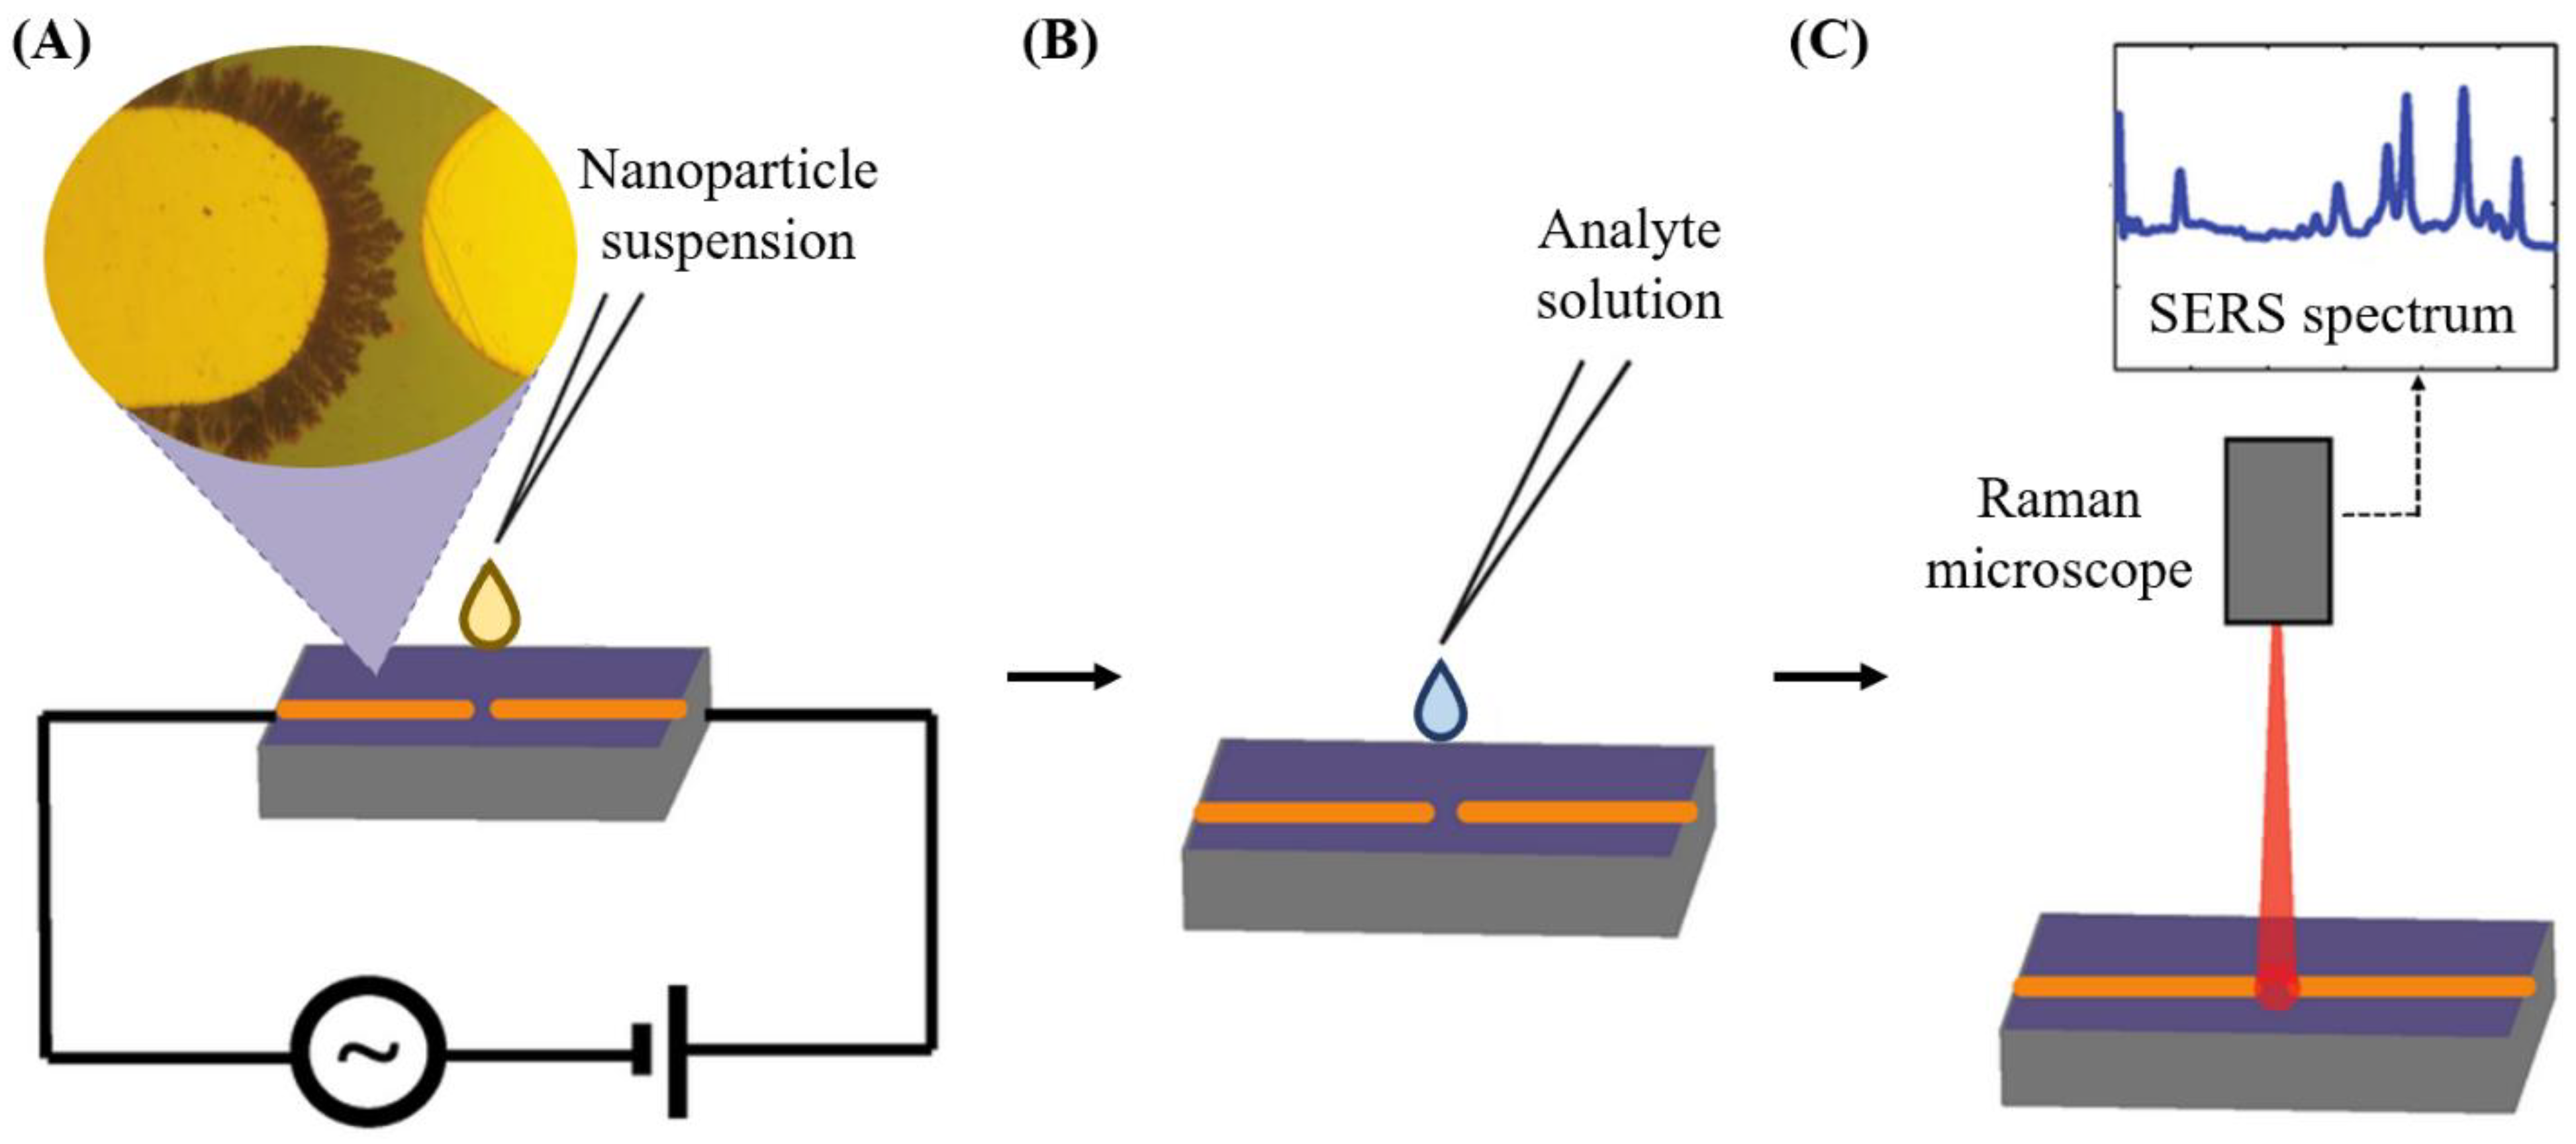
2.3. SERS
2.4. Raman Spectral Analysis
3. Biological Hazards
3.1. Determination of Foodborne Bacteria
3.2. Detection of Bacteria in Different Survival Stages
3.3. Detection of Bacteria in Drinking Water
3.4. Detection of Bacteria in Foods
3.5. Detection of Non-Bacterial Pathogens
4. Chemical Hazards
4.1. Detection of Mycotoxins
4.2. Detection of Environmental Contaminants
4.3. Detection of Additives and Adulteration
4.4. Detection of Pesticides
4.5. Detection of Allergens
5. Physical Hazards
6. Outlook
7. Conclusions
Author Contributions
Funding
Institutional Review Board Statement
Informed Consent Statement
Acknowledgments
Conflicts of Interest
References
- Fung, F.; Wang, H.-S.; Menon, S. Food Safety in the 21st Century. Biomed. J. 2018, 41, 88–95. [Google Scholar] [CrossRef]
- World Health Organization. Food Safety. Available online: https://www.who.int/westernpacific/health-topics/food-safety (accessed on 5 May 2021).
- Yang, T.; Wang, P.; Guo, H.; He, L. Surface-Enhanced Raman Spectroscopy: A Tool for All Classes of Food Contaminants. In Reference Module in Food Science; Elsevier: Amsterdam, The Netherlands, 2017; ISBN 978-0-08-100596-5. [Google Scholar]
- Yaseen, T.; Sun, D.-W.; Cheng, J.-H. Raman Imaging for Food Quality and Safety Evaluation: Fundamentals and Applications. Trends Food Sci. Technol. 2017, 62, 177–189. [Google Scholar] [CrossRef]
- Bodelón, G.; Montes-García, V.; Pérez-Juste, J.; Pastoriza-Santos, I. Surface-Enhanced Raman Scattering Spectroscopy for Label-Free Analysis of P. Aeruginosa Quorum Sensing. Front. Cell. Infect. Microbiol. 2018, 8. [Google Scholar] [CrossRef] [PubMed]
- Lorenz, B.; Wichmann, C.; Stöckel, S.; Rösch, P.; Popp, J. Cultivation-Free Raman Spectroscopic Investigations of Bacteria. Trends Microbiol. 2017, 25, 413–424. [Google Scholar] [CrossRef] [PubMed]
- Jones, R.R.; Hooper, D.C.; Zhang, L.; Wolverson, D.; Valev, V.K. Raman Techniques: Fundamentals and Frontiers. Nanoscale Res. Lett. 2019, 14. [Google Scholar] [CrossRef] [PubMed] [Green Version]
- Giridhar, G.; Manepalli, R.R.K.N.; Apparao, G. Chapter 7—Confocal Raman Spectroscopy. In Spectroscopic Methods for Nanomaterials Characterization; Micro and Nano Technologies; Thomas, S., Thomas, R., Zachariah, A.K., Mishra, R.K., Eds.; Elsevier: Amsterdam, The Netherlands, 2017; pp. 141–161. ISBN 978-0-323-46140-5. [Google Scholar]
- Wang, J.; Yang, M.; Yang, L.; Zhang, Y.; Yuan, J.; Liu, Q.; Hou, X.; Fu, L. A Confocal Endoscope for Cellular Imaging. Engineering 2015, 1, 351–360. [Google Scholar] [CrossRef] [Green Version]
- Stewart, S.; Priore, R.J.; Nelson, M.P.; Treado, P.J. Raman Imaging. Annu. Rev. Anal. Chem. 2012, 5, 337–360. [Google Scholar] [CrossRef]
- Zhao, X.; Li, M.; Xu, Z. Detection of Foodborne Pathogens by Surface Enhanced Raman Spectroscopy. Front. Microbiol. 2018, 9. [Google Scholar] [CrossRef] [PubMed]
- Liu, Y.; Zhou, H.; Hu, Z.; Yu, G.; Yang, D.; Zhao, J. Label and Label-Free Based Surface-Enhanced Raman Scattering for Pathogen Bacteria Detection: A Review. Biosens. Bioelectron. 2017, 94, 131–140. [Google Scholar] [CrossRef]
- Xu, Y.; Zhong, P.; Jiang, A.; Shen, X.; Li, X.; Xu, Z.; Shen, Y.; Sun, Y.; Lei, H. Raman Spectroscopy Coupled with Chemometrics for Food Authentication: A Review. TrAC Trends Anal. Chem. 2020, 131, 116017. [Google Scholar] [CrossRef]
- Ryabchykov, O.; Popp, J.; Bocklitz, T. Fusion of MALDI Spectrometric Imaging and Raman Spectroscopic Data for the Analysis of Biological Samples. Front. Chem. 2018, 6. [Google Scholar] [CrossRef] [PubMed] [Green Version]
- Bari, M.L.; Ukuku, D.O. Foodborne Pathogens and Food Safety; CRC Press: Boca Raton, FL, USA, 2015; ISBN 978-1-4987-2410-4. [Google Scholar]
- Law, J.W.-F.; Ab Mutalib, N.-S.; Chan, K.-G.; Lee, L.-H. Rapid Methods for the Detection of Foodborne Bacterial Pathogens: Principles, Applications, Advantages and Limitations. Front. Microbiol. 2015, 5. [Google Scholar] [CrossRef] [PubMed] [Green Version]
- Ricke, S.C.; Feye, K.M.; Chaney, W.E.; Shi, Z.; Pavlidis, H.; Yang, Y. Developments in Rapid Detection Methods for the Detection of Foodborne Campylobacter in the United States. Front. Microbiol. 2019, 9. [Google Scholar] [CrossRef] [PubMed] [Green Version]
- Chhabra, P.; Vinjé, J. Molecular Detection Methods of Foodborne Viruses. In Viruses in Foods; Food Microbiology and Food Safety; Goyal, S.M., Cannon, J.L., Eds.; Springer International Publishing: Cham, Switzerland, 2016; pp. 303–333. ISBN 978-3-319-30723-7. [Google Scholar]
- Rebrošová, K.; Šiler, M.; Samek, O.; Růžička, F.; Bernatová, S.; Holá, V.; Ježek, J.; Zemánek, P.; Sokolová, J.; Petráš, P. Rapid Identification of Staphylococci by Raman Spectroscopy. Sci. Rep. 2017, 7, 14846. [Google Scholar] [CrossRef] [PubMed] [Green Version]
- Wang, K.; Chen, L.; Ma, X.; Ma, L.; Chou, K.C.; Cao, Y.; Khan, I.U.H.; Gölz, G.; Lu, X. Arcobacter Identification and Species Determination Using Raman Spectroscopy Combined with Neural Networks. Appl. Environ. Microbiol. 2020, 86, e00924-20. [Google Scholar] [CrossRef] [PubMed]
- Jaafreh, S.; Valler, O.; Kreyenschmidt, J.; Günther, K.; Kaul, P. In Vitro Discrimination and Classification of Microbial Flora of Poultry Using Two Dispersive Raman Spectrometers (Microscope and Portable Fiber-Optic Systems) in Tandem with Chemometric Analysis. Talanta 2019, 202, 411–425. [Google Scholar] [CrossRef]
- Klein, D.; Breuch, R.; von der Mark, S.; Wickleder, C.; Kaul, P. Detection of Spoilage Associated Bacteria Using Raman-Microspectroscopy Combined with Multivariate Statistical Analysis. Talanta 2019, 196, 325–328. [Google Scholar] [CrossRef] [PubMed]
- Yan, S.; Wang, S.; Qiu, J.; Li, M.; Li, D.; Xu, D.; Li, D.; Liu, Q. Raman Spectroscopy Combined with Machine Learning for Rapid Detection of Food-Borne Pathogens at the Single-Cell Level. Talanta 2021, 226, 122195. [Google Scholar] [CrossRef]
- Huayhongthong, S.; Khuntayaporn, P.; Thirapanmethee, K.; Wanapaisan, P.; Chomnawang, M.T. Raman Spectroscopic Analysis of Food-Borne Microorganisms. LWT 2019, 114, 108419. [Google Scholar] [CrossRef]
- Wei, C.; Li, M.; Zhao, X. Surface-Enhanced Raman Scattering (SERS) with Silver Nano Substrates Synthesized by Microwave for Rapid Detection of Foodborne Pathogens. Front. Microbiol. 2018, 9. [Google Scholar] [CrossRef]
- Breuch, R.; Klein, D.; Siefke, E.; Hebel, M.; Herbert, U.; Wickleder, C.; Kaul, P. Differentiation of Meat-Related Microorganisms Using Paper-Based Surface-Enhanced Raman Spectroscopy Combined with Multivariate Statistical Analysis. Talanta 2020, 219, 121315. [Google Scholar] [CrossRef] [PubMed]
- Wang, P.; Pang, S.; Chen, J.; McLandsborough, L.; Nugen, S.R.; Fan, M.; He, L. Label-Free Mapping of Single Bacterial Cells Using Surface-Enhanced Raman Spectroscopy. Analyst 2016, 141, 1356–1362. [Google Scholar] [CrossRef]
- Ko, J.; Park, S.-G.; Lee, S.; Wang, X.; Mun, C.; Kim, S.; Kim, D.-H.; Choo, J. Culture-Free Detection of Bacterial Pathogens on Plasmonic Nanopillar Arrays Using Rapid Raman Mapping. ACS Appl. Mater. Interfaces 2018, 10, 6831–6840. [Google Scholar] [CrossRef] [PubMed]
- Srey, S.; Jahid, I.K.; Ha, S.-D. Biofilm Formation in Food Industries: A Food Safety Concern. Food Control 2013, 31, 572–585. [Google Scholar] [CrossRef]
- Lamas, A.; Regal, P.; Vázquez, B.; Miranda, J.M.; Cepeda, A.; Franco, C.M. Salmonella and Campylobacter Biofilm Formation: A Comparative Assessment from Farm to Fork. J. Sci. Food Agric. 2018, 98, 4014–4032. [Google Scholar] [CrossRef]
- Kusić, D.; Kampe, B.; Ramoji, A.; Neugebauer, U.; Rösch, P.; Popp, J. Raman Spectroscopic Differentiation of Planktonic Bacteria and Biofilms. Anal. Bioanal. Chem. 2015, 407, 6803–6813. [Google Scholar] [CrossRef]
- Liu, Y.; Yu, H.; Cheng, Y.; Guo, Y.; Yao, W.; Xie, Y. Non-Destructive Monitoring of Staphylococcus Aureus Biofilm by Surface-Enhanced Raman Scattering Spectroscopy. Food Anal. Methods 2020, 13, 1710–1716. [Google Scholar] [CrossRef]
- Sharma, G.; Prakash, A. Combined use of fourier transform infrared and raman spectroscopy to study planktonic and biofilm cells of cronobacter sakazakii. J. Microbiol. Biotechnol. Food Sci. 2021, 2021, 310–314. [Google Scholar]
- Keleştemur, S.; Avci, E.; Çulha, M. Raman and Surface-Enhanced Raman Scattering for Biofilm Characterization. Chemosensors 2018, 6, 5. [Google Scholar] [CrossRef] [Green Version]
- Oliver, J.D. The Viable but Nonculturable State in Bacteria. J. Microbiol. 2005, 43, 93–100. [Google Scholar] [PubMed]
- Guo, L.; Ye, C.; Cui, L.; Wan, K.; Chen, S.; Zhang, S.; Yu, X. Population and Single Cell Metabolic Activity of UV-Induced VBNC Bacteria Determined by CTC-FCM and D2O-Labeled Raman Spectroscopy. Environ. Int. 2019, 130, 104883. [Google Scholar] [CrossRef] [PubMed]
- Fan, J.; Jia, Y.; Xu, D.; Ye, Z.; Zhou, J.; Huang, J.; Fu, Y.; Shen, C. Anaerobic Condition Induces a Viable but Nonculturable State of the PCB-Degrading Bacteria Rhodococcus Biphenylivorans TG9. Sci. Total Environ. 2021, 764, 142849. [Google Scholar] [CrossRef]
- Fu, Y.; Jia, Y.; Fan, J.; Yu, C.; Yu, C.; Shen, C. Induction of Escherichia Coli O157:H7 into a Viable but Non-Culturable State by High Temperature and Its Resuscitation. Environ. Microbiol. Rep. 2020, 12, 568–577. [Google Scholar] [CrossRef] [PubMed]
- Cabral, J.P.S. Water Microbiology. Bacterial Pathogens and Water. Int. J. Environ. Res. Public Health 2010, 7, 3657–3703. [Google Scholar] [CrossRef] [PubMed]
- Wang, C.; Madiyar, F.; Yu, C.; Li, J. Detection of Extremely Low Concentration Waterborne Pathogen Using a Multiplexing Self-Referencing SERS Microfluidic Biosensor. J. Biol. Eng. 2017, 11, 9. [Google Scholar] [CrossRef] [PubMed] [Green Version]
- Zhou, H.; Yang, D.; Ivleva, N.P.; Mircescu, N.E.; Niessner, R.; Haisch, C. SERS Detection of Bacteria in Water by in Situ Coating with Ag Nanoparticles. Anal. Chem. 2014, 86, 1525–1533. [Google Scholar] [CrossRef] [PubMed]
- Silge, A.; Schumacher, W.; Rösch, P.; Da Costa Filho, P.A.; Gérard, C.; Popp, J. Identification of Water-Conditioned Pseudomonas Aeruginosa by Raman Microspectroscopy on a Single Cell Level. Syst. Appl. Microbiol. 2014, 37, 360–367. [Google Scholar] [CrossRef] [PubMed]
- Li, H.; Li, C.; Martin, F.L.; Zhang, D. Diagnose Pathogens in Drinking Water via Magnetic Surface-Enhanced Raman Scattering (SERS) Assay. Mater. Today Proc. 2017, 4, 25–31. [Google Scholar] [CrossRef] [Green Version]
- Krafft, B.; Tycova, A.; Urban, R.D.; Dusny, C.; Belder, D. Microfluidic Device for Concentration and SERS-Based Detection of Bacteria in Drinking Water. Electrophoresis 2021, 42, 86–94. [Google Scholar] [CrossRef] [PubMed]
- Gao, S.; Pearson, B.; He, L. Mapping Bacteria on Filter Membranes, an Innovative SERS Approach. J. Microbiol. Methods 2018, 147, 69–75. [Google Scholar] [CrossRef] [PubMed]
- Wiedmann, M.; Wang, S.; Post, L.; Nightingale, K. Assessment Criteria and Approaches for Rapid Detection Methods to Be Used in the Food Industry. J. Food Prot. 2014, 77, 670–690. [Google Scholar] [CrossRef] [PubMed]
- Zheng, J.; He, L. Surface-Enhanced Raman Spectroscopy for the Chemical Analysis of Food. Compr. Rev. Food Sci. Food Saf. 2014, 13, 317–328. [Google Scholar] [CrossRef] [PubMed]
- Wang, J.; Xie, X.; Feng, J.; Chen, J.C.; Du, X.; Luo, J.; Lu, X.; Wang, S. Rapid Detection of Listeria Monocytogenes in Milk Using Confocal Micro-Raman Spectroscopy and Chemometric Analysis. Int. J. Food Microbiol. 2015, 204, 66–74. [Google Scholar] [CrossRef] [PubMed]
- Wang, P.; Pang, S.; Pearson, B.; Chujo, Y.; McLandsborough, L.; Fan, M.; He, L. Rapid Concentration Detection and Differentiation of Bacteria in Skimmed Milk Using Surface Enhanced Raman Scattering Mapping on 4-Mercaptophenylboronic Acid Functionalized Silver Dendrites. Anal. Bioanal. Chem. 2017, 409, 2229–2238. [Google Scholar] [CrossRef] [PubMed]
- Najafi, R.; Mukherjee, S.; Hudson, J.; Sharma, A.; Banerjee, P. Development of a Rapid Capture-Cum-Detection Method for Escherichia Coli O157 from Apple Juice Comprising Nano-Immunomagnetic Separation in Tandem with Surface Enhanced Raman Scattering. Int. J. Food Microbiol. 2014, 189, 89–97. [Google Scholar] [CrossRef] [PubMed]
- Assaf, A.; Cordella, C.B.Y.; Thouand, G. Raman Spectroscopy Applied to the Horizontal Methods ISO 6579:2002 to Identify Salmonella Spp. in the Food Industry. Anal. Bioanal. Chem. 2014, 406, 4899–4910. [Google Scholar] [CrossRef] [PubMed] [Green Version]
- Witkowska, E.; Korsak, D.; Kowalska, A.; Księżopolska-Gocalska, M.; Niedziółka-Jönsson, J.; Roźniecka, E.; Michałowicz, W.; Albrycht, P.; Podrażka, M.; Hołyst, R.; et al. Surface-Enhanced Raman Spectroscopy Introduced into the International Standard Organization (ISO) Regulations as an Alternative Method for Detection and Identification of Pathogens in the Food Industry. Anal. Bioanal. Chem. 2017, 409, 1555–1567. [Google Scholar] [CrossRef] [PubMed] [Green Version]
- Yang, H.; Hopkins, D.L.; Zhang, Y.; Zhu, L.; Dong, P.; Wang, X.; Mao, Y.; Luo, X.; Fowler, S.M. Preliminary Investigation of the Use of Raman Spectroscopy to Predict Beef Spoilage in Different Types of Packaging. Meat Sci. 2020, 165, 108136. [Google Scholar] [CrossRef] [PubMed]
- Zając, A.; Dymińska, L.; Lorenc, J.; Hanuza, J. Fourier Transform Infrared and Raman Spectroscopy Studies of the Time-Dependent Changes in Chicken Meat as a Tool for Recording Spoilage Processes. Food Anal. Methods 2017, 10, 640–648. [Google Scholar] [CrossRef]
- Achadu, O.J.; Abe, F.; Suzuki, T.; Park, E.Y. Molybdenum Trioxide Nanocubes Aligned on a Graphene Oxide Substrate for the Detection of Norovirus by Surface-Enhanced Raman Scattering. ACS Appl. Mater. Interfaces 2020, 12, 43522–43534. [Google Scholar] [CrossRef] [PubMed]
- Pan, T.; Sun, D.-W.; Pu, H.; Wei, Q.; Xiao, W.; Wang, Q.-J. Detection of A. alternata from Pear Juice Using Surface-Enhanced Raman Spectroscopy Based Silver Nanodots Array. J. Food Eng. 2017, 215, 147–155. [Google Scholar] [CrossRef]
- Guo, Z.; Wang, M.; Barimah, A.O.; Chen, Q.; Li, H.; Shi, J.; El-Seedi, H.R.; Zou, X. Label-Free Surface Enhanced Raman Scattering Spectroscopy for Discrimination and Detection of Dominant Apple Spoilage Fungus. Int. J. Food Microbiol. 2021, 338, 108990. [Google Scholar] [CrossRef] [PubMed]
- Jackson, L.S. Chemical Food Safety Issues in the United States: Past, Present, and Future. J. Agric. Food Chem. 2009, 57, 8161–8170. [Google Scholar] [CrossRef]
- Liao, W.; Lu, X. Determination of Chemical Hazards in Foods Using Surface-Enhanced Raman Spectroscopy Coupled with Advanced Separation Techniques. Trends Food Sci. Technol. 2016, 54, 103–113. [Google Scholar] [CrossRef]
- Dies, H.; Siampani, M.; Escobedo, C.; Docoslis, A. Direct Detection of Toxic Contaminants in Minimally Processed Food Products Using Dendritic Surface-Enhanced Raman Scattering Substrates. Sensors 2018, 18, 2726. [Google Scholar] [CrossRef] [PubMed] [Green Version]
- De la Cruz, S.; López-Calleja, I.; Martín, R.; González, I.; Alcocer, M.; García, T. Recent Advances in the Detection of Allergens in Foods. In Food Allergens: Methods and Protocols; Lin, J., Alcocer, M., Eds.; Springer: New York, NY, USA, 2017; pp. 263–295. ISBN 978-1-4939-6925-8. [Google Scholar]
- World Health Organisation. Mycotoxins. Available online: https://www.who.int/news-room/fact-sheets/detail/mycotoxins (accessed on 9 April 2021).
- Guo, Z.; Wang, M.; Wu, J.; Tao, F.; Chen, Q.; Wang, Q.; Ouyang, Q.; Shi, J.; Zou, X. Quantitative Assessment of Zearalenone in Maize Using Multivariate Algorithms Coupled to Raman Spectroscopy. Food Chem. 2019, 286, 282–288. [Google Scholar] [CrossRef] [PubMed]
- Tegegne, W.A.; Mekonnen, M.L.; Beyene, A.B.; Su, W.-N.; Hwang, B.-J. Sensitive and Reliable Detection of Deoxynivalenol Mycotoxin in Pig Feed by Surface Enhanced Raman Spectroscopy on Silver Nanocubes@polydopamine Substrate. Spectrochim. Acta Part A Mol. Biomol. Spectrosc. 2020, 229, 117940. [Google Scholar] [CrossRef] [PubMed]
- European Food Safety Authority. Metals as Contaminants in Food. Available online: https://www.efsa.europa.eu/en/topics/topic/metals-contaminants-food (accessed on 9 April 2021).
- U.S. Food and Drug Administration. Metals and Your Food. Available online: https://www.fda.gov/food/chemicals-metals-pesticides-food/metals-and-your-food (accessed on 9 April 2021).
- Bao, H.; Fu, H.; Zhou, L.; Cai, W.; Zhang, H. Rapid and Ultrasensitive Surface-Enhanced Raman Spectroscopy Detection of Mercury Ions with Gold Film Supported Organometallic Nanobelts. Nanotechnology 2020, 31, 155501. [Google Scholar] [CrossRef] [PubMed]
- Zuo, Q.; Chen, Y.; Chen, Z.-P.; Yu, R.-Q. Quantification of Cadmium in Rice by Surface-Enhanced Raman Spectroscopy Based on a Ratiometric Indicator and Conical Holed Enhancing Substrates. Anal. Sci. 2018, 34, 1405–1410. [Google Scholar] [CrossRef] [Green Version]
- Lei, Z.; Chen, Y.; Liu, Z.; Ji, W.; Zhao, S. A Highly Sensitive and Quantitative Detection Method for Bisphenol A (BPA) by Competitive Immunoassay Based on Surface-Enhanced Raman Spectroscopy. Pigment Resin Technol. 2018, 47, 38–46. [Google Scholar] [CrossRef]
- Portesi, C.; Visentin, D.; Durbiano, F.; Abete, M.C.; Rizzi, M.; Maurino, V.; Rossi, A.M. Development of a Rapid Micro-Raman Spectroscopy Approach for Detection of NIAS in LDPE Pellets and Extruded Films for Food Packaging Applications. Polym. Test. 2019, 80, 106098. [Google Scholar] [CrossRef]
- Cai, G.; Ge, K.; Ouyang, X.; Hu, Y.; Li, G. Thin-Layer Chromatography Combined with Surface-Enhanced Raman Scattering for Rapid Detection of Benzidine and 4-Aminobiphenyl in Migration from Food Contact Materials Based on Gold Nanoparticle Doped Metal-Organic Framework. J. Sep. Sci. 2020, 43, 2834–2841. [Google Scholar] [CrossRef]
- World Health Organisation. Food Additives. Available online: https://www.who.int/news-room/fact-sheets/detail/food-additives (accessed on 9 April 2021).
- Huang, J.; Liang, P.; Xu, J.; Wu, Y.; Shen, W.; Xu, B.; Zhang, D.; Xia, J.; Zhuang, S. Qualitative and Quantitative Determination of Coumarin Using Surface-Enhanced Raman Spectroscopy Coupled with Intelligent Multivariate Analysis. RSC Adv. 2017, 7, 49097–49101. [Google Scholar] [CrossRef] [Green Version]
- Qin, J.; Kim, M.S.; Chao, K.; Dhakal, S.; Cho, B.-K. Non-Targeted and Targeted Raman Imaging Detection of Chemical Contaminants in Food Powders. In Sensing for Agriculture and Food Quality and Safety X; International Society for Optics and Photonics: Bellingham, WA, USA, 2018; Volume 10665, p. 106650G. [Google Scholar]
- Tan, Z.; Lou, T.; Huang, Z.; Zong, J.; Xu, K.; Li, Q.; Chen, D. Single-Drop Raman Imaging Exposes the Trace Contaminants in Milk. J. Agric. Food Chem. 2017, 65, 6274–6281. [Google Scholar] [CrossRef] [PubMed]
- Jha, S.N. Chapter 1—Food Safety and Quality. In Rapid Detection of Food Adulterants and Contaminants; Jha, S.N., Ed.; Academic Press: San Diego, CA, USA, 2016; pp. 1–24. ISBN 978-0-12-420084-5. [Google Scholar]
- Kelis Cardoso, V.G.; Poppi, R.J. Cleaner and Faster Method to Detect Adulteration in Cassava Starch Using Raman Spectroscopy and One-Class Support Vector Machine. Food Control 2021, 125, 107917. [Google Scholar] [CrossRef]
- De Lima, T.K.; Musso, M.; Bertoldo Menezes, D. Using Raman Spectroscopy and an Exponential Equation Approach to Detect Adulteration of Olive Oil with Rapeseed and Corn Oil. Food Chem. 2020, 333, 127454. [Google Scholar] [CrossRef] [PubMed]
- Oroian, M.; Ropciuc, S.; Paduret, S. Honey Adulteration Detection Using Raman Spectroscopy. Food Anal. Methods 2018, 11, 959–968. [Google Scholar] [CrossRef]
- Taylan, O.; Cebi, N.; Yilmaz, M.T.; Sagdic, O.; Ozdemir, D.; Balubaid, M. Rapid Detection of Green-Pea Adulteration in Pistachio Nuts Using Raman Spectroscopy and Chemometrics. J. Sci. Food Agric. 2021, 101, 1699–1708. [Google Scholar] [CrossRef]
- Lohumi, S.; Lee, H.; Kim, M.S.; Qin, J.; Cho, B.-K. Through-Packaging Analysis of Butter Adulteration Using Line-Scan Spatially Offset Raman Spectroscopy. Anal. Bioanal. Chem. 2018, 410, 5663–5673. [Google Scholar] [CrossRef] [PubMed]
- Xu, Y.; Kutsanedzie, F.Y.H.; Hassan, M.; Zhu, J.; Ahmad, W.; Li, H.; Chen, Q. Mesoporous Silica Supported Orderly-Spaced Gold Nanoparticles SERS-Based Sensor for Pesticides Detection in Food. Food Chem. 2020, 315, 126300. [Google Scholar] [CrossRef] [PubMed]
- Dowgiallo, A.-M.; Guenther, D. Determination of the Limit of Detection of Multiple Pesticides Utilizing Gold Nanoparticles and Surface Enhanced Raman Spectroscopy (SERS). J. Agric. Food Chem. 2019, 67. [Google Scholar] [CrossRef] [PubMed]
- Wang, C.M.; Roy, P.K.; Juluri, B.K.; Chattopadhyay, S. A SERS Tattoo for in Situ, Ex Situ, and Multiplexed Detection of Toxic Food Additives. Sens. Actuators B Chem. 2018, 261, 218–225. [Google Scholar] [CrossRef]
- Lin, L.; Dong, T.; Nie, P.; Qu, F.; He, Y.; Chu, B.; Xiao, S. Rapid Determination of Thiabendazole Pesticides in Rape by Surface Enhanced Raman Spectroscopy. Sensors 2018, 18, 1082. [Google Scholar] [CrossRef] [PubMed] [Green Version]
- Hu, B.; Sun, D.-W.; Pu, H.; Wei, Q. Rapid Nondestructive Detection of Mixed Pesticides Residues on Fruit Surface Using SERS Combined with Self-Modeling Mixture Analysis Method. Talanta 2020, 217, 120998. [Google Scholar] [CrossRef] [PubMed]
- Chen, X.; Lin, M.; Sun, L.; Xu, T.; Lai, K.; Huang, M.; Lin, H. Detection and Quantification of Carbendazim in Oolong Tea by Surface-Enhanced Raman Spectroscopy and Gold Nanoparticle Substrates. Food Chem. 2019, 293, 271–277. [Google Scholar] [CrossRef]
- Ma, P.; Wang, L.; Xu, L.; Li, J.; Zhang, X.; Chen, H. Rapid Quantitative Determination of Chlorpyrifos Pesticide Residues in Tomatoes by Surface-Enhanced Raman Spectroscopy. Eur. Food Res. Technol. 2020, 246, 239–251. [Google Scholar] [CrossRef]
- Yaseen, T.; Sun, D.-W.; Pu, H.; Pan, T.-T. Detection of Omethoate Residues in Peach with Surface-Enhanced Raman Spectroscopy. Food Anal. Methods 2018, 11, 2518–2527. [Google Scholar] [CrossRef]
- World Health Organisation. International Food Safety Authorities Network (INFOSAN) Food Allergies; World Health Organisation: Geneva, Switzerland, 2006. [Google Scholar]
- Reiner, J.; Protte, K.; Hinrichs, J. Investigation of the Applicability of Raman Spectroscopy as Online Process Control during Consumer Milk Production. ChemEngineering 2020, 4, 45. [Google Scholar] [CrossRef]
- Gezer, P.G.; Liu, G.L.; Kokini, J.L. Development of a Biodegradable Sensor Platform from Gold Coated Zein Nanophotonic Films to Detect Peanut Allergen, Ara H1, Using Surface Enhanced Raman Spectroscopy. Talanta 2016, 150, 224–232. [Google Scholar] [CrossRef] [Green Version]
- Xi, J.; Yu, Q. The Development of Lateral Flow Immunoassay Strip Tests Based on Surface Enhanced Raman Spectroscopy Coupled with Gold Nanoparticles for the Rapid Detection of Soybean Allergen β-Conglycinin. Spectrochim. Acta Part A Mol. Biomol. Spectrosc. 2020, 241, 118640. [Google Scholar] [CrossRef] [PubMed]
- Singh, P.K.; Singh, R.P.; Singh, P.; Singh, R.L. Chapter 2—Food Hazards: Physical, Chemical, and Biological. In Food Safety and Human Health; Singh, R.L., Mondal, S., Eds.; Academic Press: Cambridge, MA, USA, 2019; pp. 15–65. ISBN 978-0-12-816333-7. [Google Scholar]
- Demaurex, G.; Sallé, L. Chapter 21—Detection of Physical Hazards. In Food Safety Management; Motarjemi, Y., Lelieveld, H., Eds.; Academic Press: San Diego, CA, USA, 2014; pp. 511–533. ISBN 978-0-12-381504-0. [Google Scholar]
- Kniggendorf, A.-K.; Wetzel, C.; Roth, B. Microplastics Detection in Streaming Tap Water with Raman Spectroscopy. Sensors 2019, 19, 1839. [Google Scholar] [CrossRef] [Green Version]
- Xu, G.; Cheng, H.; Jones, R.; Feng, Y.; Gong, K.; Li, K.; Fang, X.; Tahir, M.A.; Valev, V.K.; Zhang, L. Surface-Enhanced Raman Spectroscopy Facilitates the Detection of Microplastics <1 Μm in the Environment. Environ. Sci. Technol. 2020, 54, 15594–15603. [Google Scholar] [CrossRef] [PubMed]
- Shim, W.J.; Hong, S.H.; Eo, S.E. Identification Methods in Microplastic Analysis: A Review. Anal. Methods 2017, 9, 1384–1391. [Google Scholar] [CrossRef]
- Zada, L.; Leslie, H.A.; Vethaak, A.D.; Tinnevelt, G.H.; Jansen, J.J.; de Boer, J.F.; Ariese, F. Fast Microplastics Identification with Stimulated Raman Scattering Microscopy. J. Raman Spectrosc. 2018, 49, 1136–1144. [Google Scholar] [CrossRef] [Green Version]
- Lv, L.; He, L.; Jiang, S.; Chen, J.; Zhou, C.; Qu, J.; Lu, Y.; Hong, P.; Sun, S.; Li, C. In Situ Surface-Enhanced Raman Spectroscopy for Detecting Microplastics and Nanoplastics in Aquatic Environments. Sci. Total Environ. 2020, 728, 138449. [Google Scholar] [CrossRef] [PubMed]
- Prata, J.C.; Paço, A.; Reis, V.; da Costa, J.P.; Fernandes, A.J.S.; da Costa, F.M.; Duarte, A.C.; Rocha-Santos, T. Identification of Microplastics in White Wines Capped with Polyethylene Stoppers Using Micro-Raman Spectroscopy. Food Chem. 2020, 331, 127323. [Google Scholar] [CrossRef]
- Stöckel, S.; Kirchhoff, J.; Neugebauer, U.; Rösch, P.; Popp, J. The Application of Raman Spectroscopy for the Detection and Identification of Microorganisms. J. Raman Spectrosc. 2016, 47, 89–109. [Google Scholar] [CrossRef]
- Tang, Y.; Gao, J.; Liu, X.; Gao, X.; Ma, T.; Lu, X.; Li, J. Ultrasensitive detection of clenbuterol by a covalent imprinted polymer as a biomimetic antibody. Food Chem. 2017, 228, 62–69. [Google Scholar] [CrossRef]
- Zhao, B.; Feng, S.; Hu, Y.; Wang, S.; Lu, X. Rapid determination of atrazine in apple juice using molecularly imprinted polymers coupled with gold nanoparticles-colorimetric/SERS dual chemosensor. Food Chem. 2019, 276, 366–375. [Google Scholar] [CrossRef]
- Lee, H.M.; Jin, S.M.; Kim, H.M.; Suh, Y.D. Single-Molecule Surface-Enhanced Raman Spectroscopy: A Perspective on the Current Status. Phys. Chem. Chem. Phys. 2013, 15, 5276–5287. [Google Scholar] [CrossRef] [PubMed]
- Zong, C.; Xu, M.; Xu, L.-J.; Wei, T.; Ma, X.; Zheng, X.-S.; Hu, R.; Ren, B. Surface-Enhanced Raman Spectroscopy for Bioanalysis: Reliability and Challenges. Chem. Rev. 2018, 118, 4946–4980. [Google Scholar] [CrossRef] [PubMed]
- Liang, N.; Lu, X.; Hu, Y.; Kitts, D.D. Application of attenuated total reflectance-Fourier transformed infrared (ATR-FTIR) spectroscopy to determine the chlorogenic acid isomer profile and antioxidant capacity of coffee beans. J. Agric. Food Chem. 2016, 64, 681–689. [Google Scholar] [CrossRef] [PubMed]
- Ma, L.; Chen, L.; Chou, K.C.; Lu, X. Determination of antimicrobial resistance profiles and mechanisms of Campylobacter jejuni using a Raman spectroscopy-based metabolomic approach. Appl. Environ. Microbiol. 2021, 87, e0038821. [Google Scholar] [CrossRef] [PubMed]


Publisher’s Note: MDPI stays neutral with regard to jurisdictional claims in published maps and institutional affiliations. |
© 2021 by the authors. Licensee MDPI, Basel, Switzerland. This article is an open access article distributed under the terms and conditions of the Creative Commons Attribution (CC BY) license (https://creativecommons.org/licenses/by/4.0/).
Share and Cite
Petersen, M.; Yu, Z.; Lu, X. Application of Raman Spectroscopic Methods in Food Safety: A Review. Biosensors 2021, 11, 187. https://doi.org/10.3390/bios11060187
Petersen M, Yu Z, Lu X. Application of Raman Spectroscopic Methods in Food Safety: A Review. Biosensors. 2021; 11(6):187. https://doi.org/10.3390/bios11060187
Chicago/Turabian StylePetersen, Marlen, Zhilong Yu, and Xiaonan Lu. 2021. "Application of Raman Spectroscopic Methods in Food Safety: A Review" Biosensors 11, no. 6: 187. https://doi.org/10.3390/bios11060187