Article

NQS-Doped PDMS Solid Sensor: From Water Matrix to Urine Enzymatic Application

by
Adrià Martínez-Aviñó
,
Lusine Hakobyan
,
Ana Ballester-Caudet
*,
Yolanda Moliner-Martínez
,
Carmen Molins-Legua
and
Pilar Campíns-Falcó
MINTOTA Research Group, Department of Analytical Chemistry, University of Valencia, Dr. Moliner 50, Burjassot, 46100 Valencia, Spain
*
Author to whom correspondence should be addressed.
Biosensors 2021, 11(6), 186; https://doi.org/10.3390/bios11060186
Submission received: 10 May 2021 / Revised: 3 June 2021 / Accepted: 4 June 2021 / Published: 8 June 2021
(This article belongs to the Special Issue Biosensors for the Detection of Nitrogen-Based Compounds)

Abstract

:
The development of in situ analytical devices has gained outstanding scientific interest. A solid sensing membrane composed of 1,2-naphthoquinone-4-sulfonate (NQS) derivatizing reagent embedded into a polymeric polydimethylsiloxane (PDMS) composite was proposed for in situ ammonium (NH4+) and urea (NH2CONH2) analysis in water and urine samples, respectively. Satisfactory strategies were also applied for urease-catalyzed hydrolysis of urea, either in solution or glass-supported urease immobilization. Using diffuse reflectance measurements combined with digital image processing of color intensity (RGB coordinates), qualitative and quantitative analyte detection was assessed after the colorimetric reaction took place inside the sensing membrane. A suitable linear relationship was found between the sensor response and analyte concentration, and the results were validated by a thymol-PDMS-based sensor based on the Berthelot reaction. The suggested sensing device offers advantages such as rapidity, versatility, portability, and employment of non-toxic reagents that facilitate in situ analysis in an energy-efficient manner.

1. Introduction

The development of in-situ analytical devices to estimate ammonium concentration in environmental samples is of scientific interest due to the environmental problems associated with intensive agricultural and animal farming activities [1,2,3]. The growing concern for climate change has focused its attention on emissions and discharges of NH3/NH4+ [4,5] as the prevention of their negative effects has led to legal requirements at regional, national, and European levels [6] as well as the need for working conditions to which these industries must adapt [7]. Hence, the development of methods for real-time and in situ measurements has become mandatory to facilitate the decision-making process [8].
The in situ analysis devices that have become the most trending analyzers are based on colorimetric tests employing chemical sensors as support [9]. For instance, colorimetric sensors supported on polymeric bases, such as polydimethylsiloxane (PDMS) [10,11], paper [12], and nylon [13], are the most commonly used sensing devices that improve the sustainability aspects of the analytical method. Among them, the PDMS matrix has already proved to be a satisfactory silicon-based organic base for colorimetric purposes [14]. This is the case of an NQS-doped PDMS-based sensor in which 1,2-naphthoquinone-4-sulfonate (NQS) is entrapped in PDMS using a sol–gel process [15]. The combination of the hydrophobicity provided by PDMS with the hydrophilicity of tetraethyl orthosilicate (TEOS) in the presence of SiO2 NPs gives rise to a promising nanomaterial with extra functionality. In fact, previous research has demonstrated that when TEOS and SiO2 NPs are incorporated in NQS-doped PDMS sensors and exposed to amino compounds in gaseous samples, the amino compounds diffuse into the hybrid polymeric matrix, and a color change takes place owing to the formation of the NQS derivative inside the membrane [16,17]. This sensing performance led to a satisfactory in-situ analysis device for the determination of the primary and secondary amine biocide N-(3-aminopropyl)-N-dodecyl-1,3-propanediamine in industry [18].
New strategies were investigated to improve the sensitivity of the NQS-PDMS-based sensor. In fact, sensing properties were tuned in the presence of ionic liquids (ILs) such as 1-methyl-3-octylimidazolium hexafluorophosphate, 1-butyl-4-methylpyridinium hexafluorophosphate, and 1-butyl-3-methylimidazolium octyl sulfate. These organic cations and anions show unique structural and physiochemical characteristics that yield to specific interactions inside the membrane [19,20,21]. Specifically, ILs endowed an improvement on the mechanical properties of the PDMS-TEOS-SiO2 NP composite, maintaining flexibility and tractability [22,23] and improving composite porosity. Among the potential applications of the PDMS/TEOS-SiO2 NP–IL membrane, its optimal analytical features for detecting gaseous ammonia and amines during meat spoilage are worth mentioning [24]. The compatibility of the NQS-based PDMS/TEOS/SiO2 NPs composite in an aqueous solution was assessed and confirmed to provide satisfactory analysis, for instance, in the control of excess casein in effluents from dairy industries [14]. The PDMS/TEOS-based sensing membrane was proposed as a promising alternative for in situ analysis in solutions thanks to the portability and the minimization of reagents handling; therefore, it is worth exploiting its full potentiality.
Urea is a nitrogen-containing compound that is also present in the environment, coming from agricultural processes (soil) [25,26] and water [27]. Typically, urea is employed as fertilizer that can be indirectly determined as ammonia after urea hydrolysis reaction. In addition to environmental pollution, urea detection is relevant in medical diagnosis, since urea is one of the main waste products of protein and amino acid metabolism and is eliminated from the body through urine [28]. Urine ammonium compounds excreted by the human body can be considered as remarkable biomarkers for indicating diseases or pathophysiological conditions [29,30,31]. At a physiological pH (7.3), urea is neutral, with an expected concentration in the range of 155–388 mM (9.3–23.3 g/L) in humans [32]. In the literature, several analytical methods for the determination of urea use enzymatic hydrolysis, which is carried out in the presence of the urease enzyme in the working medium [33,34,35,36]. Usually, enzymatic assays are performed in a solution, and there are several immobilization strategies [37] on different supports [31,33,35,38]. The immobilization process is a key factor to develop efficient sensing devices with good operational and storage stability, high selectivity, short response time, and high reproducibility. Particularly, a glass surface has been used as support for biofunctionalization with aminopropyltrimethoxysilane (APTMS) [39,40]. The terminal group of APTMS provides a reactive residue to bind biomolecules or crosslinkers to the support surface, giving rise to successful covalent immobilization of urease. A comparative study on urea hydrolysis when urease is in solution or immobilized on a solid support is of interest, with the aim of determining urease stability and reusability. Among the samples applied, selective urea nitrate in solution was performed in a polymer matrix composed of poly(acrylamide) hydrogel [41], and the employment of portable, low-cost devices for in situ determination of urea has already been addressed in milk [42] and blood [43] matrices.
In this work, we further explore the use of the NQS-based PDMS/TEOS/SiO2 NP composite as an ammonia sensor to detect NH4+ and urea in water and human urine samples, respectively. Moreover, urea enzymatic hydrolysis containing urease in solution and immobilized on glass support were investigated. The NQS-based colorimetric sensing device proposed in this work offers a sustainable alternative that possesses advantages such as versatility, simplicity, rapidity, satisfactory robustness over the reagent derivatizations in solution, cost-effectiveness, energy-efficiency, and reliable response that can be detected visually.

2. Materials and Methods

2.1. Materials and Reagents

PDMS membranes were synthesized using a Sylgard® 184 Silicone Elastomer Kit (base and curing agent) obtained from Dow Corning (USA). Sodium 1,2-naphthoquinone-4-sulfonate (NQS, 99.7%), tetraethyl orthosilicate (TEOS ≥ 99.0%), silicon dioxide nanoparticles (SiO2 NPs, 99.5%, 5–15 nm particle size), urease (Canavalia ensiformisJack bean 64,347 units/g in 0.31 g), and APTMS (aminopropyltrimethoxysilane) were purchased from Sigma Aldrich (St. Louis, MO, USA). Sodium carbonate, sodium hydrogen carbonate, and ammonium chloride were provided by Probus (Spain). Urea, hydrogen peroxide, 2-propanol (isopropanol ≥ 99.9%), and sodium hydroxide were provided by VWR Chemicals (Radnor, PA, USA). Trichloroacetic acid (≥99.0%) and sodium dihydrogen phosphate monohydrate were obtained from Merck (Darmstadt, Germany). Hydrochloric acid 37% was obtained from Scharlau (Barcelona, Spain). Di-sodium hydrogen phosphate anhydrous was obtained from Panreac (Barcelona, Spain). Ultrapure water was obtained from a Nanopure II system (Sybron, MS, USA). Solid-glass beads (borosilicate glass balls, diam. 5 mm) were provided by Sigma Aldrich (St. Louis, MO, USA). A stock urease solution of 9 mg mL−1 was prepared in phosphate buffer (pH 7.4) and stored in darkness at 4 °C. Phosphate buffer was prepared from 0.2 M NaH2PO4 and Na2HPO4, and the pH was adjusted to 7.4 with sodium hydroxide 1 M. Carbonate buffer was prepared from 0.1 M NaHCO3 and Na2CO3, and the pH was adjusted to 11 with sodium hydroxide 1 M.
Thymol was purchased from Riedel-de Haen (Munich, Germany). Thymol solution was prepared by dissolving an adequate amount of the solid reagent in acetone. Sodium hypochlorite and nitroprusside were obtained from Probus (Badalona, Spain).

2.2. Apparatus

Solid sensor morphology was studied with a Hitachi S-4800 scanning electron microscope at an accelerating voltage of 20 keV over metalized samples with a mixture of gold and palladium for 30 s.
A Nikon ECLIPSE E200LED MV Series optical microscope (Nikon Corporation, Tokyo, Japan) was employed under bright-field illumination using a 50× objective to characterize the PDMS membrane. Nis Elements 4.20.02 software (Nikon Corporation) was used for acquiring the images.
Absorbance measurements were carried out using a Cary 60 UV–vis spectrophotometer equipped with a diffuse reflection probe from Harrick Scientific Products (Pleasantville, NY, USA). The diffuse reflection probe has an integral video camera, which provides a visual image to select the sample spot to be analyzed. Spectra were recorded from 400 to 900 nm. For data collection and processing, Cary WinUV Scan application 5.0.0.999 software from Agilent Technologies was used.
For UV–vis measurements in the solution, an HP-8453 UV–vis spectrophotometer from Hewlett Packard (Poway, CA, USA) furnished with a 1-cm path length quartz microcell was employed. Absorption spectra were registered from 190 to 900 nm.
A smartphone coupled to a miniaturized spectrometer (GoSpectro, ALPHANOV, Talence, France) was employed for registering the absorbance spectrum in the working range from 400 to 900 nm. Sensor digital images were taken using a smartphone, and red, green, and blue coordinates (RGB) were obtained.

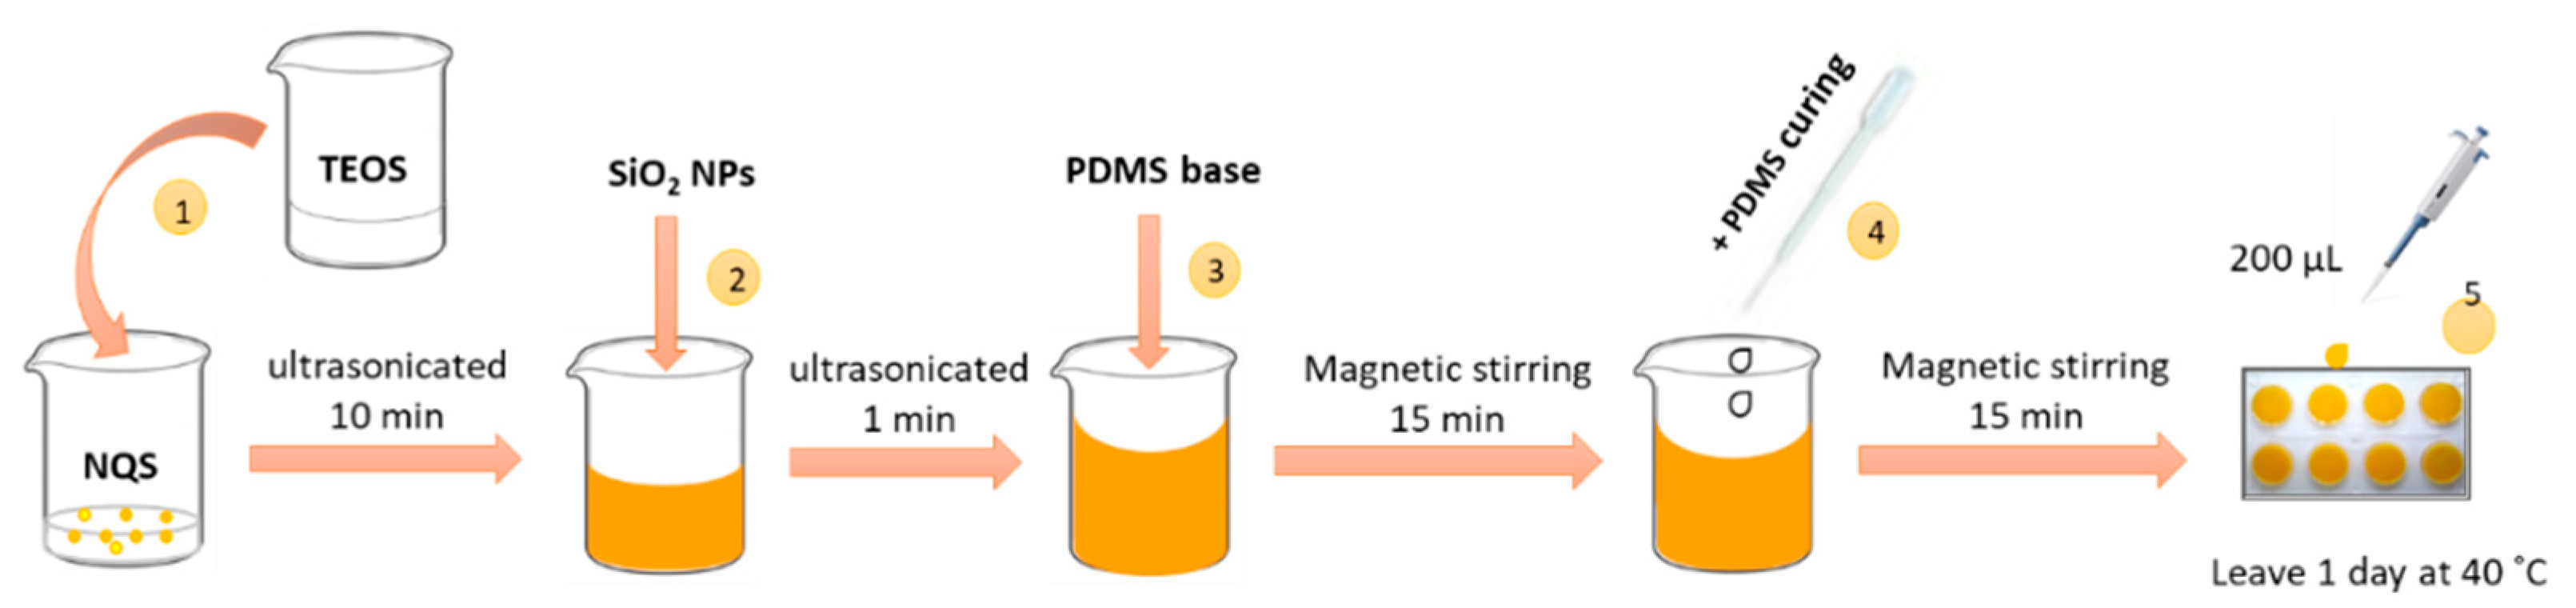
2.3. Preparation of PDMS/TEOS-NQS-SiO2 NPs Sensing Membranes

The fabrication of the PDMS/TEOS-SiO2 NPs composite with NQS reagent [17] was carried out following the experimental procedure described in Figure 1. First, the derivatizing NQS (0.35%) was mixed with TEOS (59%) and ultrasonicated for 10 min. Then, SiO2 NPs (0.41%) were added to the NQS-TEOS suspension, and the mixture was ultrasonicated for 1 min to completely dissolve the NPs. The PDMS elastomer base (36.5%) was added to the resulting NQS-TEOS-SiO2 NP mixture under vigorous stirring for 15 min. Drops of PDMS curing agent (3.65%) were then added. Finally, 200 µL of the homogeneous mixture was deposited on plastic well-plates (d = 1.5 cm) for gelation. The gelation procedure took place at 40 °C for 24 h.

2.4. Analytical Response Measurements

2.4.1. Ammonium Measurement in Aqueous Matrix

The measurement of NH4+ in aqueous matrices was performed by introducing the sensing membrane into a vial containing 1 mL of NH4+ solution (NH4+ standards, water samples were diluted if necessary) and 1 mL of carbonate buffer (pH 11). The solution was then heated at 100 °C for 10 min. Finally, the sensing device was removed from the solution and the color change was measured by diffuse reflectance response. The color change of the sensor was easily observed by visual inspection.

2.4.2. Urea Measurement in Urine Matrix

Initially, protein precipitation of urine samples obtained from healthy volunteers was performed by adding 5 mL of 15% trichloroacetic acid to a 10 mL urine sample, and the mixture was left to stand for 5 min. The mixture was then centrifuged for 10 min at 3500 rpm and the precipitate-free liquid was taken and stored at 4 °C under dark conditions until the moment of the analysis. A quantity of 100 µL of urea standards or urine samples was introduced into a vial containing 1 mL of carbonate buffer (pH 11). A fourth part of the sensor was placed inside the vial and the mixture was heated at 100 °C for 10 min. Finally, the sensor was removed from the solution and its response was quantitatively measured by diffuse reflectance and semi-qualitatively measured by visual inspection.

2.4.3. Direct Urea Hydrolysis

In order to hydrolyze urea from urine samples, a 1:10 dilution step with deionized water was performed. Urease solution was prepared by dissolving 9 mg of the enzyme in 1 mL phosphate buffer (pH 7) and stored at 4 °C in the dark until use. Then, 100 µL of the diluted urine solution was mixed with 1 mL of phosphate buffer (pH 7.4) in an Eppendorf tube, and 20 µL of urease solution was added. The resulting solution was heated at 37 °C for 5 min in a water bath. The analytical assay was performed as described in Section 2.4.2 using the proposed sensor and the hydrolyzed urine solution (or NH4+ standard).

2.4.4. Solid Supported Urea Hydrolysis

The functionalization mechanism for covalent urease enzyme immobilization on borosilicate glass balls support (5 mm diameter) was carried out following a combination of experimental procedures found in the literature for silicate-based materials [44,45,46]. Initially, glass balls were treated with a mixture of H2O:HCl (37%):H2O2 (30%) (5:1:1) and continuously stirred for 2 h. Afterward, the mixture was removed, and the glass balls were washed with deionized water and air-dried. On the other hand, a solution composed of 1 mL of aminopropyltrimethoxysilane (APTMS), 5 mL of 0.1 M acetic acid, and 5 mL of isopropanol was prepared in a plastic beaker and stirred for 2 h. Then, 89 mL of isopropanol was added to the mixture, which was poured on the glass balls and left at 60 °C until dry. Finally, the glass balls were immersed in 300 μL of urease solution (see preparation in Section 2.4.3) and the mixture was stirred for 1 h. The remaining solution was eliminated, and the glass balls were ready to be used.
The urea hydrolysis procedure consisted of mixing 100 µL of the diluted urine solution with 1 mL of phosphate buffer (pH 7.4). Then, urease immobilized on the glass balls was added to the solution, and the mixture was heated at 37 °C for 5 min in a water bath. Glass supports were removed from the solution, and the hydrolyzed urine (or NH4+ standard) was analyzed following the experimental procedure described in Section 2.4.2.

3. Results

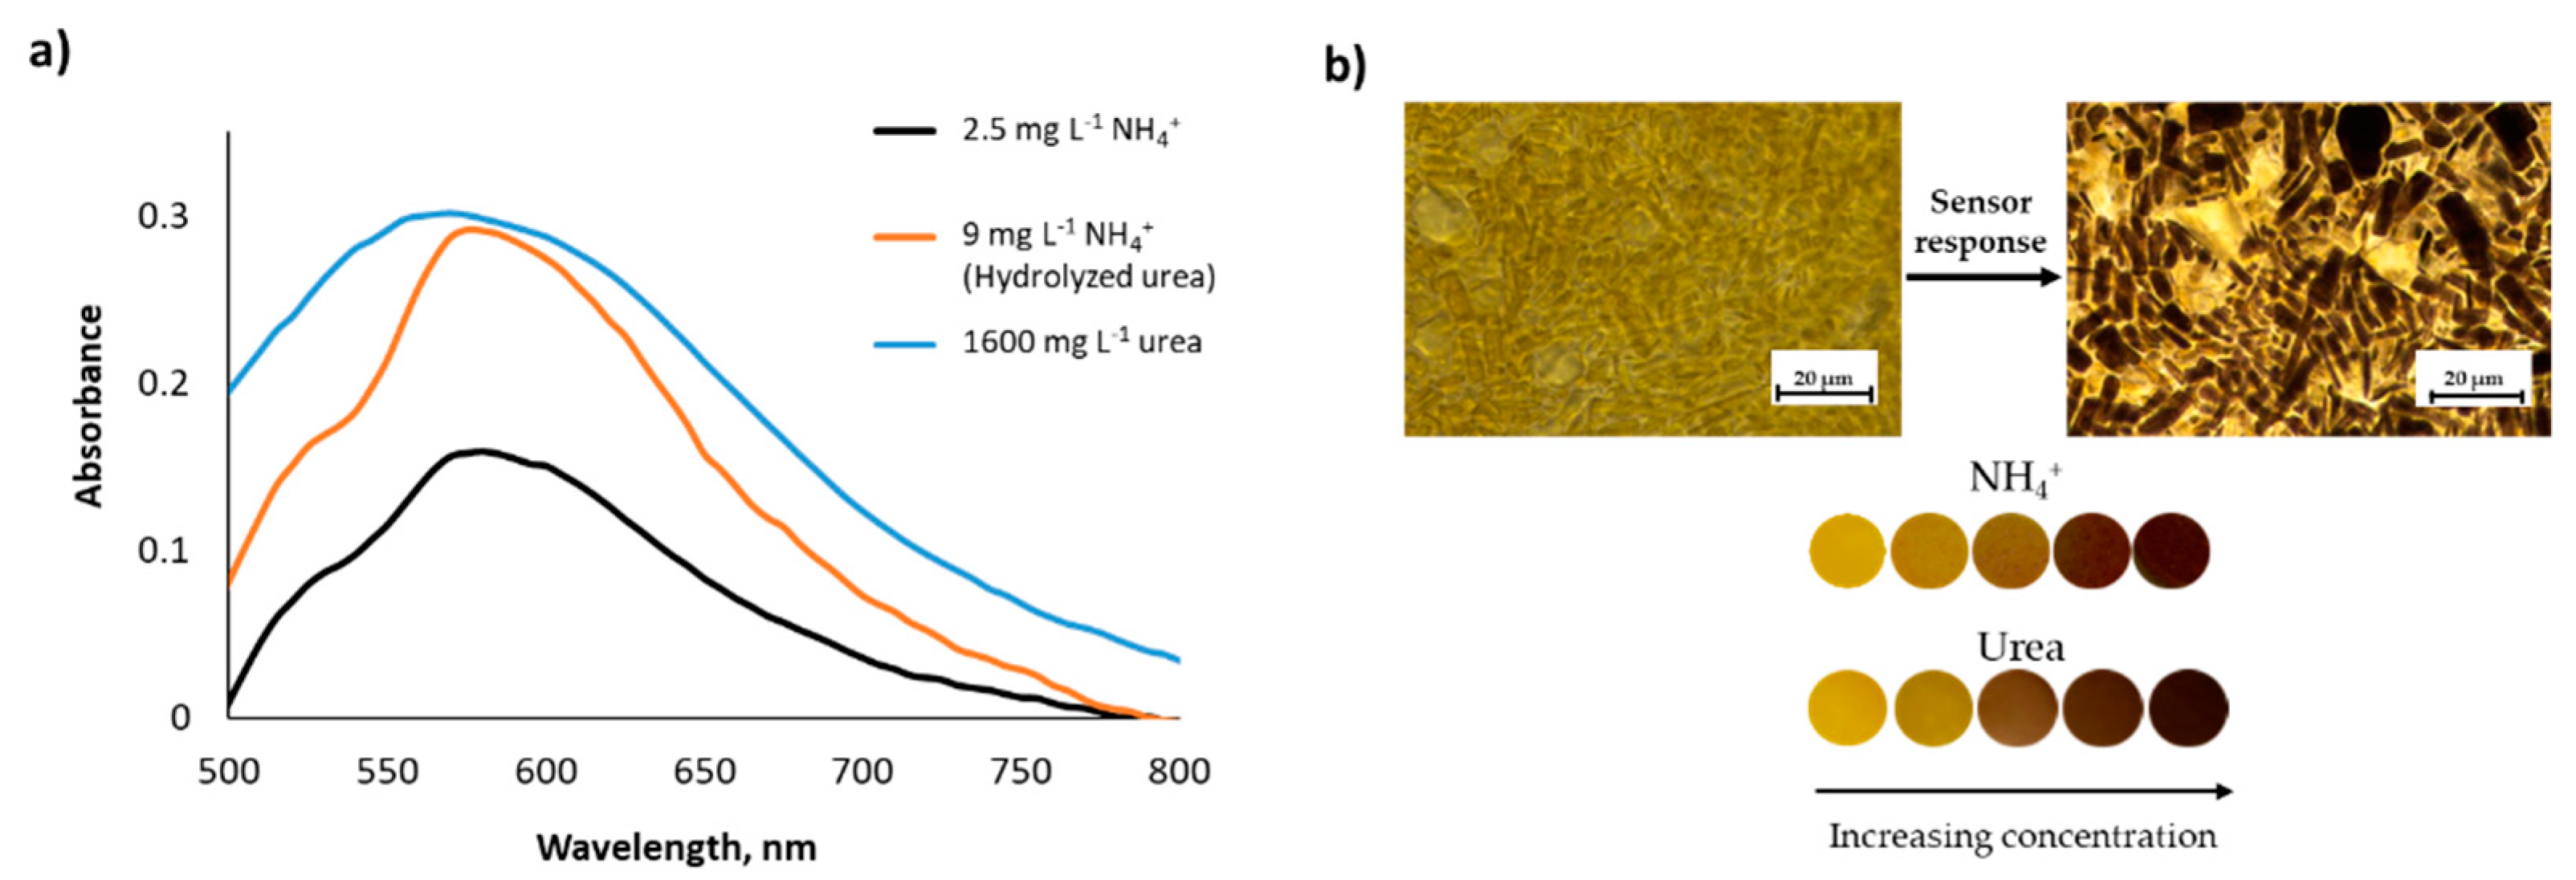
3.1. Performance of Solid Supported NQS-PDMS/TEOS-SiO2 NPs for Ammonium and Urea

The ammonium content, detected as ammonia by the chemical sensor, and urea were determined by the proposed sensing device. Colorimetric detection occurs when the target analyte diffuses along the porous PDMS/TEOS membrane and reacts with the colorimetric probe, NQS, embedded inside the sensing membrane, yielding a colorimetric signal that changes from orange to a brownish color [16]. For quantification purposes, initial studies were carried out in aqueous standards (NH4+ = 50 mg L−1) using the sensing membrane at room temperature and basic working conditions (pH 7) during sufficient reaction time to allow the colorimetric signal to evolve. Figure 2a shows the variation of the analytical response as a function of the content of the colorimetric dye. Experimentally, it was observed that a colorimetric dye content higher than 0.34% favored the diffusion of the derivatizing analyte toward the solution. In addition to this, no significant enhancement of the sensitivity was observed for the highest dye content during a 24 h reaction time, as can be seen in Figure 2a. Thus, 0.34% NQS content was selected as the optimal composition for the sensor.
On the other hand, it was found that more than 5 h were required for the colorimetric signal to reach an adequate sensitivity level. In an attempt to reduce the reaction time and improve the sensitivity, a thermal treatment was evaluated, since changes in the reaction temperature can change the adsorption behavior and thereby affect the sensitivity. To this end, three different temperatures (15, 60, and 100 °C) at two reaction times (5 and 10 min) were studied, as shown in Figure 2b. The results suggested that an increased temperature drastically reduced the reaction time to achieve a given sensitivity, and therefore would be advantageous for practical application. However, the thermal treatment also induced a loss of physical robustness of the sensing membrane. With the aim of improving the thermal stability of the membrane, SiO2 NPs were tested as dopants [47]. The results indicated in Figure 2c confirmed that the presence of SiO2 NPs enhanced the stability of the sensors in the thermal treatment, as the sensing membrane deformation was completely avoided at a percentage of 0.4%. Moreover, the presence of SiO2 NPs also helped prevent the leaching of the colorimetric dye to the solution at high temperatures, most likely because the NPs acted as additional adsorption sites. Additionally, the sensing device performance was examined under different pH conditions (pH 7, 9, and 11) in order to determine the extent to which the membranes respond to these changes and find the optimal working conditions. As depicted in Figure 2d, the sensor response increased as a function of pH, as the NQS reaction is favored at higher pH [18]. Therefore, pH 11 was chosen as the best working condition. Scanning electron microscopy (SEM) was employed for the characterization of the proposed sensing membrane. Taking into account the optimal synthetic as well as performance conditions of the PDMS sensor, SEM images of the reference sensor (blank) were obtained. The morphology of the PDMS polymeric matrix exhibited noticeable porosity, as shown in Figure 2e. In addition, the presence of SiO2 NPs confers the stability of the sensor in the thermal treatment, enhancing its mechanical properties (see Figure 2f).
Interday and intraday precision of the proposed sensor were evaluated by the relative standard deviation (%RSD) values. In this context, the same batch precision study was performed, and the analytical response of the sensor was evaluated. Satisfactory interday (7.25%) and intraday (7.83%) RSD values were obtained. Regarding batch-to-batch precision, intraday RSD values were lower than 8%, and the interday RSD value was 6%, which are satisfactory precision RSD values. Additionally, it should be noted that the sensing membrane was stable as the sol-gel methodology guarantees the stability of the guest molecules as well as the reaction products. The stiffness of the silica matrix prevented the polymeric matrix of agglomerations and guest molecule leaching. These results bear evidence to the fact that the proposed sensing membrane is a reliable and reproducible device to achieve an estimation of NH3/NH4+ in an aqueous medium.

3.2. Sensitivity for Ammonium and Urea Standard Solutions

The performance of the NQS colorimetric probe encapsulated within the PDMS matrix was investigated in the presence of NH4+ (expressed as NH3) and amine groups of urea standards, CO(NH2)2 in an aqueous solution. NH4+ and urea standards were prepared following the experimental procedures described in Section 2.4.1 and Section 2.4.2, respectively. Reflectance diffuse measurements when using a conventional spectrophotometer were registered, and absorption spectra profiles were obtained. A maximum absorption was found at 590 nm for ammonium and urea standards when representing the difference in UV–visible spectra with respect to the blank standard, as shown in Figure 3. Calibration curves obtained for both analytes, listed in Table 1, indicated satisfactory sensitivity and good linearity of the proposed NQS-based sensor. These results suggest that the NQS-doped PDMS sensor can be a potential candidate for monitoring ammonium and urea in water and urine samples, respectively.

3.3. Sensor Device Performance for Hydrolyzed Urea: Urease in Solution vs. Immobilized on Borosilicate Glass Balls

We further explored the applicability of the sensing device for monitoring ammonia generated in situ in the working medium when enzymatic catalysis of urea takes place in the presence of urease [36]. This enzyme hydrolyzes urea into ammonium, and the catalytic reaction typically occurs in solution. Urease solution was prepared as described in Section 2.4.3. The optimal reaction conditions employed were 37 °C and a 5 min reaction time. Regarding urease solution, several urease volumes were assayed in order to determine the optimal urease quantity for hydrolyzing 5.3 mg L−1 of urea. As listed in Table 2, a 20 µL volume was found to be the most appropriate to perform the analysis as the sensor response was not significantly enhanced for higher urease volumes. In these conditions, the urease enzyme was capable of hydrolyzing an amount of urea equivalent to 6.2 mg L−1 of ammonia in solution. Satisfactory accuracy values near 100% were obtained.
By fixing the previous reaction conditions, urea hydrolysis was studied following the experimental procedure from Section 2.4.3. The calibration curve obtained for hydrolyzed urea in solution was obtained in a conventional spectrophotometer and is indicated in Table 1. A similar slope was found for both NH4+ and hydrolyzed urea determinations, which broadens the applicability of the ammonia sensor for detecting both ammonium and hydrolyzed urea. Moreover, the catalytic reaction was investigated in the presence of urease enzyme when it was immobilized on a glass support [37]. Borosilicate glass balls were selected as a solid support on which urease covalently bonded by following the experimental procedure described in Section 2.4.4. Mainly, the strategy for urease immobilization was based on three steps, depicted in Figure 4: (1) glass balls were treated with H2O:HCl:H2O2 (5:1:1) to eliminate contaminants and activate the glass surface with hydroxyl groups [16,46,48]; (2) the activated glass surface was aminofunctionalized with a mixture of APTMS, acetic acid, and isopropanol; and (3) enzyme immobilization covalently bonded to the APTMS by means of the –NH2 groups.
The sensor performance was investigated in the presence of either urease in solution or immobilized on a glass surface. Diffuse reflectance measurements were performed for hydrolyzed urea standards, and calibration slopes were compared. As shown in Figure 5, the calibration slope of urease in solution was 0.0333 ± 0.0015 L mg−1, and 0.033 ± 0.0004 L mg−1 was obtained for immobilized urease. This result implies that urea hydrolysis is equally effective for both types of experiments. Hence, it is worth mentioning that the immobilization process accounts for an interesting alternative when urease stability and reusability are considered. Additionally, spiked urine samples (n = 2) were analyzed, and similar slopes were obtained for the samples and both urea hydrolysis strategies, as plotted in Figure 5. This implies that no matrix effects were present for hydrolyzed urea determination, making the proposed sensing device a potential candidate for in situ detection.

4. Proof of Concepts

4.1. Water Matrix

Ammonium was monitored in water samples coming from two different water treatment plants (region of Valencia). Samples were analyzed as described in Section 2.4.1. In the case of water treatment plant 1, the found concentrations and colorimetric response for the entrance, decantation, and exit stages are given in Table 3. The colorimetric sensor response and absorbance signals were in agreement with the expected results, that is, the lowest ammonium concentration was found at the exit stage of the treatment plant. In addition to these water samples, wastewaters subjected to oxic and anoxic treatment processes were also studied with the proposed sensing device. The found concentrations calculated for samples S1 and S2 (anoxic treatment reactor input and output, respectively) and samples S3 and S4 (oxic treatment reactor input and output, respectively) were in agreement with the treatments undergone by the samples in the different reactors (see Table 3). In fact, the main difference between the oxic and anoxic processes is the employment of oxygen during water treatment. Typically, anoxic treatment processes are used for the treatment of waste that has a high concentration of biodegradable organic material. Additionally, a recovery study was carried out by analyzing spiked samples with NH4+ 1.5 mg L−1. As listed in Table 3, these values were also satisfactory, involving no significant matrix effects in ammonium determination.

4.2. Urine Matrix: Direct Urea and Urease-Catalyzed Hydrolysis Sensing

Direct urea analysis was assayed considering the possible interferences of the nitrogen-based contribution provided by proteins in urine. For the sake of comparison, different urine samples with and without protein precipitation pre-treatment were analyzed. As shown in Table 4, absorbance values for untreated urine were 0.6615 and 0.5654, whereas values of 0.3869 and 0.2895 were obtained for deproteinized urine samples. These results suggest that the presence of proteins in urine samples interfered with direct urea detection, giving rise to an overestimation of the nitrogen-based content. Hence, protein precipitation was considered an essential pre-treatment step for eliminating protein interference following the experimental procedure described in Section 2.4.2. The sensor response was analyzed, and urea concentration was quantitatively determined, as listed in Table 4. The results obtained fall in the upper part of the expected human urea range [32].
Sensor performance was also assessed when urease-catalyzed hydrolysis of urea took place in urine samples. In this case, the sample pre-treatment step consisted of diluting the urine without the protein precipitation procedure. In fact, the blank sensor response (0.2273) was similar to sample responses (0.2169 and 0.1974), which implied the absence of protein interference. Therefore, different pretreatment steps are required depending on the target analyte, that is, urea or hydrolyzed urea. The quantitative analysis yielded the urea concentrations indicated in Table 5. Similar urea concentrations were found for both types of enzymatic catalysis, that is, urease in solution or urease immobilized on a glass support. These results imply that the proposed sensor is reliable and independent of the conditions of the catalytic process, giving rise to a robust in situ analytical method.

5. Validation of NQS-Based Sensing Device: Thymol Sensor

With the aim of proving NQS-based sensor reliability, a validation study of the accuracy of urea content in urine samples was carried out using a PDMS composite containing the reagents of the Berthelot reaction, which are released into the reaction medium [10]. Due to the fact that this colorimetric reaction occurs in solution, urea hydrolysis was only carried out in the presence of urease enzyme immobilized on the spherical glass support. Following the measurement procedure described in reference [10], the typical indothymol blue band at 690 nm appears after 5 min reaction time and can be visually detected due to the color change from yellow to green. The absorbance of the solution (hydrolyzed urea standard or urine sample) was registered, and a calibration curve was obtained. Here, hydrolyzed fortified samples were also represented. Similar calibration slopes were found for both types of samples, as listed in Table 6. As stated for the proposed NQS-based sensor, the absence of a matrix effect in urea determination was demonstrated by the thymol sensor. The estimated urea concentration was 10.0 ± 2 g L−1 for the same urine sample from Table 5. As can be seen, this result is similar to the mean value (12.5 ± 0.3 g L−1) obtained with the NQS sensor, which validates the reliability of the NQS-based sensing device.

6. In Situ Analysis

Taking advantage of the portability provided by the NQS-based sensor, we further explored the feasibility of performing quantitative in situ analysis using portable instrumentation [8]. Lately, smartphones have become the most popular intelligent device that offers advantages such as portability and a user-friendly operating system [49,50]. In this context, a smartphone coupled to a miniaturized spectrometer was selected as a portable measuring device for detecting ammonium in wastewater samples. The calibration equation parameters were obtained and compared to those obtained by a conventional spectrophotometer. The results are listed in Table 1. Values of 0.035 and 0.0316 L mg−1 for the slope were obtained for conventional and portable spectrometers, respectively. This result suggests that it is possible to perform reliable absorbance measurements using portable instrumentation, which improves the effectiveness of in-situ analysis. Moreover, digital image analysis was also exploited. The calibration curve was obtained by registering the RGB coordinates from the sensor image taken by the smartphone. Quantification analysis was performed using the ImageJ processing tool. In this case, the most sensitive color component was the red coordinate, which had a slope value of −5.9 and could be understood as a decrease in the orange coloring of the NQS-based sensor as the ammonium concentration increased in the working medium. In conclusion, reasonable calibration parameters were obtained when using smartphone-based devices, which could be employed as additional support for in situ analysis. This portability aspect confers a remarkable advantage of the proposed sensing membrane for detecting ammonium and urea. Table 7 gives the selected methodologies for these analytes, which were proposed or could be adapted for in situ analysis. From this table, it can be concluded that the proposed sensor is an environmentally friendly alternative for in situ ammonium and urea determination.

7. Discussion

The present work demonstrated the potential application of NQS-doped PDMS-based sensors to determine both NH4+ in water samples and urea in urine samples. The sensing device showed good precision (RSD < 8%), satisfactory stability, and promising versatility when analyzing different wastewater samples and different human urines. The colorimetric response obtained was registered by conventional diffuse reflectance measurements and smartphone-supported spectrometric measurements for quantitative analysis. In both cases, satisfactory results were obtained and showed good concordance. Moreover, semi-quantitative analysis is available by visual inspection of the sensor color, making it a user-friendly device for in situ analysis purposes. In addition to ammonia, direct urea detection was also assessed by the proposed sensing device. Urea hydrolysis was also analyzed in the presence of urease enzyme in solution and immobilized on a glass support. Both hydrolysis reactions were demonstrated to be quantitative, which increases the feasibility of the proposed sensor as a promising sensing device. Hence, the results obtained broaden the application of the NQS-based sensor to analyze amino groups present in biological matrices, such as urine, in addition to water matrices.

Author Contributions

Conceptualization, P.C.-F.; Investigation, A.M.-A., L.H., A.B.-C., Y.M.-M., C.M.-L. and P.C.-F.; Methodology, A.M.-A., L.H., A.B.-C. and Y.M.-M.; Resources, P.C.-F.; Supervision, C.M.-L. and P.C.-F. All authors have read and agreed to the published version of the manuscript.

Funding

This research was funded by EU FEDER and the Gobierno de España MCIU-AEI (CTQ2017-90082-P) and the Generalitat Valenciana (PROMETEO 2020/078).

Institutional Review Board Statement

Not applicable.

Informed Consent Statement

Not applicable.

Data Availability Statement

Not applicable.

Acknowledgments

A. Martínez-Aviñó is grateful to the GV-UV for his grant APOTIP/2019/A/008 (Conselleria d’Educacio, Investigació, Cultura i Esport). L. Hakobyan expresses her gratitude to Agencia Valenciana de Innovación (AVI- INNVAL10/19/058). A. Balleter-Caudet expresses her gratitude to the PROMETEO program and CTQ2017-90082-P project for her postdoctoral funding.

Conflicts of Interest

The authors declare no conflict of interest.

References

  1. Ni, J.-Q.; Diehl, C.A.; Chai, L.; Chen, Y.; Heber, A.J.; Lim, T.-T.; Bogan, B.W. Factors and characteristics of ammonia, hydrogen sulfide, carbon dioxide, and particulate matter emissions from two manure-belt layer hen houses. Atmos. Environ. 2017, 156, 113–124. [Google Scholar] [CrossRef]
  2. Williams Ischer, S.; Farnell, M.B.; Tabler, G.T.; Moreira, M.; O’Shaughnessy, P.T.; Nonnenmann, M.W. Evaluation of a sprinkler cooling system on inhalable dust and ammonia concentrations in broiler chicken production. J. Occup. Environ. Hyg. 2017, 14, 40–48. [Google Scholar] [CrossRef]
  3. Zhao, L.; Hadlocon, L.J.S.; Manuzon, R.B.; Darr, M.J.; Keener, H.M.; Heber, A.J.; Ni, J. Ammonia concentrations and emission rates at a commercial poultry manure composting facility. Biosyst. Eng. 2016, 150, 69–78. [Google Scholar] [CrossRef] [Green Version]
  4. Zimmerman, J.B.; Mihelcic, J.R.; Smith, A.J. Global Stressors on Water Quality and Quantity. Environ. Sci. Technol. 2008, 42, 4247–4254. [Google Scholar] [CrossRef] [PubMed] [Green Version]
  5. Li, D.; Watson, C.J.; Yan, M.J.; Lalor, S.; Rafique, R.; Hyde, B.; Lanigan, G.; Richards, K.G.; Holden, N.M.; Humphreys, J. A review of nitrous oxide mitigation by farm nitrogen management in temperate grassland-based agriculture. J. Environ. Manag. 2013, 128, 893–903. [Google Scholar] [CrossRef] [Green Version]
  6. DIRECTIVE 2000/60/EC of the European Parliament and of the Council of 23 October 2000 Establishing a Framework for Community Action in the Field of Water Policy, L-327/1 (2000), Luxembourg. Available online: https://eur-lex.europa.eu/eli/dir/2000/60/oj (accessed on 10 May 2021).
  7. Di Blasi, J.I.P.; Martínez Torres, J.; García Nieto, P.J.; Alonso Fernández, J.R.; Díaz Muñiz, C.; Taboada, J. Analysis and detection of outliers in water quality parameters from different automated monitoring stations in the Miño river basin (NW Spain). Ecol. Eng. 2013, 60, 60–66. [Google Scholar] [CrossRef]
  8. Jornet-Martínez, N.; Moliner-Martínez, Y.; Molins-Legua, C.; Campíns-Falcó, P. Trends for the Development of In Situ Analysis Devices. In Encyclopedia of Analytical Chemistry; John Wiley & Sons, Ltd.: Chichester, UK, 2017; pp. 1–23. [Google Scholar]
  9. Hulanicki, A.; Glab, S.; Ingman, F. Chemical sensors: Definitions and classification. Pure Appl. Chem. 1991, 63, 1247–1250. [Google Scholar] [CrossRef]
  10. Prieto-Blanco, M.C.; Jornet-Martínez, N.; Moliner-Martínez, Y.; Molins-Legua, C.; Herráez-Hernández, R.; Verdú Andrés, J.; Campins-Falcó, P. Development of a polydimethylsiloxane–thymol/nitroprusside composite based sensor involving thymol derivatization for ammonium monitoring in water samples. Sci. Total Environ. 2015, 503–504, 105–112. [Google Scholar] [CrossRef]
  11. Prieto-Blanco, M.C.; Ballester-Caudet, A.; Souto-Varela, F.J.; López-Mahía, P.; Campíns-Falcó, P. Rapid evaluation of ammonium in different rain events minimizing needed volume by a cost-effective and sustainable PDMS supported solid sensor. Environ. Pollut. 2020, 265, 114911. [Google Scholar] [CrossRef]
  12. Xu, M.; Bunes, B.R.; Zang, L. Paper-Based Vapor Detection of Hydrogen Peroxide: Colorimetric Sensing with Tunable Interface. ACS Appl. Mater. Interfaces 2011, 3, 642–647. [Google Scholar] [CrossRef]
  13. Jornet-Martínez, N.; Hakobyan, L.; Argente-García, A.I.; Molins-Legua, C.; Campíns-Falcó, P. Nylon-Supported Plasmonic Assay Based on the Aggregation of Silver Nanoparticles: In Situ Determination of Hydrogen Sulfide-like Compounds in Breath Samples as a Proof of Concept. ACS Sens. 2019, 4, 2164–2172. [Google Scholar] [CrossRef]
  14. Muñoz-Ortuño, M.; Argente-García, A.; Moliner-Martínez, Y.; Molins-Legua, C.; Campíns-Falcó, P. Polydimethylsiloxane composites containing 1,2-naphtoquinone 4-sulphonate as unique dispositive for estimation of casein in effluents from dairy industries. Anal. Chim. Acta 2015, 873, 31–37. [Google Scholar] [CrossRef]
  15. Argente-García, A.; Jornet-Martínez, N.; Herráez-Hernández, R.; Campíns-Falcó, P. A solid colorimetric sensor for the analysis of amphetamine-like street samples. Anal. Chim. Acta 2016, 943, 123–130. [Google Scholar] [CrossRef]
  16. Jornet-Martínez, N.; Moliner-Martínez, Y.; Herráez-Hernández, R.; Molins-Legua, C.; Verdú-Andrés, J.; Campíns-Falcó, P. Designing solid optical sensors for in situ passive discrimination of volatile amines based on a new one-step hydrophilic PDMS preparation. Sens. Actuators B Chem. 2016, 223, 333–342. [Google Scholar] [CrossRef]
  17. Campíns-Falcó, P.; Moliner-Martínez, Y.; Herráez-Hernández, R.; Molins-Legua, C.; Verdú-Andrés, J. Passive Sensor for In Situ Amines Detection in Atmospheres. Spain Patent P201300436, 10 February 2018. [Google Scholar]
  18. Argente-García, A.; Muñoz-Ortuño, M.; Molins-Legua, C.; Moliner-Martínez, Y.; Campíns-Falcó, P. A solid device based on doped hybrid composites for controlling the dosage of the biocide N-(3-aminopropyl)-N-dodecyl-1,3-propanediamine in industrial formulations. Talanta 2016, 147, 147–154. [Google Scholar] [CrossRef] [PubMed]
  19. Singh, M.P.; Singh, R.K.; Chandra, S. Ionic liquids confined in porous matrices: Physicochemical properties and applications. Prog. Mater. Sci. 2014, 64, 73–120. [Google Scholar] [CrossRef]
  20. Muginova, S.V.; Myasnikova, D.; Kazarian, S.G.; Shekhovtsova, T.N. Applications of ionic liquids for the development of optical chemical sensors and biosensors. Anal. Sci. 2017, 33, 261. [Google Scholar] [CrossRef] [PubMed] [Green Version]
  21. Horowitz, A.I.; Panzer, M.J. Poly(dimethylsiloxane)-Supported Ionogels with a High Ionic Liquid Loading. Angew. Chem. Int. Ed. 2014, 53, 9780–9783. [Google Scholar] [CrossRef]
  22. Le Bideau, J.; Viau, L.; Vioux, A. Ionogels, ionic liquid based hybrid materials. Chem. Soc. Rev. 2011, 40, 907–925. [Google Scholar] [CrossRef]
  23. Clark, K.D.; Zhang, C.; Anderson, J.L. Sample Preparation for Bioanalytical and Pharmaceutical Analysis. Anal. Chem. 2016, 88, 11262–11270. [Google Scholar] [CrossRef] [Green Version]
  24. Ballester-Caudet, A.; Hakobyan, L.; Moliner-Martinez, Y.; Molins-Legua, C.; Campíns-Falcó, P. Ionic-liquid doped polymeric composite as passive colorimetric sensor for meat freshness as a use case. Talanta 2021, 223, 121778. [Google Scholar] [CrossRef]
  25. Lambert, D.F.; Sherwood, J.E.; Francis, P.S. The determination of urea in soil extracts and related samples—A review. Soil Res. 2004, 42, 709. [Google Scholar] [CrossRef]
  26. Safitri, E.; Heng, L.Y.; Ahmad, M.; Ling, T.L. Fluorescence bioanalytical method for urea determination based on water soluble ZnS quantum dots. Sens. Actuators B Chem. 2017, 240, 763–769. [Google Scholar] [CrossRef]
  27. Alizadeh, T.; Ganjali, M.R.; Rafiei, F. Trace level and highly selective determination of urea in various real samples based upon voltammetric analysis of diacetylmonoxime-urea reaction product on the carbon nanotube/carbon paste electrode. Anal. Chim. Acta 2017, 974, 54–62. [Google Scholar] [CrossRef] [PubMed]
  28. Tůma, P.; Samcová, E.; Duška, F. Determination of ammonia, creatinine and inorganic cations in urine using CE with contactless conductivity detection. J. Sep. Sci. 2008, 31, 2260–2264. [Google Scholar] [CrossRef]
  29. Mizobuchi, M.; Tamase, K.; Kitada, Y.; Sasaki, M.; Tanigawa, K. High-performance liquid chromatographic analysis of ammonium in human urine. Anal. Biochem. 1984, 137, 88–92. [Google Scholar] [CrossRef]
  30. Raphael, K.L.; Carroll, D.J.; Murray, J.; Greene, T.; Beddhu, S. Urine Ammonium Predicts Clinical Outcomes in Hypertensive Kidney Disease. J. Am. Soc. Nephrol. 2017, 28, 2483–2490. [Google Scholar] [CrossRef] [PubMed]
  31. Ali, S.M.U.; Ibupoto, Z.H.; Salman, S.; Nur, O.; Willander, M.; Danielsson, B. Selective determination of urea using urease immobilized on ZnO nanowires. Sens. Actuators B Chem. 2011, 160, 637–643. [Google Scholar] [CrossRef] [Green Version]
  32. Prats-Alfonso, E.; Abad, L.; Casañ-Pastor, N.; Gonzalo-Ruiz, J.; Baldrich, E. Iridium oxide pH sensor for biomedical applications. Case urea–urease in real urine samples. Biosens. Bioelectron. 2013, 39, 163–169. [Google Scholar] [CrossRef]
  33. Velychko, T.P.; Soldatkin, O.O.; Melnyk, V.G.; Marchenko, S.V.; Kirdeciler, S.K.; Akata, B.; Soldatkin, A.P.; El’skaya, A.V.; Dzyadevych, S.V. A Novel Conductometric Urea Biosensor with Improved Analytical Characteristic Based on Recombinant Urease Adsorbed on Nanoparticle of Silicalite. Nanoscale Res. Lett. 2016, 11, 106. [Google Scholar] [CrossRef] [PubMed] [Green Version]
  34. Yang, Z.; Zhang, C. Single-enzyme nanoparticles based urea biosensor. Sens. Actuators B Chem. 2013, 188, 313–317. [Google Scholar] [CrossRef]
  35. Kuralay, F.; Özyörük, H.; Yıldız, A. Amperometric enzyme electrode for urea determination using immobilized urease in poly(vinylferrocenium) film. Sens. Actuators B Chem. 2006, 114, 500–506. [Google Scholar] [CrossRef]
  36. Danial, E.N.; Hamza, A.H.; Mahmoud, R.H. Characteristics of Immobilized Urease on Grafted Alginate Bead Systems. Brazilian Arch. Biol. Technol. 2015, 58, 147–153. [Google Scholar] [CrossRef] [Green Version]
  37. Sassolas, A.; Blum, L.J.; Leca-Bouvier, B.D. Immobilization strategies to develop enzymatic biosensors. Biotechnol. Adv. 2012, 30, 489–511. [Google Scholar] [CrossRef]
  38. Zucca, P.; Sanjust, E. Inorganic Materials as Supports for Covalent Enzyme Immobilization: Methods and Mechanisms. Molecules 2014, 19, 14139–14194. [Google Scholar] [CrossRef] [PubMed]
  39. Bocanegra-Rodríguez, S.; Jornet-Martínez, N.; Molins-Legua, C.; Campíns-Falcó, P. New Reusable Solid Biosensor with Covalent Immobilization of the Horseradish Peroxidase Enzyme: In Situ Liberation Studies of Hydrogen Peroxide by Portable Chemiluminescent Determination. ACS Omega 2020, 5, 2419–2427. [Google Scholar] [CrossRef] [Green Version]
  40. Tanii, T.; Hosaka, T.; Miyake, T.; Zhang, G.-J.; Zako, T.; Funatsu, T.; Ohdomari, I. Preferential immobilization of biomolecules on silicon microstructure array by means of electron beam lithography on organosilane self-assembled monolayer resist. Appl. Surf. Sci. 2004, 234, 102–106. [Google Scholar] [CrossRef]
  41. Kunduru, K.R.; Basu, A.; Abtew, E.; Tsach, T.; Domb, A.J. Polymeric sensors containing P-dimethylaminocinnamaldehyde: Colorimetric detection of urea nitrate. Sens. Actuators B Chem. 2017, 238, 387–391. [Google Scholar] [CrossRef]
  42. Suarez, W.T.; de Alvarenga Junior, B.R.; de Oliveira Krambeck Franco, M.; Gabriel, W.L.; de Oliveira, D.M.; dos Santos, V.B. In Situ Determination of Urea in Milk Employing a Portable and Low-Cost LED Photometer. Food Anal. Methods 2018, 11, 1149–1154. [Google Scholar] [CrossRef]
  43. Hassan, R.Y.A.; Kamel, A.M.; Hashem, M.S.; Hassan, H.N.A.; Abd El-Ghaffar, M.A. A new disposable biosensor platform: Carbon nanotube/poly(o-toluidine) nanocomposite for direct biosensing of urea. J. Solid State Electrochem. 2018, 22, 1817–1823. [Google Scholar] [CrossRef]
  44. Ibarlucea, B.; Fernández-Sánchez, C.; Demming, S.; Büttgenbach, S.; Llobera, A. Selective functionalisation of PDMS-based photonic lab on a chip for biosensing. Analyst 2011, 136, 3496. [Google Scholar] [CrossRef]
  45. Kreider, A.; Richter, K.; Sell, S.; Fenske, M.; Tornow, C.; Stenzel, V.; Grunwald, I. Functionalization of PDMS modified and plasma activated two-component polyurethane coatings by surface attachment of enzymes. Appl. Surf. Sci. 2013, 273, 562–569. [Google Scholar] [CrossRef]
  46. Vianello, F.; Zennaro, L.; Rigo, A. A coulometric biosensor to determine hydrogen peroxide using a monomolecular layer of horseradish peroxidase immobilized on a glass surface. Biosens. Bioelectron. 2007, 22, 2694–2699. [Google Scholar] [CrossRef] [PubMed]
  47. Tricoli, A.; Righettoni, M.; Teleki, A. Semiconductor Gas Sensors: Dry Synthesis and Application. Angew. Chem. Int. Ed. 2010, 49, 7632–7659. [Google Scholar] [CrossRef]
  48. Cha, C.; Antoniadou, E.; Lee, M.; Jeong, J.H.; Ahmed, W.W.; Saif, T.A.; Boppart, S.A.; Kong, H. Tailoring Hydrogel Adhesion to Polydimethylsiloxane Substrates Using Polysaccharide Glue. Angew. Chem. Int. Ed. 2013, 52, 6949–6952. [Google Scholar] [CrossRef]
  49. Ding, H.; Chen, C.; Qi, S.; Han, C.; Yue, C. Smartphone-based spectrometer with high spectral accuracy for mHealth application. Sens. Actuators A Phys. 2018, 274, 94–100. [Google Scholar] [CrossRef]
  50. Saraji, M.; Bagheri, N. Paper-based headspace extraction combined with digital image analysis for trace determination of cyanide in water samples. Sens. Actuators B Chem. 2018, 270, 28–34. [Google Scholar] [CrossRef]
  51. Meseguer-Lloret, S.; Molins-Legua, C.; Campins-Falco, P. Ammonium Determination in Water Samples by Using Opa-Nac Reagent: A Comparative Study with Nessler and Ammonium Selective Electrode Methods. Int. J. Environ. Anal. Chem. 2002, 82, 475–489. [Google Scholar] [CrossRef]
  52. Liang, Y.; Yan, C.; Guo, Q.; Xu, J.; Hu, H. Spectrophotometric determination of ammonia nitrogen in water by flow injection analysis based on NH3-o-phthalaldehyde-Na2SO3 reaction. Anal. Chem. Res. 2016, 10, 1–8. [Google Scholar] [CrossRef] [Green Version]
  53. Peters, J.J.; Almeida, M.I.G.S.; O’Connor Šraj, L.; McKelvie, I.D.; Kolev, S.D. Development of a micro-distillation microfluidic paper-based analytical device as a screening tool for total ammonia monitoring in freshwaters. Anal. Chim. Acta 2019, 1079, 120–128. [Google Scholar] [CrossRef]
  54. Kan, Y. An All-Solid-State Ammonium Ion-Selective Electrode Based on Polyaniline as Transducer and Poly (o-phenylenediamine) as Sensitive Membrane. Int. J. Electrochem. Sci. 2016, 11, 9928–9940. [Google Scholar] [CrossRef]
  55. Saeedfar, K.; Heng, L.; Ling, T.; Rezayi, M. Potentiometric Urea Biosensor Based on an Immobilised Fullerene-Urease Bio-Conjugate. Sensors 2013, 13, 16851–16866. [Google Scholar] [CrossRef] [Green Version]
  56. Rajesh; Bisht, V.; Takashima, W.; Kaneto, K. An amperometric urea biosensor based on covalent immobilization of urease onto an electrochemically prepared copolymer poly (N-3-aminopropyl pyrrole-co-pyrrole) film. Biomaterials 2005, 26, 3683–3690. [Google Scholar]
  57. Tsai, H.; Doong, R. Simultaneous determination of pH, urea, acetylcholine and heavy metals using array-based enzymatic optical biosensor. Biosens. Bioelectron. 2005, 20, 1796–1804. [Google Scholar] [CrossRef] [PubMed]
  58. De Melo, J.V.; Cosnier, S.; Mousty, C.; Martelet, C.; Jaffrezic-Renault, N. Urea Biosensors Based on Immobilization of Urease into Two Oppositely Charged Clays (Laponite and Zn-Al Layered Double Hydroxides). Anal. Chem. 2002, 74, 4037–4043. [Google Scholar] [CrossRef] [PubMed]
Figure 1. Steps of the sol-gel process that takes place for the sensor preparation.
Biosensors 11 00186 g001
Figure 2. NH4+ (50 mg L−1) standard solutions: (a) Variation of the colorimetric signal as a function of the NQS content and exposure time at room temperature. (b) Variation of the analytical signal as a function of the temperature for 5 and 10 min reaction times. (c) Variation of sensor response depending on the SiO2 NP composition tested. (d) Analytical response as a function of the pH and exposure time; inset: images of the sensing device in blank solution (yellow) and NH4+ standard solution 1.5 mg L−1 (brownish) after 5 h exposure time at room temperature. (e,f) SEM images of the synthesized NQS-PDMS sensing membrane, scale bar: 20 µm (e) and 30 µm (f).
Biosensors 11 00186 g002
Figure 3. (a) Difference in UV-Vis spectra between standards of 2.5 mg L−1 NH4+ (black line), 9 mg L−1 NH4+ coming from hydrolyzed urea (orange line), and 1600 mg L−1 urea (blue line) and the blank standard. (b) Top: Optical microscopy images of the PDMS membrane before (left) and after (right) being exposed to ammonium/urea in solution, scale bar: 20 µm. Bottom: Sensor photos referring to the evolution of the sensor color as a function of ammonium or urea concentration in solution.
Biosensors 11 00186 g003
Figure 4. Schematic diagram of covalent urease immobilization on a borosilicate glass surface involving surface functionalization with APTMS.
Biosensors 11 00186 g004
Figure 5. Calibration curves for hydrolyzed urea standards (blue) and spiked urine samples (n = 2, orange and grey) for urea catalysis by means of (a) urease enzyme in solution and (b) glass-supported urease immobilization.
Biosensors 11 00186 g005
Table 1. Calibration curves obtained for ammonia, urea, and hydrolyzed urea determination.
AnalyteInstrumentationLinearity (y = b0 + b1x)
b0 ± sbob1 ± sb1 (L mg−1)R2
AmmoniaConventional0.007 ± 0.0100.035 ± 0.0020.990
Portable0.006 ± 0.0100.0316 ± 0.00190.999
Smartphone193 ± 4−5.9 ± 0.7 (no units)0.957
UreaConventional0.003 ± 0.0100.153 ± 0.0080.995
−0.004 ± 0.0090.149 ± 0.0050.998
Ammonia 1Conventional0.014 ± 0.0160.032 ± 0.0030.990
Ammonia 2Conventional0.002 ± 0.0050.033 ± 0.0010.998
1 Hydrolysed urea with urease in solution. 2 Hydrolyzed urea when urease is immobilized on a solid support.
Table 2. Assayed volumes from urease solution, with absorbance at 590 nm, and equivalence to ammonia concentration.
Vurease (µL)Abs 590 nm[NH3] (mg L−1)Recovery (%)
00.2050--
100.3820595
200.4806, 0.47826.2, 6.1117, 116
400.4984, 0.49116.7, 6.5127, 123
Table 3. Colorimetric sensor response and found concentration from the entrance, decantation, and exit stages from water treatment plant 1 and anoxic and oxic reactors from water treatment plant 2. Sensor images from the different stages of a water treatment plant.
PLANT 1After Dilution
Concentration ± s
Real Concentration ± s
Biosensors 11 00186 i001Entrance6.15 ± 0.16123.0 ± 3.2
Biosensors 11 00186 i002Decantation6.99 ± 0.11139.8 ± 2.2
Biosensors 11 00186 i003Exit2.42 ± 0.094.82 ± 0.18
PLANT 2Found Concentration (mg L−1) (n = 3)Recovery (%)
(n = 3)
Anoxic reactor18.0 ± 0.7 195 ± 5
4.8 ± 0.2 290 ± 7
Oxic reactor2.5 ± 0.2 187 ± 7
<LOD 2100 ± 4
1 Water sample from the entrance of the treatment plant. 2 Water sample from the exit of the treatment plant.
Table 4. Absorbance values for untreated and deproteinized urine samples and found urea concentrations. Experimental scheme: direct urea → protein precipitation → sensor response.
UrineAbsorbance 590 nmUrea Concentration (g L−1)
UntreatedDeproteinized
Sample 10.66150.386927.7
Sample 20.56540.289520.7
Table 5. Urea concentration found in hydrolyzed urine samples. Experimental scheme: Hydrolyzed urea → dilution → sensor response.
UrineUrea Concentration (g L−1)
Hydrolysis in SolutionGlass Supported Hydrolysis
Sample 112.311.8
Sample 212.711.8
Average12.5 ± 0.312 ± 0
Table 6. Ammonia concentration found in hydrolyzed urine samples by the thymol-based sensor.
Ammoniab1 ± sb1 (L mg−1)R2
Hydrolyzed urea0.204 ± 0.0050.983
Hydrolyzed urine0.194 ± 0.0060.999
0.193 ± 0.0070.999
Table 7. Selected methodologies for ammonium and urea determination.
AMMONIUM
Option/RefTechniqueReagent(s)Time of Analysis (s)LOD (mg·L−1)Sample
Colorimetric sensor by reagent delivering/[10,11]UV-vis spectroscopyPDMS, thymol or salicylate, nitroprusside600/3000.4/0.03Environmental water
Ammonia selective
electrode/[51]
PotentiometryDerivatizing OPA-NAC
reagents
3000.07Environmental water
Chemical reaction/[52]FIA/UV-vis
spectroscopy
OPA-Na2SO3 mixed reagent solution6000.13Natural water
3D microfluidic paper-based device/[53]Digital image
processing/Reflectance
Nitrazine yellow (NY)/
bromothymol blue (BTB) as indicators
3000.41/0.6Freshwater
Ion-selective electrode (ISE)/[54]PotentiometryAg/nano-Ag/polyaniline/poly (o-phenylenediamine) doped electrode3000.22Tap water
Solid colorimetric
sensor/this work
Diffuse reflectance spectrophotometry
/digital image
processing
1,2-naphthoquinone-4-sulfonate (NQS), PDMS6000.4Environmental water
UREA
Urea biosensor/[55]PotentiometryUrease, surface-modified
fullerene nanomaterial
552.4Urine
Urea biosensor/[56]AmperometryUrease, poly(3-aminopropyl-pyrrole-co-pyrrole) support, electrochemical
deposition on indium-tin-
oxide-coated glass
421.2Human serum
Urea pH sensor/[32]PotentiometryIridium oxide films, silicon-based thin-film platinum microelectrode1804.7Urine
Enzymatic optical
biosensor/[57]
OpticalUrease, FITC-dextran sensing probe entrapped in TMOS6000.15River water,
serum
Enzyme-based field effect transistors/[58]PotentiometryUrease, layered double hydroxide (LDH) clay matrix, glutaraldehyde cross-linker<120.21Urine, blood
Solid colorimetric sensor (this work)Diffuse reflectance spectrophotometry/digital image processing1,2-naphthoquinone-4-sulfonate (NQS), PDMS6000.4Human urine
Publisher’s Note: MDPI stays neutral with regard to jurisdictional claims in published maps and institutional affiliations.

