Multi-Layer Reflectivity Calculation Based Meta-Modeling of the Phase Mapping Function for Highly Reproducible Surface Plasmon Resonance Biosensing


 ,
, 
Abstract
:1. Introduction
2. Materials and Methods
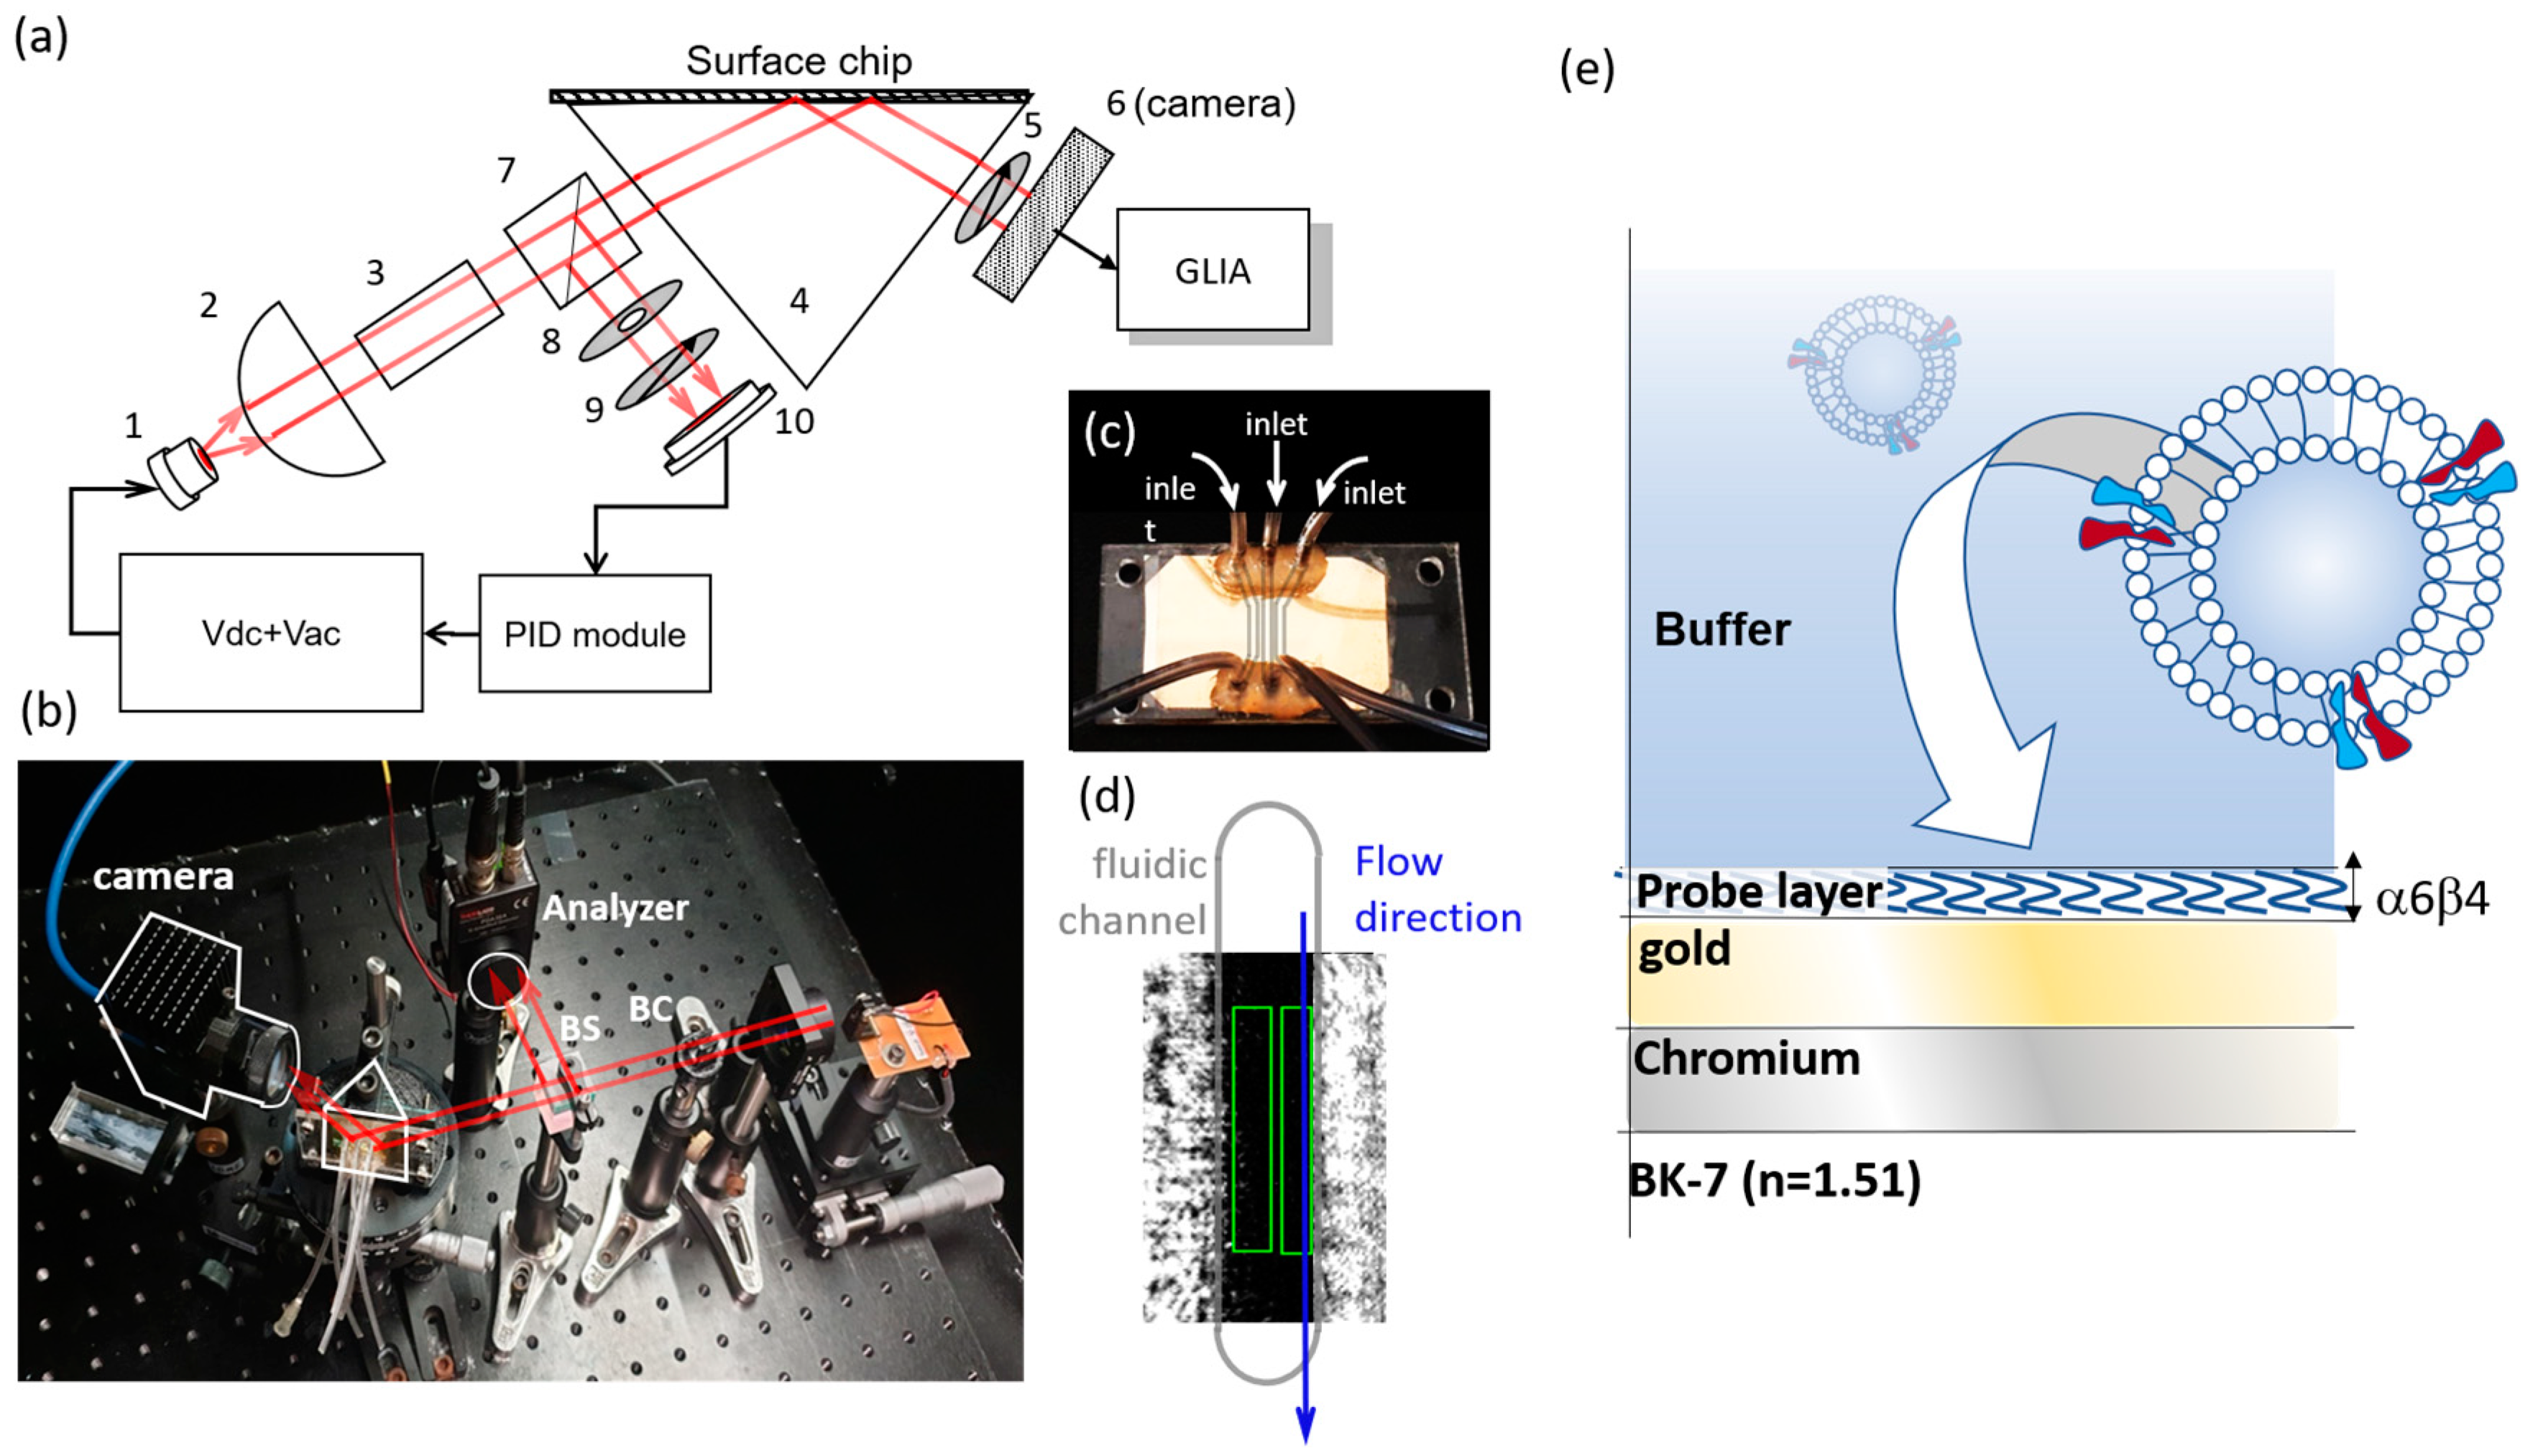
2.1. pSPR Set-Up
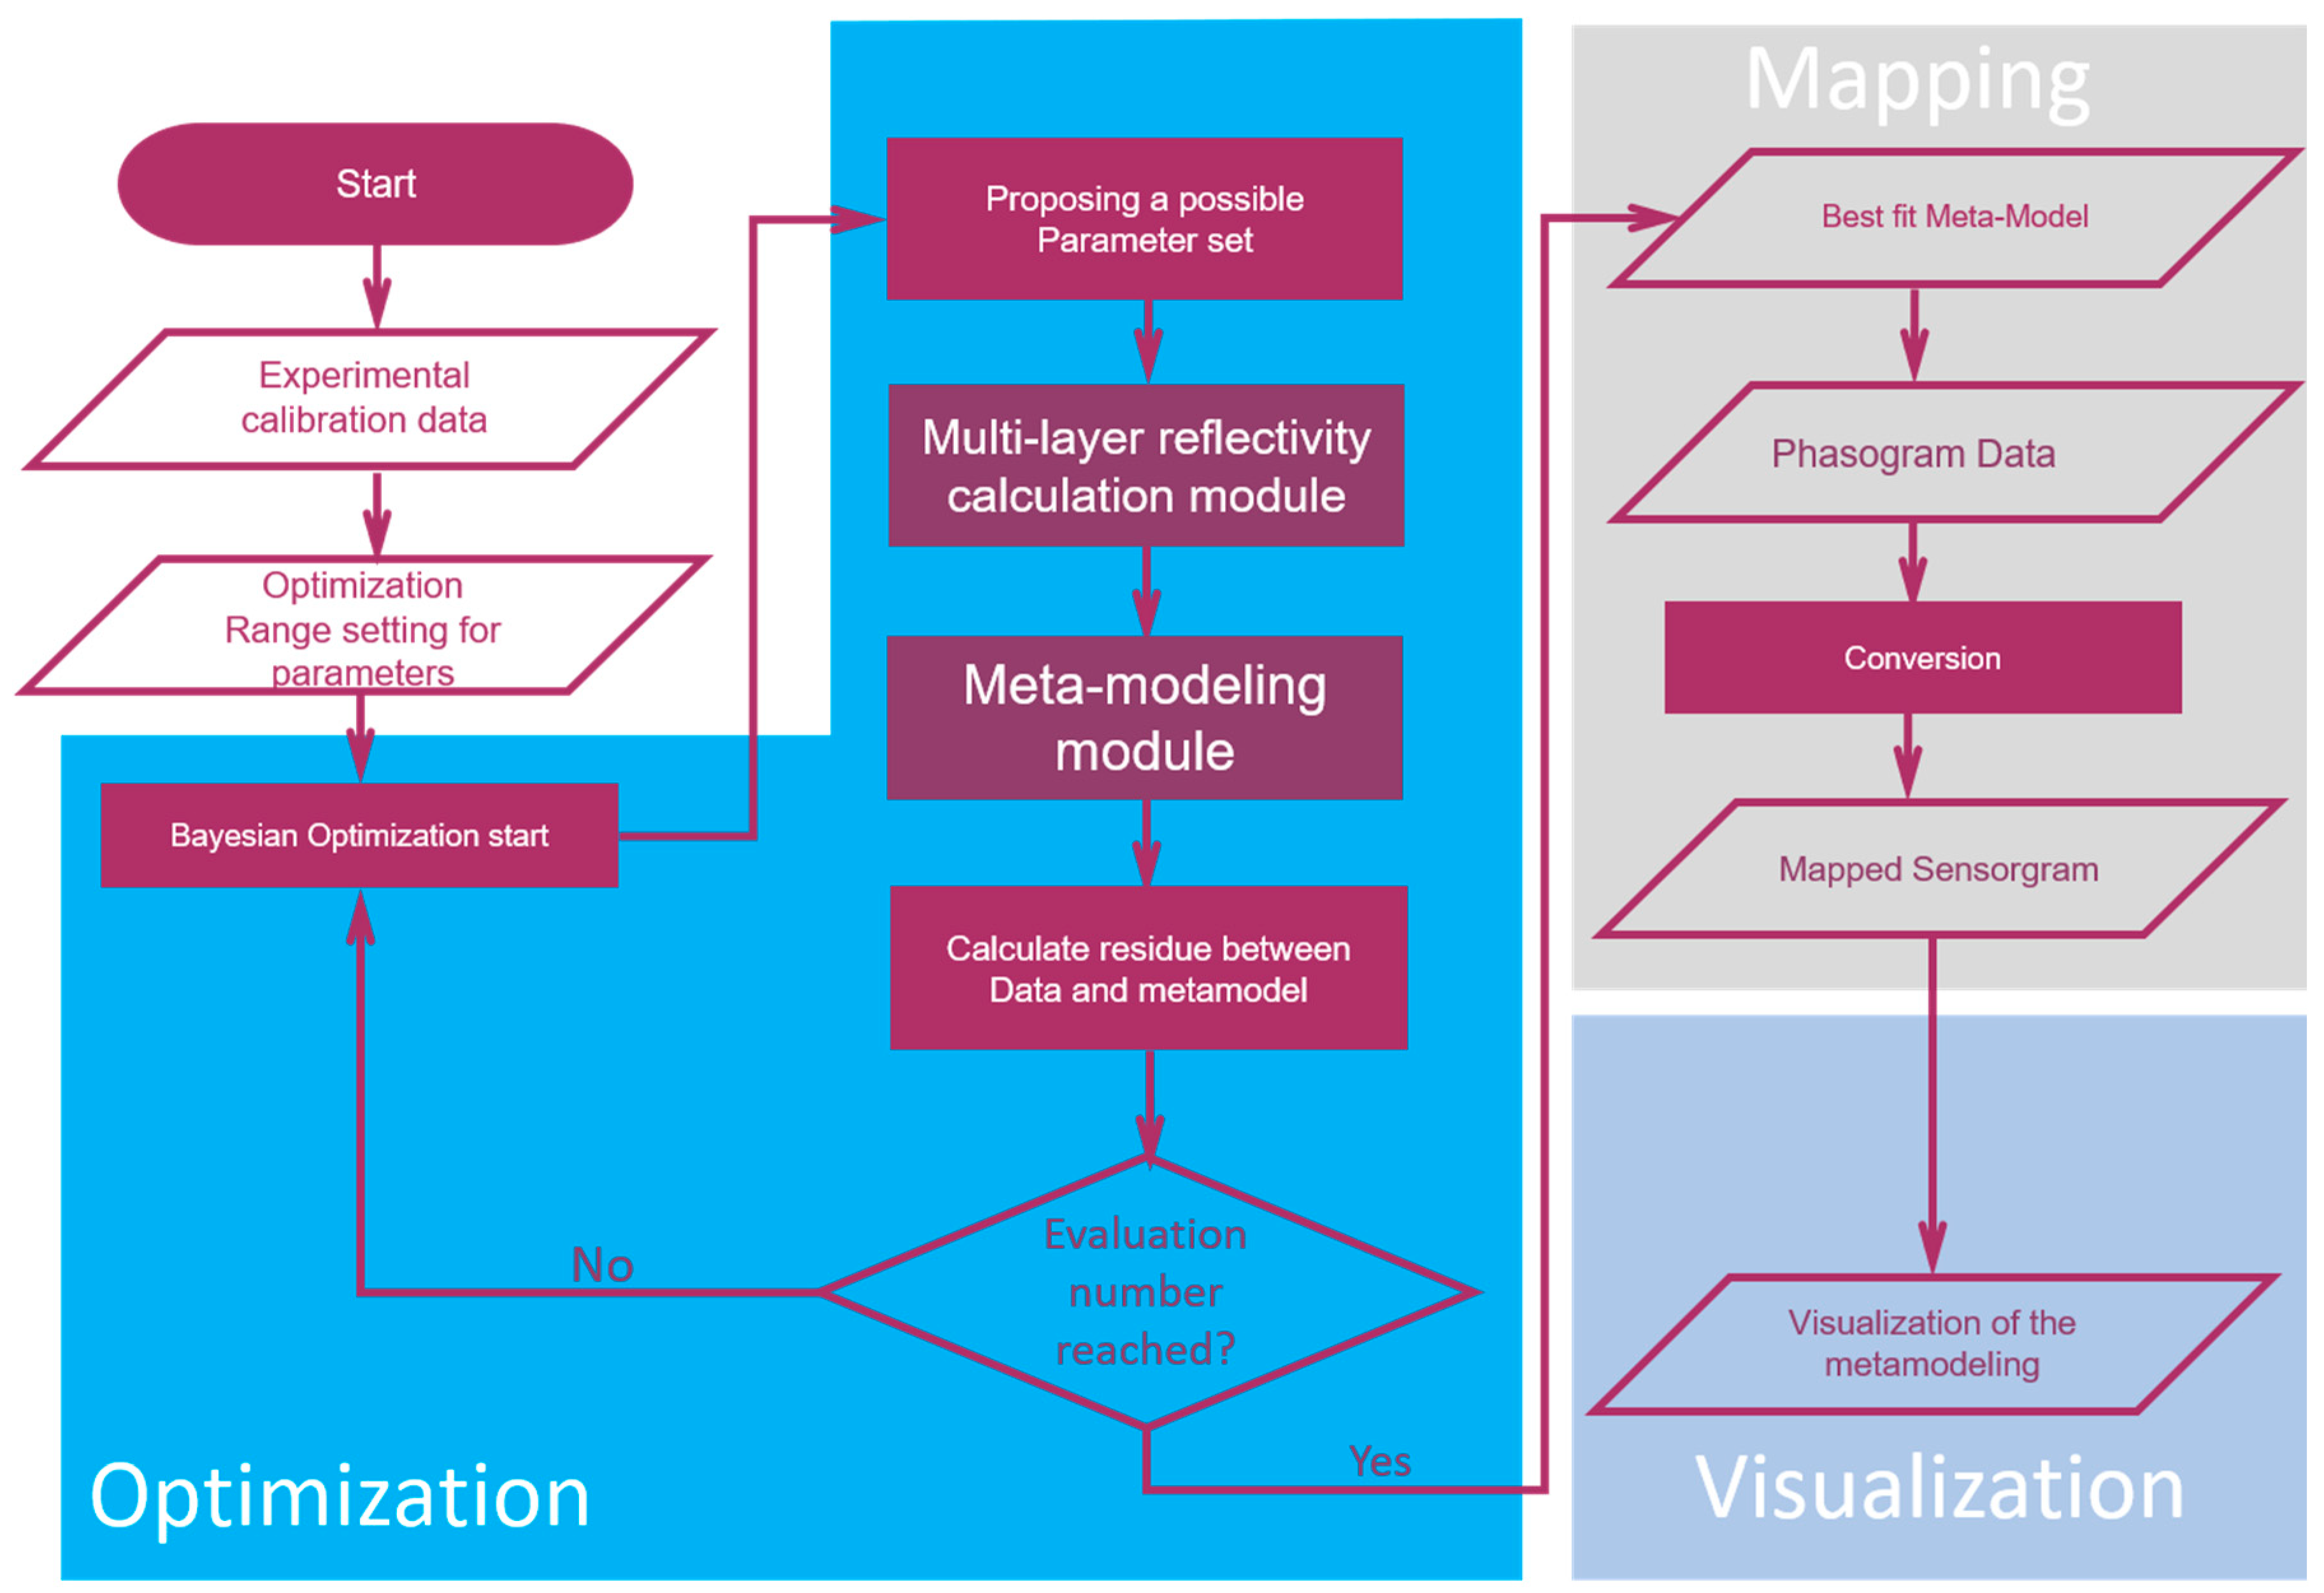
2.2. Algorithm
2.3. Preparation of Exosome Sample
2.4. Sensor Surface Modification and Biosensing Protocol
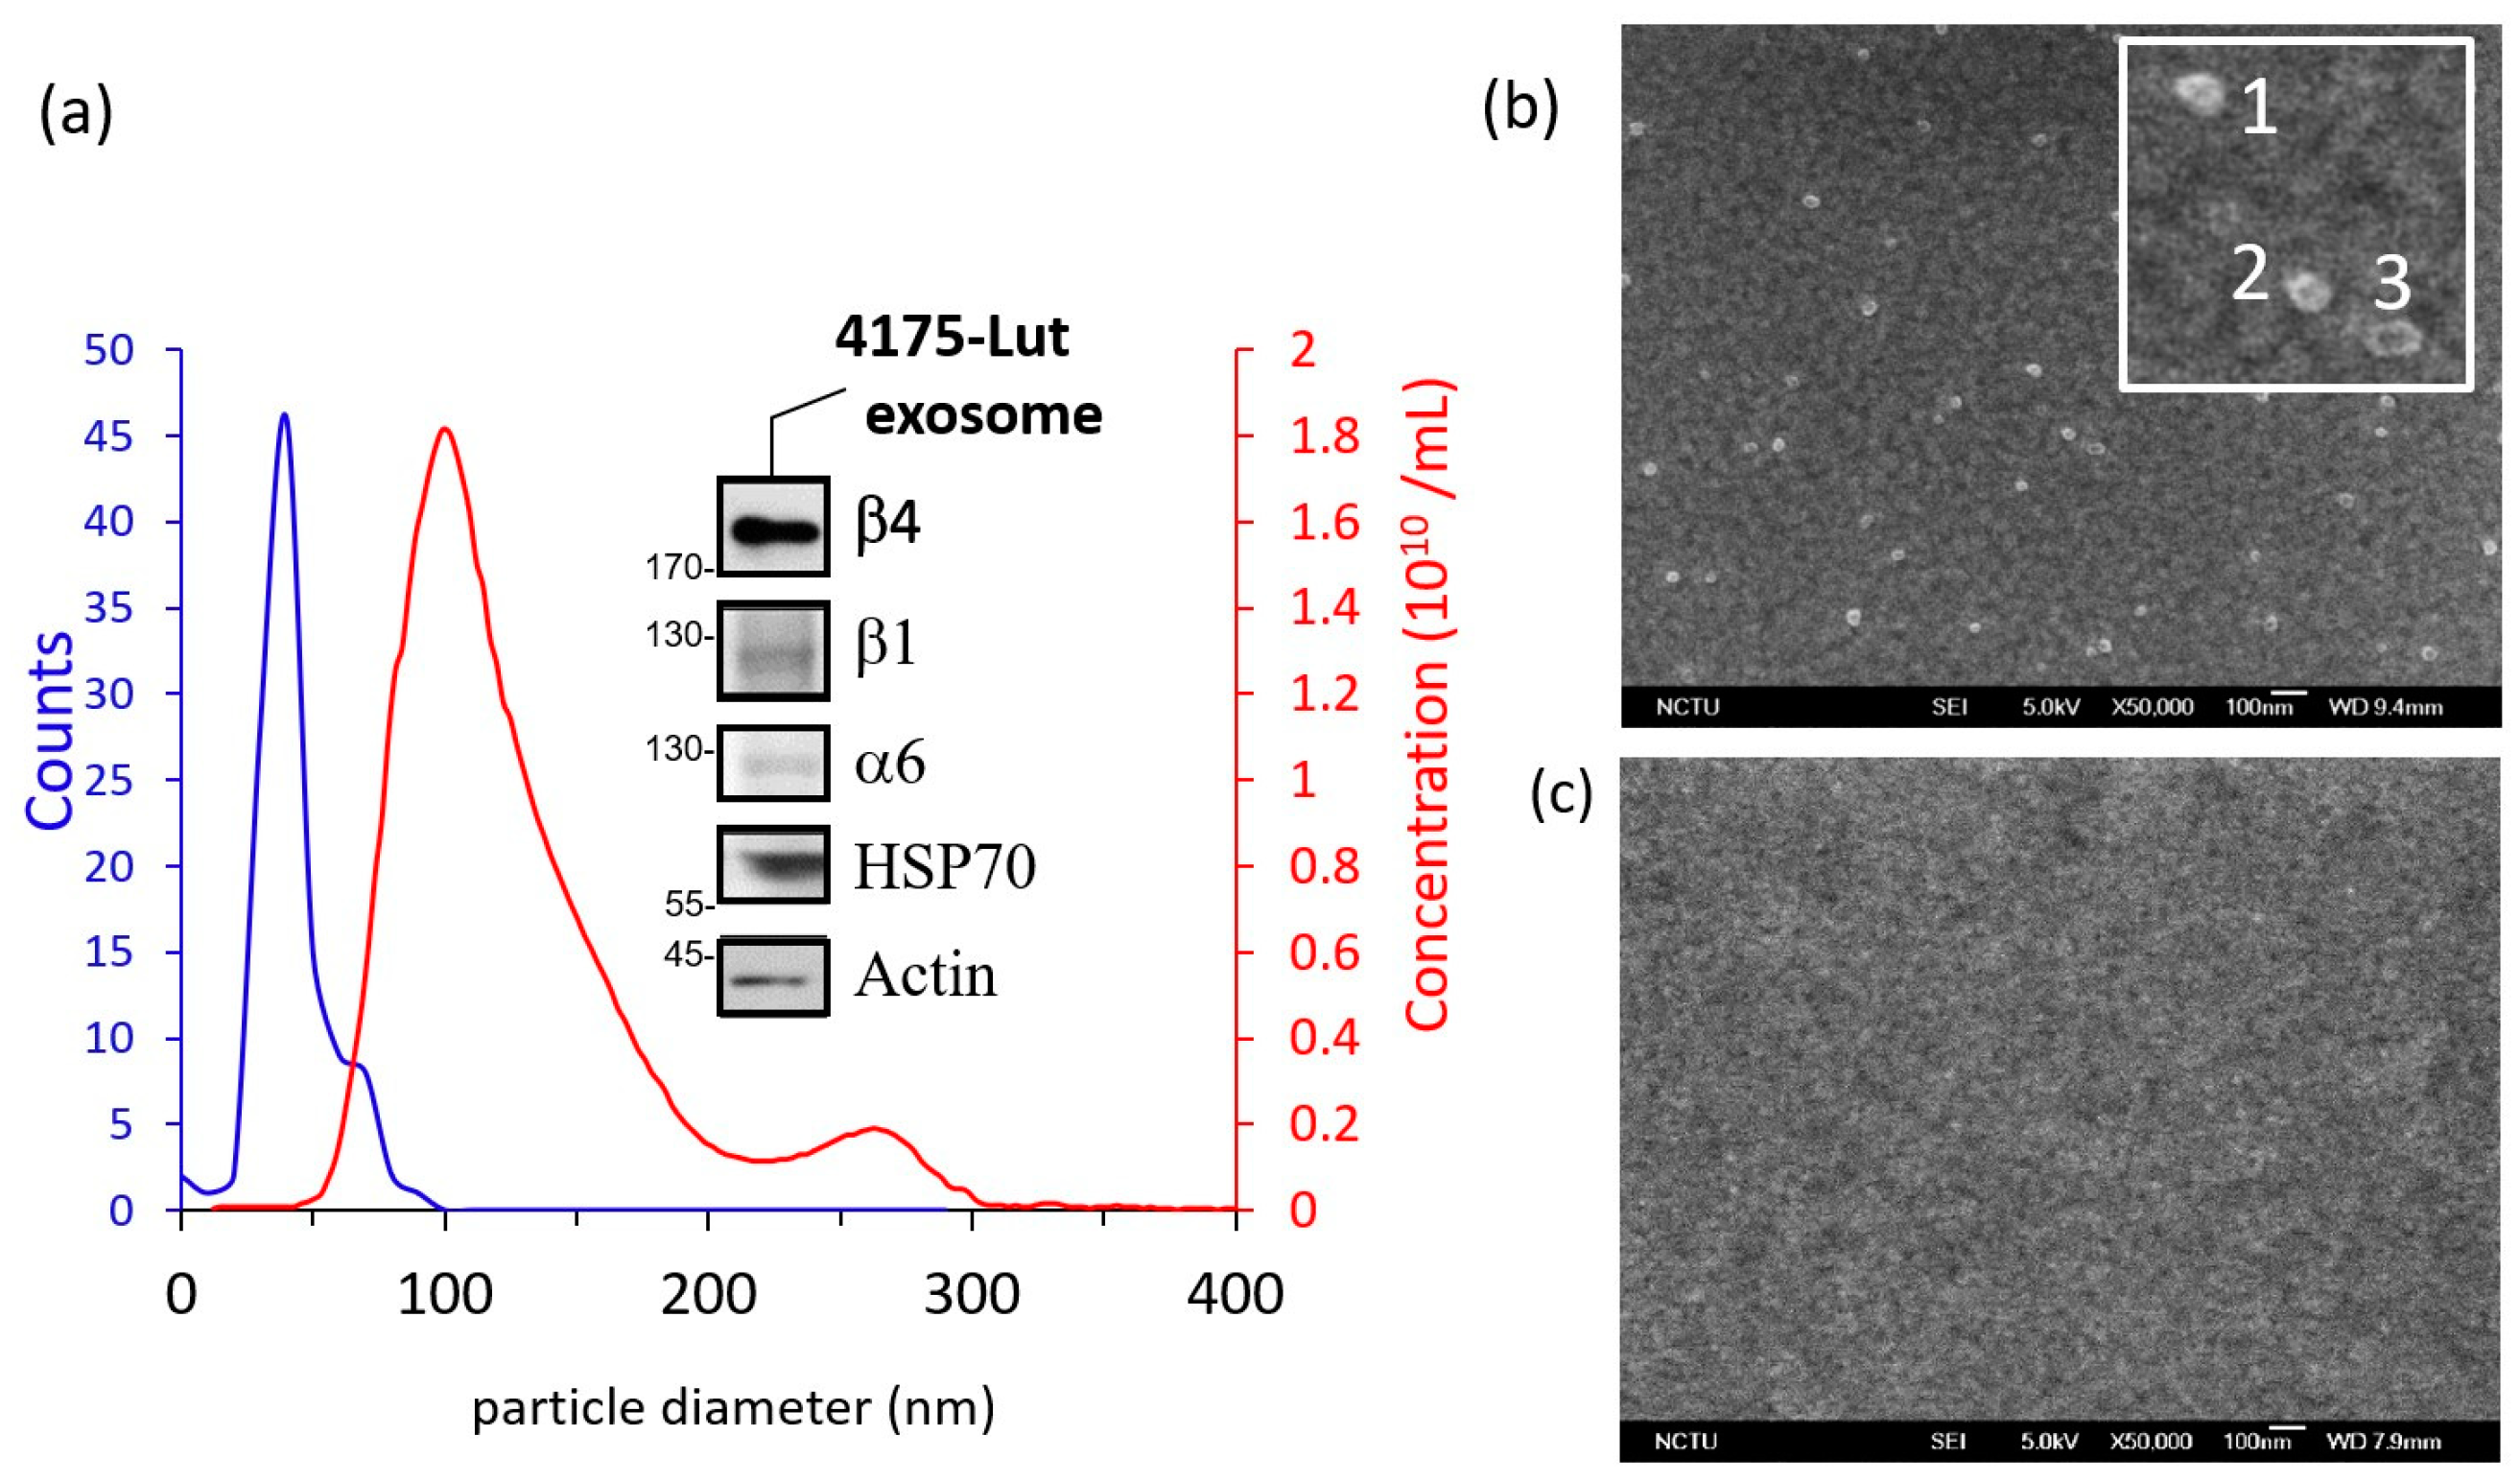
2.5. Characterization of Exosome and the Aptamer Probe
3. Results
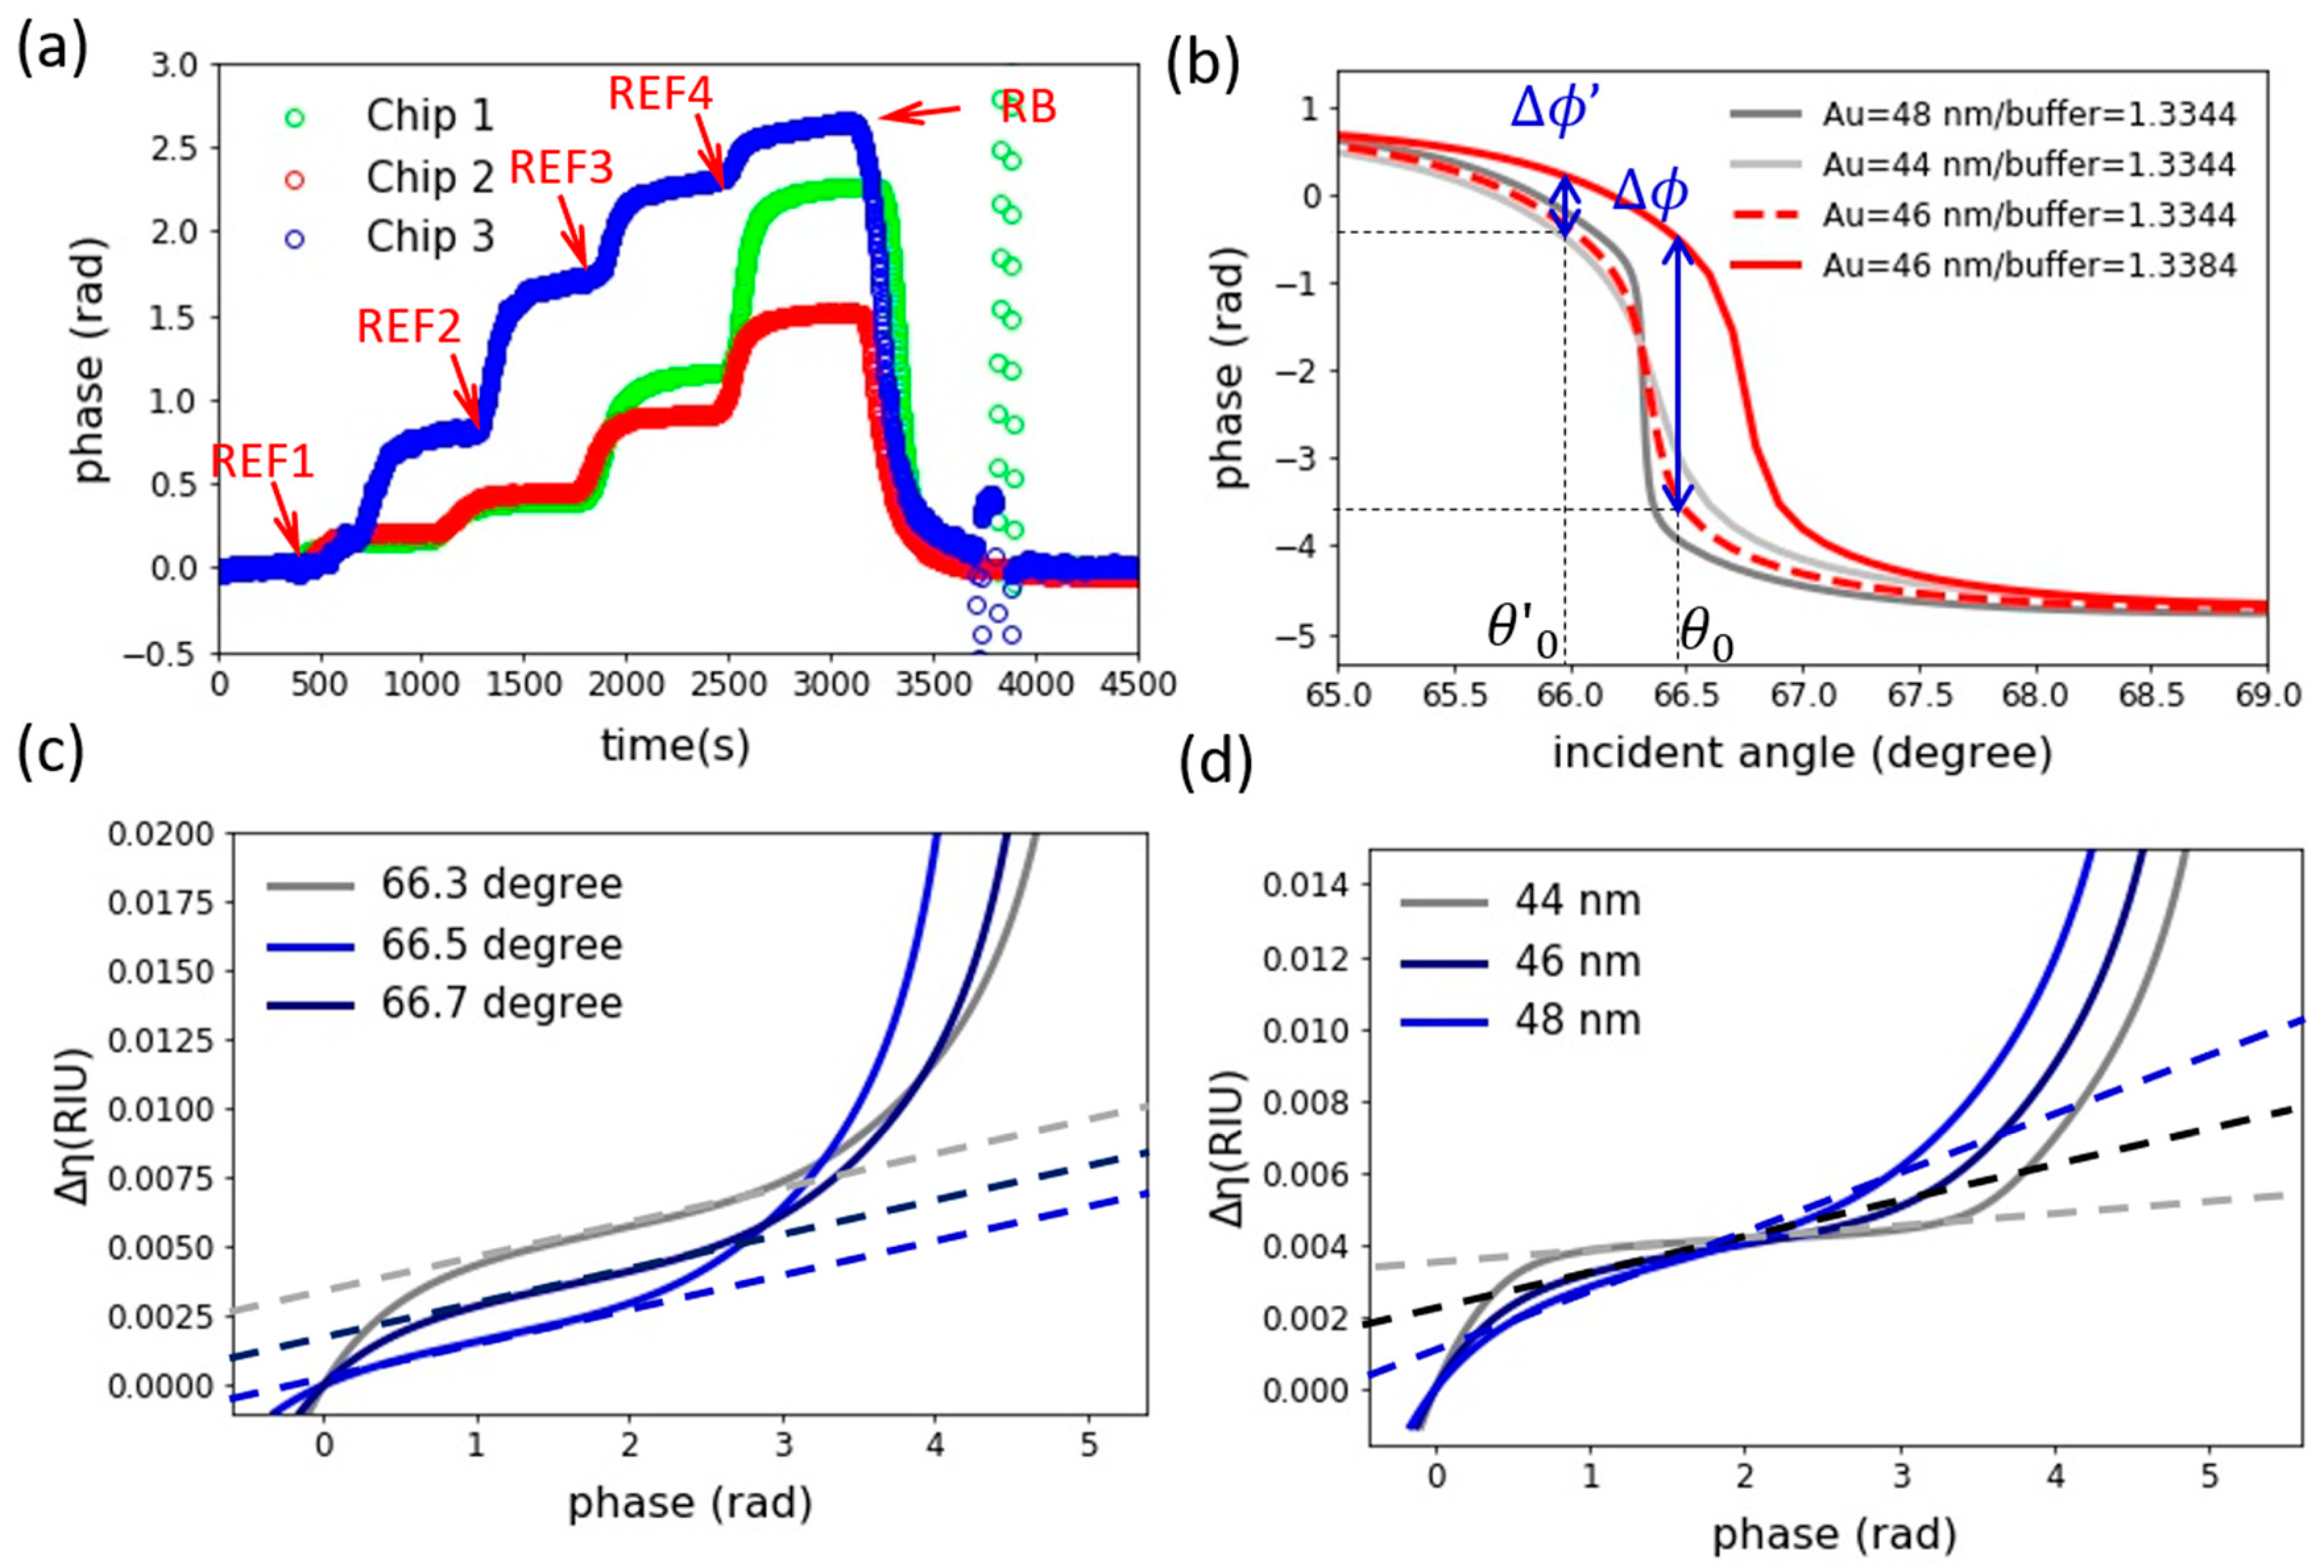
3.1. Revisit pSPR Sensing Phasogram
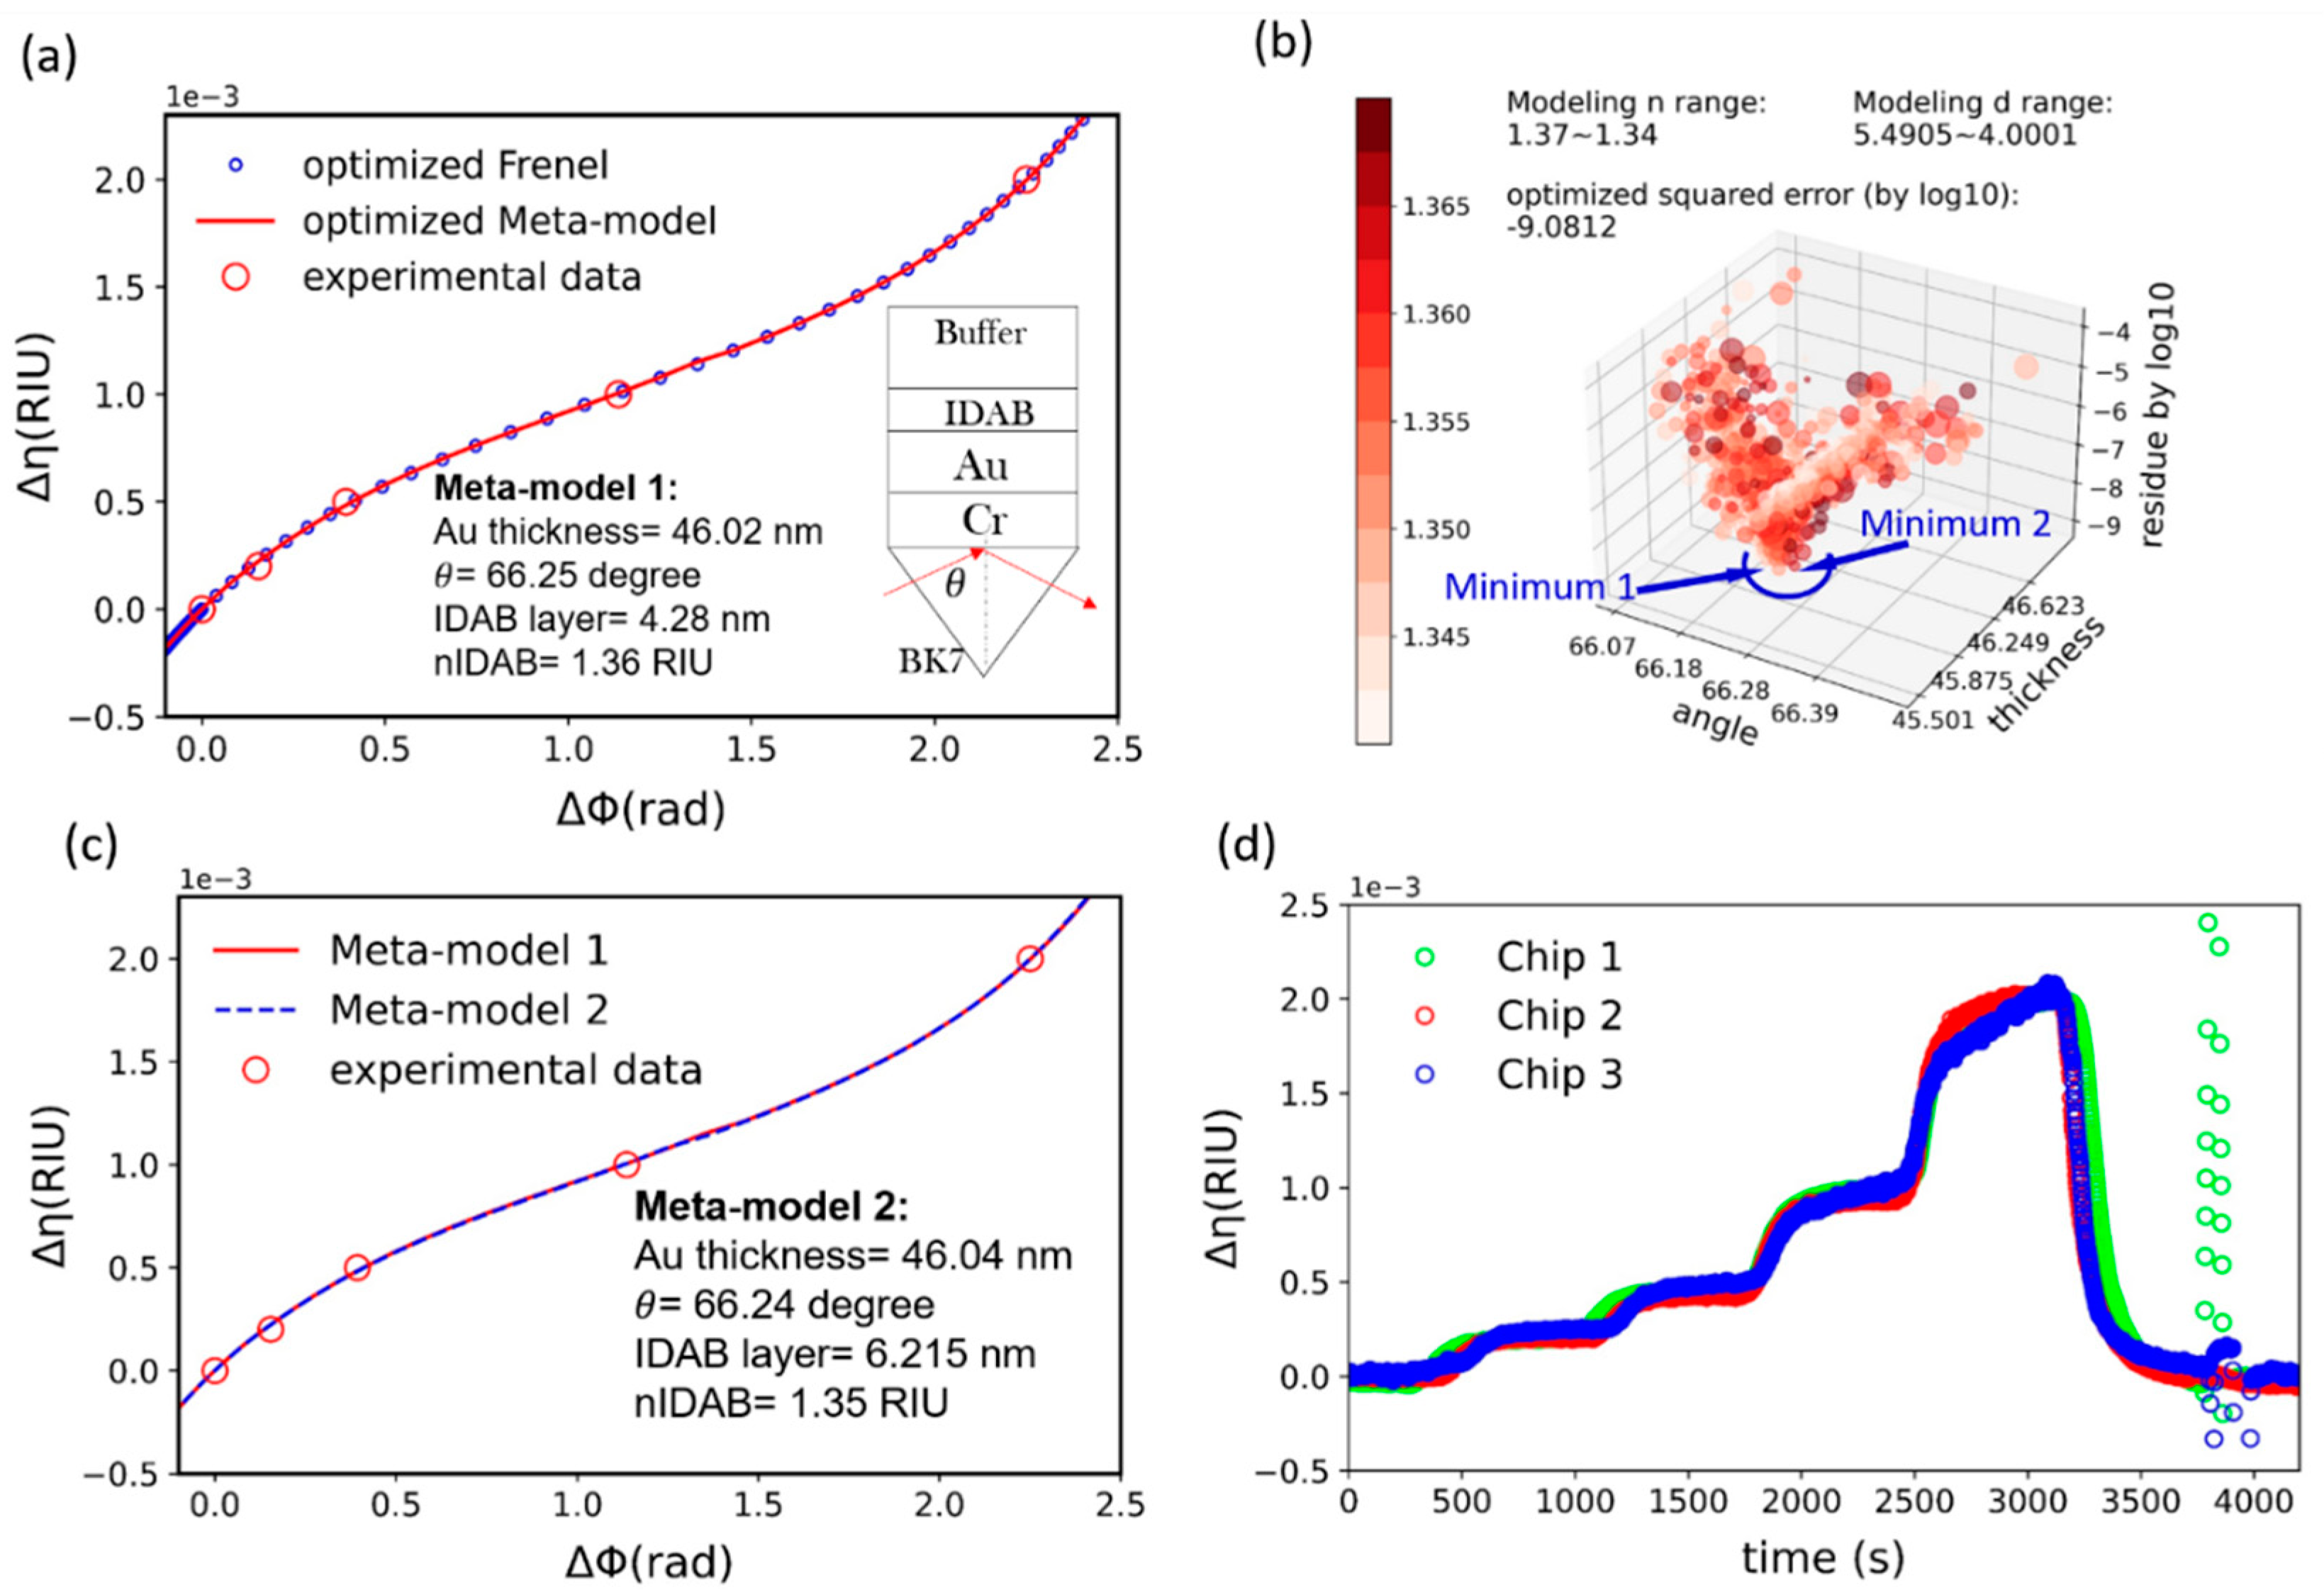
3.2. Meta-Model and Mapping Results
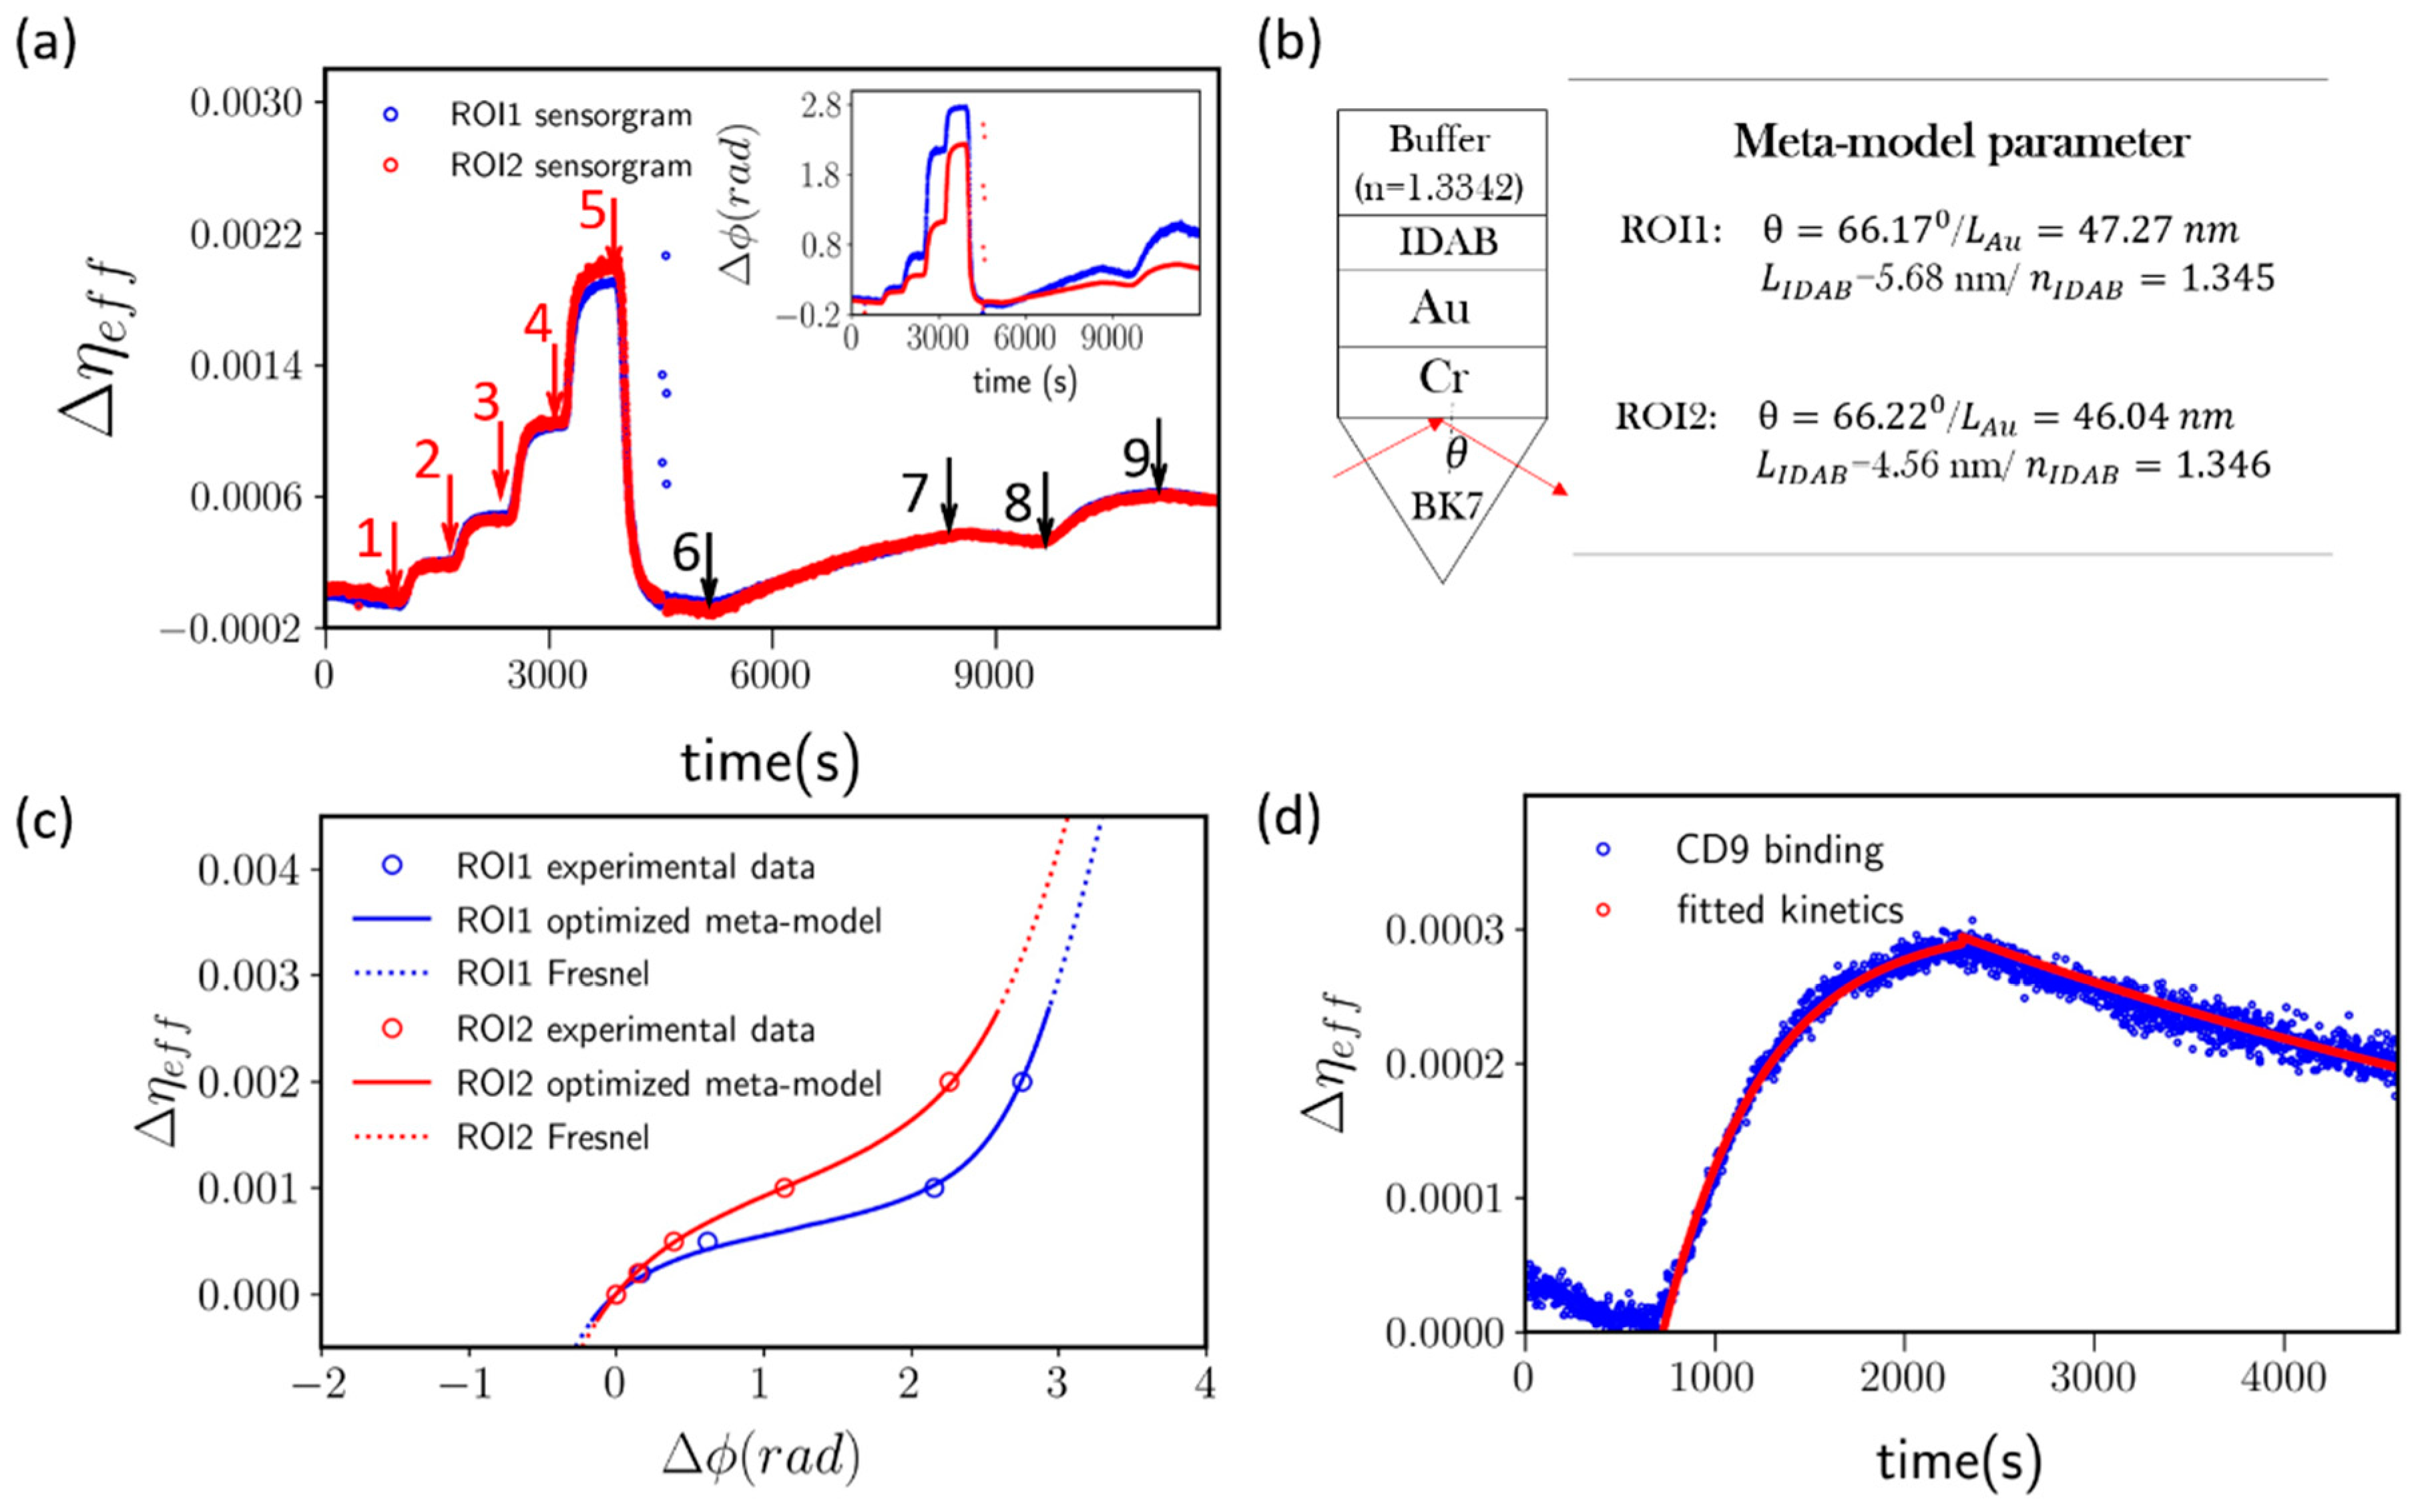
3.3. Application to Lung-Tropic Metastatic Exosome Detection
4. Conclusions
Supplementary Materials
Author Contributions
Funding
Acknowledgments
Conflicts of Interest
References
- Chang, C.-C.; Chiu, N.-F.; Lin, D.-S.; Chu-Su, Y.; Liang, Y.-H.; Lin, C.-W. High-sensitivity detection of carbohydrate antigen 15-3 using a gold/zinc oxide thin film surface plasmon resonance-based biosensor. Anal. Chem. 2010, 82, 1207–1212. [Google Scholar] [CrossRef]
- Hsieh, S.-C.; Chang, C.-C.; Lu, C.-C.; Wei, C.-F.; Lin, C.-S.; Lai, H.-C.; Lin, C.-W. Rapid identification of Mycobacterium tuberculosis infection by a new array format-based surface plasmon resonance method. Nanoscale Res. Lett. 2012, 7, 1–6. [Google Scholar] [CrossRef] [Green Version]
- Vogel, A.; Kanevsky, I.; Che, Y.; Swanson, K.; Muik, A.; Vormehr, M.; Kranz, L.; Walzer, K.; Hein, S.; Güler, A.; et al. A prefusion SARS-CoV-2 spike RNA vaccine is highly immunogenic and prevents lung infection in non-human primates. BioRxiv 2020. [Google Scholar] [CrossRef]
- Kim, S.-Y.; Jin, W.-H.; Sood, A.; Montgomery, D.W.; Grant, O.C.; Fuster, M.M.; Fu, L.; Dordick, J.S.; Woods, R.J.; Zhang, F.-M.; et al. Characterization of heparin and severe acute respiratory syndrome-related coronavirus 2 (SARS-CoV-2) spike glycoprotein binding interactions. Antivir. Res. 2020, 181, 104873. [Google Scholar] [CrossRef] [PubMed]
- Schasfoort, R.B. (Ed.) Handbook of Surface Plasmon Resonance; Royal Society of Chemistry: London, UK, 2017. [Google Scholar]
- Orfandis, S.J. Electromagnetic Waves and Antennas; Rutger University: Piscataway, NJ, USA, 2002; Chapters 4 and 5; Available online: https://www.ece.rutgers.edu/~orfanidi/ewa/ (accessed on 25 February 2021).
- Deng, S.; Wang, P.; Yu, X. Phase-Sensitive Surface Plasmon Resonance Sensors: Recent Progress and Future Prospects. Sensors 2017, 17, 2819. [Google Scholar] [CrossRef] [PubMed] [Green Version]
- Nelson, S.G.; Johnston, K.S.; Yee, S.-S. High sensitivity surface plasmon resonance sensor based on phase detection. Sens. Actuators B Chem. 1996, 35, 187–191. [Google Scholar] [CrossRef]
- Kabashin, A.V.; Patskovsky, S.; Grigorenko, A.N. Phase and amplitude sensitivities in surface plasmon resonance bio and chemical sensing. Opt. Express 2009, 17, 21191–21204. [Google Scholar] [CrossRef]
- Nikitin, P.; Beloglazov, A.; Kochergin, V.; Valeiko, M.; Ksenevich, T. Surface plasmon resonance interferometry for biological and chemical sensing. Sens. Actuators B Chem. 1999, 54, 43–50. [Google Scholar] [CrossRef]
- Zeng, Y.; Shu-Yuen, W.; Wang, L.; Gu, D.; He, J.; Wu, S.-Y.; Yonghong, S.; Li, X.; Qu, J.; Gao, B.Z.; et al. Recent advances in surface plasmon resonance imaging: Detection speed, sensitivity, and portability. Nanophotonics 2017, 6, 1017–1030. [Google Scholar] [CrossRef]
- VanWiggeren, G.D.; Bynum, M.A.; Ertel, J.P.; Jefferson, S.; Robotti, K.M.; Thrush, E.P.; Baney, D.M.; Killeen, K.P. A novel optical method providing for high-sensitivity and high-throughput biomolecular interaction analysis. Sens. Actuators B Chem. 2007, 127, 341–349. [Google Scholar] [CrossRef]
- Li, Y.-C.; Chang, Y.-F.; Su, L.-C.; Chou, C. Differential-Phase Surface Plasmon Resonance Biosensor. Anal. Chem. 2008, 80, 5590–5595. [Google Scholar] [CrossRef] [PubMed]
- Wang, J.; Smith, R.J.; Light, R.A.; Richens, J.L.; Zhang, J.; O’Shea, P.; See, C.; Somekh, M.G. Highly sensitive multipoint real-time kinetic detection of Surface Plasmon bioanalytes with custom CMOS cameras. Biosens. Bioelectron. 2014, 58, 157–164. [Google Scholar] [CrossRef] [PubMed] [Green Version]
- Yuan, W.; Ho, H.P.; Wong, C.L.; Kong, S.K.; Lin, C. Surface Plasmon Resonance Biosensor Incorporated in a Michelson Interferometer with Enhanced Sensitivity. IEEE Sens. J. 2006, 7, 70–73. [Google Scholar] [CrossRef]
- Yu, X.-L.; Zhao, L.-Q.; Hong, J.; Wang, H.-J.; Yin, C.-Y.; Zhu, S.-G. Immunosensor based on optical heterodyne phase detection. Sens. Actuators B Chem. 2001, 76, 199–202. [Google Scholar]
- Jung, L.S.; Campbell, C.T.; Chinowsky, T.M.; Mar, M.N.; Yee, S.S. Quantitative Interpretation of the Response of Surface Plasmon Resonance Sensors to Adsorbed Films. Langmuir 1998, 14, 5636–5648. [Google Scholar] [CrossRef]
- Hoshino, A.; Costa-Silva, B.; Shen, T.L.; Rodrigues, G.; Hashimoto, A.; Mark, M.T.; Molina, H.; Kohsaka, S.; Di Giannatale, A.; Ceder, S.; et al. Tumor exosome integrins determine organotropic metastasis. Nature 2015, 527, 329–335. [Google Scholar] [CrossRef] [Green Version]
- Hon, K.W.; Abu, N.; Ab Mutalib, N.-S.; Jamal, R. Exosomes as Potential Biomarkers and Targeted Therapy in Colorectal Cancer: A Mini-Review. Front. Pharmacol. 2017, 8, 583. [Google Scholar] [CrossRef] [Green Version]
- Chakraborty, A.L.; Ruxton, K.; Johnstone, W.; Lengden, M.; Duffin, K. Elimination of residual amplitude modulation in tunable diode laser wavelength modulation spectroscopy using an optical fiber delay line. Opt. Express 2009, 17, 9602–9607. [Google Scholar] [CrossRef]
- Mohtar, A.; Vaillant, J.; Sedaghat, Z.; Kazan, M.; Joly, L.; Stoeffler, C.; Cousin, J.; Khoury, A.; Bruyant, A. Generalized lock-in detection for interferometry: Application to phase sensitive spectroscopy and near-field nanoscopy. Opt. Express 2014, 22, 22232–22245. [Google Scholar] [CrossRef]
- Bruyant, A.; Vaillant, J.; Wu, T.-H.; Zhu, Y.; Huang, Y.; Mohtar, A. Interferometry Using Generalized Lock-in Amplifier (G-LIA): A Versatile Approach for Phase-Sensitive Sensing and Imaging. In Optical Interferomtry; Intech Open: Rijeka, Croatia, 2017; Chapter 10; pp. 211–231. [Google Scholar] [CrossRef] [Green Version]
- Vaillant, J.; Bruyant, A. An unbalanced interferometer insensitive to wavelength drift. Sens. Actuators A Phys. 2017, 268, 188–192. [Google Scholar] [CrossRef]
- Costa-Silva, B.; Aiello, N.M.; Ocean, A.J.; Singh, S.; Zhang, H.; Thakur, B.K.; Becker, A.; Hoshino, A.; Mark, M.T.; Molina, H.; et al. Pancreatic cancer exosomes initiate pre-metastatic niche formation in the liver. Nat. Cell Biol. 2015, 17, 816–826. [Google Scholar] [CrossRef] [PubMed]
- Berg, K.; Lange, T.; Mittelberger, F.; Schumacher, U.; Hahn, U. Selection and Characterization of an α6β4 Integrin blocking DNA Aptamer. Mol. Ther. Nucleic Acids 2016, 5, e294. [Google Scholar] [CrossRef]
- Peterson, A.W.; Heaton, R.J.; Georgiadis, R.M. The effect of surface probe density on DNA hybridization. Nucleic Acids Res. 2001, 29, 5163–5168. [Google Scholar] [CrossRef] [PubMed] [Green Version]
- Brogan, K.L.; Shin, J.H.; Schoenfisch, M.H. Influence of Surfactants and Antibody Immobilization Strategy on Reducing Nonspecific Protein Interactions for Molecular Recognition Force Microscopy. Langmuir 2004, 20, 9729–9735. [Google Scholar] [CrossRef] [PubMed]
- Willms, E.; Cabañas, C.; Mäger, I.; Wood, M.J.A.; Vader, P. Extracellular Vesicle Heterogeneity: Subpopulations, Isolation Techniques, and Diverse Functions in Cancer Progression. Front. Immunol. 2018, 9, 738. [Google Scholar] [CrossRef] [PubMed] [Green Version]
- Sauter, E.R. Exosomes in blood and cancer. Transl. Cancer. Res. 2017, 6, S1316–S1320. [Google Scholar] [CrossRef]
- Wu, Y.; Deng, W.; Klinke, D.J., II. Exosomes: Improved methods to characterize their morphology, RNA content, and surface protein biomarkers. Analyst 2015, 140, 6631–6642. [Google Scholar] [CrossRef] [Green Version]
- Peterlinz, K.A.; Georgiadis, R. In Situ Kinetics of Self-Assembly by Surface Plasmon Resonance Spectroscopy. Langmuir 1996, 12, 4731–4740. [Google Scholar] [CrossRef]


Publisher’s Note: MDPI stays neutral with regard to jurisdictional claims in published maps and institutional affiliations. |
© 2021 by the authors. Licensee MDPI, Basel, Switzerland. This article is an open access article distributed under the terms and conditions of the Creative Commons Attribution (CC BY) license (http://creativecommons.org/licenses/by/4.0/).
Share and Cite
Wu, T.-H.; Yang, C.-H.; Chang, C.-C.; Liu, H.-W.; Yang, C.-Y.; Shen, T.-L.; Lin, C.-W.; Bruyant, A. Multi-Layer Reflectivity Calculation Based Meta-Modeling of the Phase Mapping Function for Highly Reproducible Surface Plasmon Resonance Biosensing. Biosensors 2021, 11, 95. https://doi.org/10.3390/bios11030095
Wu T-H, Yang C-H, Chang C-C, Liu H-W, Yang C-Y, Shen T-L, Lin C-W, Bruyant A. Multi-Layer Reflectivity Calculation Based Meta-Modeling of the Phase Mapping Function for Highly Reproducible Surface Plasmon Resonance Biosensing. Biosensors. 2021; 11(3):95. https://doi.org/10.3390/bios11030095
Chicago/Turabian StyleWu, Tzu-Heng, Ching-Hsu Yang, Chia-Chen Chang, Hui-Wen Liu, Chia-Yu Yang, Tang-Long Shen, Chii-Wann Lin, and Aurélien Bruyant. 2021. "Multi-Layer Reflectivity Calculation Based Meta-Modeling of the Phase Mapping Function for Highly Reproducible Surface Plasmon Resonance Biosensing" Biosensors 11, no. 3: 95. https://doi.org/10.3390/bios11030095