Plasmonic Biosensors for Single-Molecule Biomedical Analysis


Abstract
:1. Introduction
2. Plasmonic Nanoapertures for Single-Molecule Analysis
2.1. Single-Nucleic Acid Nanopore Detection
2.2. Single-Protein Nanopore Detection
2.3. Single-Molecule Detection of Pathogenic Agents
3. Single-Molecule Biosensing Strategies Based on Nanohole Arrays
4. Single-Molecule Biosensing Strategies Based on Plasmonic Nanoparticles
4.1. Single-Nucleic Acid Detection
4.2. Single-Protein Interaction Detection
4.3. Single-Cell Detection
5. Conclusions and Future Outlook
Author Contributions
Funding
Conflicts of Interest
References
- Akkilic, N.; Geschwindner, S.; Höök, F. Single-Molecule Biosensors: Recent Advances and Applications. Biosens. Bioelectron. 2020, 151, 111944. [Google Scholar] [CrossRef] [PubMed]
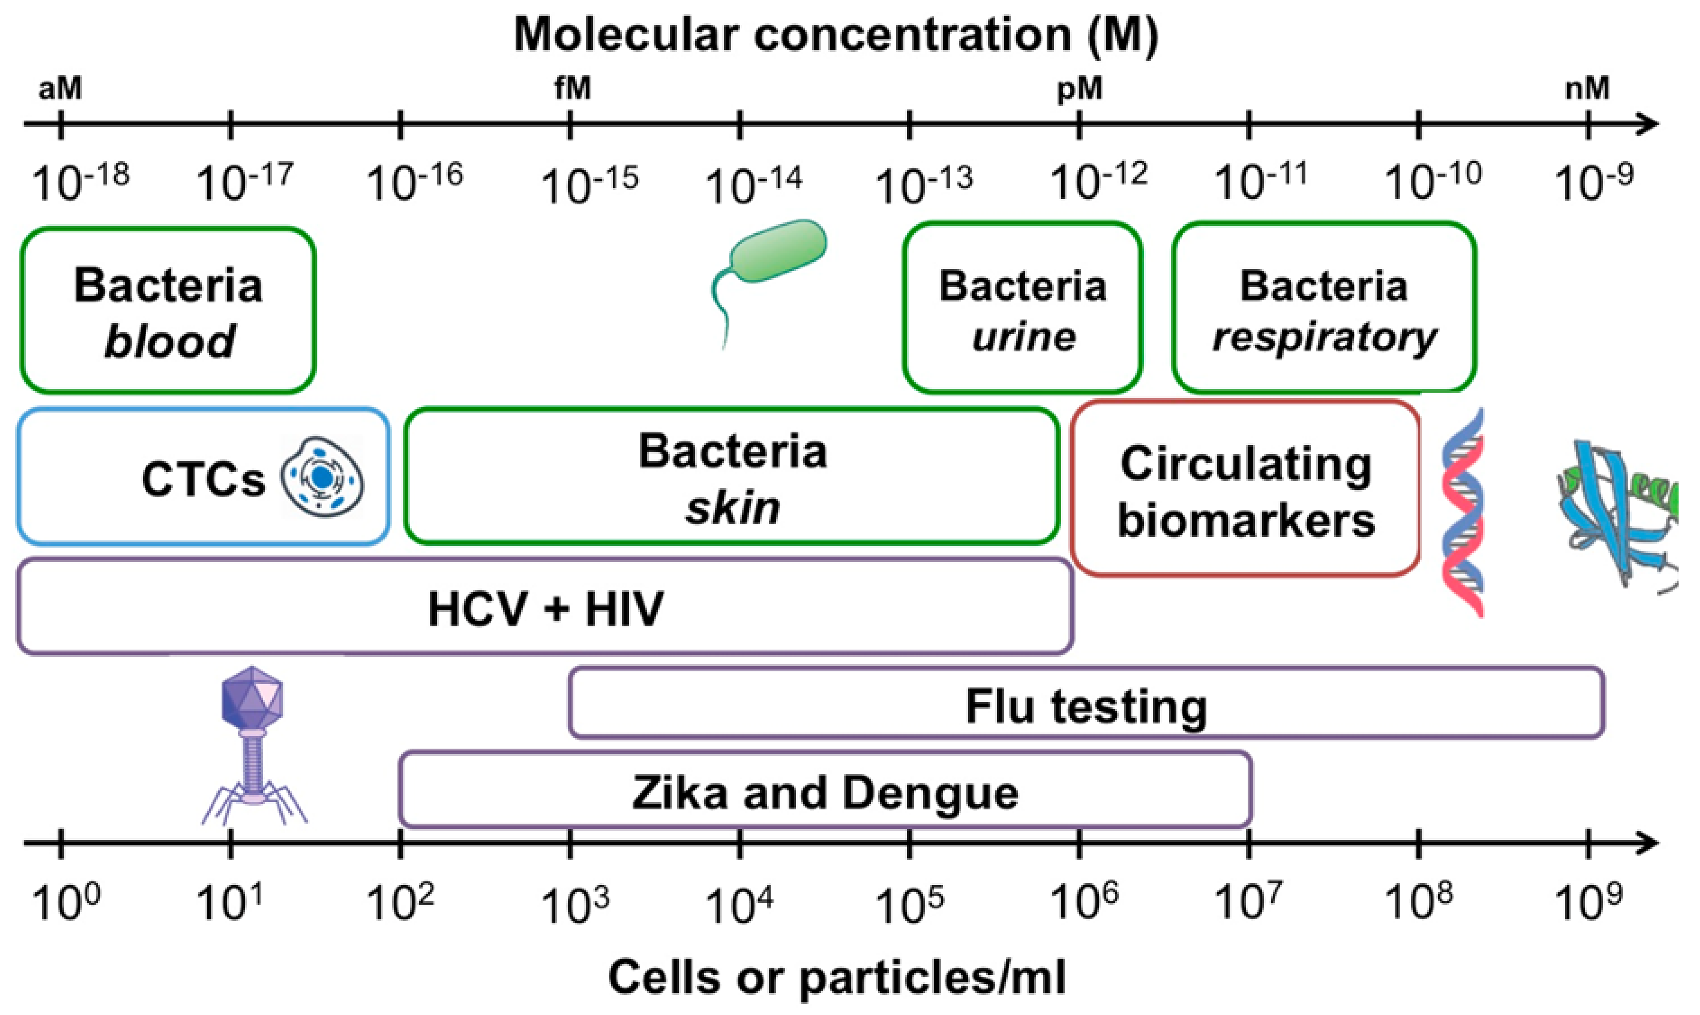
- Kelley, S.O. What Are Clinically Relevant Levels of Cellular and Biomolecular Analytes? ACS Sens. 2017, 2, 193–197. [Google Scholar] [CrossRef] [PubMed]
- Macchia, E.; Manoli, K.; Di Franco, C.; Scamarcio, G.; Torsi, L. New Trends in Single-Molecule Bioanalytical Detection. Anal. Bioanal. Chem. 2020, 412, 5005–5014. [Google Scholar] [CrossRef] [PubMed] [Green Version]
- Taylor, A.B.; Zijlstra, P. Single-Molecule Plasmon Sensing: Current Status and Future Prospects. ACS Sens. 2017, 2, 1103–1122. [Google Scholar] [CrossRef] [PubMed] [Green Version]
- Chen, H.; Liu, K.; Li, Z.; Wang, P. Point of Care Testing for Infectious Diseases. Clin. Chim. Acta 2019, 493, 138–147. [Google Scholar] [CrossRef] [PubMed]
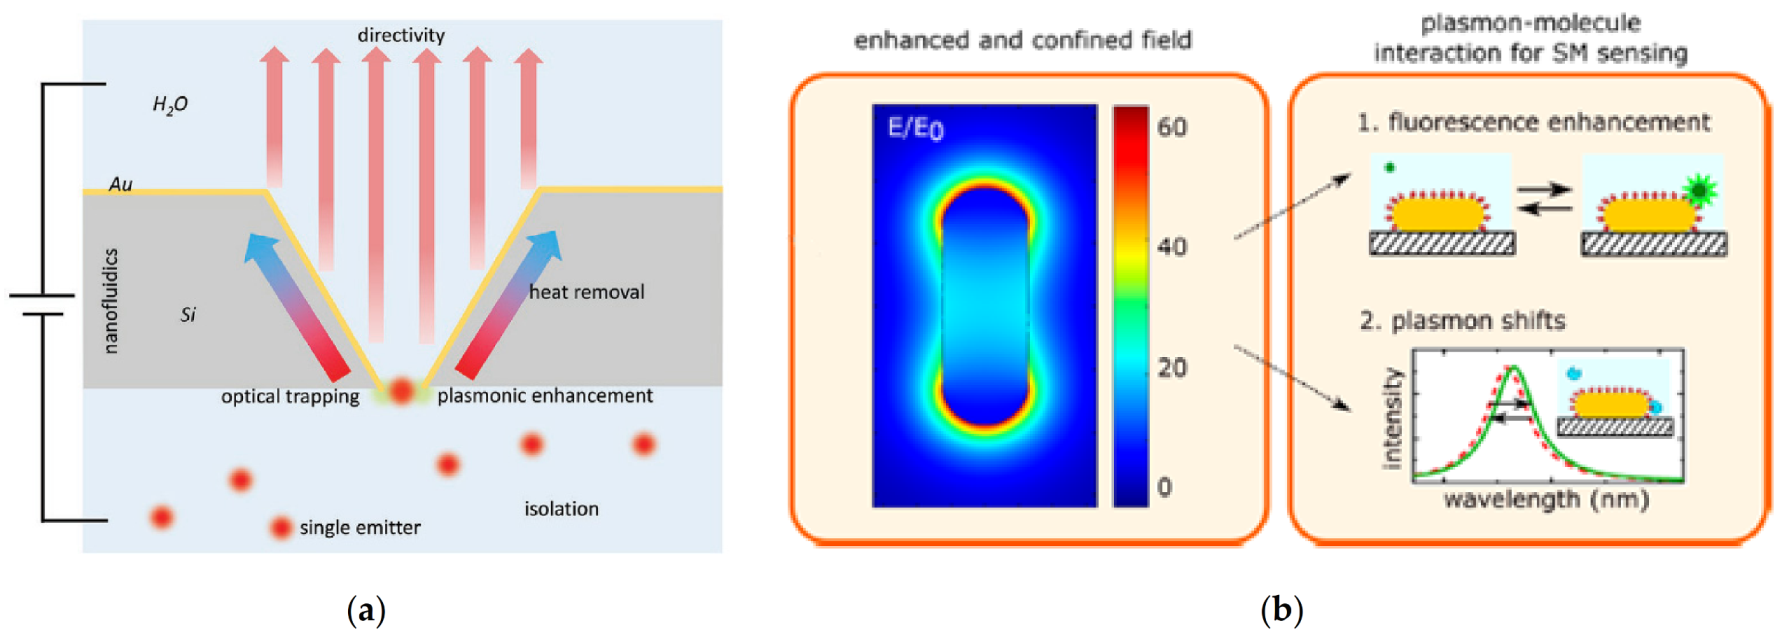
- Špačková, B.; Šípová-Jungová, H.; Käll, M.; Fritzsche, J.; Langhammer, C. Nanoplasmonic–Nanofluidic Single-Molecule Biosensors for Ultrasmall Sample Volumes. ACS Sens. 2021, 6, 73–82. [Google Scholar] [CrossRef]
- Fabrizio, E.D.; Schlücker, S.; Wenger, J.; Regmi, R.; Rigneault, H.; Calafiore, G.; West, M.; Cabrini, S.; Fleischer, M.; van Hulst, N.F.; et al. Roadmap on Biosensing and Photonics with Advanced Nano-Optical Methods. J. Opt. 2016, 18, 063003. [Google Scholar] [CrossRef] [Green Version]
- Ma, X.; Sim, S.J. Single Plasmonic Nanostructures for Biomedical Diagnosis. J. Mater. Chem. B 2020, 8, 6197–6216. [Google Scholar] [CrossRef]
- Lee, S.; Sun, Y.; Cao, Y.; Kang, S.H. Plasmonic Nanostructure-Based Bioimaging and Detection Techniques at the Single-Cell Level. TrAC Trends Anal. Chem. 2019, 117, 58–68. [Google Scholar] [CrossRef]
- Xiao, L.; Qiao, Y.; He, Y.; Yeung, E.S. Three Dimensional Orientational Imaging of Nanoparticles with Darkfield Microscopy. Anal. Chem. 2010, 82, 5268–5274. [Google Scholar] [CrossRef]
- Armstrong, R.E.; Horáček, M.; Zijlstra, P. Plasmonic Assemblies for Real-Time Single-Molecule Biosensing. Small 2020, 16, 2003934. [Google Scholar] [CrossRef]
- Halas, N.J.; Lal, S.; Chang, W.-S.; Link, S.; Nordlander, P. Plasmons in Strongly Coupled Metallic Nanostructures. Chem. Rev. 2011, 111, 3913–3961. [Google Scholar] [CrossRef]
- Homola, J. Surface Plasmon Resonance Sensors for Detection of Chemical and Biological Species. Chem. Rev. 2008, 108, 462–493. [Google Scholar] [CrossRef]
- Strobbia, P.; Languirand, E.; Cullum, B.M. Recent Advances in Plasmonic Nanostructures for Sensing: A Review. Opt. Eng. 2015, 54, 100902. [Google Scholar] [CrossRef] [Green Version]
- Masson, J.-F. Surface Plasmon Resonance Clinical Biosensors for Medical Diagnostics. ACS Sens. 2017, 2, 16–30. [Google Scholar] [CrossRef]
- Mestres, P.; Berthelot, J.; Aćimović, S.S.; Quidant, R. Unraveling the Optomechanical Nature of Plasmonic Trapping. Light Sci Appl. 2016, 5, e16092. [Google Scholar] [CrossRef] [Green Version]
- Kim, J.-D.; Lee, Y.-G. Trapping of a Single DNA Molecule Using Nanoplasmonic Structures for Biosensor Applications. Biomed. Opt. Express 2014, 5, 2471. [Google Scholar] [CrossRef] [Green Version]
- Koya, A.N.; Cunha, J.; Guo, T.; Toma, A.; Garoli, D.; Wang, T.; Juodkazis, S.; Cojoc, D.; Proietti Zaccaria, R. Novel Plasmonic Nanocavities for Optical Trapping-Assisted Biosensing Applications. Adv. Opt. Mater. 2020, 8, 1901481. [Google Scholar] [CrossRef]
- Gordon, R.; Sinton, D.; Kavanagh, K.L.; Brolo, A.G. A New Generation of Sensors Based on Extraordinary Optical Transmission. Acc. Chem. Res. 2008, 41, 1049–1057. [Google Scholar] [CrossRef]
- Dahlin, A.B. Sensing Applications Based on Plasmonic Nanopores: The Hole Story. Analyst 2015, 140, 4748–4759. [Google Scholar] [CrossRef]
- Khandelwal, G.; Umrao, S.; Nirala, N.R.; Sagar, S.S.; Kumar, V. Plasmonic Nanopores: A New Approach Toward Single Molecule Detection. In Nanomaterials: Biomedical, Environmental, and Engineering Applications; Kanchi, S., Ahmed, S., Sabela, M.I., Hussain, C.M., Eds.; John Wiley & Sons Inc.: Hoboken, NJ, USA, 2018; pp. 257–284. ISBN 978-1-119-37038-3. [Google Scholar]
- Spitzberg, J.D.; Zrehen, A.; van Kooten, X.F.; Meller, A. Plasmonic-Nanopore Biosensors for Superior Single-Molecule Detection. Adv. Mater. 2019, 31, 1900422. [Google Scholar] [CrossRef]
- Celiksoy, S.; Ye, W.; Wandner, K.; Kaefer, K.; Sönnichsen, C. Intensity-Based Single Particle Plasmon Sensing. Nano Lett. 2021. [Google Scholar] [CrossRef]
- Zhang, P.; Ma, G.; Dong, W.; Wan, Z.; Wang, S.; Tao, N. Plasmonic Scattering Imaging of Single Proteins and Binding Kinetics. Nat. Methods 2020, 17, 1010–1017. [Google Scholar] [CrossRef]
- Zhang, Q.; Wu, Y.; Xu, Q.; Ma, F.; Zhang, C. Recent Advances in Biosensors for in Vitro Detection and in Vivo Imaging of DNA Methylation. Biosens. Bioelectron. 2021, 171, 112712. [Google Scholar] [CrossRef]
- Gilboa, T.; Garden, P.M.; Cohen, L. Single-Molecule Analysis of Nucleic Acid Biomarkers–A Review. Anal. Chim. Acta 2020, 1115, 61–85. [Google Scholar] [CrossRef]
- Gordon, R. Metal Nanoapertures and Single Emitters. Adv. Opt. Mater. 2020, 8, 2001110. [Google Scholar] [CrossRef]
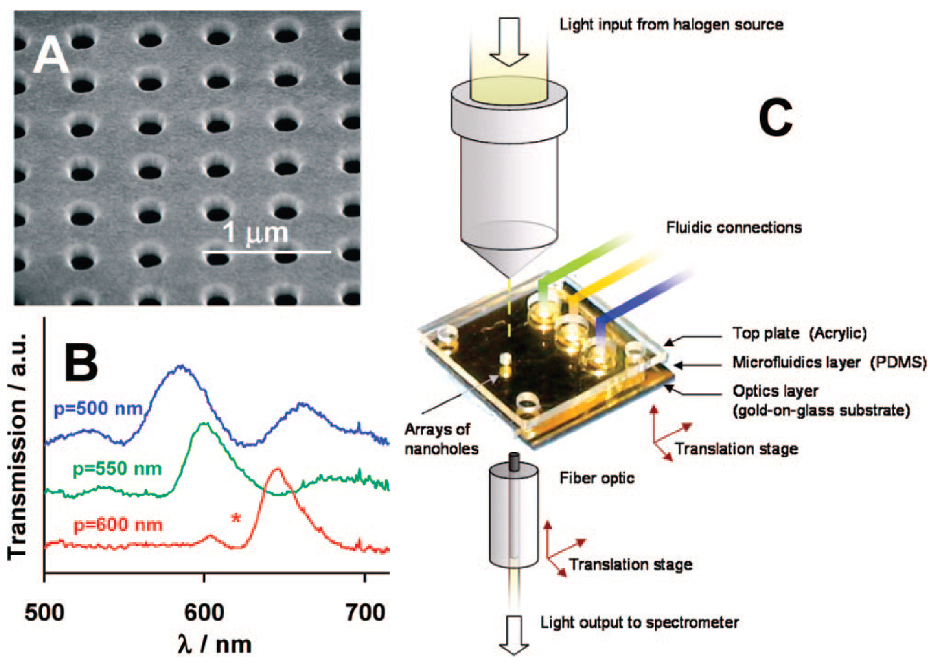
- Eftekhari, F.; Escobedo, C.; Ferreira, J.; Duan, X.; Girotto, E.M.; Brolo, A.G.; Gordon, R.; Sinton, D. Nanoholes as nanochannels: Flow-through plasmonic sensing. Anal. Chem. 2009, 81, 4308. [Google Scholar] [CrossRef]
- Chen, C.; Juan, M.L.; Li, Y.; Maes, G.; Borghs, G.; Van Dorpe, P.; Quidant, R. Enhanced Optical Trapping and Arrangement of Nano-Objects in a Plasmonic Nanocavity. Nano Lett. 2012, 12, 125–132. [Google Scholar] [CrossRef]
- Hu, R.; Tong, X.; Zhao, Q. Four Aspects about Solid-State Nanopores for Protein Sensing: Fabrication, Sensitivity, Selectivity, and Durability. Adv. Healthc. Mater. 2020, 9, 2000933. [Google Scholar] [CrossRef]
- Gilboa, T.; Meller, A. Optical Sensing and Analyte Manipulation in Solid-State Nanopores. Analyst 2015, 140, 4733–4747. [Google Scholar] [CrossRef]
- Peri, S.S.S.; Sabnani, M.K.; Raza, M.U.; Ghaffari, S.; Gimlin, S.; Wawro, D.D.; Lee, J.S.; Kim, M.J.; Weidanz, J.; Alexandrakis, G. Detection of Specific Antibody-Ligand Interactions with a Self-Induced Back-Action Actuated Nanopore Electrophoresis Sensor. Nanotechnology 2020, 31, 085502. [Google Scholar] [CrossRef] [PubMed]
- Escobedo, C. On-Chip Nanohole Array Based Sensing: A Review. Lab Chip 2013, 13, 2445. [Google Scholar] [CrossRef] [PubMed]
- Assad, O.N.; Gilboa, T.; Spitzberg, J.; Juhasz, M.; Weinhold, E.; Meller, A. Light-Enhancing Plasmonic-Nanopore Biosensor for Superior Single-Molecule Detection. Adv. Mater. 2017, 29, 1605442. [Google Scholar] [CrossRef] [PubMed]
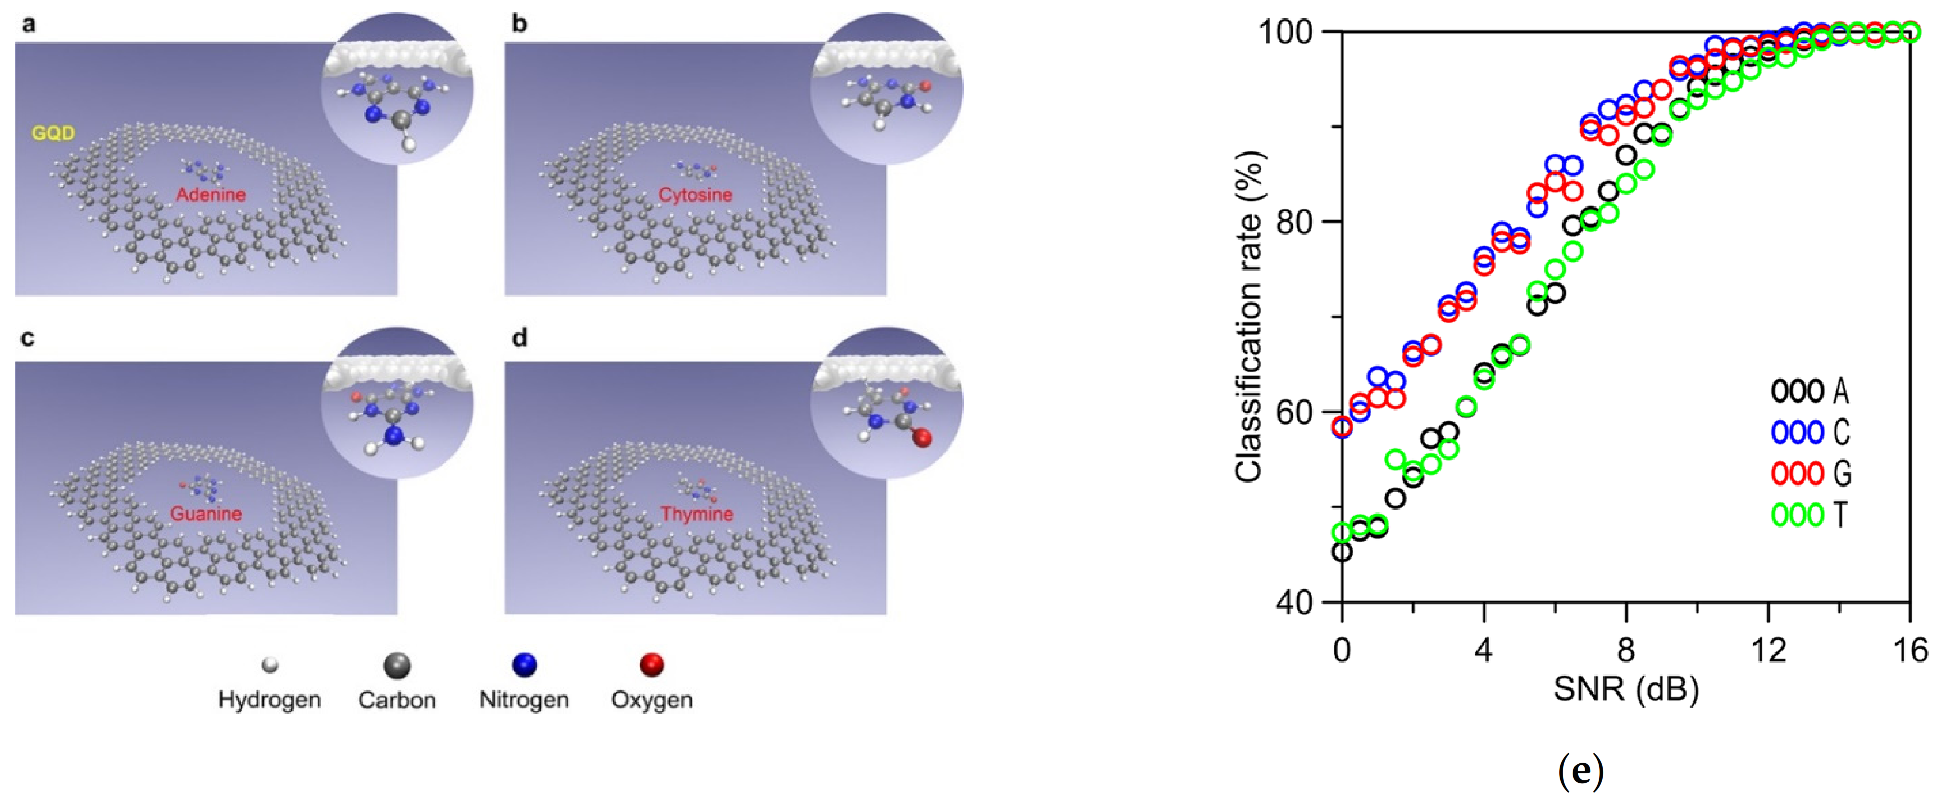
- Abasifard, M.; Ahmadi, V.; Fotouhi, B.; Roohi, R. DNA Nucleobases Sensing by Localized Plasmon Resonances in Graphene Quantum Dots with Nanopore: A First Principle Approach. J. Phys. Chem. C 2019, 123, 25309–25319. [Google Scholar] [CrossRef]
- Fotouhi, B.; Ahmadi, V.; Faramarzi, V. Nano-Plasmonic-Based Structures for DNA Sequencing. Opt. Lett. 2016, 41, 4229. [Google Scholar] [CrossRef]
- Shi, X.; Verschueren, D.V.; Dekker, C. Active Delivery of Single DNA Molecules into a Plasmonic Nanopore for Label-Free Optical Sensing. Nano Lett. 2018, 18, 8003–8010. [Google Scholar] [CrossRef] [Green Version]
- Verschueren, D.V.; Pud, S.; Shi, X.; De Angelis, L.; Kuipers, L.; Dekker, C. Label-Free Optical Detection of DNA Translocations through Plasmonic Nanopores. ACS Nano 2019, 13, 61–70. [Google Scholar] [CrossRef]
- Brassat, K.; Ramakrishnan, S.; Bürger, J.; Hanke, M.; Doostdar, M.; Lindner, J.K.N.; Grundmeier, G.; Keller, A. On the Adsorption of DNA Origami Nanostructures in Nanohole Arrays. Langmuir 2018, 34, 14757–14765. [Google Scholar] [CrossRef]
- Ohayon, S.; Girsault, A.; Nasser, M.; Shen-Orr, S.; Meller, A. Simulation of Single-Protein Nanopore Sensing Shows Feasibility for Whole-Proteome Identification. PLoS Comput. Biol. 2019, 15, e1007067. [Google Scholar] [CrossRef] [Green Version]
- Verschueren, D.; Shi, X.; Dekker, C. Nano-Optical Tweezing of Single Proteins in Plasmonic Nanopores. Small Methods 2019, 3, 1800465. [Google Scholar] [CrossRef]
- Ochmann, S.E.; Vietz, C.; Trofymchuk, K.; Acuna, G.P.; Lalkens, B.; Tinnefeld, P. Optical Nanoantenna for Single Molecule-Based Detection of Zika Virus Nucleic Acids without Molecular Multiplication. Anal. Chem. 2017, 89, 13000–13007. [Google Scholar] [CrossRef] [Green Version]
- Jackman, J.A.; Linardy, E.; Yoo, D.; Seo, J.; Ng, W.B.; Klemme, D.J.; Wittenberg, N.J.; Oh, S.-H.; Cho, N.-J. Plasmonic Nanohole Sensor for Capturing Single Virus-Like Particles toward Virucidal Drug Evaluation. Small 2016, 12, 1159–1166. [Google Scholar] [CrossRef]
- Sahu, S.P.; Mahigir, A.; Chidester, B.; Veronis, G.; Gartia, M.R. Ultrasensitive Three-Dimensional Orientation Imaging of Single Molecules on Plasmonic Nanohole Arrays Using Second Harmonic Generation. Nano Lett. 2019, 19, 6192–6202. [Google Scholar] [CrossRef]
- Belkin, M.; Chao, S.-H.; Jonsson, M.P.; Dekker, C.; Aksimentiev, A. Plasmonic Nanopores for Trapping, Controlling Displacement, and Sequencing of DNA. ACS Nano 2015, 9, 10598–10611. [Google Scholar] [CrossRef]
- Mendoza, E.A.; Neumann, A.; Kuznetsova, Y.; Brueck, S.R.J.; Edwards, J. [INVITED] Electrophoretic Plasmonic Nanopore Biochip Genome Sequencer. Opt. Laser Technol. 2019, 109, 199–211. [Google Scholar] [CrossRef]
- Ament, I.; Prasad, J.; Henkel, A.; Schmachtel, S.; Sönnichsen, C. Single Unlabeled Protein Detection on Individual Plasmonic Nanoparticles. Nano Lett. 2012, 12, 1092–1095. [Google Scholar] [CrossRef]
- Zijlstra, P.; Paulo, P.M.R.; Orrit, M. Optical Detection of Single Non-Absorbing Molecules Using the Surface Plasmon Resonance of a Gold Nanorod. Nat. Nanotechnol. 2012, 7, 379–382. [Google Scholar] [CrossRef] [Green Version]
- Beuwer, M.A.; Prins, M.W.J.; Zijlstra, P. Stochastic Protein Interactions Monitored by Hundreds of Single-Molecule Plasmonic Biosensors. Nano Lett. 2015, 15, 3507–3511. [Google Scholar] [CrossRef]
- Gordon, R. Biosensing with Nanoaperture Optical Tweezers. Opt. Laser Technol. 2019, 109, 328–335. [Google Scholar] [CrossRef]
- Tan, S.; Gu, D.; Liu, H.; Liu, Q. Detection of a Single Enzyme Molecule Based on a Solid-State Nanopore Sensor. Nanotechnology 2016, 27, 155502. [Google Scholar] [CrossRef]
- Im, J.; Lindsay, S.; Wang, X.; Zhang, P. Single Molecule Identification and Quantification of Glycosaminoglycans Using Solid-State Nanopores. ACS Nano 2019, 13, 6308–6318. [Google Scholar] [CrossRef]
- Wang, Y.; Wang, Y.; Du, X.; Yan, S.; Zhang, P.; Chen, H.-Y.; Huang, S. Electrode-Free Nanopore Sensing by DiffusiOptoPhysiology. Sci. Adv. 2019, 5, eaar3309. [Google Scholar] [CrossRef] [Green Version]
- Li, Z.; Leustean, L.; Inci, F.; Zheng, M.; Demirci, U.; Wang, S. Plasmonic-Based Platforms for Diagnosis of Infectious Diseases at the Point-of-Care. Biotechnol. Adv. 2019, 37, 107440. [Google Scholar] [CrossRef]
- Prasad, A.; Choi, J.; Jia, Z.; Park, S.; Gartia, M.R. Nanohole Array Plasmonic Biosensors: Emerging Point-of-Care Applications. Biosens. Bioelectron. 2019, 130, 185–203. [Google Scholar] [CrossRef]
- Ameen, A.; Hackett, L.P.; Seo, S.; Dar, F.K.; Gartia, M.R.; Goddard, L.L.; Liu, G.L. Plasmonic Sensing of Oncoproteins without Resonance Shift Using 3D Periodic Nanocavity in Nanocup Arrays. Adv. Opt. Mater. 2017, 5, 1601051. [Google Scholar] [CrossRef] [Green Version]
- Gu, Z.; Jing, C.; Ying, Y.-L.; He, P.; Long, Y.-T. In Situ High Throughput Scattering Light Analysis of Single Plasmonic Nanoparticles in Living Cells. Theranostics 2015, 5, 188–195. [Google Scholar] [CrossRef] [Green Version]
- Ma, X.; Song, S.; Kim, S.; Kwon, M.; Lee, H.; Park, W.; Sim, S.J. Single Gold-Bridged Nanoprobes for Identification of Single Point DNA Mutations. Nat. Commun. 2019, 10, 836. [Google Scholar] [CrossRef] [Green Version]
- Na, H.-K.; Wi, J.-S.; Son, H.Y.; Ok, J.G.; Huh, Y.-M.; Lee, T.G. Discrimination of Single Nucleotide Mismatches Using a Scalable, Flexible, and Transparent Three-Dimensional Nanostructure-Based Plasmonic MiRNA Sensor with High Sensitivity. Biosens. Bioelectron. 2018, 113, 39–45. [Google Scholar] [CrossRef]
- Rapisarda, A.; Giamblanco, N.; Marletta, G. Kinetic Discrimination of DNA Single-Base Mutations by Localized Surface Plasmon Resonance. J. Colloid Interface Sci. 2017, 487, 141–148. [Google Scholar] [CrossRef]
- Canady, T.D.; Li, N.; Smith, L.D.; Lu, Y.; Kohli, M.; Smith, A.M.; Cunningham, B.T. Digital-Resolution Detection of MicroRNA with Single-Base Selectivity by Photonic Resonator Absorption Microscopy. Proc. Natl. Acad. Sci. USA 2019, 116, 19362–19367. [Google Scholar] [CrossRef] [Green Version]
- Li, M.-X.; Xu, C.-H.; Zhang, N.; Qian, G.-S.; Zhao, W.; Xu, J.-J.; Chen, H.-Y. Exploration of the Kinetics of Toehold-Mediated Strand Displacement via Plasmon Rulers. ACS Nano 2018, 12, 3341–3350. [Google Scholar] [CrossRef] [PubMed]
- Adegoke, O.; Park, E.Y. Gold Nanoparticle-Quantum Dot Fluorescent Nanohybrid: Application for Localized Surface Plasmon Resonance-Induced Molecular Beacon Ultrasensitive DNA Detection. Nanoscale Res. Lett. 2016, 11, 523. [Google Scholar] [CrossRef] [PubMed] [Green Version]
- Aćimović, S.S.; Šípová-Jungová, H.; Emilsson, G.; Shao, L.; Dahlin, A.B.; Käll, M.; Antosiewicz, T.J. Antibody–Antigen Interaction Dynamics Revealed by Analysis of Single-Molecule Equilibrium Fluctuations on Individual Plasmonic Nanoparticle Biosensors. ACS Nano 2018, 12, 9958–9965. [Google Scholar] [CrossRef] [PubMed]
- Omair, Z.; Talukder, M.A. Sensitivity Analysis of Gold Nanorod Biosensors for Single Molecule Detection. Plasmonics 2019, 14, 1611–1619. [Google Scholar] [CrossRef]
- Lee, S.A.; Biteen, J.S. Interplay of Nanoparticle Resonance Frequency and Array Surface Coverage in Live-Cell Plasmon-Enhanced Single-Molecule Imaging. J. Phys. Chem. C 2018, 122, 5705–5709. [Google Scholar] [CrossRef]
- Lee, S.E.; Chen, Q.; Bhat, R.; Petkiewicz, S.; Smith, J.M.; Ferry, V.E.; Correia, A.L.; Alivisatos, A.P.; Bissell, M.J. Reversible Aptamer-Au Plasmon Rulers for Secreted Single Molecules. Nano Lett. 2015, 15, 4564–4570. [Google Scholar] [CrossRef] [Green Version]


| Target Analyte | Instrument Configuration | Detection Strategy | Reference |
|---|---|---|---|
| Nucleic acids | Nanopore-nanowells with fluorescence enhancement | Double-stranded single DNA molecules adsorption | [34] |
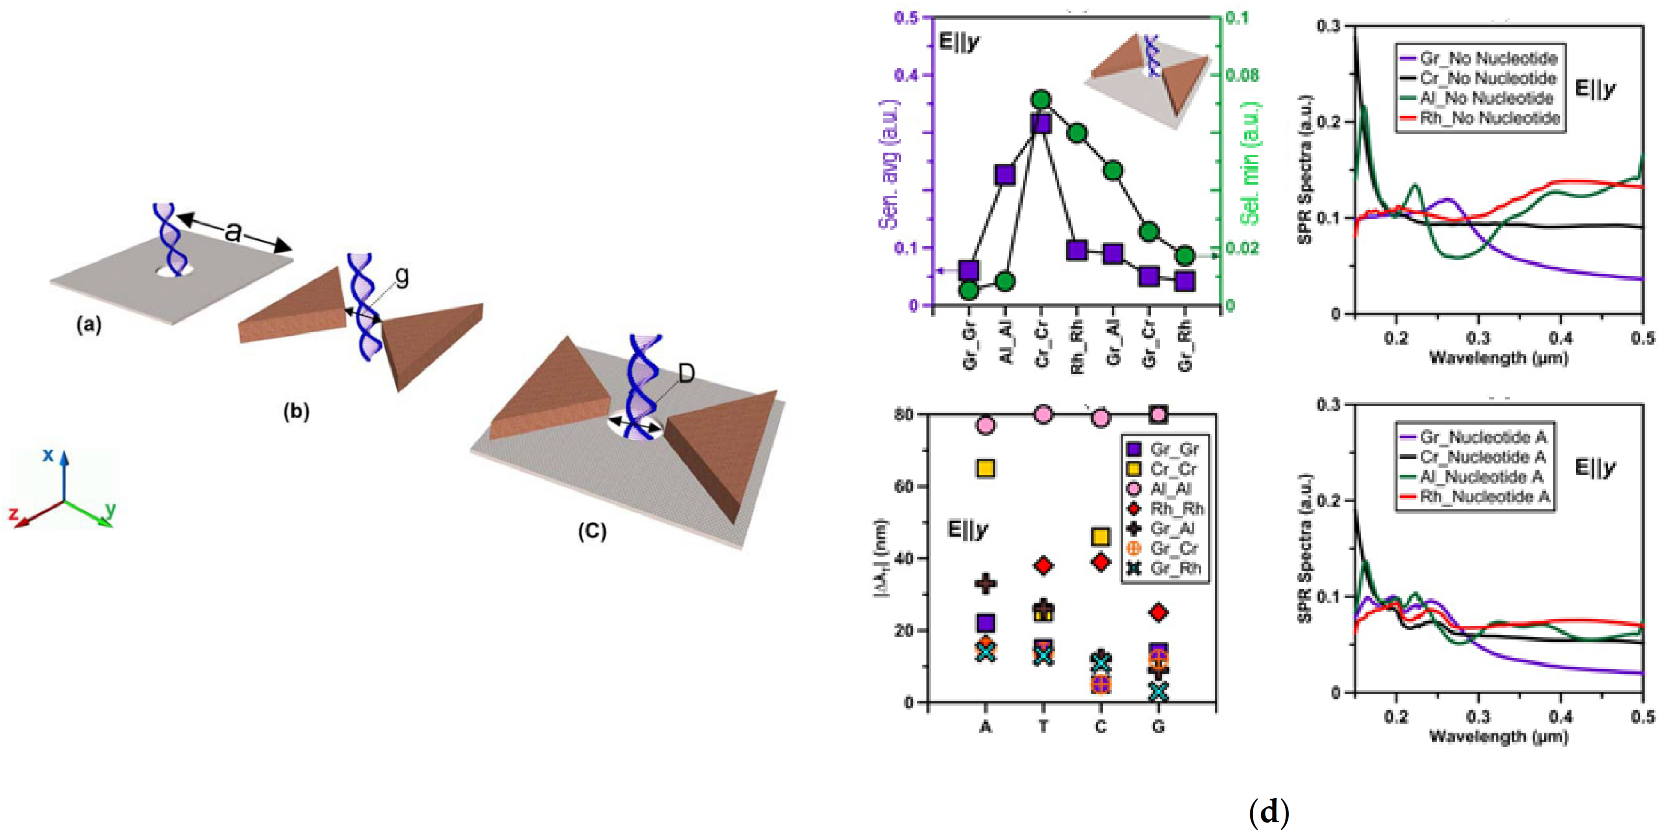
| Graphene quantum dots with a nanopore (density functional theory calculations.) | DNA-graphene interactions and nucleobase (adenine, thymine, cytosine, and guanine) rotation | [35] | |
| Nanopore, bowtie, and bowtie-nanopore structures and SPR materials (chromium, aluminum, rhodium and graphene) | DNA nucleotides shifts in the SPR spectra through Bowtie-nanopore structures | [36] | |
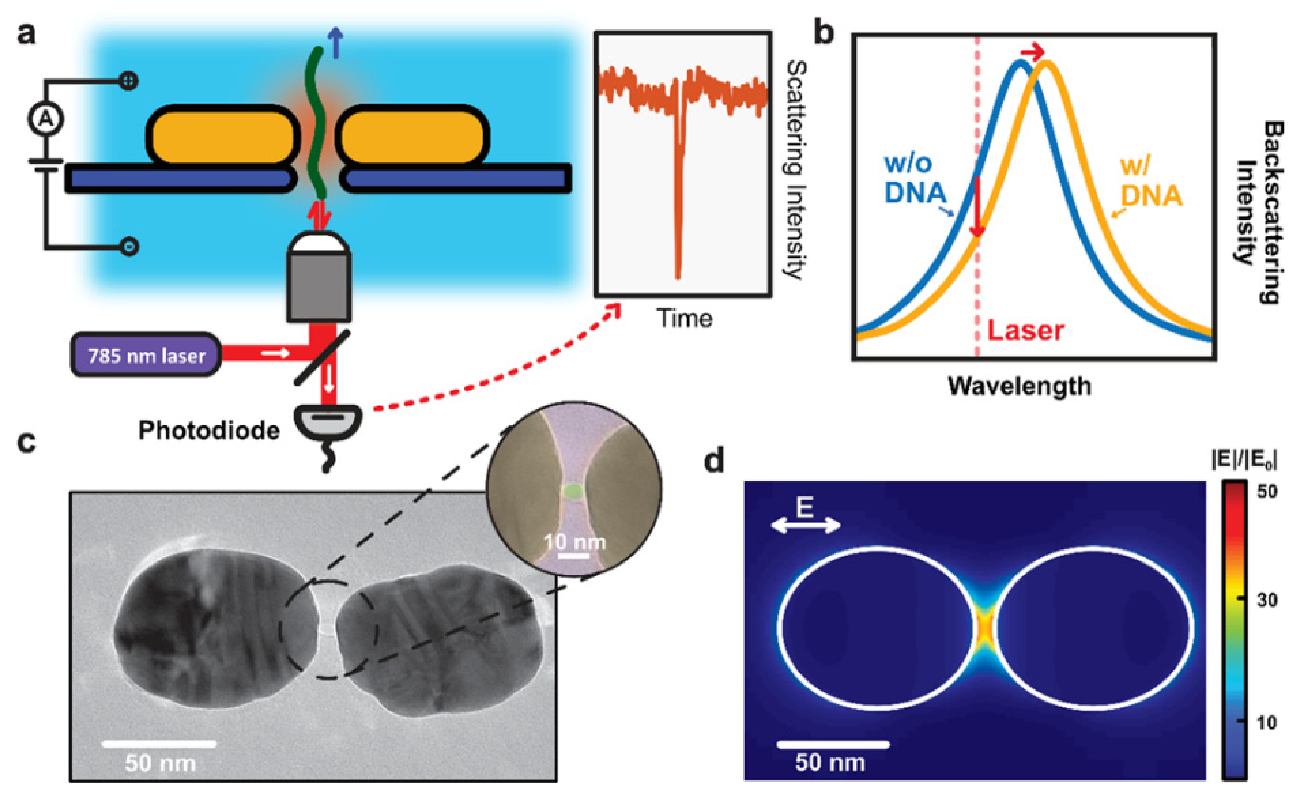
| Two elongated nanodiscs in a gold bowtie nanoantenna | Single-DNA molecules in the nanopore gap monitoring (l intensity of light backscattered from the antenna) | [37] | |
| Inverted-bowtie gold plasmonic nanopore | DNA-protein interactions and DNA translocation (optical signals under different illumination conditions) | [38] | |
| Nanohole arrays | Single-DNA origami triangles were captured on SiO2 bottom surface of gold nanoholes | [39] | |
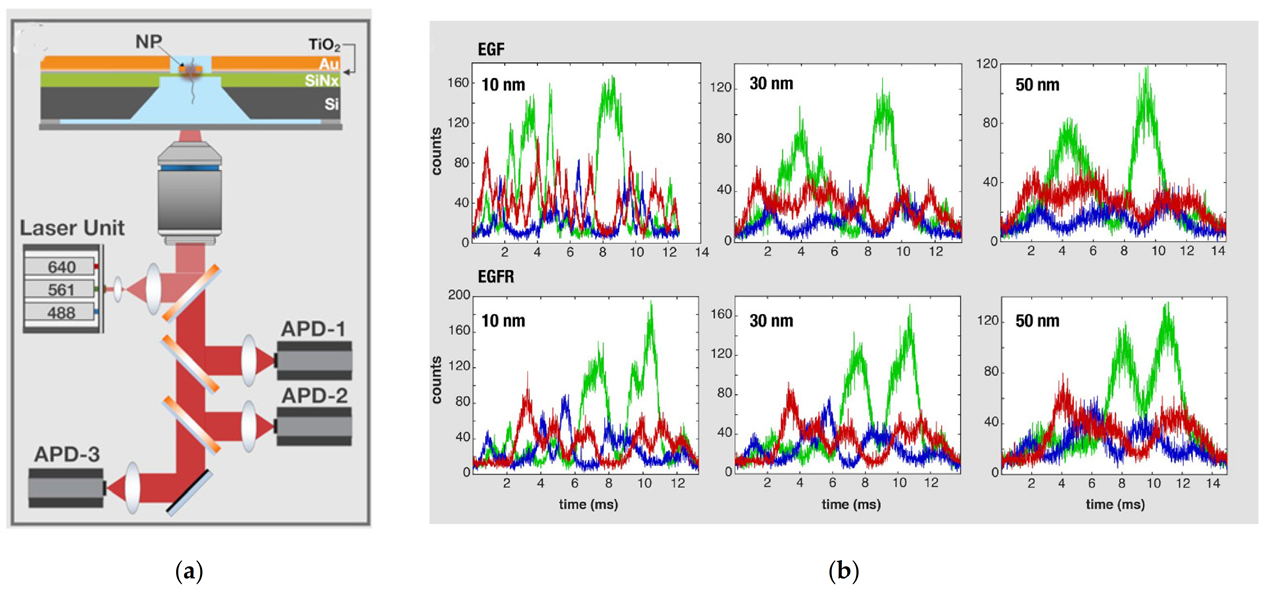
| Proteins | Plasmonic nanopore tri-color fluorescence simulation and pattern-recognition algorithms | Individual protein translocations, human plasma proteome and cytokine recognition | [40] |
| Plasmonic nanopore acting as nano tweezer | Individual beta-amylase proteins optical trapping | [41] | |
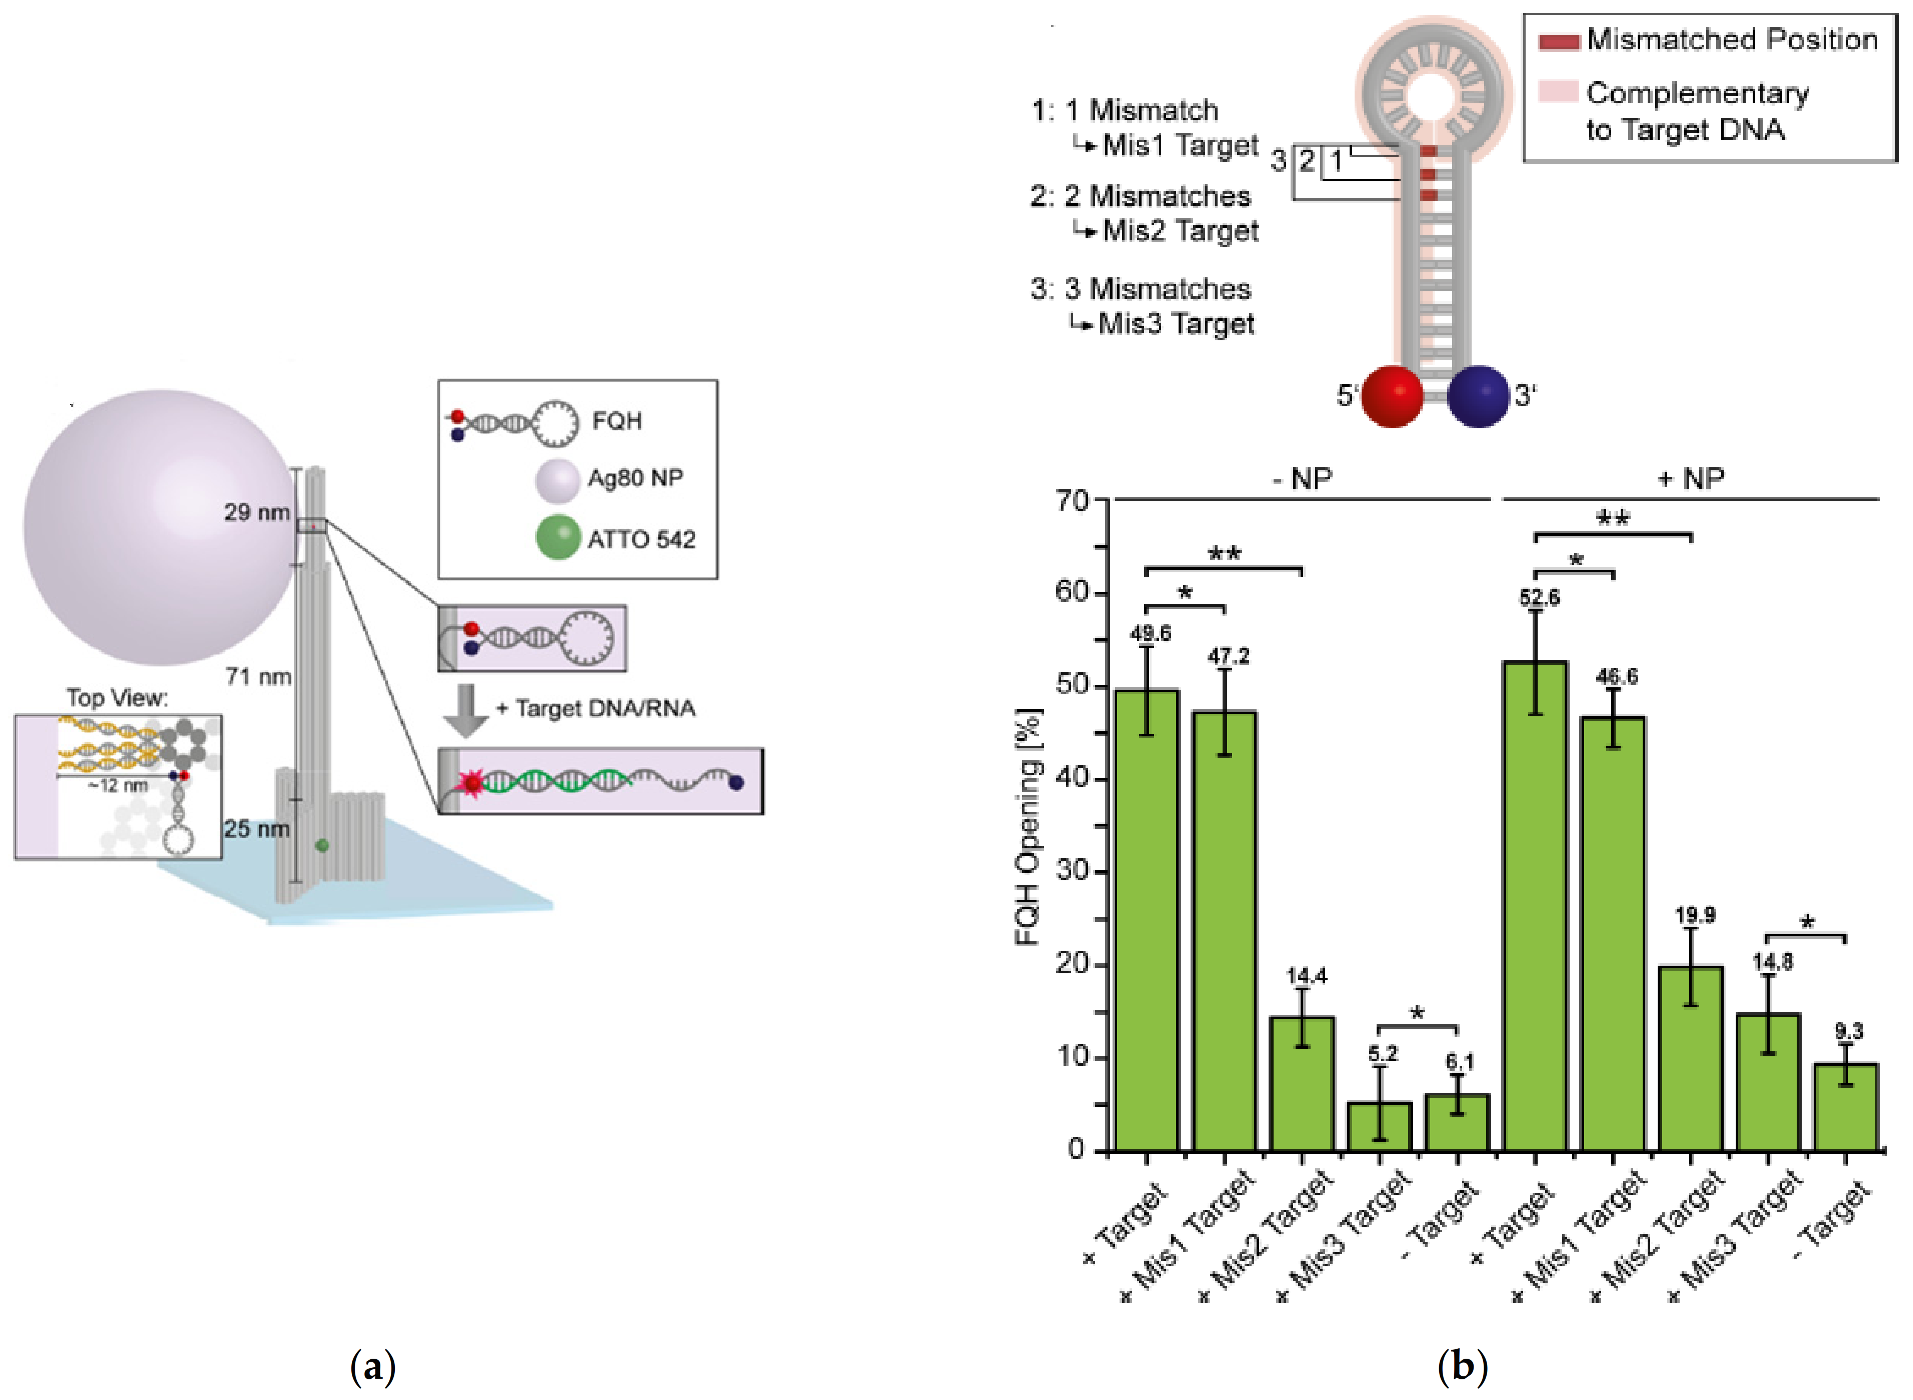
| Infectious agents | Optical nanoantenna with direct physical fluorescence amplification | Single nucleotide variations in Zika artificial DNA origami buffer and human serum | [42] |
| Nanohole array | Single dengue virus-like particles and virucidal drug candidates (spectral shifts of transmission peaks) | [43] | |
| Organic compounds | Silver nanohole arrays and microscopy imaging | Individual rhodamine 6G (R6G) three-dimensional orientation | [44] |
| Target Analyte | Instrument Configuration | Detection Format | Reference |
|---|---|---|---|
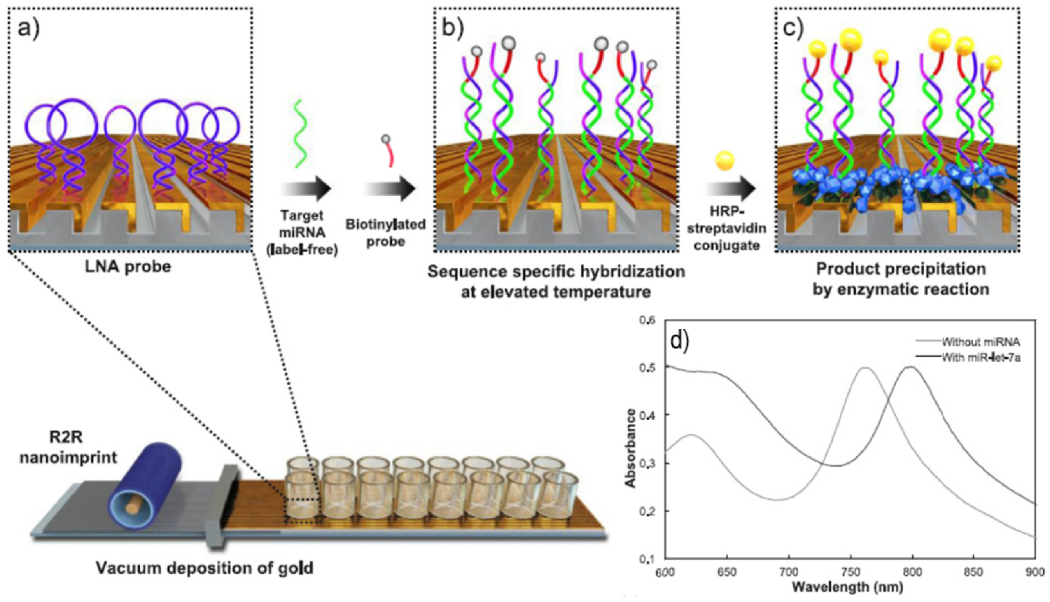
| Nucleic acids | LSPR platform with 3D plasmonic nanostructures fabricated on gold strips | Single base mismatched detection of microRNAs molecules at different melting temperatures | [59] |
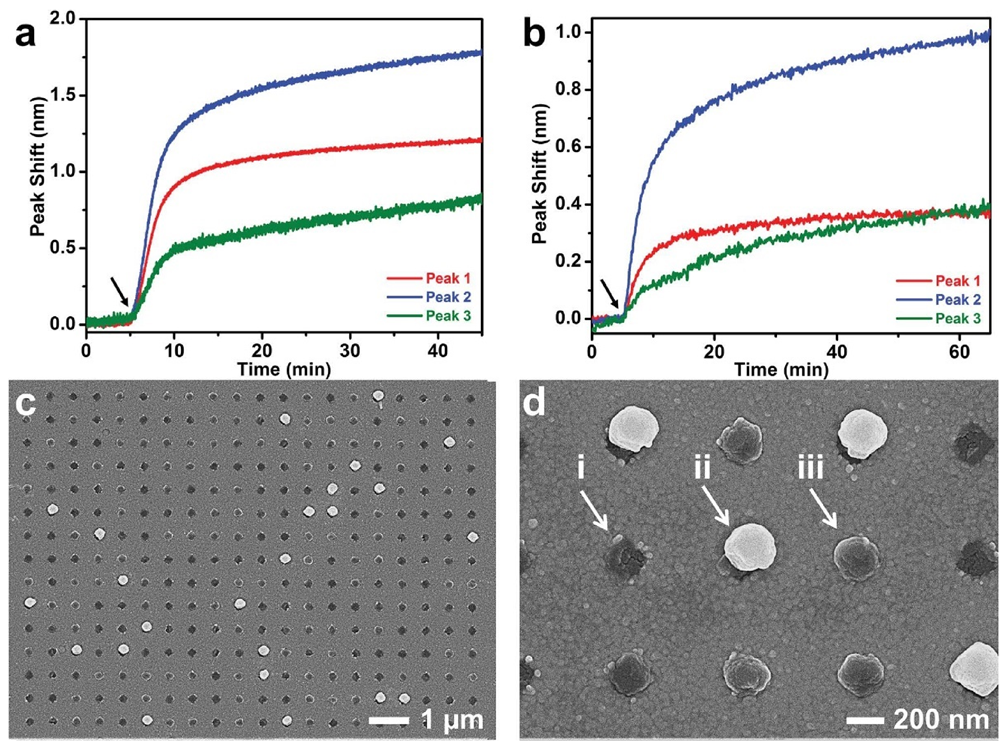
| LSPR platform with silicon oxide deposited on top of gold nanodisks | Single nucleotide perfect matching and mismatching | [60] | |
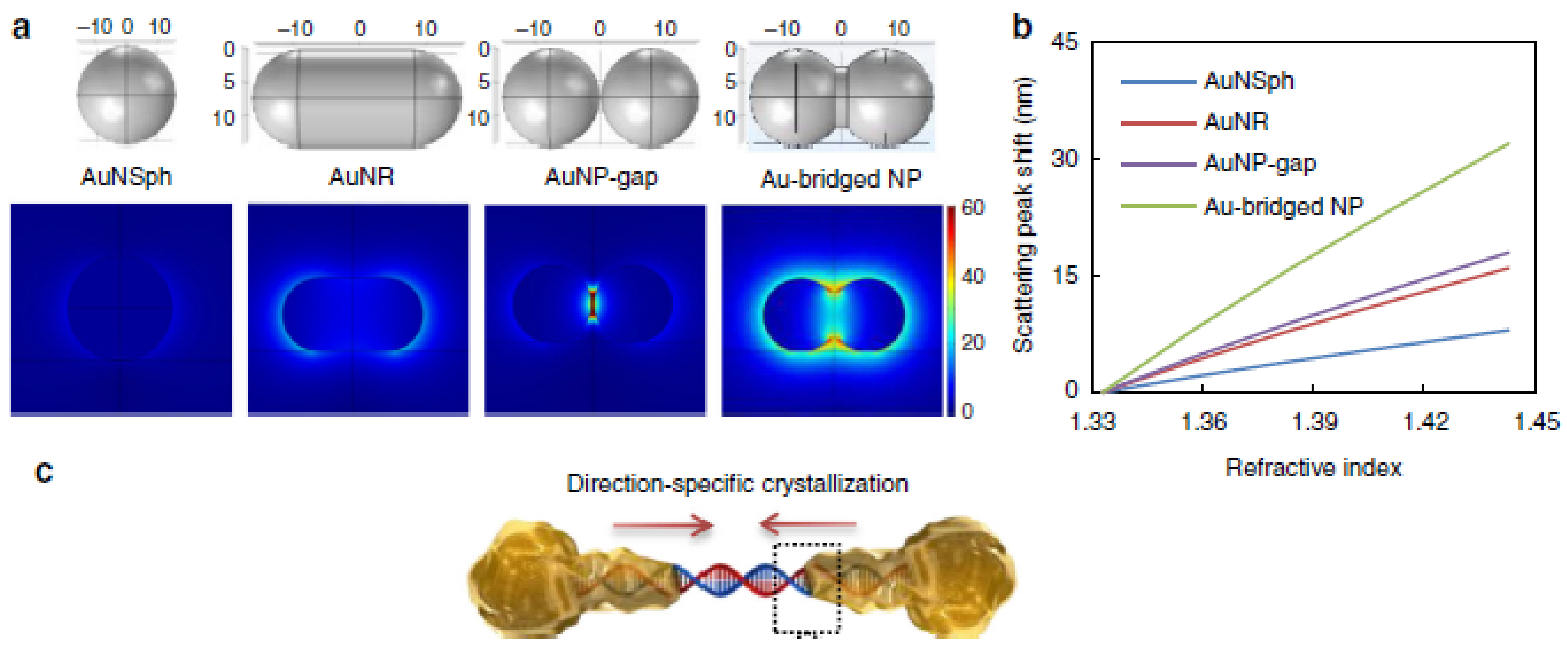
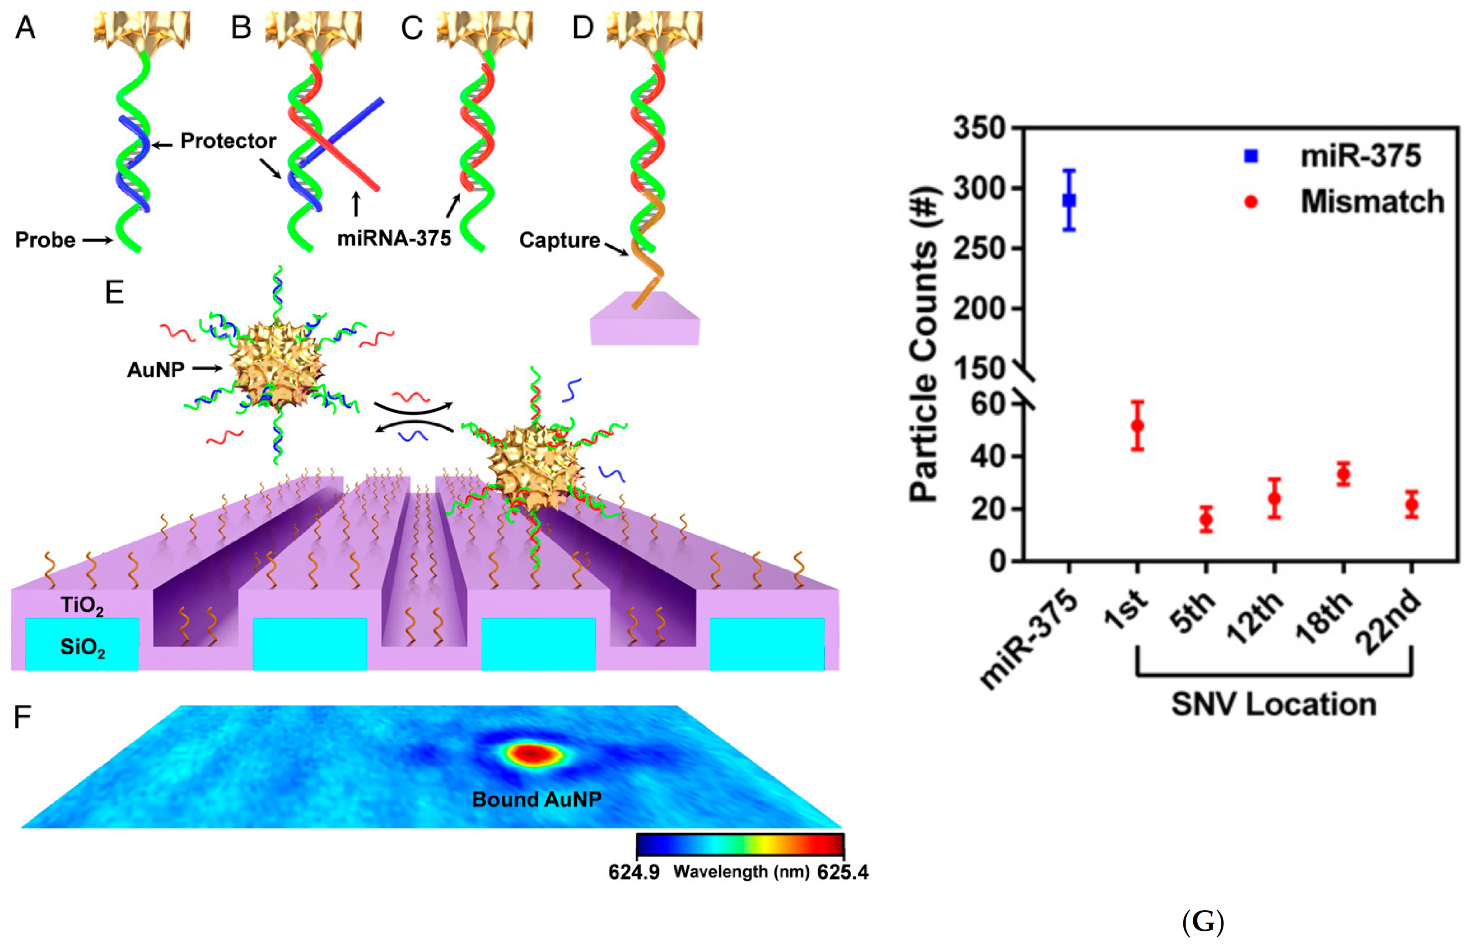
| Gold nanoparticles attached to photonic crystals (Photonic Resonator Absorption Microscopy) | Single-base mismatches of5 different single-nucleotide variants of microRNA-375 | [61] | |
| Core−satellite plasmon rulers (gold nanoparticles) and dark-field microscopy imaging | microRNA-21 expression in living HeLa cells at single molecule level | [62] | |
| LSPR-induced fluorescence (of gold nanoparticles-SiO2-quantum dots conjugated to a molecular beacon) | Single-base nucleotide DNA mismatch | [63] | |
| Proteins | LSPR platform with gold nanorods (CMOS camera and an imaging spectrometer) | Single-molecule equilibrium fluctuations (PEG/anti-PEG interactions) | [64] |
| LSPR platform with gold nanorods | Kinetics and binding position of single thyroglobulin and glycoprotein molecules | [65] | |
| Cells | LSPR with Nanotriangle arrays and fluorescence imaging | Single-molecule fluorescence detection of photoactivable Vibrio cholerae living cells | [66] |
| Plasmon rulers linked by a single-aptamer | Binding of cell-secreted MMP3 proteins to aptamer at the single-molecule level | [67] |
Publisher’s Note: MDPI stays neutral with regard to jurisdictional claims in published maps and institutional affiliations. |
© 2021 by the authors. Licensee MDPI, Basel, Switzerland. This article is an open access article distributed under the terms and conditions of the Creative Commons Attribution (CC BY) license (https://creativecommons.org/licenses/by/4.0/).
Share and Cite
Mauriz, E.; Lechuga, L.M. Plasmonic Biosensors for Single-Molecule Biomedical Analysis. Biosensors 2021, 11, 123. https://doi.org/10.3390/bios11040123
Mauriz E, Lechuga LM. Plasmonic Biosensors for Single-Molecule Biomedical Analysis. Biosensors. 2021; 11(4):123. https://doi.org/10.3390/bios11040123
Chicago/Turabian StyleMauriz, Elba, and Laura M. Lechuga. 2021. "Plasmonic Biosensors for Single-Molecule Biomedical Analysis" Biosensors 11, no. 4: 123. https://doi.org/10.3390/bios11040123