Article

Tunable Electromagnetic and Microwave Absorption Properties of Magnetic FeNi3 Alloys

Hangzhou Dianzi University, Hangzhou 310018, China
*
Author to whom correspondence should be addressed.
Nanomaterials 2023, 13(5), 930; https://doi.org/10.3390/nano13050930
Submission received: 10 January 2023 / Revised: 24 February 2023 / Accepted: 1 March 2023 / Published: 3 March 2023

Abstract

:
Magnetic materials have a very broad application prospect in the field of microwave absorption, among which soft magnetic materials become the focus of magnetic materials research because of their high saturation magnetization and low coercivity. FeNi3 alloy has been widely used in soft magnetic materials because of its excellent ferromagnetism and electrical conductivity. In this work, FeNi3 alloy was prepared by the liquid reduction method. The effect of the filling ratio of FeNi3 alloy on the electromagnetic properties of absorbing materials was studied. It is found that the impedance matching ability of FeNi3 alloy is better when the filling ratio is 70 wt% than that of other samples with different filling ratios (30–60 wt%), showing better microwave absorption characteristics. When the matching thickness is 2.35 mm, the minimum reflection loss (RL) of FeNi3 alloy with a 70 wt% filling ratio reaches −40.33 dB, and the effective absorption bandwidth is 5.5 GHz. When the matching thickness is between 2 and 3 mm, the effective absorption bandwidth ranges from 7.21 GHz to 17.81 GHz, almost covering the whole X and Ku bands (8–18 GHz). The results show that FeNi3 alloy has adjustable electromagnetic properties and microwave absorption properties with different filling ratios, which is conducive to selecting excellent microwave absorption materials.

1. Introduction

With the rapid development of information technology in social life, the influence of electromagnetic waves on society has grown deeply. Electromagnetic interference is gradually becoming a serious problem that affects our daily life [1,2,3,4,5]. Using microwave-absorbing materials is a good solution to solving this problem, which could absorb electromagnetic waves [6,7]. The microwave-absorbing material not only requires high absorption strength but also needs to have a thinner thickness and lighter weight so that it can be used effectively in practical applications [8,9]. Microwave-absorbing materials have many uses in different fields. For example, in the military, they can be used as a paint for fighter jets to absorb microwaves emitted by radars, achieving effective concealment [10,11].
According to the different absorption mechanisms, microwave-absorbing materials can be divided into two types: dielectric loss and magnetic loss materials [12]. Magnetic loss materials include ferrite, carbonyl iron and other magnetic materials [13,14]. Ferrite (such as Fe3O4 and NiFe2O4) is a material often used in the field of microwave absorption. The absorbers made of ferrite-absorbing material have a thin thickness, but the synthesis process of ferrite is difficult, and the effective bandwidth of the absorber is not enough to cover various frequency bands [15,16]. However, Fe-based alloy composites can perfectly improve these performance deficiencies. Yang et al. used a chemical method to prepare the FeCo nanosheet. The composite material comprising epoxy resin can obtain a reflection loss value of −43 dB at 8.1 GHz and a thickness of 1.8 mm [17]. Liu et al. used an electroless plating method to prepare FeNi alloy-coated flake graphite. When the thickness of the composite material was 1.2 mm, it obtained a minimum absorption RL of −43.7 dB at 12.5 GHz [18]. Deng et al. synthesized the Mxene/HFO (hollow Fe3O4) mixture via electrostatic assembly. With a thickness of 1.56 mm, the composite has a minimum absorption RL of −63.7 dB [5].
In recent years, many studies have researched iron-based alloys, such as iron–nickel and iron–cobalt alloys, as well as further research on coatings with iron-based alloys [19,20,21,22,23]. Among them, the soft magnetic nickel alloy has become popular in the research of modern microwave-absorbing materials because of its higher saturation magnetization and lower coercivity [20,24,25]. The different preparation methods of iron–nickel alloys and the changing of the ratio of iron–nickel among them will cause great differences in microwave absorption performance. The synthesis method includes sol–gel and hydrothermal synthesis, etc. In addition, there are many options for microwave-absorbing mixed materials, such as paraffin wax, epoxy resin, etc. Paraffin wax has the advantage of easily passing through waves. For example, the flake FeNi3 particles, prepared by Shi et al., used the electrodeposition method with a mixed 30 wt% paraffin, which can obtain a minimum reflection loss of −50.42 dB at 3.44 GHz, and at the same time, when the thickness is 1.3–2.5 mm, it has a particularly wide absorption bandwidth of 4.4–17.52 GHz [26]. Yao et al. used a two-step method with a mixed 70 wt% paraffin to prepare FeNi powder. When the composite material has a thickness of 3 mm, the minimum absorption peak reaches −52.58 dB [27]. Yan et al. used the low-temperature reduction method with a 16.7 vol% paraffin to prepare FeNi3 submicron spheres. The absorber thickness was 2.9 mm, and the minimum absorption peak was −61.3 dB at 8.7 GHz [28]. Therefore, iron–nickel is better for microwave absorption.
The research work on the absorption properties of the FeNi alloy composites described above is mostly focused on the material’s properties, and there are few studies on the filling ratio of the composites. However, the filling ratio has a non-negligible influence on the stealth performance of the absorbing material. Therefore, this paper mainly studies the influence of the filling ratio on the absorbing performance of FeNi3 alloy by adjusting different filling ratios. The final FeNi3 alloy obtained has a good absorbing performance when the filling ratio is 70 wt%. When the matching thickness is 2.35 mm, the minimum reflection loss reaches −40.33 dB, and the effective absorption bandwidth is 5.5 GHz.

2. Experimental Procedure

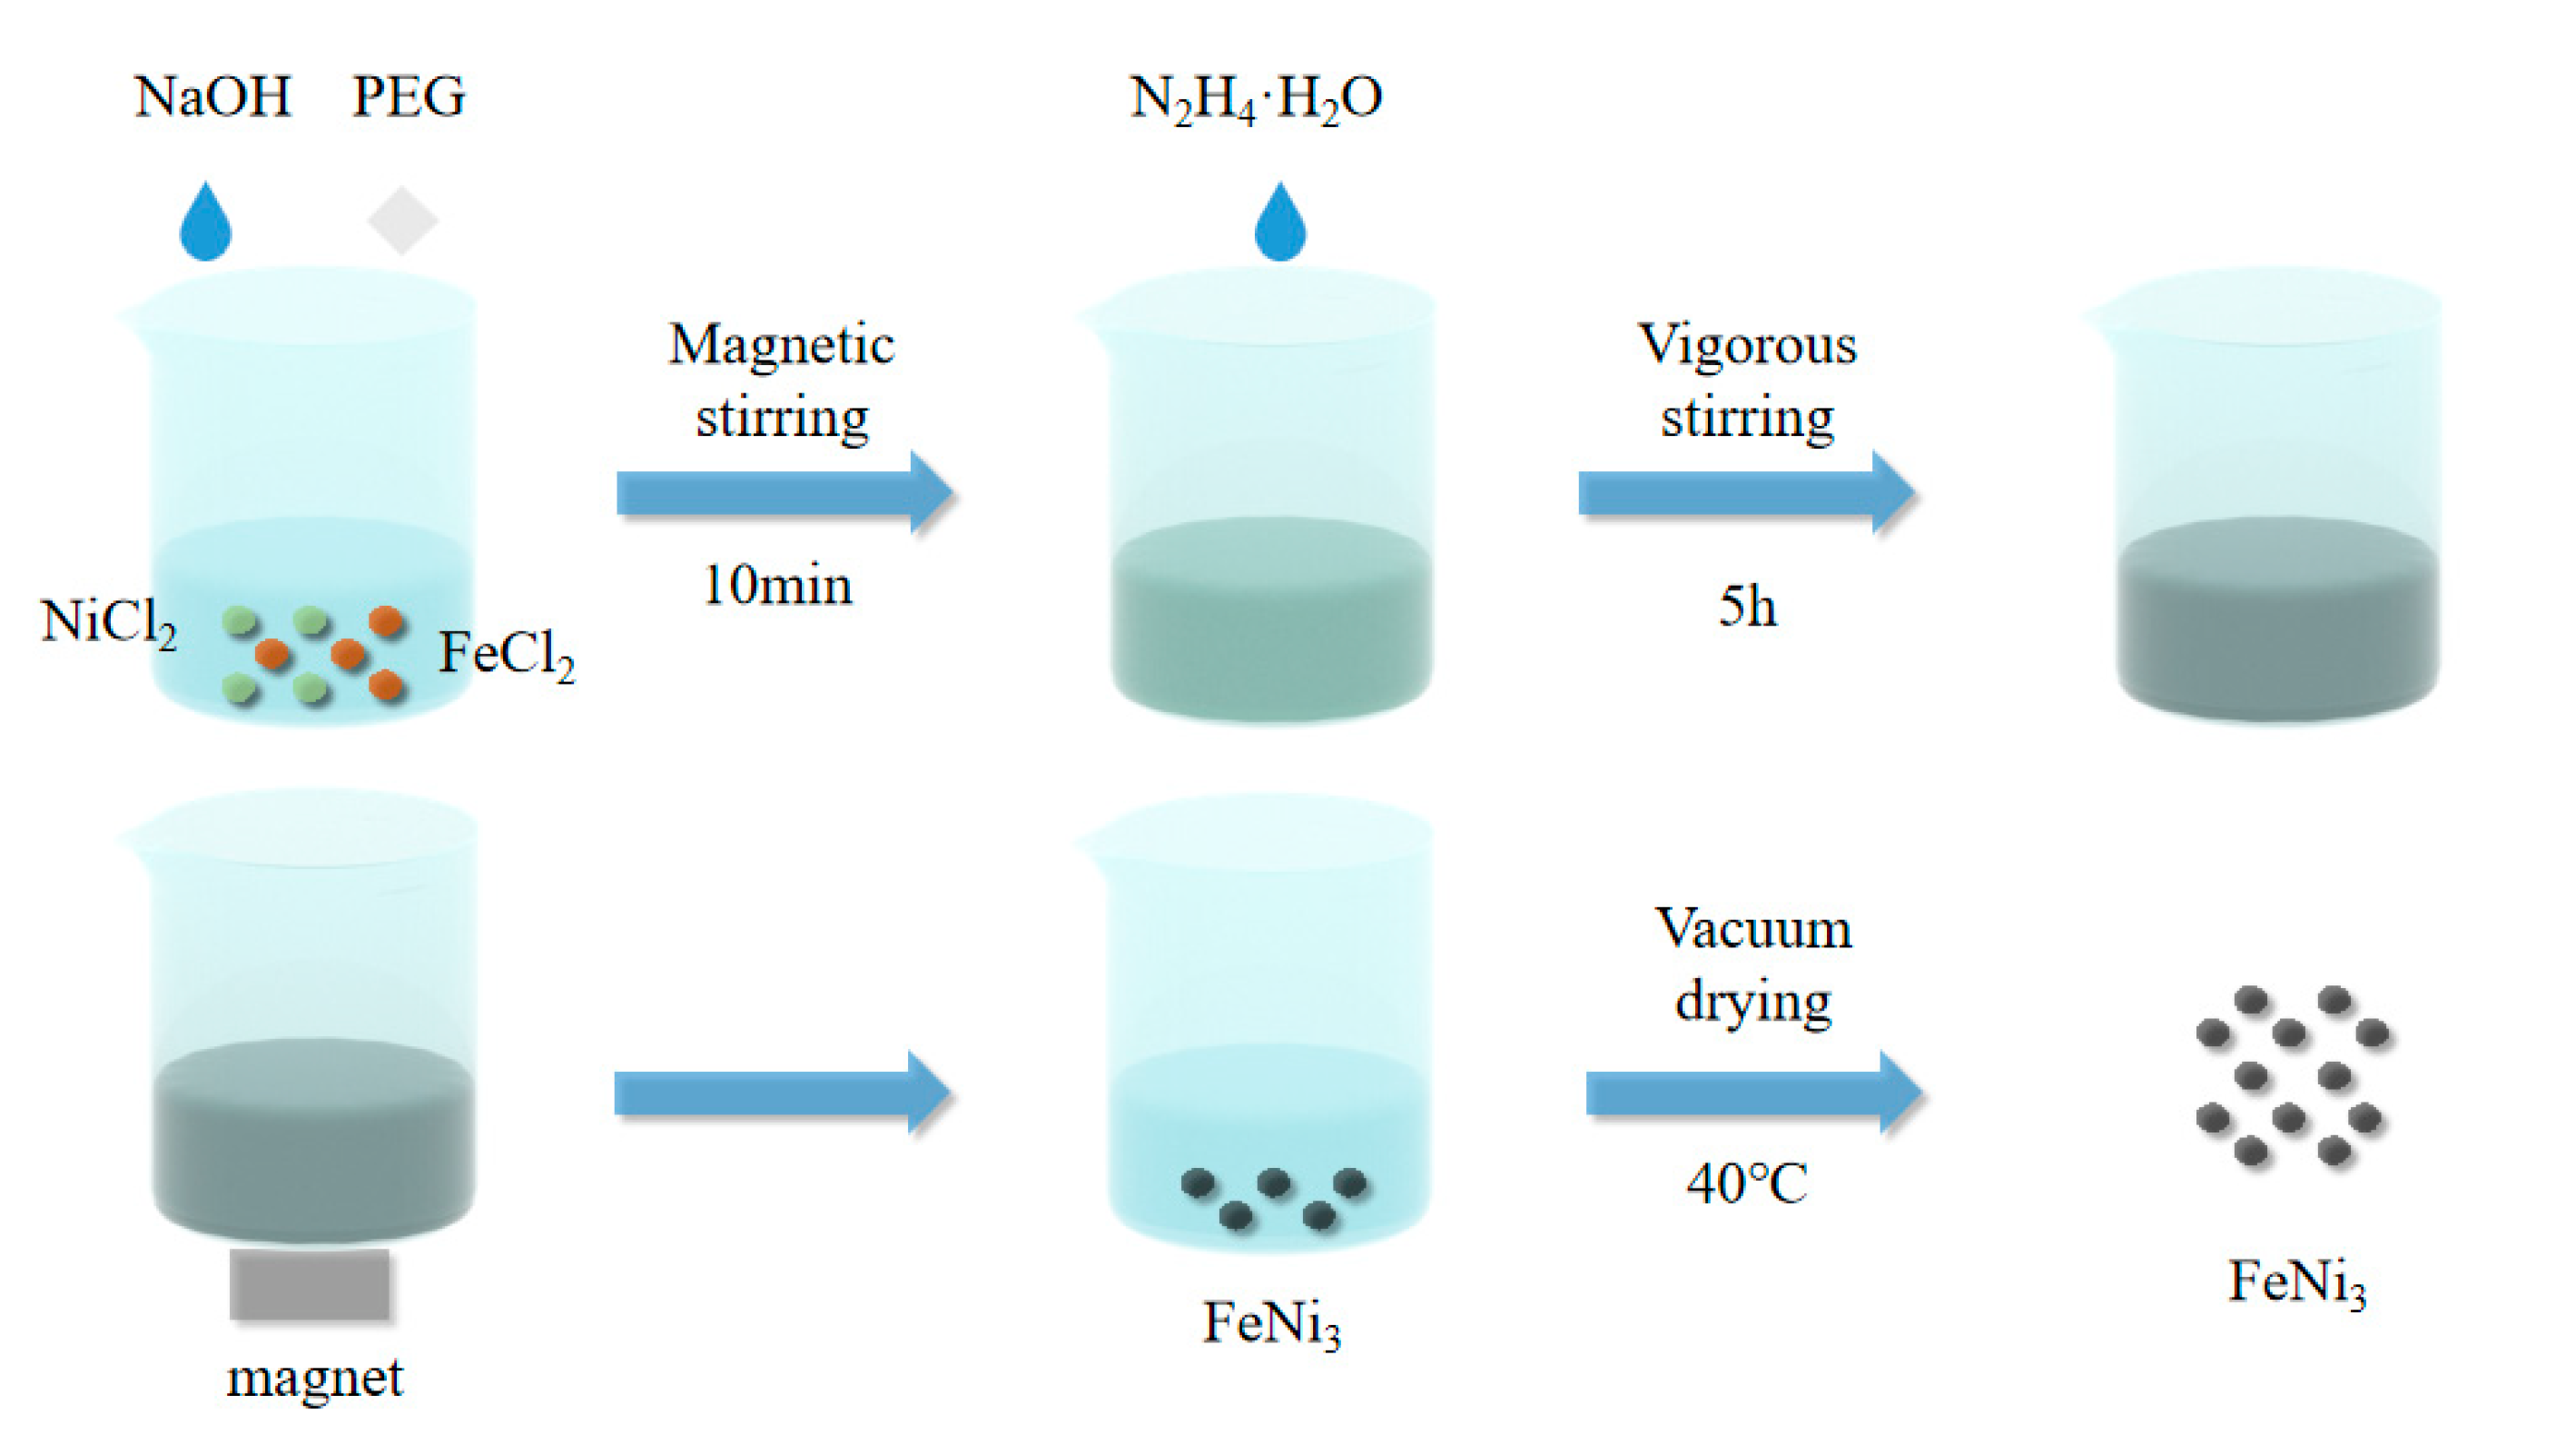
2.1. Preparation of FeNi3 Alloy Particles

All the materials were analytically pure (>99.7%) and from Shanghai Maclean Biochemical Technology Co., Ltd. (Shanghai, China). As shown in Scheme 1, the initial materials were 2.5 mmol iron dichloride FeCl2·4H2O and 7.5 mmol nickel chloride NiCl2·6H2O. These were dissolved in 80 mL of deionized water H2O to form a mixed solution. A total of 12 mL of sodium hydroxide NaOH solution and 1 g of Polyethylene glycol (PEG) were added and magnetically stirred for 10 min, then vigorously stirred with an electric mixer while adding 8 mL of hydrazine hydrates. The solution was continuously stirred for 5 h. After stirring, the obtained solution was washed three times with distilled water and absolute ethanol and finally placed in a vacuum drying oven at 40 °C and vacuum dried to obtain a FeNi3 alloy powder sample. Take a certain quality of FeNi3 powder and evenly mix it with paraffin wax to make 120 mg of a paraffin wax-FeNi3 mixture with FeNi3 mass ratios of 30–70 wt%. Among the materials, hydrazine hydrate was used as an inorganic hydride-reducing agent to reduce metal ions from salt solutions or metal organics in solvents. PEG was mainly used as a catalyst to facilitate reactions between ions.

2.2. Characterization and Measurements

The X-ray diffractometer (XRD) (Bruker D8 ADVANCE, Germany) was used to analyze the structure information of the alloy powder samples. In this case, the instrument’s detection source for the XRD measurements was Cu target Kα rays, and the range of measurement was from 10° to 90°, with a scanning speed of 2° per minute. A scanning electron microscope (SEM) (Hitachi S4800, USA) and transmission electron microscope (TEM) (JEOL JEM 2100, USA) were used to analyze the morphology, particle size and dispersion of the alloy powder samples. A vibrating sample magnetometer (VSM,) (the Lakeshore 7400, China) was used to measure the magnetic strength of the sample. Energy-dispersive X-ray spectroscopy (EDX) (JEOL JEM 2100, USA) was used for the micro-component analysis. At the same time, the void, atomic proportion and density of the sample were measured. The composites of the alloy powder and paraffin wax with a mass ratio of paraffin wax of 30–70 wt% were pressed into a ring sample with an outer diameter of 7 mm and an inner diameter of 3.04 mm, which was used to measure the electromagnetic parameters with a vector network analyzer (Agilent PNA N5244A, USA).

3. Results and Discussion

The XRD diffraction of the FeNi3 alloy sample is shown in Figure 1a. From the XRD results, there are three diffraction peaks in the range of 10° to 80°, which appear at 44.18°, 51.56° and 75.86°. These can be determined as the (111), (200) and (222) crystal planes of the FeNi3 (JCPDS Card No. 38–0419). The crystal system of the FeNi3 alloy is a face-centered cubic (FCC) lattice structure, and the lattice parameters are a   ˙   = 3.54, b   ˙ = 3.54 and c ˙   = 3.54. The samples obtained by testing are face-centered cubic (FCC) lattice structures. The crystallite size of the FeNi3 alloy was calculated by Debye–Scherer’s formula [29]:
D m = K λ / δ 2 θ cos θ  
where λ represents the wavelength of X-rays, δ 2 θ represents the full width at half maximum of the diffraction peak in the XRD pattern, θ represents the Bragg scattering angle. K is the Scheele constant, and Dm is the grain thickness perpendicular to the grain plane. The Schieler constant is usually calculated between 0.98 and 1.3, but for crystals with cube, sphere, tetrahedral, and octahedral shapes, the calculated value of 0.89 is sufficient to achieve a good fit. Since the samples prepared in this paper are spherical particles, the Schieler constant is set at 0.89. The three strong diffraction peaks in the XRD results are calculated, and the grain size of the FeNi3 alloy submicron spheres is about 96 nm [29].
The porosity test result of the FeNi3 alloy sample is shown in Figure 1b. As can be seen, most of the voids are distributed in the range of 10–20 nm. At the same time, the density of the FeNi3 alloy was prepared by the density tester (G-DenPyc 2900 true, China) with the gas displacement method at 25 °C. The results of the three measurement times show that the density of the prepared sample was 5.84 (g/mL).
The SEM images of the FeNi3 composites are shown in Figure 2a,b. By looking at the SEM images, it can be seen that most of the particles appear spherical with well-defined particles. The size of the particle spheres is relatively uniform, with most of them having diameters between 90–100 nm, which corresponds to the XRD results. The surfaces of the granular spheres have rough surfaces with polyhedral edges and corners, and a small number of particles exhibit overlapping lamellar structures, which may be caused by the overlap between particles.
The TEM image of the FeNi3 alloy is shown in Figure 3a. The TEM results showed that the prepared FeNi3 samples were also spherical nanoparticles with a size of about 100 nm, which was consistent with the SEM results. The elemental mapping and EDX spectral images of FeNi3 alloy are shown in Figure 3b and Figure 4, respectively. It can be seen from the EDX that the Fe and Ni elements in the prepared FeNi3 sample are evenly distributed, and the content of Ni is more than that of Fe. Meanwhile, the ICP results show that the mass fraction of Fe and Ni in the sample is 23.15% and 71.03%, respectively, with a ratio of nearly 1:3, which proves that the sample prepared by us is indeed FeNi3 alloy.
The relative complex permittivity and complex permeability of FeNi3 alloy with filling ratios of 30–70 wt% were measured in the range of 2–18 GHz (Figure 5a,b). It can be seen that the values of the real and imaginary parts of the relative complex permittivity increase as the filling ratios increase from 30 wt% to 70 wt%. It is known that ε” usually represents the storage capacity of electromagnetic wave energy, and ε″ represents the loss capacity of electromagnetic wave energy [11]. The results show that the FeNi3 alloy with a filling ratio of 70 wt% has higher ε′ and ε″ than other ratios; thus, the FeNi3 alloy with a filling ratio of 70 wt% has better electromagnetic energy storage and loss capacity. It can be explained by the free electron theory [30]. As the mass ratio increases, the ε″ of the FeNi3 alloy composites increases due to the better electrical conductivity of FeNi3 alloys. When the filling ratio increases, the composites have higher electrical conductivity, so the ε″ improves as the filling ratio of FeNi3 alloy increases [26]. The dielectric loss in the FeNi3 alloy sample resulted from the imaginary part of the permittivity, which is also inseparable from the interfacial polarization phenomenon brought by spherical morphology [28].
Figure 6a,b and Figure S1a–c represent the Cole–Cole curves for FeNi3 alloys with different filling ratios. It can be seen that there are semicircular curves, and these semicircles indicate the presence of interfacial polarization in the FeNi3 alloy samples. Figure 5c,d show the curves of the real and imaginary parts of the FeNi3 alloy mixed with paraffin wax with different filling ratios. It can be seen that the real part of the magnetic permeability of all the samples shows a decreasing trend with increasing frequency. The decrease in the complex permeability is due to the dispersion effect; the real part of the permeability will be reduced with the increase of frequency, and the peaks near 5–6 GHz are caused by the natural resonance of the material itself. Meanwhile, the imaginary part of the magnetic permeability in Figure 5d shows a smaller resonance peak, which is favorable for microwave absorption.
The main factors that cause magnetic loss are eddy current, natural resonance and exchange resonance [31]. In the low-frequency range, the magnetic loss thus results from natural resonance. In Figure 4c, it can be demonstrated how the natural resonance occurred at 6 GHz nearby. In addition, the eddy current loss exists at a lower frequency. The C 0 curves can be used to judge whether the main factor of the dominant magnetic loss is eddy current loss and the C 0 curve has been shown in the following calculation formula:
C 0 = μ μ 2 f 1
when the C0 curve is in the range of 2–18 GHz, if the eddy current losses inside the material dominate the magnetic losses, the curve should behave as a constant without fluctuations and not change with frequency. Figure 6c,d show the C0 curves for the FeNi3 alloy powders with fillings of 60 wt% and 70 wt%. The values of the C0 curve change somewhat with frequency range; therefore, it can be demonstrated that the magnetic losses in the composite are not dominated by eddy current losses but mainly resonance losses. The hysteresis lines for the FeNi3 alloy are shown in Figure 7. The hysteresis lines show that the saturation magnetization strength of the FeNi3 alloy is 40.13 emu/g, and the coercivity is 111 Oe. It also provides a basis for the magnetic loss capability of the FeNi3 alloy material itself.
The reflection loss values of the FeNi3 samples are obtained by calculation and simulation of the electromagnetic parameters, and the reflection loss clearly reflects the strength of a material’s microwave absorption capacity. According to transmission line theory, the values of reflection loss can be calculated from the following formulas [32]:
Z in = Z 0 μ r / ε r 1 / 2 tan h j 2 π fd / c μ r ε r 1 / 2
RL = 20 log | Z in Z 0 / Z in + Z 0 |
where Z 0 is the free space impedance, Z in is the input impedance, f is the frequency of the microwave, c is the speed of light in free space, d is the matching thickness of the absorber, ε r is the complex dielectric constant, and μ r is the complex permeability.
Figure 8 and Figure S2 show the correlation between the 3D plots of frequency and reflection loss to match the thickness for the ring samples with different FeNi3 alloy filling ratios. It can be seen that the microwave absorption performance of the FeNi3 sample increases with the gradual increase of the filling ratio of the FeNi3 alloy. It can be concluded that when the filling ratio of FeNi3 alloy is 30 wt%, the reflection loss of the sample does not reach −10 dB in the full waveband. When the filling ratio of FeNi3 alloy is 40 wt%, the minimum reflection loss absorption of −5.45 dB can be obtained when the frequency is at 7.22 GHz and the matched thickness of the sample reaches 5 mm. When the FeNi3 alloy fills with 50 wt%, a minimum reflection loss absorption peak of −9.70 dB is obtained when the frequency is 12.16 GHz with a thickness of 2.9 mm. The minimum reflection loss absorption peak of −15.35 dB is obtained when the FeNi3 alloy filling ratio is 60 wt%, the frequency is 13.60 GHz, and the matching thickness is 2.5 mm. The FeNi3 alloy sample with a 70 wt% filling ratio exhibits the best microwave absorption capability. When the frequency reaches 11.88 GHz, the minimum value of the absorbing material is −40.33 dB, with a strong reflection loss intensity when the matched thickness of the sample is 2.35 mm.
Figure 9a,c show the frequency range (RL < −10 dB) of the FeNi3 samples with 60 wt% and 70 wt% filling ratios when the matching thickness is 2–3 mm. Figure 9b,d show the effective absorption bandwidth for the FeNi3 samples with filling ratios of 60 wt% and 70 wt%, respectively. It can be seen that the maximum absorption bandwidth of the FeNi3 alloy with a 70 wt% filling ratio can reach 6.26 GHz when the matching thickness is varied, while the sample with a 60 wt% filling ratio can reach, at most, 4.08 GHz. When the matching thickness of a sample with a 70 wt% filling ratio is between 2 and 3 mm (Figure 8a), the frequency range of RL < −10 dB is 7.21 to 17.81 GHz. It has a very wide frequency range, covering almost the entire X and Ku bands (8–18 GHz). The frequency range of RL < −10 dB for the 60wt% filled sample is only 9.56 to 15.43 GHz. Therefore, the FeNi3 alloy sample with a 70 wt% filling ratio has a larger absorption bandwidth than the other samples.
The main factor affecting the absorption performance is the electromagnetic energy loss capacity of the FeNi3 alloy. Figure 10 shows the dielectric loss tangent (tan δε = ε″/ε′) and magnetic loss tangent (tan δμ = μ″/μ′) for the FeNi3 samples with different filling ratios. It can be seen that the dielectric loss tangent of the sample increases as the filling ratio increases in Figure 10a. When the filling ratio is greater than or equal to 50 wt%, the dielectric loss tangent first remains constant as the frequency increases, and then a resonance peak appears after 10 GHz, where the polarization phenomenon occurs to increase the dielectric loss capability. Figure 10b shows that the magnetic loss tangent of the samples with different filling ratios show a fluctuating decreasing trend with increasing frequency, and resonance peaks also appear at individual locations. As the filling ratios of FeNi3 alloy increase, the magnetic loss tangent also increases. Therefore, the synergistic effect of dielectric loss and magnetic loss makes the FeNi3 alloy with a filling ratio of 70 wt% have better microwave absorption performance.
In addition, the other two key factors that determine the microwave absorption capacity are the electromagnetic attenuation ability of the absorber itself and the impedance matching ability [33]. The attenuation constant α determines the attenuation characteristics of the materials, which is presented in the following calculation [34]:
α = 2 π f c × μ ε μ ε + μ ε μ ε 2 + μ ε + μ ε 2
where c represents the speed of light, and f represents the frequency. Figure 11a shows the curves of the attenuation constant α of the FeNi3 samples with different proportions. When the FeNi3 filling ratio increases, the attenuation constant α also increases. At the same time, they all show an increasing trend with the increase in frequency, indicating the attenuation ability of electromagnetic waves is gradually enhanced. Moreover, the relative input impedance Z of the FeNi3 sample has been exhibited in the following calculation [35]:
Z = Z in / Z 0
Figure 11b shows the relative input impedance Z of the FeNi3 samples with different mass ratios, which gradually decreases with the increase of FeNi3 alloy filling ratios. It can be seen that the relative input impedance of the FeNi3 alloy with a mass ratio of 70 wt% is closer to 1, which implies a better impedance matching condition. Therefore, the FeNi3 alloy with a filling ratio of 70 wt% has better microwave absorption properties.
Generally, for absorbing materials, if the thickness of the test sample is an odd time of one-quarter of the wavelength of the incident electromagnetic wave, when the phase angle of the incident electromagnetic wave and reflected electromagnetic wave differs by 180°, part of the energy of the incident electromagnetic wave will be lost, which the quarter-wavelength model can explain. This model has also proven to be suitable for the case where plane waves normally incident on an absorber on a perfect conductor substrate. The thickness that corresponds to the peak frequency of the sample can satisfy the following formula [36,37,38]:
t m = nc / ( 4 f m ε r μ r 1 / 2 )   ( n = 1 , 3 , 5 )
where c stands for the velocity of light in free space. In order to determine the maximum RL value that appears at a thickness of 2.35 mm, we performed a simulation of tm under λ/4 occasions for the FeNi3 alloy (Figure 12). The quarter-wavelength rule is a vital dissipation element in the thickness design of the absorbent. Blue dots stand for the experimental matching thickness at fm, and the blue curve is the simulation thickness using the quarter-wavelength rules. The results show that when the experimental matching thickness is 1.0 mm rather than 2.35 mm, the reflection loss ability is strong and is inconsistent with the simulated thickness. Therefore, the polarization peaks come from the material itself rather than the quarter wavelength. The same phenomenon exists for samples with other filling ratios.
Figure 13 shows the mechanism of the electromagnetic wave absorption properties of the FeNi3 alloy sample. When the electromagnetic wave is incoming, the microwave absorption ring is a whole, in which there are many nanospheres made up. When the wave is incident on the ring, the interaction of many nanospheres causes the wave conduction loss as a whole. When electromagnetic waves propagate between the alloy nanospheres, the accumulation of nanospheres increases the degree of interfacial polarization, which enhances electromagnetic wave absorption. In addition, there is a magnetic loss and dielectric loss to improve microwave absorption.

4. Conclusions

In summary, the FeNi3 alloy was prepared by the liquid phase reduction method in this study. By controlling the filling ratio of FeNi3 alloy in the composites, the influence of the filling ratio on its microwave absorption performance was studied. The results show that the prepared FeNi3 alloys have a spherical morphology, and the particle size is uniform. The permittivity and permeability of the FeNi3 alloys increased dramatically with the enhanced filling ratios. The dielectric loss and magnetic loss of the FeNi3 composite are higher. In addition, the impedance matching is also adjusted with the increase of the filling ratios. Thus, the filling ratio has a certain regulation effect on the microwave absorption performance of FeNi3 alloy. Finally, the FeNi3 alloy composites showed the best microwave absorption characteristics when the filling ratio was 70 wt%, the absorption performance RL was −40.33 dB at 11.8 GHz, and the effective absorption bandwidth was 5.5 GHz. When the matching thickness was 2~3 mm, the effective absorption bandwidth was 10.2 GHz with a frequency range of 7.2~17.8 GHz. Therefore, the electromagnetic properties of the FeNi3 alloy can be adjusted by adjusting the filling ratios, obtaining better impedance matching. This is a candidate way to adjust the absorption performance.

Supplementary Materials

The following supporting information can be downloaded at: https://www.mdpi.com/article/10.3390/nano13050930/s1, Figure S1: Cole–Cole curves of FeNi3 alloys with 40 wt% and 30 wt% mass ratios, Figure S2: RL values with a 30 wt% mass ratio of FeNi3 alloy. Figure S3: Comparison of various absorbent thicknesses (tm) at the frequency for FeNi3 alloys with 60 wt% mass ratios sample in λ/4 conditions of maximum RL values (fm); Figure S4: Comparison of various absorbent thicknesses (tm) at the frequency for FeNi3 alloys with 50 wt% mass ratios sample in λ/4 conditions of maximum RL values (fm); Figure S5: Comparison of various absorbent thicknesses (tm) at the frequency for FeNi3 alloys with 40 wt% mass ratios sample in λ/4 conditions of maximum RL values (fm); Figure S6: Comparison of various absorbent thicknesses (tm) at the frequency for FeNi3 alloys with 30 wt% mass ratios sample in λ/4 conditions of maximum RL values (fm).

Author Contributions

Conceptualization, Y.Z. and X.L.; Data curation, Y.Z.; Formal analysis, Y.Z. and M.W.; Investigation, Y.Z., Y.J., C.Q. and X.L.; Supervision, X.L.; Validation, X.L.; Visualization, Y.Z.; Writing—original draft, Y.Z.; Writing—review and editing, X.L. and W.X. All authors have read and agreed to the published version of the manuscript.

Funding

This work was supported by the Zhejiang Provincial Natural Science Foundation of China (Grant No. LQ22E010004), the National Natural Science Foundation of China (Grant No. 52101218), the Fundamental Research Funds for the Provincial Universities of Zhejiang (Grant No. GK219909299001-009) and the National Key R&D Program of China (Grant No. 2021YFA1600203).

Data Availability Statement

Data supporting this study’s findings are available from the corresponding authors upon reasonable request.

Acknowledgments

Thanks to everyone who helped with this work.

Conflicts of Interest

The authors declare no conflict of interest.

References

  1. Bai, H.; Yin, P.; Lu, X.; Zhang, L.; Wu, W.; Feng, X.; Wang, J.; Dai, J. Recent advances of magnetism-based microwave absorbing composites: An insight from perspective of typical morphologies. J. Mater. Sci.-Mater. El. 2020, 32, 1. [Google Scholar] [CrossRef]
  2. Bao, W.; Chen, C.; Si, Z. An easy method of synthesis CoxOy@C composite with enhanced microwave absorption performance. Nanomaterials 2020, 10, 902. [Google Scholar] [CrossRef] [PubMed]
  3. Bora, P.J.; Suresh Kumar, T.R.; Tan, D.Q. Enhancement of microwave absorption bandwidth of MXene nanocomposites through macroscopic design. R. Soc. Open. Sci. 2020, 7, 200456. [Google Scholar] [CrossRef] [PubMed]
  4. Breiss, H.; Assal, A.; Benzerga, R.; Sharaiha, A. Long carbon fibers for microwave absorption: Effect of fiber length on absorption frequency band. Micromachines 2020, 11, 1081. [Google Scholar] [CrossRef]
  5. Deng, B.; Liu, Z.; Pan, F.; Xiang, Z.; Zhang, X.; Lu, W. Electrostatically self-assembled two-dimensional magnetized MXene/Hollow Fe3O4 nanoparticle hybrids with high electromagnetic absorption performance and improved impendence matching. J. Mater. Chem. A 2021, 9, 3500–3510. [Google Scholar] [CrossRef]
  6. Almasi-Kashi, M.; Mokarian, M.H.; Alikhanzadeh-Arani, S. Improvement of the microwave absorption properties in FeNi/PANI nanocomposites fabricated with different structures. J. Alloys Compd. 2018, 742, 413–420. [Google Scholar] [CrossRef]
  7. Liu, H.; Li, L.; Wang, X.; Cui, G.; Lv, X. Superior microwave absorption properties derived from the unique 3D porous heterogeneous structure of a CoS@Fe3O4@RGO aerogel. Materials 2020, 13, 4527. [Google Scholar] [CrossRef]
  8. Liang, X.; Liu, W.; Cheng, Y.; Lv, J.; Dai, S.; Tang, D.; Zhang, B.; Ji, G. Recent process in the design of carbon-based nanostructures with optimized electromagnetic properties. J. Alloys Compd. 2018, 749, 887–899. [Google Scholar] [CrossRef]
  9. Ma, M.; Li, W.; Tong, Z.; Ma, Y.; Bi, Y.; Liao, Z.; Zhou, J.; Wu, G.; Li, M.; Yue, J.; et al. NiCo2O4 nanosheets decorated on one-dimensional ZnFe2O4@SiO2@C nanochains with high-performance microwave absorption. J. Colloid Interface. Sci. 2020, 578, 58–68. [Google Scholar] [CrossRef]
  10. Green, M.; Chen, X. Recent progress of nanomaterials for microwave absorption. J. Mater. 2019, 5, 503–541. [Google Scholar] [CrossRef]
  11. Liang, X.; Quan, B.; Sun, B.; Man, Z.; Xu, X.; Ji, G. Extended effective frequency of three-dimensional graphene with sustainable energy attenuation. ACS Sustain. Chem. Eng. 2019, 7, 10477. [Google Scholar] [CrossRef]
  12. Jinxiao, W.; Jianfeng, Y.; Jun, Y.; Hui, Z. Design of Novel CNT/RGO/ZIF-8 Ternary Hybrid Structure for Lightweight and Highly Effective Microwave Absorption. Nanotechnology 2020, 31, 414001. [Google Scholar] [CrossRef]
  13. Ding, X.; Huang, Y.; Li, S.; Zhang, N.; Wang, J. FeNi3 nanoalloy decorated on 3D architecture composite of reduced graphene oxide/molybdenum disulfide giving excellent electromagnetic wave absorption properties. J. Alloys Compd. 2016, 689, 208–217. [Google Scholar] [CrossRef]
  14. Kuchi, R.; Nguyen, H.; Dongquoc, V.; Van, P.; Ahn, H.; Duong, V.; Kim, D.; Kim, D.; Jeong, J. Optimization of FeNi/SWCNT composites by a simple Co-Arc discharge process to improve microwave absorption performance. J. Alloys Compd. 2021, 852, 156712. [Google Scholar] [CrossRef]
  15. Du, Z.; Chen, X.; Zhang, Y. One-pot hydrothermal preparation of Fe3O4 decorated graphene for microwave absorption. Materials 2020, 13, 3065. [Google Scholar] [CrossRef]
  16. Petrov, V.M. Microwave absorbing materials inorganic materials. Inorg. Mater. 2001, 37, 93. [Google Scholar] [CrossRef]
  17. Yang, Y.; Xu, C.; Xia, Y.; Wang, T.; Li, F. Synthesis and microwave absorption properties of FeCo nanoplates. J. Alloys Compd. 2010, 493, 549–552. [Google Scholar] [CrossRef]
  18. Liu, J.; Feng, Y.; Qiu, T. Synthesis characterization and microwave absorption properties of Fe–40 wt% Ni alloy prepared by mechanical alloying and annealing. J. Magn. Mater. 2011, 323, 3071–3076. [Google Scholar] [CrossRef]
  19. Chen, Y.; Chen, Y.; Zheng, F.; Min, Y.; Wang, T.; Zhao, Y. Synthesis and properties of magnetic FeNi3 alloyed microchains obtained by hydrothermal reduction. Solid State Sci. 2012, 14, 809–813. [Google Scholar] [CrossRef]
  20. Feng, Y.; Qiu, T. Preparation characterization and microwave absorbing properties of FeNi alloy prepared by gas atomization method. J. Alloys Compd. 2012, 513, 455–459. [Google Scholar] [CrossRef]
  21. Li, G.; Guo, Y.; Sun, X.; Wang, T.; Zhou, J.; He, J. Synthesis and microwave absorbing properties of FeNi alloy incorporated ordered mesoporous carbon–silica nanocomposite. J. Phys. Chem. Solids 2012, 73, 1268–1273. [Google Scholar] [CrossRef]
  22. Liu, W.; Zhong, W.; Jiang, H.; Tang, N.; Wu, X.; Du, W. Synthesis and magnetic properties of FeNi3/Al2O3 core-shell nanocomposites. Eur. Phys. J. B 2005, 46, 471–474. [Google Scholar] [CrossRef]
  23. Lu, X.; Liang, G.; Sun, Q.; Yang, C. High-frequency magnetic properties of FeNi3–SiO2 nanocomposite synthesized by a facile chemical method. J. Alloys Compd. 2011, 509, 5079–5083. [Google Scholar] [CrossRef]
  24. Ma, T.; Yuan, M.; Islam, S.; Li, H.; Ma, S.; Sun, G.; Yang, X. FeNi3 alloy nanocrystals grown on graphene: Controllable synthesis, in-depth characterization and enhanced electromagnetic performance. J. Alloys Compd. 2016, 678, 468–477. [Google Scholar] [CrossRef]
  25. Nirouei, M.; Jafari, A.; Boustani, K. Magnetic and structural study of FeNi3 nanoparticles: Effect of calcination temperature. J. Supercond. Nov. Magn. 2014, 27, 2803–2811. [Google Scholar] [CrossRef]
  26. Shi, C.; Su, Y.; Luo, Z.; Zhang, J.; Zhang, H. Microwave absorption properties of spheres-assembled flake-like FeNi3 particles prepared by electrodeposition. J. Alloys Compd. 2021, 859, 157835. [Google Scholar] [CrossRef]
  27. Yao, Y.; Zhang, C.; Fan, Y.; Zhan, J. Preparation and microwave absorbing property of porous FeNi powders. Adv. Powder Technol. 2016, 27, 2285–2290. [Google Scholar] [CrossRef]
  28. Yan, S.J.; Zhen, L.; Xu, C.; Jiang, J.; Shao, W. Microwave absorption properties of FeNi3 submicrometre spheres and SiO2@FeNi3 core–shell structures. J. Phys. D Appl. Phys. 2010, 43, 245003. [Google Scholar] [CrossRef]
  29. Muniz, F.T.L.; Miranda, M.R.; Morilla dos Santos, C.; Sasaki, J.M. The Scherrer equation and the dynamical theory of X-ray diffraction. Acta Crystallogr. Sect. A Found. Adv. 2016, 72, 385–390. [Google Scholar] [CrossRef]
  30. Liang, X.; Quan, B.; Ji, G.; Liu, W.; Zhao, H.; Dai, S.; Lv, J.; Du, Y. Tunable dielectric performance derived from the metal–organic framework/reduced graphene oxide hybrid with broadband absorption. ACS Sustain. Chem. Eng. 2017, 5, 10570–10579. [Google Scholar] [CrossRef]
  31. Liang, X.; Quan, B.; Ji, G.; Sun, Y.; Zhang, Y.; Ma, J.; Li, D.; Zhang, B.; Du, Y. Multiple interfaces structure derived from metal-organic frameworks for excellent electromagnetic wave absorption. Part. Part. Syst. Char. 2017, 34, 1700006. [Google Scholar] [CrossRef]
  32. Ebrahimi, S.A.S.; Khanmohammadi, H.; Masoudpanah, S.M. Effects of high-energy ball milling on the microwave absorption properties of Sr0.9Nd0.1Fe12O19. J. Supercond. Novel Magn. 2015, 28, 2715–2720. [Google Scholar] [CrossRef]
  33. Liang, X.; Zhang, X.; Liu, W.; Tang, D.; Zhang, B.; Ji, G. A simple hydrothermal process to grow MoS2 nanosheets with excellent dielectric loss and microwave absorption performance. J. Mater. Chem. C 2016, 4, 6816–6821. [Google Scholar] [CrossRef]
  34. Guan, G.; Gao, G.; Xiang, J.; Yang, J.; Li, X.; Zhang, K. A novel three-dimensional Fe3SnC/C hybrid nanofiber absorber for lightweight and highly-efficient microwave absorption. Phys. Chem. Chem. Phys. 2020, 22, 26104–26108. [Google Scholar] [CrossRef]
  35. Liang, X.; Quan, B.; Chen, J.; Gu, W.; Zhang, B.; Ji, G. Nano bimetallic@ carbon layer on porous carbon nanofibers with multiple interfaces for microwave absorption applications. ACS Appl. Nano Mater. 2018, 1, 5712–5721. [Google Scholar] [CrossRef]
  36. Zhu, L.; Zeng, X.; Chen, M. Controllable permittivity in 3D Fe3O4/CNTs network for remarkable microwave absorption performances. RSC Adv. 2017, 7, 26801–26808. [Google Scholar] [CrossRef] [Green Version]
  37. Zhang, S.; Wang, T.; Gao, M. Strict proof and applicable range of the quarter-wavelength model for microwave absorbers. J. Phys. D Appl. Phys. 2020, 53, 265004. [Google Scholar] [CrossRef]
  38. Jackson, J. Classical Electrodynamics, 2nd ed.; John Wiley & Sons Inc.: New York, NY, USA, 1975. [Google Scholar]
Scheme 1. The reaction process diagram of preparing FeNi3 alloys.
Nanomaterials 13 00930 sch001
Figure 1. XRD diffraction (a) and porosity test results (b) of FeNi3 alloy sample.
Nanomaterials 13 00930 g001
Figure 2. (a) Low magnification and (b) high magnification SEM images of FeNi3 alloy.
Nanomaterials 13 00930 g002
Figure 3. TEM image (a) and elemental mapping image (b) of FeNi3 alloy.
Nanomaterials 13 00930 g003
Figure 4. EDX image of FeNi3 alloy.
Nanomaterials 13 00930 g004
Figure 5. (a) The real and (b) imaginary parts of the complex permittivity; (c) the real and (d) imaginary parts of the complex permeability of FeNi3 samples with different filling ratios.
Nanomaterials 13 00930 g005
Figure 6. Cole–Cole curve of (a) 60 wt%, (b) 70 wt% FeNi3 alloy mass ratio sample, C0 curves of (c) 60 wt%, (d) 70 wt% FeNi3 alloy filling ratios sample.
Nanomaterials 13 00930 g006
Figure 7. Hysteresis line diagram of FeNi3 alloy.
Nanomaterials 13 00930 g007
Figure 8. The RL vs. frequency diagram with (a) 40 wt%, (b) 50 wt%, (c) 60 wt%, and (d) 70 wt% FeNi3 alloy filling ratios.
Nanomaterials 13 00930 g008
Figure 9. (a) Frequency absorption range and (b) effective absorption bandwidth of FeNi3 sample with 70 wt% filling ratio; (c) frequency absorption range and (d) effective absorption bandwidth of FeNi3 sample with 60 wt% filling ratio.
Nanomaterials 13 00930 g009
Figure 10. (a) The tan δε and (b) tan δμ of FeNi3 alloy with different filling ratios.
Nanomaterials 13 00930 g010
Figure 11. (a) Attenuation constant and (b) relative input impedance of FeNi3 alloy sample with 30–70 wt% filling ratios.
Nanomaterials 13 00930 g011
Figure 12. Comparison of various absorbent thicknesses (tm) at the frequency for FeNi3 alloys with 70 wt% mass ratio sample in λ/4 conditions of maximum RL values (fm).
Nanomaterials 13 00930 g012
Figure 13. The mechanism of the electromagnetic wave absorption performance of (a) the testing ample ring, (b) the FeNi3 alloy sample.
Nanomaterials 13 00930 g013
Disclaimer/Publisher’s Note: The statements, opinions and data contained in all publications are solely those of the individual author(s) and contributor(s) and not of MDPI and/or the editor(s). MDPI and/or the editor(s) disclaim responsibility for any injury to people or property resulting from any ideas, methods, instructions or products referred to in the content.

